
European Economic Forecast Spring 2016
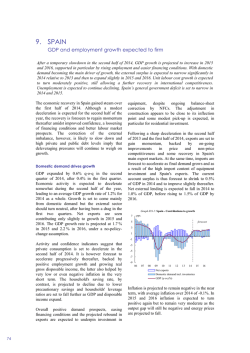
9. SPAIN
Growth to ease but remain robust
Economic growth is set to continue easing but to remain robust, underpinned by sustained job creation
and declining unemployment, improved financing conditions and low oil prices. Inflation is expected to
remain negative in the short term due to falling energy prices. The general government deficit is
expected to narrow, mainly thanks to the economic recovery.
Robust expansion set to continue
Economic growth remained robust in the fourth
quarter of 2015 at 0.8% quarter-on-quarter, which
led the economy to expand by 3.2% in the year as
a whole, driven by domestic demand. GDP growth
in the first quarter of 2016 was likely slightly
slower at around 0.7%. Growth appears to be
losing some momentum as reflected by the
Economic Sentiment Indicator (ESI) but it is set to
maintain a robust pace over the forecast horizon on
the back of positive labour market developments,
improved access to credit for firms and
households, and low oil prices. The drag on
domestic demand from private sector deleveraging
is expected to fade out. Accordingly, Spain’s
economy is forecast to grow by 2.6% and 2.5% in
2016 and 2017, respectively.
negative for growth in 2016, before turning
broadly neutral in 2017. The current account
surplus is forecast to widen slightly further to 1.5%
of GDP in 2016 and to narrow thereafter, to 1.3%
of GDP in 2017, due to the deterioration of the
terms of trade. Net external lending is expected to
remain above 2% of GDP throughout the forecast
horizon.
2.0
Graph II.9.1: Spain - GDP growth and Economic
Sentiment Indicator (ESI)
q-o-q%
balance
120
115
1.5
110
1.0
105
0.5
100
0.0
95
-0.5
90
85
-1.0
Although private consumption is expected to
decelerate throughout 2016, it is set to remain the
main growth driver over the forecast horizon,
supported by low inflation and steadily improving
labour market conditions. The increase in gross
disposable income is expected to allow households
to increase their savings rate in 2016 and 2017,
albeit only slightly.
Although displaying a decelerating profile over the
year, equipment investment is also forecast to
maintain healthy growth rates over the forecast
horizon, underpinned by positive demand
prospects, supportive financing conditions and a
projected rebound in exports in 2017. Construction
investment is forecast to lose momentum in 2016
but to accelerate in 2017. The expected
deceleration in 2016 would be explained by nonresidential
construction,
especially
public
investment. Residential investment looks set to
gather strength steadily.
Export growth is expected to slow down in 2016,
especially for goods, due to the projected
weakening of Spain’s main export markets. While
imports are forecast to decelerate in line with final
demand, they are expected to continue to outpace
exports. As a result, net exports are set to prove
82
80
-1.5
75
-2.0
70
07
08
09
10
11
12
Real GDP (lhs)
13
14
15
16
ESI (rhs)
The fall in oil and energy prices are expected to
keep dominating inflation developments in the
short term. Hence, headline inflation is forecast at
−0.1% in 2016, whereas core inflation is expected
to remain positive though moderate over the
forecast horizon, due to low external price
pressures and remaining slack in the economy. In
2017, headline inflation is forecast to return to
positive territory.
Employment growth keeps moderating
Job creation decelerated moderately in the first
quarter of 2016. While this trend is expected to
continue over the forecast period, employment is
still projected to record high growth rates, above
2% over the forecast horizon. Despite expected
moderate wage dynamics, unit labour costs are
forecast to increase on the back of low productivity
increases. In turn, the unemployment rate, which
amounted to 20.9% of the labour force in the last
Member States, Spain
quarter of 2015, is expected to continue falling to
some 18% by 2017.
The amount of fiscal policy measures needed to
correct the budgetary slippage registered in 2015
add to the downside risks to the growth forecast
stemming mainly from the uncertainty surrounding
the formation of the new government.
Deficit reduction driven by the recovery
Driven by strong economic growth, Spain’s
general government deficit continued to decline in
2015. The full-year deficit narrowed from 5.9% of
GDP in 2014 to 5.1% in 2015. Despite cuts in
personal income taxes, total tax revenues held up
well, helped by a strong recovery in domestic
demand and corporate tax revenues. Government
expenditure picked up in the second half of the
year, with notable increases in compensation of
employees and public investment. About 0.3% of
GDP of the full-year deficit stems from one-off
factors that are not expected to spill over to 2016
(0.2 pps. due to a reclassification of assets of
public-private-partnerships on the government’s
balance sheet and 0.1 pps. due to support to the
financial sector). Spain’s general government
deficit is expected to narrow to 3.9% of GDP in
2016 and is projected to reach 3.1% of GDP in
2017. The reduction of the deficit relies to a large
extent on the positive macroeconomic outlook,
which is expected to continue supporting tax
revenues and keeping social transfers in check. In
particular, while pension expenditure is expected
to continue rising, falling unemployment should
reduce the growth of social transfers in the near
future. Previous improvements in financing
conditions and the decelerating public debt ratio
imply that interest expenditure is likely to continue
to fall. Finally, the forecast assumes savings of
about 0.3% of GDP in 2016 from the recently
announced measures aimed at reining in spending
at central and regional government level. These
savings, part of which is assumed to decrease
expenditure also in 2017, are subject to
implementation risks, as they require active
involvement by different tiers of government and
strict enforcement.
After deteriorating significantly in 2015, Spain’s
structural deficit is expected to increase further by
around ¼ pps. over the forecast period, to 3¼% of
GDP in 2017. Thanks to a narrowing deficit and
relatively strong nominal GDP growth, the public
debt ratio is expected to peak in 2016 at 100.3% of
GDP before falling back to 99.6% in 2017.
Table II.9.1:
Main features of country forecast - SPAIN
2014
bn EUR
GDP
Private Consumption
Public Consumption
Gross fixed capital formation
of which: equipment
Exports (goods and services)
Imports (goods and services)
GNI (GDP deflator)
Contribution to GDP growth:
Annual percentage change
Curr. prices
% GDP
96-11
2012
2013
2014
2015
2016
2017
1041.2
100.0
2.6
-2.6
-1.7
1.4
3.2
2.6
2.5
606.8
58.3
2.3
-3.5
-3.1
1.2
3.1
3.0
2.3
202.4
19.4
3.9
-4.5
-2.8
0.0
2.7
1.0
1.0
204.1
19.6
2.5
-7.1
-2.5
3.5
6.4
4.7
5.0
66.6
6.4
3.9
-8.5
4.0
10.6
10.2
7.7
6.5
338.8
32.5
5.1
1.1
4.3
5.1
5.4
4.5
5.2
312.9
30.1
5.1
-6.2
-0.3
6.4
7.5
5.8
5.8
1036.9
99.6
2.5
-1.6
-1.4
1.4
3.6
2.6
2.5
2.7
-4.5
-2.8
1.3
3.6
2.9
2.6
0.0
-0.3
-0.2
0.2
0.1
0.0
0.0
-0.1
2.1
1.4
-0.2
-0.5
-0.3
-0.1
Domestic demand
Inventories
Net exports
Employment
Unemployment rate (a)
Compensation of employees / f.t.e.
Unit labour costs whole economy
Real unit labour cost
Saving rate of households (b)
GDP deflator
Harmonised index of consumer prices
Terms of trade goods
Trade balance (goods) (c)
Current-account balance (c)
Net lending (+) or borrowing (-) vis-a-vis ROW (c)
General government balance (c)
Cyclically-adjusted budget balance (d)
Structural budget balance (d)
General government gross debt (c)
1.7
-4.9
-3.5
1.1
3.0
2.5
2.0
13.8
24.8
26.1
24.5
22.1
20.0
18.1
3.3
-0.6
1.7
-0.6
0.5
0.8
1.0
2.5
-2.9
-0.2
-0.8
0.3
0.7
0.6
-0.3
-3.0
-0.8
-0.4
-0.3
-0.2
-0.8
10.6
8.8
10.0
9.6
9.4
9.5
9.6
2.8
0.0
0.6
-0.4
0.6
0.9
1.4
2.8
2.4
1.5
-0.2
-0.6
-0.1
1.4
-0.1
-1.1
0.9
-1.0
3.2
2.1
-0.2
-5.5
-2.8
-1.4
-2.2
-2.0
-1.9
-2.4
-4.6
-0.4
1.5
1.0
1.4
1.5
1.3
-3.9
0.1
2.2
1.6
2.1
2.3
2.1
-2.8
-10.4
-6.9
-5.9
-5.1
-3.9
-3.1
-3.0
-6.4
-2.4
-2.3 -
-3.1
-3.1
-3.2
-
-3.4
-2.0
-1.9 -
-2.9
-3.1
-3.2
53.0
85.4
93.7
99.3
99.2
100.3
99.6
(a) as % of total labour force. (b) gross saving divided by gross disposable income. (c) as a % of GDP. (d) as a % of potential GDP.
83


© Copyright 2026