
Format PDF - World Trade Organization
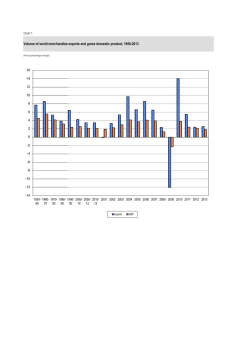
Chart 2
Volume of world merchandise trade by selected region, 2005-2013
(Annual percentage change)
Exports
Imports
North America
30
25
20
15
10
5
0
-5
-10
-15
-20
-25
-30
I
I
I
I
South and Central America
I
I
I
2005 2006 2007 2008 2009 2010 2011 2012 2013
30
25
20
15
10
5
0
-5
-10
-15
-20
-25
-30
Commonwealth of Independent States (CIS)
Europe
30
25
20
15
10
5
0
-5
-10
-15
-20
-25
-30
I
I
I
I
I
I
I
30
25
20
15
10
5
0
-5
-10
-15
-20
-25
-30
2005 2006 2007 2008 2009 2010 2011 2012 2013
Asia
30
25
20
15
10
5
0
-5
-10
-15
-20
-25
-30
I
I
I
I
I
I
I
I
I
I
I
2005 2006 2007 2008 2009 2010 2011 2012 2013
I
I
I
I
I
I
I
2005 2006 2007 2008 2009 2010 2011 2012 2013
World
I
I
I
2005 2006 2007 2008 2009 2010 2011 2012 2013
30
25
20
15
10
5
0
-5
-10
-15
-20
-25
-30
I
I
I
I
I
I
I
2005 2006 2007 2008 2009 2010 2011 2012 2013
Graphique 2
Volume du commerce mondial des marchandises de certaines régions, 2005-2013
(Variation annuelle en pourcentage)
Exportations
Importations
Amérique du Nord
30
25
20
15
10
5
0
-5
-10
-15
-20
-25
-30
I
I
I
I
I
Amérique du Sud et centrale
I
I
30
25
20
15
10
5
0
-5
-10
-15
-20
-25
-30
2005 2006 2007 2008 2009 2010 2011 2012 2013
Europe
30
25
20
15
10
5
0
-5
-10
-15
-20
-25
-30
I
I
I
I
Communauté d'Etats indépendants (CEI)
I
I
I
2005 2006 2007 2008 2009 2010 2011 2012 2013
30
25
20
15
10
5
0
-5
-10
-15
-20
-25
-30
Asie
30
25
20
15
10
5
0
-5
-10
-15
-20
-25
-30
I
I
I
I
I
I
I
I
I
I
I
2005 2006 2007 2008 2009 2010 2011 2012 2013
I
I
I
I
I
I
I
2005 2006 2007 2008 2009 2010 2011 2012 2013
Monde
I
I
I
2005 2006 2007 2008 2009 2010 2011 2012 2013
30
25
20
15
10
5
0
-5
-10
-15
-20
-25
-30
I
I
I
I
I
I
I
2005 2006 2007 2008 2009 2010 2011 2012 2013
Gráfico 2
Volumen del comercio mundial de mercancías, por determinadas regiones, 2005-2013
(Variación porcentual anual)
Exportaciones
Importaciones
América del Sur y Central
América del Norte
30
25
20
15
10
5
0
-5
-10
-15
-20
-25
-30
I
I
I
I
I
I
I
30
25
20
15
10
5
0
-5
-10
-15
-20
-25
-30
2005 2006 2007 2008 2009 2010 2011 2012 2013
Comunidad de Estados Independientes (CEI)
Europa
30
25
20
15
10
5
0
-5
-10
-15
-20
-25
-30
I
I
I
I
I
I
I
30
25
20
15
10
5
0
-5
-10
-15
-20
-25
-30
2005 2006 2007 2008 2009 2010 2011 2012 2013
Asia
30
25
20
15
10
5
0
-5
-10
-15
-20
-25
-30
I
I
I
I
I
I
I
2005 2006 2007 2008 2009 2010 2011 2012 2013
I
I
I
I
I
I
I
2005 2006 2007 2008 2009 2010 2011 2012 2013
I
I
I
I
I
I
I
2005 2006 2007 2008 2009 2010 2011 2012 2013
Mundo
30
25
20
15
10
5
0
-5
-10
-15
-20
-25
-30
I
I
I
I
I
I
I
2005 2006 2007 2008 2009 2010 2011 2012 2013
Chart 2
Volume of world merchandise trade by selected region, 2005-2013
(Annual percentage change)
Exports
Imports
North America
2005
2006
2007
2008
2009
2010
2011
2012
2013
6.1
7.9
4.8
2.1
-14.4
15.0
6.6
4.4
2.8
6.2
6.1
2.0
-2.4
-16.8
15.7
4.4
3.1
1.2
South and Central America
2005
2006
2007
2008
2009
2010
2011
2012
2013
8.4
3.7
3.7
0.1
-8.0
4.7
6.8
0.7
1.4
14.3
14.8
17.3
13.2
-16.9
22.4
13.0
2.3
3.1
Europe
2005
2006
2007
2008
2009
2010
2011
2012
2013
4.3
7.6
4.3
0.4
-14.3
11.6
5.6
0.8
1.5
4.3
7.9
4.6
-0.4
-14.1
9.8
3.2
-1.8
-0.5
Commonwealth of Independent States (CIS)
2005
2006
2007
2008
2009
2010
2011
2012
2013
4.7
6.2
7.6
1.7
-4.8
6.2
1.6
0.9
0.8
17.5
20.6
20.4
15.6
-28.1
18.9
17.3
6.8
-1.3
Asia excluding Hong Kong re-exports
2005
2006
2007
2008
2009
2010
2011
2012
2013
11.7
13.7
11.7
5.3
-11.4
22.6
6.4
2.8
0.0
8.3
9.0
7.8
4.9
-7.5
18.1
6.6
3.7
0.0
World excluding Hong Kong re-exports
2005
2006
2007
2008
2009
2010
2011
2012
2013
6.6
8.6
6.5
2.4
-12.0
14.1
5.5
2.4
2.5
6.7
8.3
6.2
2.4
-12.9
13.8
5.3
2.1
1.9
© Copyright 2026