
Cross-Approximate Entropy parallel computation on GPUs for
c o m p u t e r m e t h o d s a n d p r o g r a m s i n b i o m e d i c i n e 1 1 2 ( 2 0 1 3 ) 189–199
journal homepage: www.intl.elsevierhealth.com/journals/cmpb
Cross-Approximate Entropy parallel computation
on GPUs for biomedical signal analysis.
Application to MEG recordings
Mario Martínez-Zarzuela a,∗, Carlos Gómez b, Francisco Javier Díaz-Pernas a,
Alberto Fernández c , Roberto Hornero b
a
Imaging and Telematics Group, E.T.S. Ingenieros de Telecomunicación, University of Valladolid, Paseo de Belén 15,
47011 Valladolid, Spain
b Biomedical Engineering Group, E.T.S. Ingenieros de Telecomunicación, University of Valladolid, Paseo de Belén 15,
47011 Valladolid, Spain
c Psychiatry and Medical Psychology Department, Complutense University of Madrid, Avda. Complutense s/n,
28040 Madrid, Spain
a r t i c l e
i n f o
a b s t r a c t
Article history:
Cross-Approximate Entropy (Cross-ApEn) is a useful measure to quantify the statistical dis-
Received 16 November 2012
similarity of two time series. In spite of the advantage of Cross-ApEn over its one-dimensional
Received in revised form 6 June 2013
counterpart (Approximate Entropy), only a few studies have applied it to biomedical sig-
Accepted 4 July 2013
nals, mainly due to its high computational cost. In this paper, we propose a fast GPU-based
implementation of the Cross-ApEn that makes feasible its use over a large amount of mul-
Keywords:
tidimensional data. The scheme followed is fully scalable, thus maximizes the use of the
Cross Approximate Entropy
GPU despite of the number of neural signals being processed. The approach consists in
CUDA
processing many trials or epochs simultaneously, with independence of its origin. In the
GPGPU
case of MEG data, these trials can proceed from different input channels or subjects. The
Magnetoencephalography
proposed implementation achieves an average speedup greater than 250× against a CPU
Neural signal analysis
parallel version running on a processor containing six cores. A dataset of 30 subjects containing 148 MEG channels (49 epochs of 1024 samples per channel) can be analyzed using
our development in about 30 min. The same processing takes 5 days on six cores and 15 days
when running on a single core. The speedup is much larger if compared to a basic sequential
Matlab® implementation, that would need 58 days per subject. To our knowledge, this is the
first contribution of Cross-ApEn measure computation using GPUs. This study demonstrates
that this hardware is, to the day, the best option for the signal processing of biomedical data
with Cross-ApEn.
© 2013 Elsevier Ireland Ltd. All rights reserved.
∗
Corresponding author at: E.T.S. Ingenieros de Telecomunicación, University of Valladolid, Paseo de Belén 15, 47011 Valladolid, Spain.
Tel.: +34 983 423000x5702; fax: +34 983 423667.
E-mail addresses: [email protected], [email protected] (M. Martínez-Zarzuela).
0169-2607/$ – see front matter © 2013 Elsevier Ireland Ltd. All rights reserved.
http://dx.doi.org/10.1016/j.cmpb.2013.07.005
190
1.
c o m p u t e r m e t h o d s a n d p r o g r a m s i n b i o m e d i c i n e 1 1 2 ( 2 0 1 3 ) 189–199
Introduction
Approximate entropy (ApEn) is a family of statistics introduced
as a quantification of regularity in time series data [1]. It was
constructed by Pincus (1991) initially motivated by applications to relatively short and noisy data sets, as most of the
biomedical signals. In fact, ApEn can be applied to signals with
at least 50 data points and to broad classes of models. It is
scale invariant and model independent, evaluates both dominant and subordinated patterns in data, and discriminates
series for which clear feature recognition is difficult [2]. ApEn
assigns a non-negative value to a time series, with larger values corresponding to greater apparent process randomness or
serial irregularity, and smaller values corresponding to more
instances of recognizable features or patterns in the data [3].
To compute ApEn, two parameters must be specified: a
run length m and a tolerance window r. Briefly, ApEn measures the logarithmic likelihood that runs of patterns that are
close (within r) for m contiguous observations remain close
(within the same tolerance width r) on subsequent incremental comparisons. ApEn(m, r, N) must be considered a family of
statistics, where N is the number of points of the time series.
Therefore, comparisons between time series must be made
with the same values of m, r and N [1]. It has been suggested
to estimate ApEn with parameter values of m = 1 or 2, and r a
fixed value between 0.1 and 0.25 times the standard deviation
of the original data sequence [3]. Normalizing r to the standard
deviation of each time series gives ApEn a translation- and
scale-invariance [3].
As ApEn is very well suited to analyze short, noisy data
sets, it has been widely used to study the regularity of several
kinds of biomedical signals, as heart rate [4], high frequency
electrocardiogram [5], cardiotocographic recordings [6], surface electromyography signals [7], respiratory rate [8], and
plasma concentrations of growth hormone [9], insulin [10],
testosterone and luteinizing hormone [11], among others.
Despite its widely use in all these biological contexts, ApEn
has an important drawback: information is obtained independently for each one-dimensional time series. Due to this
reason, it would not be the best option for the analysis of
multidimensional signals, like electroencephalography (EEG)
or magnetoencephalography (MEG) recordings, as the interaction among channels could provide information that is lost
using this measure. Despite this limitation, ApEn has been
applied to these brain signals, both EEG and MEG, to study different physiological and pathological brain processes, as sleep
[12], depth of sedation [13], Alzheimer’s disease [14,15] and
epileptic seizures [16,17].
On the other hand, Cross-Approximate Entropy (CrossApEn) was proposed to compare correlated sequences,
suggesting its application to physiological signals [18]. CrossApEn is thematically and algorithmically quite similar to ApEn,
yet with a critical difference in focus: it is applied to two
signals, rather than a single series, and thus, measures the
statistical dissimilarity of these two time series [3]. In this
sense, Cross-ApEn describes both spatial and temporal independence, whereas ApEn reflects only temporal irregularity
[19]. For two paired time series u and v, Cross-ApEn measures, within tolerance r, the frequency of v-patterns similar
to a given u-pattern of window length m [18]. Larger CrossApEn values indicate fewer instances of pattern matches. In
spite of the advantage of Cross-ApEn over its one-dimensional
counterpart, only a few studies have applied it to biological systems. For instance, Hudetz et al. [19] concluded that
Cross-ApEn values obtained from rats’ bihemispheric EEGs correlate with the return of spontaneous motor signs but not with
the nociceptive reflex. Cross-ApEn has also been applied to
analyze concentrations of circulating leptin, luteinizing hormone and estradiol in healthy women [20]. Pincus and Singer
[21] employed this measure to study the secretory patterns
of luteinizing hormone and testosterone in young and aged
healthy men. It has been also used to assess changes in the
coupling of the acceleration-EMG and extensor-flexor muscle
activity in Parkinson’s disease patients [22]. In other study [23],
Cross-ApEn was calculated for heart and respiratory rates in
schizophrenia. Finally, Álvarez et al. [24] applied Cross-ApEn
to blood oxygen saturation and heart rate signals from nocturnal oximetry in order to assess its usefulness in screening
obstructive sleep apnea syndrome.
If Cross-ApEn offers an important advantage over ApEn for
the analysis of brain data, why is it not used? The answer is
simple: computational cost. Computing Cross-ApEn between
only two time series is not a problem. However, if it is necessary to compute Cross-ApEn for EEG/MEG data of, let’s say,
B channels, so the algorithm must be applied B × B times.
Current MEG equipments have hundreds of channels, so the
computational cost of Cross-ApEn is extremely high (specially
when long recordings from several subjects have to been analyzed). Additionally, although Matlab® is the language usually
employed for signal processing of biomedical signals, it is
not always best option when computational cost has to be
taken into account. For this reason, faster implementations
are needed if we want to analyze high-dimensional data with
Cross-ApEn.
In this paper, we propose speeding up the execution of the
Cross-ApEn measure using a Graphics Processing Unit (GPU),
making feasible to the use of the algorithm for a large number
of signals and subjects. Additionally, we present a comparison
of the performance of our proposal against a parallel version
for CPUs written in plain C language and a comparison of
performance against a basic Matlab® implementation.
Several studies in recent years have focused on the
use of GPUs for General Purpose Computing (GPGPU) [25].
Some of the first contributions to this field were related to
image processing, computer vision and artificial intelligence
tasks [26–29]. However, the number and kind of fields of
interest in which GPU computing is applied are quickly growing. Massively-parallel bio-inspired computation models have
been developed for their execution on the GPU [30–33] and
during the last years, biomedical image processing and visualization on the GPU has been largely studied due to the
great performance of the GPU for processing bidimensional
and tridimensional series of data [34–36]. GPUs are flexible
enough to speed up time series analysis, thus biomedical signal processing on the GPU is receiving attention. For instance,
Konstantinidis et al. [37] used the GPU to measure skin conductance level and correlation dimension on multivariate
neurophysiological recordings 30 times faster than using a
pure C language and a single-core implementation in ANSI
191
c o m p u t e r m e t h o d s a n d p r o g r a m s i n b i o m e d i c i n e 1 1 2 ( 2 0 1 3 ) 189–199
C. Wilson and Williams [38] used GPUs for feature extraction
and classification in a real-time Brain Computer Interface (BCI)
system, improving its performance by at least two orders of
magnitude. Chen et al. [39] presented an approach for ensemble empirical mode decomposition (EEMD) and Hilbert–Huang
transform (HHT) neural signal analysis in a massively parallel multi-GPU environment. Liu et al. [40] described how to
implement MEME motif discovery on the GPU for biological
sequences analysis, reporting a speedup of an order of magnitude without losing precision.
While neuroscience algorithms continue to grow in
complexity faster than the CPU performance, the use of
data-parallel methods and GPUs is becoming increasingly
important [36]. However, a little effort has been dedicated yet
to the computation of entropy measures, commonly used in
biomedical signal analysis. To our knowledge, this paper is
the first description on how to effectively speed up the computation of Cross-ApEn on the GPU. In practical terms, using
our approach, computation time can be reduced from days
to minutes when compared to an optimized implementation
running on a multi-core CPU.
(2.2) Define the distance between x(i) and y(j), d[x(i), y(j)],
as the maximum absolute difference of their corresponding scalar components:
d[x(i), y(j)] =
max
k=1,2,...,m
u(i + k − 1) − v(j + k − 1)
(2.3) For each x(i), count the number of j
(j = 1, 2, . . ., N − m + 1) so that d[x(i), y(j)] ≤ r, denoted as
Nim (r). Then, for i = 1, 2, . . ., N − m + 1, set
Cm
i (r)(v u) =
Nim (r)
(4)
N−m+1
(3) Obtain m (r) (similar steps for m+1 (r)), computing the natural logarithm of each Cm (r) and average it over i:
m (r)(v u) =
1
N−m+1
N−m+1
ln Cm
i (r)(v||u)
(5)
i=1
(4) Finally, Cross-ApEn is defined by:
Cross-ApEn(m, r, N)(v u) = m (r)(v u) − m+1 (r)(v u)
2.
Concepts
2.1.
Cross-ApEn algorithm
Cross-ApEn is a two-parameter family of statistics introduced
as a measure of statistical dissimilarity between two paired
time series [18]. It evaluates secondary as well as dominant
patterns in data, quantifying changes in underlying episodic
behavior that do no reflect in peak occurrences and amplitudes [41]. To compute Cross-ApEn, it is necessary to specify
the values of the rung length m and the tolerance window r.
For two time series, u and v, Cross-ApEn measures, within tolerance r, the (conditional) regularity or frequency of v-patterns
similar to a given u-pattern of window length m.
Given two equally sampled sequences of length N,
u = [u(1), (2), . . ., u(N)] and v = [v(1), v(2), . . ., v(N)], the algorithm
to compute Cross-ApEn is the following [18,24]:
(1) Normalization of u(i) and v(i) into u* (i) and v* (i), according
to Eqs. (1) and (2):
u∗ (i) =
u(i) − mean(u)
SD(u)
(1)
v∗ (i) =
v(i) − mean(v)
SD(v)
(2)
(2) Obtain Cm (r) (similar steps to obtain Cm+1 (r)):
the
vector
sequences
(2.1) Form
x(i) = [u* (i), u* (i + 1), . . ., u* (i + m − 1)]
and
y(j) = [v* (j), v* (j + 1), . . ., v* (j + m − 1)]. These vectors
represent m consecutive u* and v* values starting
with the ith and jth point, respectively.
(3)
(6)
It is important to note that Cross-ApEn is not always defined
(r)(v||u) may be equal to 0 in the absence of similar
because Cm
i
patterns between u and v. To solve this, two correction strategies have been proposed [42]: bias 0 and bias max. In this study,
both correction strategies have been applied. Both strategies
assign non zero values to Cm
(r)(v||u) and Cm+1
(r)(v||u) in the
i
i
absence of matches, as follows:
(1) Bias 0: Cm
(r) = Cm+1
(r) = 1 if originally Cm
(r) = Cm+1
(r) =
i
i
i
i
−1
0, and Cm+1
(r) = (N − m)
if originally Cm
(r) =
/ 0 and
i
i
m+1
Ci
(r) = 0.
(r) = 1 if originally Cm
(r) = 0, and Cm+1
(r) =
(2) Bias max: Cm
i
i
i
(N − m + 1)
2.2.
−1
if originally Cm+1
(r) = 0.
i
GPU computing
The Graphics Processing Unit (GPU) was originally devised to
help the Central Processing Unit (CPU) in processes related
to data visualization. Today, GPUs have evolved into Single Instruction Multiple Threads (SIMT) architectures able to
speed up the execution of general-purpose data-parallel algorithms. Computers and servers equipped with CPUs and GPUs
are considered now as powerful heterogeneous architectures
that can be programmed to speed up the execution of paralleldata algorithms by at least one order of magnitude. In the
field of GPGPU computing, new high programming languages
such as CUDA and OpenCL are available [43]. These languages
allow scientist to program the GPUs without the need of any
knowledge about Graphics APIs such as OpenGL or shading
languages such as Cg (C for Graphics), as it used to be in the
first days of GPGPU computing [44–46].
CUDA (Compute Unified Device Architecture) is a parallel computing framework created by NVIDIA that includes
some extensions to high level languages such as C/C++, giving
access to the native instruction set and memory of the parallel
computational elements in CUDA enabled GPUs. Accelerating
192
c o m p u t e r m e t h o d s a n d p r o g r a m s i n b i o m e d i c i n e 1 1 2 ( 2 0 1 3 ) 189–199
an algorithm using CUDA includes translating it into dataparallel sequences of operations and mapping computations
to the underlying resources to get maximum performance
[43,44,46].
In contrast to multiple-core CPUs, GPUs are massively
parallel processors with up to thousands of cores. To guarantee automatic scalability of the algorithms to the hardware,
which is different from one GPU model or generation to
another, these cores are distributed among a variable number of Stream Multiprocessors (SMs in Fermi-based GPUs and
SMXs in Kepler-based GPUs). SMs contain dozens of cores:
32 single precision cores in Fermi-based GPUs and 192 single
precision cores in Kepler-based GPUs. Each core is capable of
running the operations described in a kernel code, associated
to a CUDA thread. Threads are grouped into blocks of threads,
which are executed on the same SM. Regardless the size of
the block, the SM schedules threads in groups of 32 parallel
threads, called warps. Computations that take place after a
kernel launch are divided among a number of blocks of threads
called grid.
Not only has the GPU many more processors than multiplecore CPUs, but also a higher memory bandwidth with its own
DRAM memory. On NVIDIA GPUs of compute capability 2.x
and above, the access to the global memory is cached. Also,
in any CUDA enabled GPU it is possible to use shared memory as a self-programmed intermediate cache between global
memory and SMs. Designing the kernel for the execution of
more than one block per multiprocessor helps hiding memory latency in global memory loads [43]. Another key metric to
keep the hardware busy is the occupancy, which stands for the
ratio of number of active warps per SM to the maximum number of possible active warps. The amount of shared memory
and registers is limited in a SM, thus the maximum occupancy depends on the number of registers and shared memory
needed by a block. As a role of thumb it is good to keep relative high occupancy, but this does not necessarily mean higher
performance [43,46]. A proper design should exploit all the
hardware resources and optimal performance is only achieved
considering a trade-off between them. The algorithm has to
be thought for each thread individually and, at the same time,
globally for blocks and grids, taking into account aspects like
the use of shared memory, coalescence of data copies or level
of occupancy [43,44,46].
3.
Methods
In this section, we describe the strategies followed to speed up
the computation of Cross-ApEn on the CPU and on the GPU. We
first start describing the sequential version of the algorithm,
which will be tested using Matlab® and C implementations.
Afterwards, we propose a simple way to speed up the computation of the algorithm based on data reutilization and valid
on every platform. Next, we describe how to parallelize the
execution of the algorithm using the GPU, starting with a
naïve implementation and finishing with an approach convenient for biomedical signal analysis. In this latest approach,
we propose a flexible implementation able to process a variable number of trials or epochs, maximizing the use of the
underlying hardware with independence of the length of the
trials.
In Section 2.1 we decomposed the computation of the CrossApEn into four steps:
(1) Normalization of u and v into u* and v* (see Eqs. (1) and
(2)).
(2) Computation of Cm (r) and Cm+1 (r) (see Eqs. (3) and (4)).
(3) Computation of m (r), m+1 (r) (Eq. (5)).
(4) Computation of Cross-ApEn (Eq. (6)).
The implementations of Steps (1), (3) and (4) are trivial for
the CPU both in Matlab® and C language. Also, these steps
can be easily parallelized for execution on the GPU, thus we
will include some comments but not a complete description
of the techniques needed. On the other hand, we will pay special attention to the implementation of Step (2) Computation
of Cm (r) and Cm+1 (r), for execution on the CPU and on the GPU.
Note that Step (2) of the algorithm involves applying a correction strategy such as Bias 0 or Bias max, described in Section
2.1.
3.1.
Algorithm on the CPU
We first start describing the sequential computation of the
Cross-ApEn in Matlab® and on the CPU. Since Cross-ApEn is
defined as a subtraction of m (r) and m+1 (r), (6), operations
already performed to calculate m (r), are repeated for m+1 (r).
From the point of view of an efficient implementation, this
results in a very poor performance. Vector components in x(i)
and y(j) are accessed in different executions, thus not exploiting cache locality. Additionally, computation of the distance
between different points of the signal (3), when processing
Ni m+1 (r), requires data comparisons that have been already
done for Nim (r).
In advance to a parallel implementation of the algorithm,
we propose to optimize the steps described in Section 2.1,
removing unnecessary computations and memory accesses,
as detailed in Fig. 1. In this pseudocode, the steps necessary
to compute Ci (r) (4), for m and m + 1, are merged together. To
this end, Nim (r) and Nim+1 (r) are updated in the same algorithm
step, thus avoiding computing again distance in Eq. (3). It is
important to notice that this approach is also valid and will
be used for the parallel implementation of the algorithm on
the GPU. Implementing the pseudocode described in Fig. 1 in
Matlab® and C is quite straightforward. Moreover, the C code
can be easily parallelized for execution on multi-core processors using OpenMP directives.
3.2.
Algorithm on the GPU
The three steps in which we subsumed the computation of the
Cross-ApEn algorithm, described at the beginning of this section, can be parallelized on the GPU using different strategies.
Steps (1), (3) and (4) require global operations over every
component of the inputs called ‘reductions’ [47]. In the
first step, reductions are needed to compute the mean and
standard deviation of u and v. In the last step, they are used
(r). Reductions are basic algorithm
for the addition of every Cm
i
building blocks for parallel processing, thus have been largely
c o m p u t e r m e t h o d s a n d p r o g r a m s i n b i o m e d i c i n e 1 1 2 ( 2 0 1 3 ) 189–199
Fig. 1 – Cross-ApEn optimized algorithm. The operations
needed to obtain of Cim and Cim+1 are merged together. This
strategy is valid to speed up sequential and parallel code.
studied for optimal performance on the GPU [48,49]. Basically,
the input vector is split up into data segments. A kernel in
the GPU performs the global operation over each data segment using a block of threads. Since threads belonging to
different blocks cannot share data, partial results are stored
in global memory. After further invocations to the kernel, the
final result is obtained. Additionally, the most recent hardware
simplifies reductions using atomic operations. We encourage
the reader to review the associated literature if he or she is not
familiar with these techniques [47–49].
Step (2) of the algorithm, consisting in the computation
of Cm (r) and Cm+1 (r) is the most time consuming part in any
platform. In the next paragraphs, we will discuss different
implementations of this step on the GPU.
3.3.
Naïve Implementation on the GPU
We will start describing a basic design of Step (2) for running on
the GPU. In a naïve implementation, it is possible to map the
computation of CrossAp-En to the GPU hardware as it is shown
in Fig. 2. Input signals u* and v* are split up into data segments that are simultaneously accessed from different blocks
Fig. 2 – Naïve implementation of Cross-ApEn on the GPU.
Every block of threads accesses a specific segment of one of
the inputs and to every segment of the other input. The
kernel outputs Cim (r) and Cim+1 (r), applying the correction
strategies Bias0 or Biasmax.
193
of threads. There are data dependencies among different data
segments. A block of threads reads a specific segment of one
of the input signals, but iterates over every segment of the
other input signal. In the figure, the arrows represent segment
accesses from a block.
Every block of threads will output to global memory a subgroup of results. Using the same strategy described for the
implementation of the algorithm on the CPU in Fig. 1, a single
thread is used to compute Cm
(r) and Cm+1
(r). An additional
i
i
advantage is that the same thread has access to the registers containing the values required to apply the correction
strategies Bias 0 or Bias max. For this reason, they can be
applied without extra slow global memory reads. Notice that
(r) the output is shorter than for Cm
(r).
for Cm+1
i
i
A simple implementation of the algorithm consists in
reading the segments of data directly from the global memory to the registers, which are private for each thread. This
naïve implementation can already run relatively fast on CUDA
devices of compute capability 2.x or greater. In our design,
the memory reads follow a convenient access pattern to
get high bandwidth performance with L1 cache. In order to
avoid non-unit-stride accesses, multidimensional input signals are stored in memory using a Structure of Arrays (SoA)
approach [45]. This allocation pattern guarantees that consecutive threads will read adjacent float values, thus warp
accesses to a L1 cache line of size 128-bytes are single
coalesced [43].
Another interesting aspect of the implementation is related
to the number of registers needed by the kernel. If the number of registers is higher than 63 in devices 2.x, intermediate
results may have to be spilled to a L1 cache or to the global
memory, lowering the overall performance [36,43,46]. Register
pressure causes that the greater the number of required registers, the lower the occupancy in the device. Following the
strategy depicted in Fig. 2, only 24 registers are needed, giving
a high theoretical occupancy of 32 warps per SM.
This naïve approach would not have a good performance
on CUDA devices of compute capability 1.x, where the global
memory is not cached. The solution for those devices would
be using constant or texture memory, which are automatically
cached even in old GPU devices. Constant memory space is
quite small, while texture memory can hold large amounts of
data. Additionally, texture memory is optimized for 2D spatial locality, what makes it very useful for computer vision
applications, among others [27]. Indeed, utilization of texture
memory for general purpose computing dates back to the first
times of GPGPU, when CUDA was not available and input and
output data had to be packed into computer graphics-related
arrays [28]. However, texture array presents a drawback: the
same thread cannot safely read and write simultaneously to
the same location of a texture. This limitation introduces additional complexity in reduction operations, needed in Steps (1),
(3) and (4) of Cross-ApEn algorithm. In this case, auxiliary texture arrays have to be used to alternate readings and writings
between input and output buffers [29].
3.4.
Optimized implementation on the GPU
One of the drawbacks of the naïve version is its poor scalability.
If the length of the input signals is small, then a small number
194
c o m p u t e r m e t h o d s a n d p r o g r a m s i n b i o m e d i c i n e 1 1 2 ( 2 0 1 3 ) 189–199
of thread blocks is enough to compute all the data segments
in Fig. 2. Then, it might be that GPU resources are not fully
exploited. With each new version of CUDA hardware, there is
an increase in the number of threads that can run concurrently
and in the number of multiprocessors. The number of active
CUDA blocks per multiprocessor should be large enough to
keep the GPU busy and hide memory latency. To scale to future
devices the number of blocks per kernel launch should be in
the range of thousands [43].
With the aim of maximizing the use of underlying hardware, the naïve implementation can be scaled to compute
simultaneously the Cross-ApEn over M different trials or
epochs of length N. Using this approach, we can maximize
hardware utilization even for small chunks of input data. This
is particularly interesting for the analysis of biomedical data,
where typically several trials are analyzed independently and
then averaged.
The scheme proposed is fully scalable and works at three
levels of parallelism: number of trials or epochs, number of
channels to be processed and number of subjects to be compared. For some studies, it could be interesting to process only
a small number of channels, for a whole database of subjects.
In other studies, it could be more interesting processing all the
channels recorded from a unique subject. Our approach can
be configured to keep a large amount of Cross-ApEn computations concurrent but independent on the GPU, maximizing
the use of the hardware resources in every single kernel
launch.
This convenient approach for Cross-ApEn implementation
on the GPU is presented in Fig. 3. Here, blocks of threads
running concurrently on the GPU can be attending the computation of Cross-ApEn on independent trials. To prevent that
the final values of Cm+1 (r) contribute to the final value of
Cross-ApEn, the condition IF((tid+triallength+m)&&(triallengthm)THEN(*C2 = 0)) is included in the Bias 0 or Bias max
computation inside the kernel, where tid stands for the global
thread number and C2 is a pointer to the value Cm+1 (r).
For the implementation of this approach in software, it is
convenient to maximize the data bandwidth for loads and
stores from and to the global memory. Instead of loading data
directly from global memory to the chip registers, as suggested
in the naïve implementation, more efficient strategies can be
considered. The key for optimal performance consists of using
shared memory and coalesced input data segment readings
from the global memory. Once the input data is loaded, it is
possible to perform brute force measurement of the distances
in Eq. (3) taking advantage of shared memory broadcasting
capabilities.
Considering that a thread must access two different values of each input in order to compute Cross-ApEn for m and
m + 1, there are two different approaches that can be employed
using shared memory. The first option consists in forcing
blocks to read a halo of data of size m, in which the first
m elements of the input signals needed by the next block
of threads are also loaded. In this case, the shared memory necessary per block is 2*(m+blockDim.x)*sizeof(float). The
main disadvantage of this approach is that loading the values
into the halo can require an extra memory access to global
memory and causes divergence of threads inside a warp. The
second option consists in loading also the vector sequences
x(i) and y(j) into shared memory, by shifting original u* and
v* by an amount of m. Using this approach, the shared memory needed per block increases to 4*blockDim.x*sizeof(float) and
the time needed to copy the input data from the host to the
device is increased. However, the overall performance of the
algorithm is greater, since global memory load efficiency is
maximized.
3.5.
MEG data
In order to show the usefulness of the proposed GPU implementation to analyze real data, Cross-ApEn algorithm was
applied to MEG recordings. Our sample consisted of thirty subjects: 10 children (5 males and 5 females; mean age = 10.0 ± 1.9
years, mean ± standard deviation), 10 adults (5 males and 5
females; mean age = 31.0 ± 1.4 years) and 10 elderly people (5
males and 5 females; mean age = 63.4 ± 2.2 years). Subjects
were in an awake but resting state with their eyes closed and
under vigilance control during the recording. They were asked
to avoid blinking and making movements. For each subject,
5-min MEGs were acquired with a 148-channel whole-head
magnetometer (MAGNES 2500 WH, 4D Neuroimaging) at a
sampling frequency of 678.17 Hz, and then downsampled to
169.549 Hz. Finally, epochs of 1024 samples were digitally filtered using a band-pass filter (0.5–40 Hz) for offline analysis
with Cross-ApEn algorithm.
Fig. 3 – Optimized implementation of Cross-ApEn on the GPU. Different epochs of the same input signals can be processed
concurrently.
c o m p u t e r m e t h o d s a n d p r o g r a m s i n b i o m e d i c i n e 1 1 2 ( 2 0 1 3 ) 189–199
Fig. 4 – Time comparison for CPU sequential
implementations of Cross-ApEn using C language and
running on a single core. The optimized version C(2),
implemented following the indications in Section 2.1,
obtains a relative speedup of 1.5× with respect to a basic
implementation C(1).
4.
Results and discussion
4.1.
Time performance comparisons
A dataset of generated random data was generated for
measuring the performance of different Cross-ApEn implementations, both on the CPU and the GPU. All times shown in
the graphs have been averaged after 10 different executions of
the benchmarks and using NSIGHT profiling tool. These tests
were executed on a CPU Intel Xeon X5660 with 6 cores and
clocked at a speed of 2.66 GHz; and on a GPU GeForce 580 GTX
with 512 CUDA cores and clocked at 1.544 GHz.
Figs. 4 and 5 show time comparisons of different sequential
and parallel versions of the Cross-ApEn algorithm implemented on the CPU using C language and on the GPU using
CUDA. All the codes are using single float precision. Fig. 4
shows a performance comparison of a basic sequential version
of the algorithm on the CPU, labeled C(1), against an optimized
sequential version implemented as proposed in Section 3.1,
labeled C(2). The figure illustrates that elapsed time is exponential with an increasing number of points in the dataset and
Fig. 5 – Time comparison for GPU implementations of
Cross-ApEn for steps described in Section 2.1. The times
showed correspond to the computation over 50
independent trials of size 8192. Step 2 performance varies
depending on Registers, Halo and Optimal
implementations described in Section 3.2. The latter is 43%
faster than the first.
195
Fig. 6 – Performance of the proposed implementation of
Cross-ApEn algorithm for the GPU, running on a GPU
GeForce 580 GTX. The time needed for calculation scales
linearly with the number of epochs M and quadratically
with their length N.
a significant average speedup of 1.5× times is obtained using
the optimized approach.
Fig. 5 shows a comparison of three different parallel implementations of the Cross-ApEn on the GPU, according to the
details given in Section 3.2. The times showed in the graph
correspond to a simultaneous computation of Cross-ApEn over
50 different trials of size 8192. The codes used single precision.
The times include data copies back and forth between the CPU
and the GPU. The naïve version of the algorithm, based on
direct data loading to the registers, was modified so that it
could be executed in parallel over M different trials of size N.
The optimized versions of the Cross-ApEn on the GPU were
30% and 43% faster, respectively using halo and shifted versions of the input loading. For all the cases showed in the
graph, the kernel launch was configured to 256 threads per
block for a theoretical occupancy of 83.3%. The GPU was configured to prefer L1 cache in the Registers version, but shared
memory in the other two implementations. Pinned memory
was used in the host side to maximize memory bandwidth
utilization.
Fig. 6 shows the performance of the Optimal GPU-based
parallel version of the Cross-ApEn algorithm for different data
lengths. The time needed grows linearly with the number of
trials or epochs M and in a quadratic way with the length of the
trials N. Finally, Table 1 includes the relative speedup achieved
on the GPU in comparison with a parallel version of the algorithm running on a 6-core CPU. The CPU code uses the OpenMP
library and was configured to use a different amount of cores
in different executions. The length of the data was 50 epochs
of size 8192. The proposed GPU implementation achieves a
relative speedup of 256× when compared to an implementation of the optimized Cross-ApEn algorithm for CPU presented
in Section 3.1. Although not included in the graphs, the performance of a basic implementation of the algorithm using
Matlab® was also tested. This implementation was 90 times
slower than the slowest CPU implementation C(1).
Our study agrees with previous research works, which
have reported the great importance of developing linear and
non-linear biomedical signal processing algorithms to exploit
computing capabilities of the GPU. Konstantinidis et al. [37]
studied the feasibility of using GPUs to achieve real-time
emotion aware computing measuring EEG and electrodermal
196
c o m p u t e r m e t h o d s a n d p r o g r a m s i n b i o m e d i c i n e 1 1 2 ( 2 0 1 3 ) 189–199
Table 1 – Relative speedup obtained on the GPU against a parallel version running on a CPU implemented using OpenMP,
depending on the number of cores being used.
Number of cores used on the CPU
Average time on the CPU
Average time on the GPU
Relative speedup of the GPU
6
4
2
20787.24
81.09
256×
30354.38
60114.64
121076.80
374×
741×
1493×
recordings acquired during emotion evocative pictures. They
proved the convenience of using GPUs for fast processing of
neuro-physiological data, using nonlinear dynamic analysis
and signal processing algorithms [37]. Wilson and Williams
[38] proposed to off-load two algorithms from BCI2000 from
the CPU to the GPU using data parallel primitives. By comparing the performance of the GPU-based versions against single
and multi-threaded implementations, they showed that massively parallel processing architectures are able to improve
the performance of traditional BCI systems [38]. The adoption of GPU-based approaches for biomedical data analysis
is becoming more important every day. In fact, some authors
have stated that combining CPUs and GPUs over distributed
systems will prevail in analyzing large datasets of neural data
[35,39].
4.2.
Application to real MEG data
Cross-ApEn was applied to MEG recordings described in Section 3.3 with parameter values of m = 1 and r = 0.2 [3]. The end
result of computing Cross-ApEn for all pair-wise combinations
of MEG channels is a B × B matrix with B = 148 (number of channels), where each entry Bi,j contains the Cross-ApEn value for
channels i and j. Fig. 7 illustrates the averaged Cross-ApEn values estimated at each group for all the pair-wise combinations
of MEG channels. This figure shows that Cross-ApEn values
increase as a function of age for all channels combinations.
A comparison between “Children group” and “Adults
group” revealed an increase of Cross-ApEn values from childhood to adulthood. Additionally, differences were statistically
significant at 67.34% of the 148 × 148 MEG combinations (pvalues <0.01, Kruskal–Wallis test). These changes suggested
that a significant increase in dissimilarity values takes place
during the maturation period. Our results agree with previous
studies [50–54]. For instance, Meyer-Lindenberg [53] suggested
1
a marked increase in complexity during human brain development. This jump in the brain dynamics complexity during
puberty was confirmed in [50]. On the other hand, spectral
studies have reported maturational changes in the EEG activity [50,52]. Dustman et al. [51] computed spectral amplitude,
amplitude variability and mean frequency from 222 healthy
males, concluding that the main changes occurred during
infancy. Finally, large increases in connectivity in alpha, theta
and beta frequency bands were found from childhood to adolescence [54].
We also analyzed entropy results in elderly people in comparison with adults group. Our findings showed that MEG
signals from different channels are less similar among them in
elderly subjects than in younger people. We found statistically
significant differences only in 14.86% of the 148 × 148 MEG
combinations (p-values <0.01, Kruskal–Wallis test), which suggests that brain changes are more subtle during middle ages
that during maturation period. These results are in agreement
with previous studies that have analyzed the spontaneous
EEG/MEG activity across the life span using other nonlinear
measures, such as correlation dimension or Lempel-Ziv complexity [50,55].
The execution time required for these analyses (30 subjects; 148 channels for each subject; 49 epochs per channel)
was 30 min using the GPU implementation of Cross-ApEn. The
CPU version implemented for the tests takes 5 days running on a six-core processor to deliver the same output. Of
course, these results have to be taken with care. Although
the CPU algorithm implementation tested here considers data
reutilization in the same manner as the GPU implementation, multi-core programming was done using OPENMP library
directives, while other techniques could be applied. Also, our
performance tests concluded that it would be not feasible
to analyze these data using our sequential Matlab® implementation of the algorithm. Matlab® is a widely used tool in
Fig. 7 – Average Cross-ApEn values for (a) children, (b) adults and (c) elderly people.
c o m p u t e r m e t h o d s a n d p r o g r a m s i n b i o m e d i c i n e 1 1 2 ( 2 0 1 3 ) 189–199
biomedical applications, and a very useful environment for
rapid prototyping. However, the basic implementation developed for Cross-ApEn calculation needs an estimated time of 4.8
years to process the same database.
5.
Conclusions
In this paper, we introduced a fast parallel implementation
of Cross-ApEn algorithm using GPU for signal processing of
biomedical data. This proposal is highly innovative since it is
the first description on how to effectively speed up the computation of Cross-ApEn on the GPU. Due to the high computational
cost of some algorithms commonly employed in biomedical
research, such as Cross-ApEn, the use of data-parallel methods and GPUs is becoming increasingly important in the last
years [36]. Our GPU-based proposal will allow analyzing EEG
and MEG data using Cross-ApEn for helping in the diagnosis of
brain diseases.
The performance of our implementation reduces the time
needed to compute Cross-ApEn by a factor of almost 1500×
with respect to a single core CPU and by a factor greater than
250× when compared to a CPU equipped with 6 cores. Reduction of time is even larger when compared to a pure Matlab®
implementation. This study is only a first step for speeding up the computationally intensive algorithms frequently
used for the analyses of big amount of data, as biomedical
recordings. The proposed GPU-based design can be further
extended to compute other entropy algorithms, such as CrossSample Entropy and Cross-Fuzzy Entropy [42,56].
Using real data, the proposed implementation needs only
around 1 min to process MEG data of 148 channels (49 epochs
of 1024 samples). Therefore, a database of 30 patients can be
processed in less than 30 min, whereas in a high-end CPU
equipped with six cores, processing the same database takes
5 days. A very basic Matlab® implementation running on a
single core would have taken an estimated time of 4.8 years.
In sum, our GPU implementation will allow analyzing big
amount of biomedical time series with Cross-ApEn much faster
than with CPU or Matlab® implementations.
Conflict of interest statement
The authors declare that the research was conducted in the
absence of any commercial or financial relationships that
could be construed as a potential conflict of interest.
Acknowledgments
This research was supported in part by the Ministerio de
Ciencia e Innovación under project TIN2010-20529, Ministerio de Economía y Competitividad and FEDER under project
TEC2011-22987, the Proyecto Cero 2011 on Aging from Fundación General CSIC, Obra Social La Caixa and CSIC, and
projects VA171A11-2 and VA111A11-2 from Junta de Castilla
y León.
197
references
[1] S.M. Pincus, Approximate entropy as a measure of system
complexity, Proceedings of the National Academy of
Sciences of the United States of America 88 (1991) 2297–2301.
[2] S.M. Pincus, A.L. Goldberger, Physiological time-series
analysis: what does regularity quantify? American Journal of
Physiology 266 (1994) H1643–H1656.
[3] S.M. Pincus, Assessing serial irregularity and its implications
for health, Annals of the New York Academy of Sciences 954
(2001) 245–267.
[4] V.K. Yeragani, E. Sobolewski, V.C. Jampala, J. Kay, S. Yeragani,
G. Igel, Fractal dimension and approximate entropy of heart
period and heart rate: awake versus sleep differences and
methodological issues, Clinical Science 95 (1998) 295–301.
[5] X. Ning, Y. Xu, J. Wang, X. Ma, Approximate entropy analysis
of short-term HFECG based on wave mode, Physica A 346
(2005) 475–483.
[6] M.G. Signorini, G. Magenes, S. Cerutti, D. Arduini, Linear and
nonlinear parameters for the analysis of fetal heart rate
signal from cardiotocographic recordings, IEEE Transactions
on Biomedical Engineering 50 (2003) 365–374.
[7] W.T. Chen, Z.Z. Wang, X.M.X.M. Ren, Characterization of
surface EMG signals using improved approximate entropy,
Journal of Zhejiang University Science B 7 (2006)
844–848.
[8] M. Engoren, Approximate entropy of respiratory rate and
tidal volume during weaning from mechanical ventilation,
Critical Care Medicine 26 (1998) 1817–1823.
[9] G. van den Berg, S.M. Pincus, M. Frölich, J.D. Veldhuis, F.
Roelfsema, Reduced disorderliness of growth hormone
release in biochemically inactive acromegaly after pituitary
surgery, European Journal of Endocrinology/European
Federation of Endocrine Societies 138 (1998) 164–169.
[10] O. Schmitz, C.B. Juhl, M. Hollingdal, J.D. Veldhuis, N. Pørksen,
S.M. Pincus, Irregular circulating insulin concentrations in
type 2 diabetes mellitus: an inverse relationship between
circulating free fatty acid and the disorderliness of an
insulin time series in diabetic and healthy individuals,
Metabolism: Clinical and Experimental 50 (2001) 41–46.
[11] S.M. Pincus, T. Mulligan, A. Iranmanesh, S. Gheorghiu, M.
Godschalk, J.D. Veldhuis, Older males secrete luteinizing
hormone and testosterone more irregularly, and jointly
more asynchronously, than younger males, Proceedings of
the National Academy of Sciences of the United States of
America 93 (1996) 14100–14105.
[12] N. Burioka, M. Miyata, G. Cornélissen, F. Halberg, T.
Takeshima, D.T. Kaplan, H. Suyama, M. Endo, Y. Maegaki, T.
Nomura, Y. Tomita, K. Nakashima, E. Shimizu, Approximate
entropy in the electroencephalogram during wake and
sleep, Clinical EEG & Neuroscience Journal 36 (2005) 21–24.
[13] R. Ferenets, T. Lipping, A. Anier, V. Jäntti, S. Melto, S.
Hovilehto, Comparison of entropy and complexity measures
for the assessment of depth of sedation, IEEE Transactions
on Biomedical Engineering 53 (2006) 1067–1077.
[14] D. Abásolo, R. Hornero, P. Espino, J. Poza, C.I. Sánchez, R. de
la Rosa, Analysis of regularity in the EEG background activity
of Alzheimer’s disease patients with Approximate Entropy,
Clinical Neurophysiology 116 (2005) 1826–1834.
[15] R. Hornero, J. Escudero, A. Fernández, J. Poza, C. Gómez,
Spectral and nonlinear analyses of MEG background activity
in patients with Alzheimer’s disease, IEEE Transactions on
Biomedical Engineering 55 (2008) 1658–1665.
[16] N. Radhakrishnan, B.N. Gangadhar, Estimating regularity in
epileptic seizure time-series data. A complexity-measure
approach, IEEE Engineering in Medicine & Biology 17 (1998)
89–94.
198
c o m p u t e r m e t h o d s a n d p r o g r a m s i n b i o m e d i c i n e 1 1 2 ( 2 0 1 3 ) 189–199
[17] V. Srinivasan, C. Eswaran, N. Sriraam, Approximate
entropy-based epileptic EEG detection using artificial neural
networks, IEEE Transactions on Information Technology in
Biomedicine 11 (2007) 288–295.
[18] S.M. Pincus, Irregularity and asynchrony in biologic network
signals, Methods in Enzymology 321 (2000) 149–182.
[19] G. Hudetz, J.D. Wood, J.P. Kampine, Cholinergic reversal of
isoflurane anesthesia in rats as measured by
cross-approximate entropy of the electroencephalogram,
Anesthesiology 99 (2003) 1125–1131.
[20] J. Licinio, A.B. Negrão, C. Mantzoros, V. Kaklamani, M.L.
Wong, P.B. Bongiorno, A. Mulla, L. Cearnal, J.D. Veldhuis, J.S.
Flier, S.M. McCann, P.W. Gold, Synchronicity of frequently
sampled, 24-h concentrations of circulating leptin,
luteinizing hormone, and estradiol in healthy women,
Proceedings of the National Academy of Sciences of the
United States of America 95 (1998) 2541–2546.
[21] S.M. Pincus, B.H. Singer, Randomness and degrees of
irregularity, Proceedings of the National Academy of
Sciences of the United States of America 93 (1996)
2083–2088.
[22] D.E. Vaillancourt, K.M. Newell, The dynamics of resting and
postural tremor in Parkinson’s disease, Clinical
Neurophysiology 111 (2000) 2046–2056.
[23] J. Peupelmann, M.K. Boettger, C. Ruhland, S. Berger, C.T.
Ramachandraiah, V.K. Yeragani, K.J. Bär, Cardio-respiratory
coupling indicates suppression of vagal activity in acute
schizophrenia, Schizophrenia Research 112 (2009) 153–157.
[24] D. Álvarez, R. Hornero, D. Abásolo, F. del Campo, C.
Zamarrón, M. López, Nonlinear measure of synchrony
between blood oxygen saturation and heart rate from
nocturnal pulse oximetry in obstructive sleep apnea
syndrome, Physiological Measurement 30 (2009) 967–982.
[25] J.D. Owens, M. Houston, D. Luebke, S. Green, J.E. Stone, J.C.
Phillips, GPU computing, Proceedings of the IEEE 96 (5) (2008)
879–899.
[26] J.D. Owens, D. Luebke, N. Govindaraju, M. Harris, J. Krüger,
A.E. Lefohn, T.J. Purcell, A survey of general-purpose
computation on graphics hardware, Proceedings of the
Computer Graphics Forum 26 (1) (2007) 80–113.
[27] R. Yang, G. Welch, Fast image segmentation and smoothing
using commodity graphics hardware, Journal of Graphics
Tools 7 (2002) 91–100.
[28] J. Fung, S. Mann, Using graphics devices in reverse:
GPU-based image processing and computer vision, in: Proc.
IEEE Multimedia and Expo, 2008, pp. 9–12.
[29] M. Martínez-Zarzuela, F.J. Díaz Pernas, J.F. Díez Higuera, M.
Antón-Rodríguez, Proc. International Workshop in Artificial
Neural Networks, Lecture Notes in Computer Science 4507
(2007) 463–470.
[30] S. Gobron, F. Devillard, B. Heit, Retina simulation using
cellular automata and GPU programming, Machine Vision
and Applications 18 (2007) 331–342.
[31] T. Ho, P. Lam, C. Leung, Parallelization of cellular neural
networks on GPU, Pattern Recognition 41 (2008) 2684–2692.
[32] M. Martínez-Zarzuela, F.J. Díaz-Pernas, M. Antón-Rodríguez,
J.F. Díez-Higuera, D. González-Ortega, D. Boto-Giralda, F.
López-González, I. de la, Torre-Díez, Multi-scale neural
texture classification using the GPU as a stream processing
engine, Machine Vision and Applications 22 (2011) 947–966.
[33] J.M. Cecilia, A. Nysbet, M. Amos, J.M. García, M. Ujaldón,
Enhancing GPU parallelism in nature-inspired algorithms,
Journal of Supercomputing 63 (2012) 1–17.
[34] J.E. Cates, A.E. Lefohn, R.T. Whitaker, GIST: an interactive,
GPU-based level set segmentation tool for 3D medical
images, Medical Image Analysis 8 (2004) 217–231.
[35] O. Fluck, C. Vetter, W. Wein, A. Kamen, B. Preim, R.
Westermann, A survey of medical image registration on
[36]
[37]
[38]
[39]
[40]
[41]
[42]
[43]
[44]
[45]
[46]
[47]
[48]
[49]
[50]
[51]
graphics hardware, Computer Methods and Programs in
Biomedicine 104 (2011) 45–57.
D. Lee, I. Dinov, B. Dong, B. Gutman, I. Yanovsky, A.W. Toga,
CUDA optimization strategies for compute- and
memory-bound neuroimaging algorithms, Computer
Methods and Programs in Biomedicine 106 (2012)
175–187.
E.I. Konstantinidis, C.A. Frantzidis, C. Pappas, P.D. Bamidis,
Real time emotion aware applications: a case study
employing emotion evocative pictures and
neuro-physiological sensing enhanced by Graphic Processor
Units, Computer Methods and Programs in Biomedicine 107
(2012) 16–27.
J.A. Wilson, J.C. Williams, Massively parallel signal
processing using the graphics processing unit for real-time
brain–computer interface feature extraction, Frontiers in
Neuroengineering 2 (2009) 1–13.
D. Chen, L. Wang, G. Ouyang, X. Li, Massively parallel neural
signal processing on a many-core platform, Computing in
Science and Engineering 13 (2011) 42–51.
Y. Liu, B. Schmidt, W. Liu, D.L. Maskell, CUDA–MEME:
accelerating motif discovery in biological sequences using
CUDA-enabled graphics processing units, Pattern
Recognition Letters 31 (2010) 2170–2177.
J.D. Veldhuis, S.M. Pincus, M.C. García-Rudaz, M.G. Ropelato,
M.E. Escobar, M. Barontini, Disruption of the joint synchrony
of luteinizing hormone, testosterone, and androstenedione
secretion in adolescents with polycystic ovarian syndrome,
Journal of Clinics in Endocrinology and Metabolism 86 (2001)
72–79.
J.S. Richman, J.R. Moorman, Physiological time series
analysis using approximate entropy and sample entropy,
American Journal of Physiology. Heart and Circulatory
Physiology 278 (2000) H2039–H2049.
CUDA C Best Practices Guide, Nvidia Corporation, Santa
Clara, CA, 2012.
D.B. Kirk, W.W. Hwu, Programming Massively Parallel
Processors: A Hands-On Approach, Morgan Kaufmann
Publishers Inc., San Francisco, CA, USA, 2010.
J. Cohen, M. Garland, Novel architectures: solving
computational problems with GPU computing, Computing
in Science and Engineering 11 (2009) 58–63.
A.R. Brodtkorb, T.R. Hagen, M.L. Sætra, Graphics processing
unit (GPU) programming strategies and trends in GPU
computing, Journal of Parallel and Distributed Computing 73
(2013) 4–13.
D. Horn, Stream reduction operations for GPGPU
applications, in: M. Pharr, R. Fernando (Eds.), GPU Gems 2:
Programming Techniques for High-Performance Graphics
and General-Purpose Computation, Addison-Wesley
Professional, Upper Saddle River, NJ, 2005 (chapter 36).
M. Harris, G.E. Blelloch, B.M. Maggs, N.K. Govindaraju, B.
Lloyd, W. Wang, M. Lin, D. Manocha, P.K. Smolarkiewicz, L.G.
Margolin, P.K. Smolarkiewicz, D.N. Mikushin, V.M.
Stepanenko, D.B. Kirk, W.W. Hwu, D. Kanter, Optimizing
parallel reduction in CUDA, Proceedings of the ACM SIGMOD
21 (13) (2007) 104–110.
M. Harris, S. Sengupta, J.D. Owens, Parallel prefix sum (scan)
with CUDA, in: H. Nguyen (Ed.), GPU Gems 3: Programming
Techniques for High-Performance Graphics and
General-Purpose Computation, Addison-Wesley,
Professional, Boston, 2007 (chapter 39).
A.P. Anokhin, N. Birbaumer, W. Lutzenberger, A. Nikolaev, F.
Vogel, Age increases brain complexity,
Electroencephalography and Clinical Neurophysiology 99
(1996) 63–68.
R.E. Dustman, D.E. Shearer, R.Y. Emmerson, Life-span
changes in EEG spectral amplitude, amplitude variability
c o m p u t e r m e t h o d s a n d p r o g r a m s i n b i o m e d i c i n e 1 1 2 ( 2 0 1 3 ) 189–199
and mean frequency, Clinical Neurophysiology 110 (1999)
1399–1409.
[52] E.R. John, H. Ahn, L. Prichep, Developmental equations for
the electroencephalogram, Science 210 (1980)
1255–1258.
[53] A. Meyer-Lindenberg, The evolution of complexity in human
brain development: an EEG study, Electroencephalography
and Clinical Neurophysiology 99 (1996) 405–411.
[54] D.J. Smit, M. Boersma, H.G. Schnack, S. Micheloyannis, D.I.
Boomsma, H.E. Hulshoff Pol, C.J. Stam, E.J. de Geus, The
199
brain matures with stronger functional connectivity and
decreased randomness of its network, PLoS ONE 7 (2012)
e36896.
[55] A. Fernández, P. Zuluaga, D. Abásolo, C. Gómez, A. Serra,
M.A. Méndez, R. Hornero, Brain oscillatory complexity across
the life span, Clinical Neurophysiology 123 (2012) 2154–2162.
[56] H.B. Xie, J.Y. Guo, Y.P. Zheng, A comparative study of pattern
synchronization detection between neural signals using
different cross-entropy measures, Biological Cybernetics 102
(2010) 123–135.


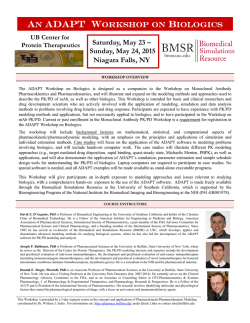
© Copyright 2026