
Household projection 2014-2029
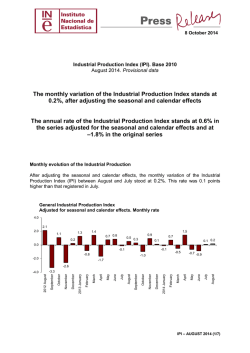
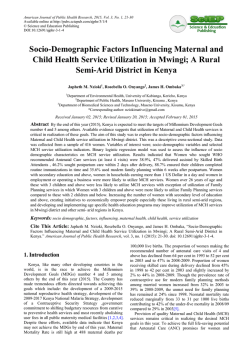
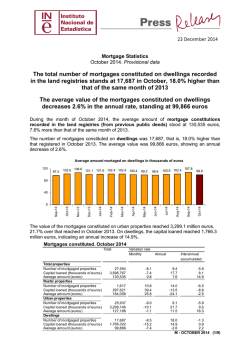
28 October 2014
Household Projection 2014–2029
The INE presents the new statistical operation Household
Projection 2014-2029
If the current trends are maintained, the number of households
would stand at 19.2 millions in 2029, almost a million more than at
present
By Autonomous Community, the greatest growth rates would take
place in Comunidad de Madrid, Región de Murcia and Andalucía.
Only Castilla y León and Principado de Asturias would register a
decrease in the number of households
As an innovation, along with the Population Projections, the INE publishes today, for the first
time, the Household Projection 2014-2029. This new statistical operation, included in the 20132016 National Statistical Plan and in the Annual Programme 20141, is designed to provide
updated information on the number of households and to offer, every two years, a statistical of
the future number of households according to size, over a 15-year period for the national total
and by Autonomous Community and province. It was submitted to the Permanent Commission
of the High Council on Statistics in their meeting of 20 May 2014.
The projection reflects the result that would have the extension of the demographic trends and
social behaviour patterns currently observed on the number of households. Likewise, the
results of said operation are fully consistent with those of the Population Projections that the
INE disseminates today, due to the way they are generated.
According to this projection, the number of households resident in Spain would increase by
951,171 (5.2%) between 2014 and 2029, reaching a figure of 19,204,058. This would happen
despite the drop of the population resident in households, that would decrease by 1,144,374
persons (2.5%) in said period.
This is due to a reduction in the number of persons living in each household. Thus, the average
size of the household would decrease from the current 2.52 persons to 2.34 persons per
household in 2029.
1 Royal Decree 1658/2012, of 7 Decem ber, passing the 2013-2016 National Statistical Plan
and Royal Decree 1017/2013, of 20 Decem ber, passing the Annual Programm e 2014.
1
Household Projection in Spain 2014-2029
Number of
households
on 1 January
Absolute
growth in five
years
2014
18,252,887
326,108
0.36
2019
18,578,994
302,869
0.33
2024
18,881,863
322,194
0.34
2029
19,204,058
Year
Average
annual relative
growth (%)
Evolution of the number of households by size
Between 2014 and 2029 smaller households (one or two persons) would continue growing,
whereas bigger households would decrease, specifically those of five or more persons, thus
keeping the trend of the past years.
Projection of the number of households by size 2014-2029
41,640
47,119
18,252,887
19,204,058
1 person
4,480,391
5,711,125
1,230,734
27.5
2 persons
5,581,768
5,998,563
416,794
7.5
3 persons
3,852,223
3,752,375
-99,848
-2.6
4 persons
3,251,485
2,961,117
-290,368
-8.9
5 or m ore persons
1,087,019
780,877
-306,141
-28.2
2.52
2.34
-0.18
-7.3
Total households
Average size
2014-2029 Growth
Absolute
Relative(%)
Evolution of the rate of households by size 2014-2019
29.7%
30.6% 31.2%
24.5%
21.1%
19.5%
17.8%
15.4%
6.0%
1 person
2 persons
3 persons
2014
4 persons
4.1%
5 or more persons
2029
Those households where only one person lives would show a greater increase in the next 15
years, both in absolute and relative values. In 2029 the number of single-person households
would reach 5.71 million households (29.7% of the total households), with an increase of
27.5% (1.23 millions more) as compared with the beginning of 2014.
The number of persons living alone would go from 9.7% of the total population in 2014 to
12.7% in 2029.
2
Households formed by two persons would still be the most frequent type of household in 2029.
They would reach a figure of 5.99 millions (31.2% of the total), with an increase of 7.5%
(416,794 more) since 2014.
On the other hand, households with three, four, five or more persons would maintain negative
growth rates along the 2014-2029 period. Households formed by three persons would
decrease the least. Households formed by five and more members would decrease from 1.08
millions in 2014 to 780,877 in 2029 (28.2% less).
Evolution of the average size of household
The average size of household would continue decreasing in the 2014-2019 period, in line with
the trend observed in the last censuses (in 1970 the figure was of almost four persons).
More specifically, it would decrease from 2.52 persons per household en 2014 to 2.34 in the
year 2029.
2.86
2002
Projected evolution of the average size of household 20022029
2.76
2005
2.68
2008
2.60
2011
2.52
2014
2.48
2017
2.45
2.41
2.37
2.34
2020
2023
2026
2029
Household projection by Autonomous Community
The number of households would increase in all Autonomous Communities along the 20142029 period, except in Castilla y León (–2.2%) and Principado de Asturias (–1.4%).
In turn, the Autonomous Cities of Ceuta (24.0%) and Melilla (13.7%), Comunidad de Madrid
(12.6%) and Región de Murcia (10.1%) would register growth rates higher than 10%.
The average size of household would decrease in all Autonomous Communities along the
period. Cantabria, Comunidad de Madrid and Galicia would register the greatest decreases,
whereas Canarias, Illes Balears and Cataluña would register the slightest decreases.
Regarding the number of single-person households, Comunidad de Madrid, Región de Murcia
and the Autonomous City of Ceuta would register the greatest increases, higher than 40%.
Aragón, La Rioja and Canarias would register the slightest increases (lower than 15%),
whereas the Autonomous City of Melilla would be the only area where the number of singleperson households would decrease (–20.4%).
3
Porjected growth of the number of households 2014-2029 by
Autonomous Community. Percentages
Ceuta
Melilla
Madrid, Comunidad de
Murcia, Región de
Andalucía
Navarra, Comunidad Foral de
Balears, Illes
Cantabria
Castilla - La Mancha
Canarias
National Total
Extremadura
País Vasco
Galicia
Rioja, La
Cataluña
Aragón
Comunitat Valenciana
Asturias, Principado de
Castilla y León
23.99
13.68
12.62
10.07
9.10
8.89
8.25
7.22
6.22
6.16
5.21
4.99
3.65
2.46
1.33
1.14
1.05
0.96
-1.36
-2.22
-4.0
1.0
6.0
11.0
16.0
21.0
Projection of the number of households by Autonomous Community 2014-2029
Total number of households 2014-2029 Growth
2014
National Total
Andalucía
2029
Absolute
Average size
of household
Relative(%) 2014
2029
% of singleperson
households
2014
2029
18,252,887
19,204,058
951,171
5.21
2.52
2.34
24.5%
29.7%
3,149,346
3,435,979
286,633
9.10
2.65
2.42
22.2%
27.9%
Aragón
538,690
544,366
5,676
1.05
2.43
2.29
26.6%
30.2%
Asturias, Principado de
460,679
454,435
-6,245
-1.36
2.28
2.11
28.9%
34.2%
Balears, Illes
440,987
477,360
36,372
8.25
2.51
2.43
24.1%
27.9%
Canarias
809,216
859,087
49,871
6.16
2.60
2.51
23.4%
24.8%
Cantabria
238,538
255,770
17,233
7.22
2.44
2.17
26.8%
34.3%
1,032,038
1,009,152
-22,885
-2.22
2.37
2.19
27.9%
32.9%
784,359
833,127
48,768
6.22
2.61
2.41
22.7%
27.1%
Cataluña
2,944,905
2,978,602
33,697
1.14
2.49
2.38
24.6%
28.8%
Comunitat Valenciana
1,999,020
2,018,262
19,241
0.96
2.46
2.32
25.7%
30.3%
431,174
452,708
21,533
4.99
2.51
2.29
24.7%
30.3%
Galicia
1,074,642
1,101,082
26,439
2.46
2.54
2.28
23.8%
30.2%
Madrid, Comunidad de
Castilla y León
Castilla - La Mancha
Extremadura
2,499,704
2,815,148
315,444
12.62
2.52
2.27
25.1%
32.0%
Murcia, Región de
531,035
584,500
53,465
10.07
2.74
2.49
20.1%
26.4%
Navarra, Comunidad Foral de
250,704
272,986
22,282
8.89
2.51
2.29
26.0%
32.1%
País Vasco
888,557
920,968
32,411
3.65
2.41
2.20
26.4%
33.1%
Rioja, La
128,912
130,628
1,716
1.33
2.41
2.25
28.1%
31.4%
Ceuta
25,476
31,588
6,112
23.99
3.29
2.88
15.7%
23.6%
Melilla
24,902
28,309
3,407
13.68
3.32
3.30
16.9%
11.8%
4
Methodological note
Household Projection 2014-2029
The Household Projection is a statistical operation compiled from the aggregate results of
several statistical sources, elaborated and disseminated by the INE for the first time in 2014.
It provides a statistical simulation of the number of future households in Spain, of each
Autonomous Community and each province, and their distribution by size, would the
demographic trends and social behaviour patterns currently observed be extended. Due to the
way in which they are compiled, the results are totally consistent with the results of the
Population Projections also disseminated by the INE.
This operation will be published every two years, providing results regarding the next 15 years.
This publication covers the 2014-2029 period.
The necessary data is obtained from the use of municipal registers of the years prior to the
year of compilation, which allows obtaining the tendencies that the population has of living in
a certain type of household according to their sex, age and province of residence. These
tendencies are calculated at least in two different moments, which allows the extrapolation of
their behaviour in the future. The tendencies obtained are applied to the population figures
projected for the future in such a way that it is possible to obtain a simulation of future
households based on their recent behaviour.
There is no international nor European regulation regarding household projections, therefore
the possible projections compiled by other international bodies such as Eurostat or the United
Nations, regarding households in Spain, would respond to their own purposes, methodologies
and hypotheses. Thus, in general, these results would not coincide among one another nor
with the results of this operation.
In this first publication, the information is completed with the publication of the historical series
corresponding to household estimates from 2002 to 2014.
Definitions
Household
This is the person, or group of persons, who regularly reside in a main family dwelling.
Family dwelling
Dwelling intended to be inhabited by one or several persons who are not necessarily related
by kinship and do not form a group.
Size of the household
Number of persons who constitute the household, classified as: households of size 1, of size
2, of size 3, of size 4 and of size bigger than 4.
For further inform ation see INEbase-w w w .ine.es/ en/ w elcom e_en.htm
w w w .ine.es/ prensa/ prensa_en.htm
All press releases at:
Press office: Telephone num bers: 91 583 93 63 / 94 08 – Fax: 91 583 90 87 - [email protected]
Inform at ion Area: Telephone num ber: 91 583 91 00 – Fax: 91 583 91 58 – w w w .ine.es/ infoine
5


© Copyright 2026