
- The Lancet
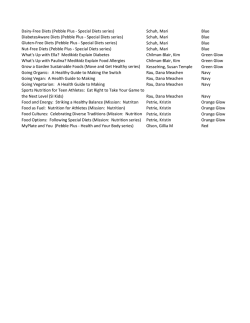
Articles
Dietary quality among men and women in 187 countries in
1990 and 2010: a systematic assessment
Fumiaki Imamura, Renata Micha, Shahab Khatibzadeh, Saman Fahimi, Peilin Shi, John Powles, Dariush Mozaffarian, on behalf of the
Global Burden of Diseases Nutrition and Chronic Diseases Expert Group (NutriCoDE)
Summary
Background Healthy dietary patterns are a global priority to reduce non-communicable diseases. Yet neither worldwide
patterns of diets nor their trends with time are well established. We aimed to characterise global changes (or trends)
in dietary patterns nationally and regionally and to assess heterogeneity by age, sex, national income, and type of
dietary pattern.
Methods In this systematic assessment, we evaluated global consumption of key dietary items (foods and nutrients) by
region, nation, age, and sex in 1990 and 2010. Consumption data were evaluated from 325 surveys (71·7% nationally
representative) covering 88·7% of the global adult population. Two types of dietary pattern were assessed: one reflecting
greater consumption of ten healthy dietary items and the other based on lesser consumption of seven unhealthy dietary
items. The mean intakes of each dietary factor were divided into quintiles, and each quintile was assigned an ordinal
score, with higher scores being equivalent to healthier diets (range 0–100). The dietary patterns were assessed by
hierarchical linear regression including country, age, sex, national income, and time as exploratory variables.
Findings From 1990 to 2010, diets based on healthy items improved globally (by 2·2 points, 95% uncertainty interval
(UI) 0·9 to 3·5), whereas diets based on unhealthy items worsened (–2·5, –3·3 to –1·7). In 2010, the global mean
scores were 44·0 (SD 10·5) for the healthy pattern and 52·1 (18·6) for the unhealthy pattern, with weak intercorrelation
(r=–0·08) between countries. On average, better diets were seen in older adults compared with younger adults, and in
women compared with men (p<0·0001 each). Compared with low-income nations, high-income nations had better
diets based on healthy items (+2·5 points, 95% UI 0·3 to 4·1), but substantially poorer diets based on unhealthy
items (–33·0, –37·8 to –28·3). Diets and their trends were very heterogeneous across the world regions. For example,
both types of dietary patterns improved in high-income countries, but worsened in some low-income countries in
Africa and Asia. Middle-income countries showed the largest improvement in dietary patterns based on healthy
items, but the largest deterioration in dietary patterns based on unhealthy items.
Interpretation Consumption of healthy items improved, while consumption of unhealthy items worsened across the
world, with heterogeneity across regions and countries. These global data provide the best estimates to date of
nutrition transitions across the world and inform policies and priorities for reducing the health and economic
burdens of poor diet quality.
Funding The Bill & Melinda Gates Foundation and Medical Research Council.
Copyright © Imamura et al. Open Access article distributed under the terms of CC BY.
Introduction
Poor quality of diet is a major cause of mortality and
disability worldwide.1 International food programmes
have traditionally focused on food security and
micronutrient deficiency, but the diet-related health
burdens due to non-communicable chronic diseases
(NCDs) are now surpassing those due to undernutrition
in nearly every region of the world.1–4 This trend has
raised the global concern of a so-called nutrition
transition and convergence toward less healthy diets
globally, with growing attention on the need to improve
transnational food policies and overall diets.5–7 However,
the differences in dietary patterns across the world, and
how such dietary patterns are changing with time, are
not well established. An improved understanding of
dietary patterns and changes around the world is crucial
www.thelancet.com/lancetgh Vol 3 March 2015
to inform, design, and implement strategies to reduce
national and global diet-related diseases.1,8
Most previous global analyses of diet have relied on
national-level estimates of food availability (food balance
sheets) from the UN Food and Agricultural Organization
(FAO) or on similar industry-derived data for national
imports and exports or sales.9–13 However, such estimates
might have large errors with respect to actual national
intakes and cannot assess within-country differences
across key population subgroups—eg, by age or sex.13
Other previous studies of global diets have assessed only
small subsets of nations.14 Therefore, absence of data and
understanding of dietary patterns across the world greatly
restricts informed setting of dietary policies and priorities.
Additionally, most analyses of dietary patterns have
summed together greater consumption of more healthy
Lancet Glob Health 2015;
3: e132–42
See Comment page e114
See Online for an
author interview with
Dariush Mozaffarian
Medical Research Council
Epidemiology Unit, Institute of
Metabolic Science, University
of Cambridge School of Clinical
Medicine, Cambridge
Biomedical Campus,
Cambridge, UK
(F Imamura PhD); Department
of Food Science and Human
Nutrition, Agricultural
University of Athens, Athens,
Greece (R Micha PhD); Gerald J
and Dorothy R Friedman
School of Nutrition Science and
Policy, Tufts University,
Boston, MA, USA (R Micha,
D Mozaffarian DrPH, P Shi PhD);
Department of Epidemiology,
Harvard School of Public
Health, Boston, MA, USA
(S Khatibzadeh MD, S Fahimi MD,
D Mozaffarian); and
Department of Public Health
and Primary Care, Cambridge
Institute of Public Health,
Cambridge, UK (S Fahimi,
J Powles MBBS)
Correspondence to:
Dr Fumiaki Imamura, Medical
Research Council Epidemiology
Unit, Institute of Metabolic
Science, Cambridge Biomedical
Campus, University of Cambridge
School of Clinical Medicine,
Cambridge CB2 0QQ, UK
fumiaki.imamura@mrc-epid.
cam.ac.uk
For UN FAO data see
http://faostat3.fao.org/home/E
e132
Articles
items (eg, fruits and fish) and less consumption of
unhealthy items (eg, sodium).13 Yet, the intakes of healthy
versus unhealthy dietary factors might not be concordant
across countries—for example, the Japanese population
consumes high volumes of both fish and sodium.15,16
Little is known about dietary patterns across the world
based on consumption of healthier foods and nutrients
versus consumption of unhealthy foods and nutrients.
We aimed to characterise global changes (or trends) in
dietary patterns nationally and regionally and to assess
heterogeneity by age, sex, national income, and type of
dietary pattern. We analysed global dietary information
derived from individual-based national surveys as part of
our work of the Global Burden of Diseases Nutrition and
Chronic Diseases Expert Group (NutriCoDE).
Methods
Global dietary consumption by country, age, sex,
and time
Our methods for selection of key dietary factors,
identification of surveys, and data extraction and analysis
have been reported.1,15–17 Briefly, in our systematic
assessment, we focused on 20 foods and nutrients
having at least probable or convincing evidence of effects
on major NCDs, including cardiovascular diseases,
diabetes, and diet-related cancers.1,17,18 We systematically
searched, identified, and compiled data from nationally
representative dietary surveys, large subnational surveys
(when national surveys were not available), and UN FAO
food balance sheets; for sodium intake, we additionally
identified surveys assessing urinary sodium.15 In total,
we compiled information from 325 dietary surveys,
including 233 that were nationally representative,
covering 88·7% of the global adult population, of which
154 were undertaken before 2000, with no significant
difference in response rate across years; and on urinary
sodium from 142 surveys (representing 71·9% of the
global adult population).15,16
For every survey, we obtained and assessed information
about survey methods and population characteristics,
and extracted or (in most cases) obtained data directly
from the survey authors for dietary intakes by age, sex,
and time.15–19 We additionally compiled, for all 187 nations,
year-specific data for national availability of ten foods and
ten nutrients. In view of our aim to assess NCDs, we
focused on data from adults (aged ≥20 years) only.17
We evaluated dietary intakes adjusted for a 2000 kcal
per day (8·37 MJ per day) diet15–17 to assess diet quality
independently of diet quantity, and to reduce
measurement error within and across surveys (because
energy intake is related to under-reporting or overreporting of dietary consumption and adjustment for
total energy intake partly corrects the error).20 For all
dietary factors, we developed an age-integrating Bayesian
hierarchical model that estimated the mean intake levels
and its statistical uncertainty for each age-sex-countryyear stratum, accounting for differences in dietary data,
e133
survey methods, representativeness, and sampling and
modelling uncertainty.15–17,21 Our dataset included
estimates of dietary consumption for 26 subgroups (men
and women and 13 age categories from 20–24·9 years to
≥80 years) within all 187 countries with a year 2000
population greater than 50 0001 in 1990 and 2010,
covering 4·42 billion adults across 21 world regions.
Characterisation of dietary patterns
For our analysis, we evaluated 17 of the 20 dietary factors
compiled,17,18 excluding three factors (calcium [we assessed
milk instead]; seafood omega-3s [we assessed fish instead];
and fruit juice, with its equivocal evidence for effects on
major health outcomes). We modelled two different dietary
patterns: one based on relatively high consumption of ten
healthy items (fruits, vegetables, beans and legumes, nuts
and seeds, whole grains, milk, total polyunsaturated fatty
acids, fish, plant omega-3s, and dietary fibre); and another
based on relatively low consumption of seven unhealthy
items (unprocessed red meats, processed meats, sugarsweetened beverages, saturated fat, trans fat, dietary
cholesterol, and sodium). For comparison, we also
modelled a third overall dietary pattern that incorporated
all 17 dietary factors together.
To derive a score for each pattern, the mean age-specific,
sex-specific, and nation-specific intakes of each dietary
factor in 2010 were divided into quintiles, based on all
4862 age-specific, sex-specific, and country-specific strata.
Each quintile was assinged an ordinal score. Higher
scores were given to quintiles with higher mean intakes of
healthier foods (1 to 5 points). Of unhealthier foods,
higher scores were given to quintiles with lower mean
intakes (5 to 1 points). For each population stratum, scores
across different dietary items were summed to obtain the
total score for each of three dietary patterns: healthy items,
unhealthy items, and all items combined. For
comparability, every score was standardised to a 100-point
scale (higher scores equivalent to healthier diets). To
optimise comparability of trends over time, the quintile
cutpoints for every dietary factor in 2010 were used to
generate quintile cutpoints for every dietary item in 1990.
Statistical analysis
Each dietary pattern was assessed by country, sex, age,
and national income.19 For these analyses, we modelled
hierarchical linear regression in which age and sex strata
were nested within every nation and random intercepts
were estimated.22 To estimate national, regional, and
global means, each age and sex stratum was weighted by
the proportion of adults within each contributing country.
Every model included age, sex, and national income
simultaneously to assess whether any of these key
sociodemographic factors were independently associated
with the dietary pattern score. To test linear trends in
dietary patterns across age and national income, ordinal
categories of age and income were assessed as continuous
variables. Similar models were used to test trends in
www.thelancet.com/lancetgh Vol 3 March 2015
Articles
dietary patterns from 1990 to 2010, after standardisation
of age and sex distributions to 2010 to assess changes
independent of varying demographics with time.
Statistical uncertainty was quantified with Monte Carlo
simulations.1,15,16,21 We simultaneously propagated the
uncertainty in the estimated dietary intake of all items in
every age, sex, country, and time stratum by randomly
drawing from the 95% uncertainty interval (UI) of intake
and combining results across 1000 iterations. The
95% UIs were derived from estimated SEs based on
within-iteration and between-iteration variances.23 Using
the median and SE, we evaluated Wald statistics (square
of β/SE) to test the null hypothesis for each result from
the regression analyses.
Role of the funding source
The funders had no role in the study design, study
conduct, data analysis, data interpretation, or writing of
the report. All authors had full access to all the data in
the study and take responsibility for the integrity of the
data and the accuracy of the data analysis. The
corresponding author had final responsibility to submit
the report for publication.
Results
In 2010, consumption levels of key foods and nutrients
related to NCDs varied across their quintile categories by
between two-fold to more than 50-fold (table 1, appendix
pp 2–41). The largest variation was noted for mean
wholegrain consumption (10th to 90th percentiles:
12–157 g per day), fruit juice (1·4–86 g per day), nuts and
seeds (1·5–19·4 g per day), beans and legumes (1·6–147 g
per day), milk (33–230 g per day), seafood omega-3 fats
(22–553 mg per day), plant omega-3 fats (0·2–1·5 g per
day), sugar-sweetened beverages (33–293 g per day), and
processed meats (3·9–34 g per day). Smaller but still
substantial variation was seen for saturated fat, trans fat,
cholesterol, and sodium. Between the 17 dietary factors
contributing to dietary patterns, correlations across
countries were moderate or weak (r=–0·44 to 0·48).
The mean (SD, range) global dietary pattern scores out
of a maximum (healthiest) of 100 were 44·0 (10·5,
13·8–64·5) on the basis of ten healthy foods and
nutrients, 52·1 (18·6, 15·2–93·4) on the basis of seven
unhealthy foods and nutrients, and 51·9 (9·3, 27·5–75·3)
on the basis of all 17 foods and nutrients (table 2,
appendix pp 42–45). As expected, both the healthy pattern
See Online for appendix
Quintiles determined by all age-specific, sex-specific, and country-specific estimates
(n estimates=4862)*
1st
2nd
3rd
4th
5th
Healthy items
Wholegrains, g per day
12 (1·0–18)
24 (19–31)
40 (31–56)
70 (56–89)
157 (89–477)
Fruits, g per day
57 (17–72)
88 (72–101)
114 (101–131)
151 (131–174)
204 (174–395)
Fruit juices, g per day†‡
10 (4·9–18)
27 (18–36)
Vegetables, g per day
73 (24–95)
109 (95–119)
130 (119–144)
160 (144–182)
Fish, g per day
11 (4·8–15)
18 (15–22)
26 (22–30)
35 (30–41)
Nuts and seeds, g per day
Beans and legumes, g per day
1·4 (0·0–4·8)
1·5 (0·1–2·3)
5·1 (4·0–6·8)
9·5 (6·8–12·5)
86 (62–298)
222 (182–463)
52 (41–99)
19·4 (12·5–192)
14 (7·1–20)
27 (20–35)
57 (35–97)
147 (97–472)
Milk, g per day †
33 (7–56)
76 (56–103)
123 (103–141)
160 (141–188)
230 (188–470)
Dietary fibre, g per day
14 (7–16)
18 (16–19)
21 (19–22)
Polyunsaturated fat, % energy
Seafood omega-3, mg per day fat‡
Plant omega-3 fat, g per day
Calcium, mg per day‡
1·6 (0·1–7·1)
3·1 (2·3–4·0)
48 (36–62)
2·8 (1·1–3·4)
22 (3·7–40)
4·0 (3·5–4·4)
56 (40–70)
4·9 (4·4–5·3)
95 (70–141)
24 (22–26)
5·9 (5·3–6·5)
215 (141–322)
28 (26–41)
7·9 (6·5–12·9)
553 (322–5202)
0·2 (0·0–0·4)
0·5 (0·4–0·6)
0·7 (0·6–0·8)
1·1 (0·8–1·2)
399 (288–461)
506 (461–553)
611 (553–658)
711 (658–786)
883 (786–1272)
1·5 (1·2–5·7)
137 (105–195)
293 (196–1239)
Unhealthy items
Sugar-sweetened beverages, g per day†
33 (6·0–45)
57 (45–69)
85 (69–105)
Unprocessed red meats, g per day
23 (2·6–28)
34 (28–40)
47 (40–53)
60 (53–71)
84 (71–138)
Processed meats, g per day
3·9 (1·8–5·1)
6·7 (5·2–9·2)
12 (9·2–16)
20 (16–26)
34 (26–76)
Saturated fat, % energy
7·1 (2·2–8·4)
9·1 (8·4–9·9)
11 (9·9–12·0)
13·2 (12·0–14·1)
16·7 (14·1–28·2)
Trans fat, % energy
0·6 (0·2–0·7)
0·8 (0·7–0·9)
1·0 (0·9–1·0)
1·1 (1·0–1·3)
1·6 (1·3–6·8)
220 (204–236)
250 (236–264)
281 (264–296)
321 (297–455)
2·9 (2·6–3·1)
3·5 (3·1–3·7)
4·0 (3·7–4·2)
Cholesterol, mg per day
Sodium, g per day
182 (93–204)
2·3 (1·4–2·6)
4·6 (4·2–6·4)
Data are the median (range) of mean consumption levels in each quintile. *Combining estimates of mean consumption levels across 13 age categories from 20–24·9 to
>80 years in 5-year increments, men and women, and 187 countries. †To convert units to servings per day, divide by 226·8 (8 oz). ‡Fruit juice and calcium were not included
in the calculation of diet pattern scores because of equivocal evidence for effects of fruit juice on major health outcomes and because calcium consumption was highly
correlated with milk consumption (Spearman r=0·75), which was already included in the diet pattern. Similarly, consumption of seafood omega-3 polyunsaturated fatty acid
(PUFA) was not included in the calculation of diet pattern scores because of high correlation with fish consumption (r=0·80).
Table 1: Dietary consumption of selected foods and nutrients among men and women in 187 countries in 2010
www.thelancet.com/lancetgh Vol 3 March 2015
e134
Articles
score and the unhealthy pattern score were moderately
associated with the overall score (Spearman r=0·63 for
healthy pattern score; r=0·70 for unhealthy pattern
score). By contrast, the healthy pattern and unhealthy
pattern had very little intercorrelation across countries
(r=–0·08, p=0·14).
For all three patterns, older adults had better dietary
patterns than did younger adults (table 2). On average,
women also had better dietary patterns than did men.
Conversely, substantial differences were noted across the
three dietary patterns by national income. Higher national
income was associated with better quality for the healthy
dietary pattern, accounting for 15·7% of between-country
variability of the score (p=0·0005), and with much worse
quality for the unhealthy dietary pattern, accounting for
46·9% of between-country variability (p<0·0001).
Compared with low-income countries, high-income
countries had higher healthy dietary pattern scores
(adjusted mean difference 2·5, 95% UI 0·3–4·1), but
substantially lower unhealthy dietary pattern scores.
Unhealthy dietary pattern scores were also substantially
lower in upper middle-income countries (–25·2; 95% UI
–30·2 to –20·2) and lower middle-income (–18·5, –23·7 to
–13·2) countries than in low-income countries. In posthoc analysis, high-income nations showed a nonsignificant positive correlation between the two types of
Score based on greater Score based on lesser
consumption of seven
consumption of ten
healthy dietary items unhealthy dietary items
Global
Score based on
17 dietary items
44·0 (10·5)
52·1 (18·6)
51·9 (9·3)
50·3 (9·4)
Sex
Men
42·4 (10·5)
50·6 (18·8)
Women
46·0 (10·6)
53·8 (18·5)
53·7 (9·3)
p value*
<0·0001
<0·0001
<0·0001
Age, years
20–29
36·0 (10·0)
45·8 (18·5)
44·0 (9·4)
30–39
39·4 (10·3)
46·3 (18·6)
46·5 (9·6)
49·0 (9·7)
40–49
42·2 (10·7)
47·9 (18·7)
50–59
44·4 (10·7)
50·4 (18·4)
51·5 (9·4)
60–69
45·9 (10·7)
53·2 (18·1)
53·6 (9·0)
70–79
45·6 (10·8)
54·0 (18·0)
53·7 (8·9)
≥80
44·7 (10·7)
54·2 (18·0)
53·2 (8·9)
p value for trend*
<0·0001
<0·0001
<0·0001
Country income level
High (n=47)
47·0 (9·3)
37·4 (11·2)
48·6 (8·1)
Upper middle (n=53)
45·2 (11·3)
46·2 (12·8)
50·1 (8·7)
Lower middle (n=51)
40·9 (10·9)
55·0 (15·3)
51·1 (9·4)
Low (n=36)
42·9 (9·6)
75·9 (12·5)
59·9 (7·3)
p value for trend*
0·0005
<0·0001
0·0006
Data are mean (SD). Possible range of each score is from 0 (less healthy) to 100 (more healthy). *p values for
differences by sex or across ordinal categories of age or country income were estimated using hierarchical regression
analysis accounting for age–sex distribution. Age, sex, and country income (high, ≥US$12 475; upper middle,
US$4037–12 474; lower middle, US$1025–4036; low, <US$1024) were mutually adjusted when assessing statistical
significance of each.
Table 2: Global dietary patterns among men and women in 187 countries in 2010
e135
pattern scores (r=0·27), whereas low-income nations
showed an inverse correlation (r=–0·24; p>0·05 each;
pinteraction>0·1 by national income). These differences
between healthy and unhealthy foods were largely masked
when only one overall dietary pattern score was assessed.
Substantial heterogeneity was evident in diet quality
across nations, and comparisons across countries also
varied substantially for the healthy versus unhealthy diet
patterns (figures 1–3, appendix pp 42–45). As noted in
analyses by national income, this divergence of national
diet quality based on healthy versus unhealthy items was
largely masked when only overall diet patterns were
considered. For example, India ranked 70th of
187 countries for the overall diet pattern (50·6 points,
95% UI 45·5–56·0), but ranked high (23rd) for the score
based on fewer unhealthy items (70·0, 63·0–77·0) and
ranked low (149th) for the score based on more healthy
items (33·8, 27·4–40·4). Similar trends were noted in
many low-income countries in southeast Asia and subSaharan Africa.
Dietary patterns often varied greatly even between
neighbouring countries (figure 1, appendix p 46). For
example, dietary patterns based on healthy items were
poor in Argentina (20·8 points) but moderate in Brazil
(40·7); whereas dietary patterns based on fewer unhealthy
items were very poor in Brazil (24·3), but moderate in
Argentina (42·4). Similar heterogeneity was evident
between Caribbean neighbours (eg, Barbados and
Dominica) and southeast Asian neighbours (eg, Laos and
Thailand).
Between 1990 and 2010, global dietary patterns based
on more healthy items improved modestly (by 2·2 points,
95% UI 0·9–3·5; figure 4, appendix pp 47–51), indicating
greater consumption of these more healthy foods and
nutrients. By contrast, global dietary patterns based on
fewer unhealthy items worsened (–2·5; 95% UI –3·3 to
–1·7), indicating concomitant increased consumption of
these unhealthy foods and nutrients. These trends were
weakly correlated across countries (r=–0·08 overall,
range –0·15 to 0·09 in the four national-income
categories; p>0·05 each).
These trends did not significantly vary by age or sex
(p>0·4 each), but significantly varied by national income
(p<0·02 each; appendix p 47 figure S24). Nations with
higher incomes had larger improvements in diet patterns
based on healthy items than did nations with lower
incomes; for example, by 2·5 points (95% UI 0·5–4·6)
comparing high-income to low-income countries. By
contrast, middle-income nations showed the largest
worsening in diet patterns based on unhealthy items:
compared with high-income nations, greater worsening by
2·5 points (95% UI 0·5–4·5) and by and 2·8 points
(95% UI 0·9–4·8) was noted in upper-middle nations and
lower-middle income nations, respectively. Although most
world regions showed modest improvements in dietary
patterns between 1990 and 2010 on the basis of more
healthy items, such improvements were generally not
www.thelancet.com/lancetgh Vol 3 March 2015
Articles
noted in the poorest regions, including in sub-Saharan
Africa and the Andean states of Latin America. Conversely,
most regions of the world showed substantial declines in
diet quality based on increased consumption of unhealthy
items. The exceptions included many of the wealthiest
regions including the USA and Canada, western Europe,
Dietary patterns based on more healthy items
Dietary patterns based on fewer unhealthy items
Overall dietary patterns
100 (best)
50
0 (worst)
Missing information
Figure 1: Global dietary patterns among men and women in 187 countries in 2010
Values represent degrees of adherence to each dietary pattern, ranging from 0 (least healthy) to 100 (most healthy).
www.thelancet.com/lancetgh Vol 3 March 2015
e136
Articles
Figure 2: Dietary pattern
among men and women in
187 countries in 2010 based
on greater consumption of
ten more healthy items
Values represent degrees of
adherence to each dietary
pattern, ranging from 0 (least
healthy) to 100 (most
healthy). 187 countries are
ordered by scores among
adults aged 20–29 years. Lines
show error bars for each
country, which represent the
lower side of the 95%
uncertainty interval for the
lowest age-specific estimate
and the upper side of the 95%
uncertainty interval for the
highest age-specific estimate.
e137
World, by ages
World, overall
Dominican Republic
Brazil
Finland
Bulgaria
The Netherlands
Canada
Norway
Denmark
Latvia
Mozambique
Kuwait
Iran
Namibia
Albania
Bolivia
Italy
Eritrea
Ghana
Bhutan
Somalia
Comoros
Austria
Vietnam
Haiti
Germany
Peru
Sweden
Philippines
Ethiopia
Luxembourg
Poland
Togo
Federated States of Micronesia
Afghanistan
Bosnia and Herzegovina
South Korea
Slovakia
Tanzania
South Africa
Djibouti
DR Congo
Brunei
France
Timor-Leste
Madagascar
North Korea
Burundi
Ecuador
Romania
Rwanda
Ireland
Tonga
Cuba
India
Saint Vincent and the Grenadines
USA
Ukraine
Czech Republic
Chile
Samoa
Singapore
Lesotho
Belarus
Fiji
Zambia
Iceland
China
Moldova
Malawi
Marshall Islands
Congo
Yemen
Liberia
Kiribati
Nepal
Georgia
Mongolia
Indonesia
Azerbaijan
Solomon Islands
Uzbekistan
Kazakhstan
Tajikistan
Kyrgyzstan
Occupied Palestinian Territory
Belgium
Uruguay
Argentina
Papua New Guinea
Hungary
Vanuatu
Armenia
Turkmenistan
Barbados
Seychelles
Mauritius
Chad
Greece
Guatemala
Central Africa
Mali
Jordan
Cape Verde
Cyprus
Israel
Tunisia
Turkey
Maldives
Gambia
Senegal
Sierra Leone
Burma
Lebanon
Grenada
United Arab Emirates
Colombia
Panama
Costa Rica
Qatar
Mexico
Sri Lanka
Oman
El Salvador
Laos
Syria
New Zealand
Jamaica
Nigeria
Bahrain
Swaziland
Spain
Russia
Paraguay
Serbia
Equatorial Guinea
Nicaragua
Niger
Portugal
Malaysia
Bahamas
Venezuela
Belize
Cameroon
Angola
Slovenia
Saint Lucia
Kenya
Côte d’Ivoire
Uganda
Guinea
Botswana
Mauritania
Montenegro
Lithuania
Thailand
Guinea-Bissau
Egypt
Trinidad and Tobago
Suriname
Australia
Dominica
Antigua and Barbuda
Benin
Sudan
Occupied Palestinian Territory
Iraq
Morocco
Croatia
Sâo Tóme and Principe
Andorra
Malta
Algeria
UK
Macedonia
Estonia
Gabon
Libya
Switzerland
Burkina Faso
Cambodia
Taiwan
Guyana
Japan
Bangladesh
Honduras
Saudi Arabia
Zimbabwe
0
20
40
60
Points
80
100
Age groups
(years)
20−29
30−39
40−49
50−59
60−69
70−79
≥80
0
20
40
60
Points
80
100
www.thelancet.com/lancetgh Vol 3 March 2015
Articles
World, by ages
World, overall
Brunei
Uruguay
Yemen
Iraq
South Korea
Saudi Arabia
Mauritius
Maldives
Azerbaijan
Iran
Italy
El Salvador
Equatorial Guinea
Honduras
Peru
Montenegro
Moldova
Chile
Philippines
Vanuatu
Jordan
Timor-Leste
Oman
Japan
Luxembourg
Kiribati
Ireland
Malaysia
Argentina
Vietnam
Panama
Algeria
Costa Rica
United Arab Emirates
Venezuela
Georgia
Cyprus
Switzerland
France
Finland
Taiwan
Bolivia
Syria
Federated States of Micronesia
Bahrain
Qatar
Thailand
Cape Verde
Poland
Portugal
Norway
Hungary
Mongolia
Armenia
Seychelles
Ukraine
Serbia
Sweden
Samoa
The Netherlands
UK
Ecuador
Andorra
Spain
New Zealand
Malta
Romania
Marshall Islands
Tonga
Fiji
Kuwait
Macedonia
Colombia
Canada
Kazakhstan
USA
Paraguay
Denmark
Estonia
Australia
Slovenia
Brazil
Germany
Iceland
Belgium
Russia
Belarus
Croatia
Czech Republic
Lithuania
Slovakia
Latvia
Austria
Burundi
Rwanda
Malawi
Eritrea
Ethiopia
North Korea
Somalia
Sierra Leone
Haiti
Guyana
Madagascar
Chad
Bangladesh
Ghana
Suriname
Mozambique
Benin
Uganda
DR Congo
Zambia
Burkina Faso
Lesotho
Jamaica
Togo
Tanzania
Côte d’Ivoire
Liberia
Nepal
Guinea
China
India
Bhutan
Tajikistan
Cuba
Mali
Comoros
Cameroon
Laos
Saint Vincent and the Grenadines
Nigeria
Gambia
Dominica
Afghanistan
Solomon Islands
Niger
Guatemala
Senegal
Swaziland
Belize
Antigua and Barbuda
Trinidad and Tobago
Sâo Tóme and Principe
Pakistan
Sudan
Guinea-Bissau
Indonesia
Congo
Djibouti
Bosnia and Herzegovina
Israel
Botswana
Grenada
Papua New Guinea
Barbados
Nicaragua
Dominican Republic
Cambodia
Uzbekistan
Zimbabwe
Kenya
Lebanon
Morocco
Singapore
Saint Lucia
Central Africa
Turkmenistan
Namibia
Sri Lanka
Egypt
Tunisia
Libya
South Africa
Mauritania
Occupied Palestinian Territory
Age groups
Myanmar
Bulgaria
(years)
Kyrgyzstan
20−29
Gabon
30−39
Albania
Turkey
40−49
Greece
50−59
Mexico
60−69
Angola
Bahamas
70−79
0
20
40
60
Points
www.thelancet.com/lancetgh Vol 3 March 2015
80
100
≥80
0
20
40
60
Points
80
100
Figure 3: Dietary pattern
among men and women in
187 countries in 2010 based
on less consumption of
seven unhealthy items
Values represent degrees of
adherence to each dietary
pattern, ranging from 0 (least
healthy) to 100 (most
healthy). 187 countries are
ordered by scores among
adults aged 20–29 years. Lines
show error bars for each
country, which represent the
lower side of the 95%
uncertainty interval for the
lowest age-specific estimate
and the upper side of the 95%
uncertainty interval for the
highest age-specific estimate.
e138
Articles
Changes in dietary patterns based on more healthy items
Changes in dietary patterns based on fewer unhealthy items
Changes in overall dietary patterns
25 (improved)
0
–25 (worsened)
Missing information
Figure 4: Changes in dietary patterns from 1990 to 2010 among men and women in 187 countries
Top: changes in dietary pattern scores based on greater consumption of ten healthful foods and nutrients. Middle: changes in dietary pattern scores based on less
consumption of seven unhealthful foods and nutrients. Bottom: changes in dietary pattern scores based on both healthful and unhealthful foods and nutrients.
Values represent degrees of adherence to each dietary pattern, ranging from 0 (least healthful) to 100 (most healthful). Scores in 1990 were standardised to age and
sex distribution in 2010.
e139
www.thelancet.com/lancetgh Vol 3 March 2015
Articles
Australia, and New Zealand, where consumption of these
unhealthy items modestly decreased. Of note, for these
world regions and nations, this improvement was
superimposed on a poor starting score in 1990 (appendix
pp 47–49 figure S24). Thus, despite some improvement by
2010, dietary scores for unhealthy items in wealthy
countries remained among the worst in the world. As seen
for absolute scores, most of these differences in national
and regional trends were far less apparent when examining
the dietary pattern aggregating both healthy and unhealthy
dietary items (figure 4).
Discussion
In this systematic assessment of different dietary
patterns across 187 nations in 1990 and 2010, we noted
that diet quality varied by age, sex, national income, time,
and world region. Consumption of healthier foods and
nutrients has modestly increased during the past two
decades; however, consumption of unhealthy foods and
nutrients has increased to a greater extent. Improvements
in healthier foods were seen in high-income and middleincome countries; by contrast, no improvements were
seen in the poorest regions. Notably, we identified the
substantial variations of diets across the world depending
on whether diet quality was characterised by greater
consumption of healthier or lesser consumption of
unhealthier foods and nutrients. This heterogeneity went
largely undetected when diet quality was defined by
aggregation of both healthy and unhealthy items. To our
knowledge, this is the first investigation to analyse data
derived from individual-based surveys and to evaluate
current worldwide dietary patterns and their changes
over time, providing the best estimates to-date of
nutrition transitions across the world (panel).
The 17 foods and nutrients included in this analysis are
especially relevant for their effects on obesity and
NCDs.24,25 Suboptimum dietary patterns based on these
factors are linked to substantial burdens of morbidity,
premature mortality, and medical costs.1,2 Indeed, it has
been estimated that, by 2020, nearly 75% of all deaths
and 60% of all disability-adjusted life years will be
attributable to NCDs,1,26 and most of the key causes of
these conditions are dietary or strongly diet-related.1 Our
results characterising dietary patterns across the world
have implications for the reduction of disease and
economic burdens of poor diet by lowering the
consumption of unhealthier foods, increasing the
consumption of healthier foods, or both.
Our findings also have implications for undernutrition.
Whereas globally valid data for consumption levels of
most micronutrients are not currently available, the
healthy dietary factors included in our analysis are the
major contributors to many essential nutrients
associated with a range of health outcomes in both lowincome and high-income nations.27 Recent research has
shown associations between suboptimum dietary
patterns and poor pregnancy and fetal growth
www.thelancet.com/lancetgh Vol 3 March 2015
outcomes.28,29 Although caloric deficits and disease
burdens other than those of NCDs must not be
overlooked in some low-income countries,1,3,11 the trends
in dietary patterns we note show the urgent need to
focus on improvement of diet quality among poor
populations worldwide. Left unaddressed, undernutrition and deficiency diseases will be rapidly eclipsed
in these populations by obesity and NCDs, as is already
occurring in India, China, and other middle-income
nations.1–4,11 Notably, many of the differences by national
income were minimised or not seen when examining
the overall diet pattern that aggregated both healthy and
unhealthy foods and nutrients. Similarly, the Prospective
Urban Rural Epidemiology study, which used one overall
diet pattern score—the Alternate Healthy Eating Index
(AHEI)13—reported no significant association between
national income and diet quality across 17 nations.14 Diet
pattern scores such as the AHEI were originally
developed to assess diet–disease associations within
fairly homogeneous, high-income populations.13 Our
novel findings show that associations between
socioeconomic status and diet quality might vary
substantially for diet patterns based on healthy versus
unhealthy items, and also that such diet patterns are
only weakly correlated. Different policies could be
influencing the two dietary patterns—eg, transnational
marketing and investment often promotes consumption
of unhealthy foods, such as snacks in Thailand and soft
drinks in Mexico,5,6 whereas governmental strategies
attempt to promote consumption of healthy food, such
as the multifocal polices in Norway and nutrition
education in South Korea.5,8 When combined with
assessment of nation-specific policies, our observations
derived from individuals’ diets should help to understand
and characterise influences of business, agriculture, and
health policies on consumption of healthy food,
consumption of unhealthy food, and population health
in different countries.
Although a monotonic relation between wealth and
diet quality has been frequently proposed,30 we noted
high-income nations at both extremes of healthy dietary
patterns. These global observations are supported by
previous nation-specific findings that within-country
socioeconomic status might correlate with either better
or worse diets depending on the dietary factors in
question.11,30 For instance, in southern Europe, lower
socioeconomic status is associated with higher
consumption of fruits and vegetables, possibly reflecting
greater domestic production in rural areas.30,31 We
identified substantial variation in both healthy and
unhealthy diet patterns by national income, indicating
much more complex relations between socioeconomic
status and diet quality than has commonly been assumed.
Our data for improved global intakes of healthier
foods between 1990 and 2010 are supported by country
estimates of food availability.5,9,11 These improvements
might be attributable to advances in agricultural
e140
Articles
Panel: Research in context
Systematic review
We did not do any systematic search in the initial planning for this study. However,
through extensive collaborations with experts of the UN’s organisations and global health
projects, we were aware of no global data derived from surveys assessing individuals’
diets. Therefore, there is no evidence on overall diet quality across the world derived from
individuals’ diets, including their international variations, associations with key
demographic variables, and trends with time. Moreover, evidence is absent for distinct
types of dietary patterns based on healthy items versus unhealthy items, although these
two classes of dietary factors are consumed differently across the world.
Interpretation
To our knowledge, this is the first study to evaluate dietary patterns among adults across
the world. In 187 countries between 1990 and 2010, dietary patterns and their trends
over time varied substantially depending on differences between healthy and unhealthy
foods. The global variations were largely undetectable if we evaluated one scale of diet
quality, as has been previously done.13,14 Global public health should recognise diverse
dietary trends based on healthy versus unhealthy foods, identify determinants of this
diversity, and improve strategies for global, transnational, and domestic policy actions
with a joint consideration of both healthy and unhealthy foods.
practices, storage, transport, and out-of-season
availability of healthier foods, as well as increased
recognition of the importance of healthier foods to
minimise NCDs.11 Yet, notably, improvements were not
seen in many of the lowest-income nations. Causes of
this disparity need to be fully characterised and might
be multifaceted and region-specific. For instance, a
failure to increase more healthy foods could reflect
unguided economic transition, such as liberalisation
and investment for marketing of unhealthy products in
a wealthy segment of a population;6,11 in northwest subSaharan Africa, for example, food prices have increased
and diet quality has worsened.32 Domestic and
international conflict could affect diets. For example,
conflicts in the DR Congo (1996–2008) and
neighbouring countries have impeded both food
production and trade.33 Our work should help to link
these possible economic and political factors to actual
diets and to assess determinants of the potential
divergence6 in consumption of healthy foods in the
poorest nations in the world.
By contrast with improving global trends based on
consumption of healthy foods, our findings show that
the consumption of unhealthy foods has been worsening.
Such trends have been speculated about previously5,8,9,11,34
and are now supported by our individual-level data. Yet,
our findings indicate no single global convergence of
nutrition transition into homogeneously unhealthy diets.
Moreover, our findings suggest that not all nations have
been increasing their intake of unhealthy foods to the
same extent. Indeed, most high-income nations are
actually showing reductions in consumption of unhealthy
foods. Together with the increasing consumption of
healthy foods, these results could at least in part explain
the observed reductions in blood pressure, blood
e141
cholesterol, and cardiovascular mortality in the USA,
Canada, and western Europe.1,4 Yet, despite the
improvements in dietary patterns in these high-income
nations, our findings show that they are still among the
worst in the world, especially for consumption of
unhealthy foods.1,4
Our investigation has several strengths. We included
all available global data derived from individual-level
dietary surveys, most of which were nationally
representative, and further supplemented by FAO food
balance sheets. Although not perfect, these data provide
the most valid information so far about global dietary
intakes. We included major dietary risk factors for NCDs,
the leading causes of morbidity and mortality in the
world. We assessed differences by country, age, sex,
national income, and time; characterised diet patterns
separately based on healthy items versus unhealthy
items; and provided a novel demonstration of the
divergent correlates and trends in these patterns.
Our study has several potential limitations. We did not
assess within-country variations of diets and
socioeconomic characteristics, and further studies
should investigate how diet quality varies within
countries during this time of global nutrition
transition.6,11 Globally valid and reliable information
about other potentially relevant dietary factors, for
example extent of food processing or glycaemic load, is
not currently available.34 Yet these factors are inversely
correlated with intakes of minimally processed foods
such as the healthy items we evaluated, and so our
patterns would at least partly capture differences in
these other factors. Although we made extensive efforts
to minimise bias and incorporate heterogeneity and
uncertainty, individual-based data are subject to
measurement errors, and were incomplete for some
regions, dietary factors, and years. These limitations
were incorporated into uncertainty in the analysis, but
could cause sampling bias, information bias, or both.
Dietary patterns were not derived through agnostic
methods, such as factor analysis. Instead, we aimed to
assess dietary patterns related to NCDs, rather than
identify novel patterns. Although we distinguished
between healthy and unhealthy items, different items
within each category were equally weighted. Yet, each of
these dietary factors are relevant for different NCDs and
other conditions.
In conclusion, global diet quality varies substantially by
age, sex, and national income, and fairly independent
heterogeneity is evident for diet patterns based on eating
more healthy versus fewer unhealthy foods and nutrients.
Increases in unhealthy patterns are outpacing increases
in healthy patterns in most world regions. In view of the
disease burdens associated with suboptimum diet quality,
these findings emphasise the need to better elucidate the
societal, policy, and food industry determinants of these
differences and trends, and to implement policies to
address these inequities and improve diet quality globally.
www.thelancet.com/lancetgh Vol 3 March 2015
Articles
Contributors
FI and DM conceived and designed the study. SK, RM, SF, PS, JP, and DM
acquired the data. FI, SK, RM, SF, PS, JP, and DM interpreted the data.
FI and DM drafted the report. FI, SK, RM, SF, PS, JP, and DM critically
revised and approved the final report. JP and DM obtained the funding.
Declaration of interests
DM reports ad hoc honoraria for one-time scientific presentation/review
on diet from Quaker Oats , Pollock Institute, and Bunge; ad hoc
consulting for Nutrition Impact, Amarin, AstraZeneca, and Life Sciences
Research Organization; has been on the advisory board for the Unilever
North America Scientific Advisory Board; and has received royalties
from UpToDate for an online chapter on fish oil. Other authors declare
no competing interests.
Acknowledgments
The study was sponsored by The Bill & Melinda Gates Foundation, and
and FI was supported by Medical Research Council Unit Programme
number MC_UU_125015/5. We thank all contributors (appendix
pp 52–53).
References
1
Lim SS, Vos T, Flaxman AD, et al. A comparative risk assessment of
burden of disease and injury attributable to 67 risk factors and risk
factor clusters in 21 regions, 1990-2010: a systematic analysis for the
Global Burden of Disease Study 2010. Lancet 2012; 380: 2224–60.
2
Lopez AD, Mathers CD, Ezzati M, Jamison DT, Murray CJL.
Measuring the global burden of disease and risk factors, 1990–2001.
In: Lopez AD, Mathers CD, Ezzati M, Jamison DT, Murray CJL, eds.
Global Burden of Disease and Risk Factors. Washington, DC: The
International Bank for Reconstruction and Development/The
World Bank Group, 2006.
3
De Onis M, Blössner M, Borghi E, Frongillo EA, Morris R.
Estimates of global prevalence of childhood underweight in 1990
and 2015. JAMA 2004; 291: 2600–06.
4
Lozano R, Naghavi M, Foreman K, et al. Global and regional
mortality from 235 causes of death for 20 age groups in 1990 and
2010: a systematic analysis for the Global Burden of Disease Study
2010. Lancet 2012; 380: 2095–128.
5
Keats S, Wiggins S. Future diets: implications for agriculture and
food prices. London: The Overseas Development Institute; 2014.
6
Hawkes C. Uneven dietary development: linking the policies and
processes of globalization with the nutrition transition, obesity and
diet-related chronic diseases. Global Health 2006; 2: 4.
7
Vandevijvere S, Monteiro C, Krebs-Smith SM, et al. Monitoring and
benchmarking population diet quality globally: a step-wise
approach. Obes Rev 2013; 14: 135–49.
8
Lachat C, Otchere S, Roberfroid D, et al. Diet and physical activity
for the prevention of noncommunicable diseases in low- and
middle-income countries: a systematic policy review. PLoS Med
2013; 10: e1001465.
9
Ezzati M, Riboli E. Behavioral and dietary risk factors for
noncommunicable diseases. N Engl J Med 2013; 369: 954–64.
10 Monteiro CA, Moubarac J-CC, Cannon G, et al. Ultra-processed
products are becoming dominant in the global food system.
Obes Rev 2013; 14: 21–28.
11 Kennedy G, Nantel G, Shetty P. Globalization of food systems in
developing countries: impact on food security and nutrition.
FAO Food Nutr Pap 2004; 83: 1–300.
12 Basu S, Yoffe P, Hills N, Lustig RH. The relationship of sugar to
population-level diabetes prevalence: an econometric analysis of
repeated cross-sectional data. PLoS One 2013; 8: e57873.
13 Vandevijvere S, Monteiro C, Krebs-Smith SM, et al. Monitoring and
benchmarking population diet quality globally: a step-wise
approach. Obes Rev 2013; 14: 135–49.
14 Contribution O, Teo K, Lear S, et al. Prevalence of a healthy lifestyle
among individuals with cardiovascular disease in high-, middle- and
low-income countries: the Prospective Urban Rural Epidemiology
(PURE) study. JAMA 2013; 309: 1613–21.
www.thelancet.com/lancetgh Vol 3 March 2015
15
16
17
18
19
20
21
22
23
24
25
26
27
28
29
30
31
32
33
34
Powles J, Fahimi S, Micha R, et al. Global, regional and national
sodium intakes in 1990 and 2010: a systematic analysis of 24 h
urinary sodium excretion and dietary surveys worldwide. BMJ Open
2013; 3: e003733.
Micha R, Khatibzadeh S, Shi P, et al. Global, regional, and national
consumption levels of dietary fats and oils in 1990 and 2010:
a systematic analysis including 266 country-specific nutrition
surveys. BMJ 2014; 348: g2272.
Micha R, Kalantarian S, Wirojratana P, et al. Estimating the global
and regional burden of suboptimal nutrition on chronic disease:
methods and inputs to the analysis. Eur J Clin Nutr 2012;
66: 119–29.
Khatibzadeh S, Micha M, Afshin A, Rao M, Yakoob MY,
Mozaffarian D. Major dietary risk factors for chronic diseases:
a systematic review of the current evidence for causal effects and
effect Sizes. Circulation 2012; 125: AP060.
World Bank. World Development Indicators 2013. http://databank.
worldbank.org/data/download/WDI-2013-ebook.pdf (accessed
Aug 24, 2014).
Willett WC. Implications of Total Energy Intake for Epidemiologic
Analyses. In: Willett WC, ed. Nutritional Epidemiology, 3rd edn.
New York: Oxford University Press, 2012: pp 260–86.
Barendregt JJ, Van Oortmarssen GJ, Vos T, Murray CJ. A generic
model for the assessment of disease epidemiology: the
computational basis of DisMod II. Popul Health Metr 2003; 1: 4.
Diez-Roux AV. Multilevel analysis in public health research.
Annu Rev Public Health 2000; 21: 171–92.
Gelman A, Rubin DB. Inference from iterative simulation using
multiple sequences. Stat Sci 1992; 7: 457–72.
World Cancer Research Fund/American Institute for Cancer
Research. Food, Nutrition, Physical Activity, and the Prevention of
Cancer: a Global Perspective. Washington, DC: American Institute
for Cancer Research, 2007.
Mozaffarian D. Nutrition and cardiovascular disease. In:
Bonow RO, Mann DL, Zipes DP, Peter L, eds. Braunwald’s Heart
Disease: A Textbook of Cardiovascular Medicine, 9th edn.
Philadelphia: Elsevier, 2011: pp 996–1007.
Murray CJ, Lopez AD. Global mortality, disability, and the
contribution of risk factors: Global Burden of Disease Study. Lancet
1997; 349: 1436–442.
McNeill S, Van Elswyk ME. Red meat in global nutrition.
Meat Science 2012; 92: 166–73.
Carmichael SL, Yang W, Feldkamp ML, et al. Reduced risks of
neural tube defects and orofacial clefts with higher diet quality.
Arch Pediatr Adolesc Med 2012; 166: 121–26.
Rodríguez-Bernal CL, Rebagliato M, Iñiguez C, et al. Diet quality in
early pregnancy and its effects on fetal growth outcomes: the
Infancia y Medio Ambiente (Childhood and Environment) Mother
and Child Cohort Study in Spain. Am J Clin Nutr 2010; 91: 1659–66.
Darmon N, Drewnowski A. Does social class predict diet quality?
Am J Clin Nutr 2008; 87: 1107–17.
Trichopoulou A, Naska A, Costacou T. Disparities in food habits
across Europe. Proc Nutr Soc 2002; 61: 553–58.
Lock K, Stuckler D, Charlesworth K, McKee M. Potential causes and
health effects of rising global food prices. BMJ 2009; 339: b2403.
Ohiorhenuan JFE, Stewart F. The legacies of armed conflict. In:
United Nations Development Programmeme. Post-Conflict
Economic Recovery Enabling Local Ingenuity. New York: United
Nations Publications, 2008: pp 14–47.
Monteiro CA, Moubarac J-CC, Cannon G, et al. Ultra-processed
products are becoming dominant in the global food system.
Obes Rev 2013; 14: 21–28.
e142


© Copyright 2026