
Global Growth Trends Portfolio
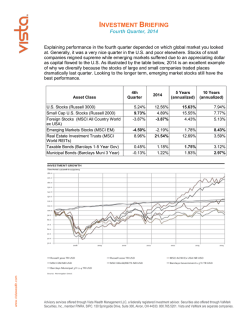
FACT SHEET
as of 30/11/2014
Global Growth Trends Portfolio
Portfolio Objective and Strategy
The Portfolio seeks long-term growth of capital by investing in an
actively managed portfolio of equity securities of issuers from markets
around the world, including developed markets as well as emerging
markets. In selecting securities for investment, the Investment Manager
seeks to identify companies whose growth potential appears likely
to outpace market expectations and focus investments on companies
exposed to or poised to benefit from secular growth trends.
Portfolio Composition
Sector Allocation
■ Financials 18.89%
■ Consumer Discretionary 17.59%
■ Information Technology 17.02%
■ Industrials 13.41%
■ Health Care 13.21%
■ Consumer Staples 10.87%
■ Energy 5.73%
■ Materials 1.80%
■ Telecommunication Services 1.48%
Profile*
䊳
䊳
Domicile: Luxembourg
Portfolio Inception Date:
11/04/1995 (Class A)
䊳
Fiscal Year End: 31 August
䊳
Net Assets: $780.15 million
䊳
Subscription/Redemption: Daily
䊳
Base Currency: U.S. Dollar
Convenience Pricing/Reporting
Currencies:
Singapore Dollar (S$), Euro
䊳
Benchmark: MSCI World Index‡
䊳
Order Placement Cut-off Time:
4:00 p.m. US ET
䊳
Management Fee: 1.70%††
䊳
Total # of Holdings: 82
䊳
Portfolio Management Team
Daniel C. Roarty, CFA
Tassos Stassopoulos
CIO — Global Growth & Thematic
Portfolio Manager — Global Growth
Equities
& Thematic Equities
Country Allocation
■ United States 48.04%
■ Switzerland 9.85%
■ United Kingdom 9.14%
■ Japan 6.16%
■ Hong Kong 3.85%
■ China 3.56%
■ France 3.26%
■ India 3.03%
■ Germany 2.33%
■ Other 10.78%
Holdings are expressed as a percentage of total investments
and may vary over time.
Top Ten Holdings
Sector
Information Technology
Health Care
Industrials
Information Technology
Consumer Staples
Financials
Energy
Industrials
Financials
Consumer Staples
Visa
Roche Holding
Danaher
Google
Anheuser-Busch InBev
Partners Group Holding
Schlumberger
Parker-Hannifin
AIA Group
British American Tobacco
Total
Holding
2.82%
2.76%
2.27%
2.23%
2.08%
1.98%
1.90%
1.87%
1.85%
1.82%
21.58%
Calendar Year Performance: Bid-to-Bid
Class A†
Benchmark‡
Portfolio
30.0% 30.0%
7.1%
15.8%
4.3%
6.7%
-5.5%
-12.2%
2009
2010
2011
2012
2013
2014
YTD
Past performance is no guarantee of future results. Performance
is shown in U.S. Dollar terms and, accordingly, the actual return
achieved by a non-U.S. Dollar based investor may increase or
decrease due to currency fluctuations.
* Source: AllianceBernstein.
† Inception date: 12/04/2006, Class A (SGD);07/06/2000, Class
A (EUR);11/04/1995, Class A (USD).
‡ The MSCI World Index is a free float-adjusted, market
capitalization weighted index that is designed to measure the
equity market performance of developed markets. The MSCI
World Index consists of the following 24 developed market
country indices: Australia, Austria, Belgium, Canada, Denmark,
Finland, France, Germany, Greece, Hong Kong, Ireland, Israel,
Italy, Japan, Netherlands, New Zealand, Norway, Portugal,
Singapore, Spain, Sweden, Switzerland, the United Kingdom
and the United States.
†† As an annual percentage of average daily Net Asset Value.
For further details on the Management Fee, please refer to
“Additional Information — Fees and Expenses” in section II
of the fund’s Prospectus.
For further information, or to obtain a copy of the Portfolio’s
Prospectus, please contact your financial advisor.
EQUITY
26.7%
21.6%
12.3%
11.8%
Global Growth Trends Portfolio
FACT SHEET
as of 30/11/2014
Average Annual Returns: Offer-to-Bid†#
1
3
5
Year
Year
Year
Class A
2.75% 10.09%
5.61%
Class A S$
6.75
10.73
4.36
Class A €
12.16
12.91
9.63
8.91
16.08
10.96
Benchmark ‡
10
Year
1.60%
—
2.26
6.60
Since
Inception
6.40%
-3.29
-1.45
6.86^
Cumulative Total Returns: Offer-to-Bid†#
1
3
5
Year
Year
Year
Class A
2.75% 33.41% 31.35%
Class A S$
6.75
35.76
23.76
Class A €
12.16
43.95
58.36
8.91
56.40
68.18
Benchmark ‡
10
Year
17.23%
—
25.04
89.46
Since
Inception
238.19%
-25.10
-19.07
266.73^
^ Since inception performance is from closest month-end after inception date of Class A. See footnotes on page 1 for inception
dates.
NAV Information as of 30/11/2014
NAV
NAV
(US$)
(S$)
Class A
56.14
73.19
General Fund Information
NAV
(€)
45.10
Bloomberg(US$)
ALLGLAI:LX
Bloomberg(€)
ALLGLAE:LX
ISIN(US$)
LU0057025933
ISIN(€)
LU0232552355
Investment in the Fund entails certain risks. Investment returns and principal value of the Fund will fluctuate so that an
investor’s shares, when redeemed, may be worth more or less than their original cost. The Fund is meant as a vehicle for
diversification and does not represent a complete investment program. Some of the principal risks of investing in the Fund
include country risk, emerging markets risk, currency risk, illiquid assets risk, portfolio turnover risk, management risk,
industry/sector risk, derivatives risk, borrowing risk, taxation risk and equity securities risk. These and other risks are described
in the Fund’s prospectus. Prospective investors should read the prospectus and Product Highlights Sheet carefully and discuss
risk and the fund’s fees and charges with their financial adviser to determine if the investment is appropriate for them.
This information is directed solely at persons in jurisdictions where the funds and relevant share class are registered or
who may otherwise lawfully receive it. Before investing in AllianceBernstein funds, investors should review the fund’s
full prospectus, together with the fund’s Product Highlights Sheet and the most recent financial statements. Copies of
these documents, including the latest annual report and, if issued thereafter, the latest semi-annual report, may be
obtained free of charge from www.alliancebernstein.com.sg or by contacting the local distributor in the jurisdictions in
which the funds are authorized for distribution.
A portfolio of ACMBernstein a mutual investment fund (fonds commun de placement) organized under the laws of
Luxembourg, which conducts business outside Germany and Austria under the name AllianceBernstein.
AllianceBernstein (Luxembourg) S.à.r.l. is the management company of the Portfolio and has appointed AllianceBernstein
(Singapore) Ltd. (Company Registration No. 199703364C) as its agent for service of process and as its Singapore
representative.
# Past performance is not indicative of future results. Total returns, provided by AllianceBernstein, include the change in
Net Asset Value and reinvestment of any distributions paid on Portfolio shares for the period shown, net of assumed front-end
load (FEL) 4% for Class A shares. For Class A shares, maximum front-end load (FEL): Up to 6.25%. Accordingly, these figures
do not represent actual returns to an investor. Performance quoted in currencies other than the base currency of the Portfolio is
calculated by converting the daily Net Asset Value of the Portfolio using a spot foreign exchange rate of the other offered
currency on each valuation point. The information on this page is for informational purposes only and should not be construed
as an offer to sell, or solicitation of an offer to buy, or a recommendation for the securities of the Portfolio. Returns
denominated in a currency other than that of the fund may increase or decrease as a result of foreign exchange currency
fluctuations.
For a full list of available share classes and detailed fund information, please visit our website at www.alliancebernstein.com/
investments
MSCI makes no express or implied warranties or representations, and shall have no liability whatsoever with respect to any
MSCI data contained herein. The MSCI data may not be further redistributed or used as a basis for other indices, any securities
or financial products. This report is not approved, reviewed or produced by MSCI.
© 2014 AllianceBernstein L.P. AllianceBernstein® and the AB logo are registered trademarks and service marks used by permission of the owner, AllianceBernstein L.P.
EQUITY
GBGGTFS1114SING
www.alliancebernstein.com/investments


© Copyright 2026