
Visible spectrophotometric determination of Losartan potassium in
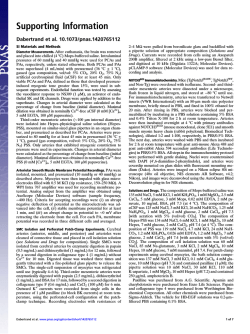
Available online at www.scholarsresearchlibrary.com
Scholars Research Library
Der Pharmacia Lettre, 2015, 7 (1):75-80
(http://scholarsresearchlibrary.com/archive.html)
ISSN 0975-5071
USA CODEN: DPLEB4
Visible spectrophotometric determination of Losartan potassium in pure and
dosage forms by ion-ion association reactions using BCP and BPB reagents
M. Siva Kishore2, K. Kiran Kumar2, Golkonda Ramu1,3 and Chintala Rambabu1*
1
2
Department of Chemistry, Acharya Nagarjuna University, Guntur, India
Department of Chemistry, K.B.N. P.G. College, Vijayawada, Andhra Pradesh, India
3
Department of Chemistry, Sir C.R.Reddy College Post Graduate Courses-Eluru, India
_____________________________________________________________________________________________
ABSTRACT
Two simple and sensitive visible spectrophotometric methods (Method-A and Method-B) have been developed for
the determination of Losartan potassium in bulk drug and pharmaceutical formulations. The developed methods
involve the formation of colored chloroform extractable ion-ion association complex of Losartan potassium with
Bromo cresol purple (Method-A) and Bromo phenol blue (Method-b) in acid medium, exhibiting absorption maxima
at 425 and 430nm respectively and obeying Beer’s law in the concentration range of 2.5 -12.5 µg/ml for the two
methods with good correlation. Statistical analysis of the results of the proposed methods reveals high accuracy
and good precision. The proposed methods could be successfully extended to the commercial pharmaceutical
formulations containing Losartan potassium.
Keywords: Losartan potassium, Bromo cresol purple, Bromo phenol blue, Ion-ion association complex,
Spectrophotometry
_____________________________________________________________________________________________
INTRODUCTION
Losartan potassium (LOK) is an oral drug which belongs to the class of angiotensin receptor blockers (ARBs) [1-3].
It is prescribed for the treatment of hypertension. It is also used to lower the risk of strokes in patients with high
blood pressure and an enlarged heart. It is chemically known as 2-n-butyl-4-chloro-5-hydroxymethyl-1-((2-(1Htetrazol-5-yl)(biphenyl-4-yl)methyl) imidazole potassium salt and its structure is represented in Fig.1.
Fig.1. Chemical structure of Losartan potassium
75
Scholar Research Library
Chintala Rambabu et al
Der Pharmacia Lettre, 2015, 7 (1):75-80
______________________________________________________________________________
An extensive literature survey was carried out and found some methods for the determination of LOK drug
substance in tablets. These methods employ techniques such as capillary electrophoresis (CE)[4], high performance
thin layer chromatography (HPTLC)[5], supercritical fluid chromatography (SFC)[6], high performance liquid
chromatography (HPLC) with UV detection and fluorescence detection[7] mostly in biological fluids, UV and UV
derivative spectrophotometric methods [8-9], kinetic spectrophotometric methods [10-11] and UV and HPLC
methods [12], and a liquid chromatography electrospray ionization tandem mass spectrometric method [13] for the
simultaneous determination of LOK and its major active metabolite in human plasma. The present work describes
the author’s attempts in developing new visible spectrophotometric methods for the determination of LOK using
some acidic dyes. The methods developed by the author involves the formation of ion association complex reaction
of the cited drug with some acid dyes such as Bromo Cresol Purple [BCP] and Bromo Phenol Blue [BPB], in acidic
medium (pH-3.0).
MATERIALS AND METHODS
2.1 Instrument An ELICO SL-159 UV–VIS spectrophotometer (India) with 1.0 cm quartz cells was used for all
absorbance measurements under the following operating conditions. An Elico model LI -10 (India) pH meter was
used for pH measurements.
2.2 Reagents and solutions
All chemicals were of analytical reagent grade and double distilled water was used throughout the study.
0.2% Bromo cresol purple (BCP, Ranbaxy Fine Chemicals Ltd., New Delhi) solution
dissolving 200 mg of BCP in 100 ml of water.
was prepared by
0.2% Bromo phenol Blue (BPB, Ranbaxy Fine Chemicals Ltd., New Delhi) solution prepared by dissolving
200mg of BPB in 100 ml of water.
Buffer solution, pH 3.0: Prepared by mixing 50ml of 0.2 M Glycine acetate solution with 11.4 ml of 0.2 M HCl
solution and diluted to 200ml with doubly distilled water. The pH of the solution was adjusted to an appropriate
value with the aid of a pH meter.
2.3 Preparation of standard stock solution
A stock standard solution of concentration 1mg/ml was prepared freshly by dissolving 100 mg of LOK in 100 ml
double distilled water. Final working standard solution of LOK of 50 µg/ml for Method A and Method-B was
prepared by diluting 5.0 ml solution of the above solution to 100 ml with double distilled water.
2.4 Preparation of sample solution
Ten tablets were weighed, finely powdered and mixed thoroughly.An accurately weighed amount of powder
equivalent to 50 mg of drug was transferred into a 50 ml volumetric flask and was dissolved with double distilled
water and shaken for 10 min. Then an aliquot portion of this solution was diluted to 100.0 ml with distilled water to
get sample solutions of 50µg/ml for BCP/ BPB and analysed as given in the above proposed assay procedures.
2.5 Procedures for Methods A & B
Aliquots of working standard solution of LOK (50µg/ml for Method A and Method B) ranging from 0.5 – 2.5 ml
were transferred into a series of 125ml separating funnels. To these 2.0 mlof acidic dye (BCP/ BPB) was added. The
total volume of aqueous phase was adjusted to 10.0ml with Glycine buffer solution of pH - 3.0 and 10.0ml of
chloroform was added. The contents were shaken for 2 minutes. The two phases were allowed to separate and the
absorbance of the yellow colored chromogenic was measured at 425/430 nm against reagent blank (set zero) and the
amount of LOK present in the sample solution was computed from its calibration curve.
RESULTS AND DISCUSSION
3.1 Absorption Spectra
The absorption spectrum of each proposed method was recorded against distilled water and was represented in Fig.
2&3 for BCP and BPB. The absorption curves of the colored species in each method show characteristic absorption
maxima at 425 nm for BCP & 430 nm for BPB where as the blank in each method has low or no absorption in this
region.
76
Scholar Research Library
Chintala Rambabu et al
Der Pharmacia Lettre, 2015, 7 (1):75-80
______________________________________________________________________________
Fig.2. Absorption spectrum of LOK with BCP
Fig.3. Absorption spectrum of LOK with BPB
3.2 Optimization of the developed procedures
A number of preliminary experiments for the proposed methods were established for rapid and quantitative
formation of colored ion-pair complex to achieve the maximum stability and sensitivity. Optimum conditions were
fixed by varying one parameter at a time while keeping other parameters constant and observing its effect on the
absorbance at 425 nm for BCP and 430 nm for BPB. The following experiments were conducted for this purpose
and the conditions so obtained were incorporated in recommended procedures. The optimum conditions established
for methods were described in Table. 1.
Table: 1. OPTIMUM CONDITIONS ESTABLISHED IN THE PROPOSED METHODS
Parameter
Optimum range
λmax (nm) BCP
λmax (nm) BPB
Effect of buffer (3.0) on color
development.
Choice of organic solvent for
extraction of the colored
complex.
Effect of shaking time on
extraction.
410 – 430
410 – 440
Conditions in
procedure
425
430
0.5-2.0ml
2.0 ml
Variation of concentration or pH beyond the upper and lower limits
resulted in low absorbance values.
Chloroform
Chloroform
Chloroform was preferred for its selective extraction of the colored
drug-dye complex from the aqueous phase.
1 - 5 min
2 min
Effect of temperature on the
colored species.
Stability of the colored
species in organic solvent.
Laboratory
temperature
(28+30OC)
1 - 60 min
1 - 60 min
Laboratory
temperature
Remarks
Constant absorbance values were obtained for shaking periods
between 1-5 min.
At low temperature (< 200C) the extraction of colored species was
found to be improper. At high temperature (> 350C) the stability of
the colored species was found to be less.
30 min
3.3 Validation
Precision: The precision (intraday variation) studies were performed on six replicate measurements of standard
solution, and the percent relative standard deviation (% RSD) and percent range of error (at 0.05 and 0.01
confidence limits) were calculated in each proposed methods and the results are given in Table 2.
Table: 2. STATISTICAL DATA OF QUANTITATIVE PARAMETERS FOR THE PROPOSED METHODS
Name of the Parameter
Maximum Wavelength λmax
Beer's Law Limits mcg/mL
Optimum Photometric Range mcg/mL
Sandell's Sensitivity(µg/cm2/0.001 Absorbance)
Molar Absorptivity lt/mole/cm
Slope (b)
Intercept(a)
Correlation Coefficient ( r )
Limit of Detection (LOD) mcg/mL
Limit of Quantification (LOQ) mcg/mL
Standard Deviation on Slope(Sb)
Standard Deviation on Intercept(Sa)
Standard Error on Estimation(Se)
BCP
425
2.5-12.5
3.0 -10.0
0.0378
1.222x10⁴
0.0234
0.0103
0.9994
0.03428
0.114
0.0004636
0.0002674
0.003665
BPB
430
2.5-12.5
3.5-10.0
0.0403
1.148x10⁴
0.0238
0.0023
0.99501
0.010024
0.334
0.001378
0.0007952
0.010898
Accuracy (Recovery): The recovery was assessed by determining the agreement between the measured standard
concentration and added known concentration to the sample (standard-addition technique). The test was done by
77
Scholar Research Library
Chintala Rambabu et al
Der Pharmacia Lettre, 2015, 7 (1):75-80
______________________________________________________________________________
spiking the pre-analyzed tablet powder with pure LOK at three different levels (50, 100 and 150% of the content
present in the tablet powder (taken)) and the total was found by the proposed method. Each test was repeated six
times. In all the cases, the recovery percentage values ranged between 99.63 and 99.73%. Closeness of the results to
100% showed the fairly good accuracy of the proposed methods.
Linearity: The calibration curves were constructed by plotting the absorbance’s of colored ion-pair complexes
against various concentrations of LOK (2.5-12.5µg/ml). The regression equations derived using the least-squares
method for the calibration curves of LOK were Y=0.0234 X + 0.0103 (R2=0.9994) for Method A(BCP) and 0.0238
X + 0.0023 (R2=0.99501) for Method B (BPB) respectively. The results showed an excellent correlation between
absorbance and concentration of drugs within the concentration range indicated above for both the methods
proposed (Table-2).
Fig.4: Beers law spectrum of LOK with BCP
Fig.5: Beers law spectrum of LOK with BPB
Sensitivity (LOD and LOQ): In this study, limit of detection (LOD) and limit of quantification (LOQ) were based
on the standard deviation of the response and the slope of the corresponding curve. The values of LOD and LOQ for
Method-A (BCP) and Method-B (BPB) are given in Table 2.
Ruggedness: The ruggedness of the developed methods was expressed as RSD% of the same procedures applied
under different laboratory conditions by the same instrument on different days for same standard and tablet dosage
forms of LOK. The results showed no statistical differences between the different conditions and instruments
suggesting that the developed methods were rugged.
3.4 Analysis of pharmaceutical preparations
Commercially available Losartan potassium tablets were subjected to analysis by the proposed methods. Results
obtained by the proposed methods presented in Table. 3 LOK was successfully determined in pharmaceutical
formulations without any interference from the excipients present in the tablets. The results were compared
statistically with those obtained by a (UV reference method) by applying Student’s t-test for accuracy and F-test for
precision (Table. 3). At the 95% confidence level, the calculated t- and F-values did not exceed the tabulated values
(t = 2.262 and F = 5.05) suggesting that the proposed methods are accurate and precise.
Table: 3. DETERMINATION OF LOSARTAN POTASSIUM IN DOSAGE FORMS
Method
BPB
BCP
Proposed Method
reference method
Amount
% Recovery by proposed
t
F
[9]
found*
method**
±S.D
value
Value
(mg) ±S.D
Tablet-I
25
0.433
1.65
24.96 ± 0.14
99.95±0.28
24.97±0.18
Tablet-I
25
0.989
3.24
24.90 ± 0.10
99.71±0.42
*Average ± standard deviation of six determinants. Theoretical values at 95 % confidence limits t = 2.365 and F = 4.88.
** Average of five determinations
Pharmaceutical
Formulation
Labeled
Amount
(mg)
3.5 Nature of the color Species
An attempt has been made to indicate the nature of colored species in each proposed method for Losartan potassium
tentatively based on analogy of reactive functional moiety in drug and reagents. As Losartan potassium possesses
78
Scholar Research Library
Chintala Rambabu et al
Der Pharmacia Lettre, 2015, 7 (1):75-80
______________________________________________________________________________
secondary amine group involves in ion association complex formation with acid dyes BCP and BPB which is
extractable into chloroform from the aqueous phase. The protonated nitrogen moiety (positive charge) of Losartan
potassium is expected to attract the oppositely charged part (negative charge) of dye and behave as a single unit
being held together by electrostatic attraction. Based on analogy the structures of ion association complexes are
shown in Scheme-1 given below. The proposed methods do not involve any stringent reaction conditions and offers
the advantages of high stability (more than 24hours).The statistical analysis of the results by t and F- tests showed
that, there is no significant difference in accuracy and precision between the proposed methods and reference
method.
Scheme-1: Ion pair associative complex for Losartan potassium with BCP & BPB
CONCLUSION
The reagents provide simple and sensitive methods for the spectrophotometric determination of LOK in pure and
pharmaceutical formulations. These methods have been successfully applied to the determination of LOK in pure
and dosage forms. The proposed methods can be successfully applied for routine analysis of LOK in quality control
and research laboratories.
Acknowledgements
The authors are very much thankful to Acharya Nagarjuna University for providing research facilities and getting
registration
REFERENCES
[1] A.Chiu, D.Mc Call, W.Price, P.Wong, J.Carini, J.Duncia, S.Yoo, A.Johnson, P.Timmermans, J. Pharmacol.
Exp. Ther., 1990, 252, 711.
79
Scholar Research Library
Chintala Rambabu et al
Der Pharmacia Lettre, 2015, 7 (1):75-80
______________________________________________________________________________
[2] P.Wong, W.Price, A.Chiu, J.Duncia, D.Carini, R.Wexler, A.Johnson, P.Timmermans , J. Pharmacol.
Exp.Ther,.1990, 256,211.
[3] C.L.Furteck, Lo MW, J.Chromatogr., 1992, 573,295.
[4] R.C.Williams, V.L.Alasandro, V.L.Fasone, R.J.Boucher, J.F.Edwards, J.Pharm.Biomed.Anal.,1996, 14, 539.
[5] K.E.McCarthyE, Q.Wang, E.W.Tsai, R.E.Gilbert, D.P.Ip, M.A.Brooks, J. Pharm. Biomed. Anal., 1998, 17, 671.
[6] Soldner A, Spahn-Langguth H, Mutschler E, J.Pharm.Biomed. Anal., 1998, 16, 863.
[7] D.Farthing, D.Sica, I.Fakhry, A.Pedro, T.W.Gehr, J.Chromatogr.,1997, 704,374.
[8] C.Olga, Lastra, G.Igor, Lemus, J.HugoSa´nchez, F.Renato Pe´rez Facultad de Ciencias Quı´micasy, Casilla,
Santiago, Farmace´uticas, Universidad DeChile., 2007, 233, 657.
[9] R.Permender, R.Sushila, R.Dharmender, C.Hema, Eurasina journal of analytical chemistry, 2009, l4,1.
[10] N.Rahman, M.RazaSiddiqui, S.D.Najmul Hejaz Azmi, Journal of the Chinese Chemical Society, 2006, 53, 735.
[11] K.Anuja Kolsure, S.SnehalIngale, A.SumitAbnawe, R.Anuruddha Chabukswar, P.Vishnu Choudhari,
S.Bhanudas Kuchekar, Journal of Pharmacy Research, 2010, 3, 9.
[12] M.Ansari, M.Kazemipour, F.Khosravi, M.Baradaran, Chem Pharm Bull, 2004, 52, 1166.
[13] T.Iwasa, T.Takano, K.Hara, T.Kamei, J. Chromatogr.B.1999, 734, 325.
80
Scholar Research Library


© Copyright 2026