
Phase Computation Through Wavelet Analysis
Phase Computation Through Wavelet Analysis: Yesterday and
Nowadays
Michel Cherbuliez and Pierre Jacquot
Laboratory of Metrology, Electrical Engineering Department
Swiss Federal Institute of Technology
CH-1015 Lausanne, Switzerland
1. Introduction
This paper addresses the issue of the determination of the phase of an interferometric signal
exhibiting both spatial and temporal variations. Live fringe patterns processing has been the
subject of methodical studies in our group since 1995. In particular, two doctoral theses, /1-2/,
have been devoted to this problematics. They have led to original and effective means to find
out the phase of a real-time interferogram. Many other methods, briefly mentioned in the next
section, and proposed concomitantly or much earlier, solve also this problem. Here, the focus
is on the approach by wavelet analysis. A wavelet program has been written, enabling to deal
with signals generated by a wide variety of methods, including holographic, speckle,
classical, white-light interferometry, fringe projection and moiré techniques. Basically, the
wavelet scheme solves completely the problem. As compared to other attempts, our approach
can be easily distinguished: we don’t use wavelets primarily for filtering fringe patterns; on
the contrary, we rely on wavelet transforms and their mathematical properties in order to
directly compute the phase of the interferometric signals. The first part of the paper recalls
how the phase of the Morlet transform of the signal supplies the signal phase itself.
Not surprisingly, this computation, being in essence a cross-correlation integral between the
interferometric signal and a Morlet wavelet, is prone to be time consuming. With the first
version of the above mentioned program, it took about 10 hours to process a sequence of 512
interferograms, 512x512-pixels 8 bits in size, on a 150 MHz Pentium PC. Our recent efforts
have resulted in a series of processing tools significantly reducing the computation time.
“Significantly” means actually a reduction by a factor 20 to 30. These tools are presented in
the second part of the paper.
The current version of our wavelet program served to carry out several dynamic deformation
tests. Some examples are evoked. This reasonably rapid program will also render possible in a
near future a thorough characterisation of the accuracy and the resolution capabilities of the
wavelet method – a characterisation not undertaken as yet, owing to the slowness of the
previous program.
2. Processing of live interference patterns
It is well known, (e.g.: /3-4/), that, under lowly constraining assumptions, two beam
interference patterns and the fundamentals of moiré patterns can be suitably described by the
“triangle” formula:
I = I 1 + I 2 + 2 I 1 I 2 cos ϕ ; I , I 1, I 2 ≥ 0
(1)
or I = B + 2 M cos ϕ ; 2 M ≤ B
(2)
I is the observed intensity pattern, or its gray level value after quantization, and B the
background intensity, or the result of the incoherent addition of the two waves, i.e. I1+I2. The
intensity modulation is produced by the cosine term whose argument, ϕ , is the phase of the
interferogram, measuring indeed the amount of phase difference between the two interfering
waves. The relationship between ϕ and the physical quantity under investigation is generally
complicated and is beyond the scope of the present analysis; interferometry aims to make this
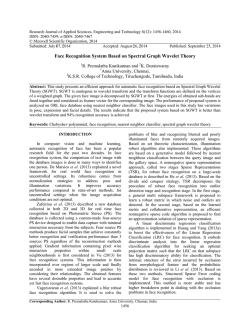
relationship as simple and univocal as possible. Since cos ϕ takes values in the [–1,1]
interval, 2M appears as the modulation depth of the interference pattern, M being the
geometric mean of the intensities of the two beams, Fig. 1. The arguments of the functions I,
B, M and ϕ are deliberately omitted for the moment; but, in the general case, the
interferometric signal is four-dimensional, depending on the space position vector where the
signal is captured and on the time. Fringe processing consists in solving Eqs. (1-2) for ϕ ,
from the knowledge of the resulting intensity, I, and using appropriate strategies either to
know or to eliminate the two other intensities. This task is not trivial, since, even of lower
rank, the cosine function is nonetheless a transcendental function.
Im
I
2M
2M
B=I1+I2
2nπ (2n+1)π
ϕ
I2
I
ϕ
I
I1
I2
Re
ϕ
range for
ϕ
I1
reconstruction of ϕ from
I , I1 , I 2
Fig. 1: Solving for ϕ the two beam interference formula.
Heterodyne-, /5-6/, and phase-locked loop- (PLL), /7-8/, interferometry offer a general
solution to the accurate determination of ϕ, for both static and dynamic interference signals.
One arm of the interferometer is frequency- or phase-modulated. Refined modulations,
involving frequency scanning or wavelength multiplexing, mostly encountered with laser
diodes are also possible, /9/. Fast analogue electronic circuitry delivers signals proportional to
the phase, optionally fed into digital analysers. Phase-meters and phase-trackers of common
use in electrical signal analysis can adapt to changing background and modulation intensities.
These techniques achieved great success, however only in the limited domain of punctual
interferometry, where 1-D temporal signals are of concern, as exemplified by the heterodyne
laser velocimeter or vibrometer /10/. The schemes used in heterodyne or PLL interferometry
are unfortunately not easily extended to a dense array of photodetectors for whole field
investigations. Optics, owing to its intrinsic capability of parallel processing, is not involved
in this inadequacy; but to make the electronic detection massively parallel, i.e. to the extent of
being able to handle 104 or 105 point detectors by multiplexing techniques, would be a
formidable and prohibitive task.
For 2D static interferograms, a popular solution is phase-shifting: the phase ϕ is computed
from at least three equations like Eq. (1), obtained after incrementing the phase by known
amounts. A lot of inversion formulae, giving the principal determination of ϕ in function of
the series of intensities recorded for each phase increment, have been proposed /11/.
However, standard phase-shifting methods fail in non-stationary conditions, when either the
phase, the background or the modulation change during the time taken to create and acquire
the phase-shifted versions of the interferogram. Unusual and improved phase-shifting
techniques have then been devised in order to overcome the obstacle of the static requirement.
Fast phase-shifters and imagers, in conjunction with algorithms tolerant to some uncertainties
in the phase steps, can bring approximate, yet interesting solutions, /12/. Direct inversion of
Eq.1, after determination of the background and modulation from the mini and maxi of each
pixel-interferometer, have been attempted, /13/. Another solution requests the knowledge of
the phase, background and modulation before the object is dynamically loaded, in addition to
the current interferogram and/or takes advantage of the redundancy existing in neighbour
pixels, /14/ or /15/. Dynamic phase-shifting, /16-17/, in which the phase steps from image to
image are the sum of the unknown object phase increments and an externally introduced π/2
step, provides a rather general solution. The only assumption is that the time evolution of the
object phase is correctly represented by its first order expansion over five consecutive frames.
Among other solutions still available, let us mention the multi-channel approach, /18-21/: the
output the interferometer is split into several channels in which the reference and object arms
are subjected to predefined phase shifts. The channels are read out simultaneously and
standard phase-shifting algorithms can be used.
The generation of spatial carrier fringes, together with the Fourier transform method, /22/, has
been extensively and successfully employed and implemented through different variants, /2325/.
Finally, pure image processing techniques, applied to single isolated interferograms can also,
in some instance, and provided that the sign ambiguity can be cleared up, lead to a good
evaluation of the phase, /26-27/.
Despite this abundance of theoretical and practical solutions, we looked for still another one,
more deeply anchored in the field of signal processing. It is based on wavelet analysis.
3. Wavelet processing
3.1 Introductory comments
The task is to solve for the phase ϕ as generally as possible the fringe formula, Eq. (1). The
resulting intensity, I, is supposed to be acquired by a CCD-type imager and sampled and
digitised in (mxn) pixels, t times, and at constant time intervals, creating, for example, a file
of 512x512, 8-bit pixels in 512 instants. In order to cope with such huge files, and to comply
with the usual schemes of signal processing, the first step is to isolate from the bulk data the
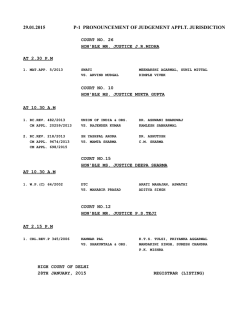
1D temporal signals of each pixel, which is equivalent to consider each pixel as an
independent punctual interferometer. Fig 2 shows a typical 1D temporal pixel-signal obtained
in speckle interferometry, reconstructed from its temporal samples.
I
t
Fig. 2: Example of 1D temporal speckle interferometry pixel-signal
The next step is to recover the phase of such a signal. Clearly, as the resulting intensity, I,
presents variations in its background, modulation and frequency content, both its temporal
and spectral characteristics need to be simultaneously analysed. This is precisely what
wavelet analysis can do. Here, it is worth noting that the potential of wavelet analysis have
not gone unnoticed in interferometry. However, in all cases brought to our attention, wavelet
analysis has always been used essentially as a filtering tool in the spatial domain at the preprocessing stage, for de-noising and improving the quality of the interferograms, and for
preparing and helping further processing tasks, /28-31/. The bias taken in /1/, on the contrary,
is to compute as directly as possible the phase of the signal from its wavelet transform. The
Morlet wavelet, M(t), was chosen for remarkable properties of localization.
The detailed mathematical reasons for this choice, including the comparison with windowed
Fourier and Gabor transforms and the discussion of the admissibility conditions, is given in
/1/ and /32/, and in the references therein. A rather intuitive approach is followed here. The
Morlet wavelet is an oscillating function at the mother frequency ω0, windowed by a Gaussian
function:
⎛ t2 ⎞
(3)
M (t ) = exp⎜⎜ − ⎟⎟ exp( jω 0 t )
⎝ 2⎠
The corresponding Morlet transform, S(a,b), is defined as:
+∞
1
⎛t −b⎞
S (a, b) = ∫ s (t ) M ∗ ⎜
(4)
⎟dt
a −∞
⎝ a ⎠
This transform is a complex function of the two variables, a and b, the latter being clearly a
time variable, expressing the translation of the window function M(t) along the time axis,
while the former is a scaling parameter determining both the frequency, ωo/a, of the analysing
signal by dilation of the mother frequency ω0 and, at the same time, the width of the Gaussian
window. The variation of a allows to scan a full range of frequencies of interest. If the
number of oscillations, n, of the Morlet wavelet is defined by the ratio between the full width
of the Gaussian at 1/e, 2 2a , and the period of oscillation, 2πa/ω0, the interesting following
result is obtained:
2
(5)
n=
ω0 ,
π
meaning that this number is constant, depending only on the mother frequency.
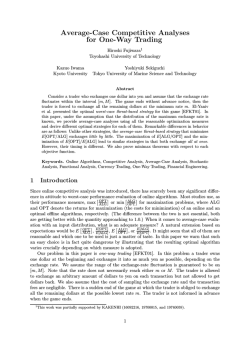
Any 1D cut, Sα(b), of the Morlet transform, obtained for a value α of a, can be computed by:
+∞
⎛ (t − b )2 ⎞
ω
1
1
⎟ exp⎛⎜ − j 0 (t − b )⎞⎟dt = s(b ) ∗ M α (b )
Sα (b ) = ∫ s (t ) exp⎜⎜ −
2 ⎟
α −∞
α
α
2α ⎠
⎝
⎠
⎝
,
(6)
⎛b⎞
M α (b ) = M ⎜ ⎟
⎝α ⎠
where * denotes the crosscorrelation integral, as illustrated in Fig. 3.
..
.
Mα3(t)
=
t
s(t)
..
.
signal
t
Mα2(t)
∗
=
Mα1(t)
t
Sα1(t)
t
Morlet wavelets
t
Sα2(t)
t
..
.
Sα3(t)
=..
.
t
Morlet transform
Fig. 3: Real part of the Morlet transform shown as a crosscorrelation function
This interpretation of the Morlet transform in terms of a correlation integral supports the
understanding that the transform will reach its maximum value in the region of the (ω0/a,b)
space where the signal and the wavelet are locally the most similar, thereby offering a definite
knowledge of the signal. The modulus of the transform is maximum when the analysing
frequency equals the signal frequency. This condition defines the so-called ridge of the
transform. The choice of the mother frequency serves to optimise the analysis in terms of
time-frequency content. On the ridge, increasing ω0 amounts to reduce the noise, through
integration over a larger time interval, but at the expense of a looser time localization.
Moreover, the real (in cosω0t) and imaginary (in jsinω0t) parts of the Morlet wavelets enable
to track the phase of the signal, in a way reminiscent of the two outputs in quadrature
commonly found in inteferometry. For example, when the signal is exactly in phase with the
cosine part of the Morlet wavelets, the real part of the transform is maximun, while the
imaginary part drops to zero; the opposite is true for the sine part of the Morlet wavelets. The
ratio between imaginary and real parts of the transform determines indeed the phase of the
signal for the intermediate cases. In the simplifying hypothesis of a signal of constant
frequency, ωs/2π, a straightforward computation of Eq. (6), resticted to the ridge, i.e. for the
Morlet wavelet of the same frequency, thanks to /33/, confirms this point of view:
s (t ) = B + 2 M cos ω s t
⎛ ω2 ⎞
Re{Sαs (t )} = 2π B exp⎜⎜ − 0 ⎟⎟ + 2π M cos ω s t 1 + exp − 2ω 02
(7)
⎝ 2 ⎠
Im{Sαs (t )} = 2π M sin ω s t 1 − exp − 2ω 02
Noting that the constant negative exponential terms depend only on the mother frequency ω0,
always chosen greater than 2π, leads to conclude that these terms of the order of 10-9 can be
safely neglected. Therefore, Eq. (7) reduces to:
Re{Sαs (t )} = 2π M cos ω s t
(8)
Im{Sαs (t )} = 2π M sin ω s t
showing in this case that the phase of the transform is equal to the phase of the signal. This
property can be extended to varying signals defined by Eq. (1). The limits of applicability are
discussed in /1/. This lays the foundation of the signal phase computation.
[
[
(
)]
(
)]
3.2 Phase extraction algorithm
The signal phase computation reverts to the transform-phase computation along the ridge,
Fig. 4.
ω0/a
MT phase
ωi-1
ωek
ωek+1
ω0/a
ωi
ωi
MT phase (grey levels)
& ridge
signal phase
⎛ dϕ ⎞
= ω ek +1
⎜
⎟
⎝ dt ⎠ ti ,ω ek
ti-1
ridge
ti
t
ti-1 ti
t
ti-1 ti
t
2π
0
Fig. 4: Ridge extraction and wrapped phase of the signal
The ridge extraction is performed by an iterative routine. At an arbitrary instant ti, the
calculation loop starts with a guess ωe0 of the signal frequency equal to the ridge-frequency
ωRi-1 found at the previous step. The phase of the transform is calculated for ωe0 in a couple of
equi-spaced points of the time axis, on both side of ti, allowing to compute the phase gradient
of the transform on this time interval. This local gradient is nothing else but a new estimate of
the ridge-frequency ωe1. By construction, this estimate can only be better or as good as the
previous one, ωeo, /1/. The evaluation is then repeated iteratively using ωe1 as the new
analysis frequency and so on until the algorithm converges. Convergence is reached – less
than three iterations generally suffice – when the difference between two successive values
|ωej - ωej-1 | is smaller than a predetermined small constant. The final estimate ωej becomes the
ridge frequency ωRi at instant ti. The phase of the signal is the phase of the transform at
(ti,ωRi), at this stage in a wrapped modulo 2π form.
3.3 Serrodyne modulation
Obviously, wavelet analysis in itself cannot remove the fundamental phase sign ambiguity,
mathematically rooted in the evenness of the cosine function. As always, the absolute value of
the unknown phase can only be obtained through comparison with a reference phase
evolution. The choice of a temporal analysis of the pixel content lends itself well to the
utilization of a serrodyne phase modulation, /34/, for creating this reference, a linear
temporal variation of the phase is equivalent to an optical frequency shift. According to the
sampling theorem, the acquisition rate of Eq. (1) must be at twice the signal frequency at
least; in other words, ϕ must not change by more than π between two consecutive frames.
The logical choice of the slope of the superimposed linear phase variation simply consists
then in adding recurrently the quadruplet of phase steps (0, π/2, π, 3π/2) to the set of all four
consecutive interferograms of the sequence. Any of the techniques commonly practised to
create phase steps, in particular by means of piezolelectric mirrors, is convenient. The
frequency of the carrier signal so created is usually taken as the guess frequency of the first
iteration of the ridge extraction algorithm. The phase modulation helps also the unwrapping
step. Since the total phase (object phase plus carrier phase) is now a monotonous function, 2π
increments are added to the total phase when this property is infringed. As usual, the
introduction of the carrier limits the dynamic range of the signal: the object phase change
between successive frames should remain in the interval [–π/2,π/2].
4. Fast processing tools
It appears that the principal disadvantage of the first version of the programme built on the
above assets is in its slowness. 20 seconds of recording at the standard video rate of 25 Hz, or
½ second at 1kHz, for an image format (512x512 8-bit pixel) and a computer (processor 150
MHz) also standard, requested about 10 hours of processing. A systematic effort was
undertaken in order to increase the processing speed, /2/.
4.1 Data reduction and smart queuing
Bad pixels, exhibiting poor modulation, should be first discarded. This is accomplished by
computing an indicator, Q, proportional to the average modulation over the time interval
under consideration, n being the number of temporal samples:
1 n −1
(9)
∑ s(i ) − s(i − 1)
n − 1 i =1
Pixels under a predefined threshold are considered without information and eliminated. This
indicator is very fast but not completely reliable. Optionally, it can be complemented by a
FFT analysis of the 1D signal. This first data reduction is very important, because the iterative
Q=
character of the wavelet program makes the phase computation of bad pixels at least 10 times
longer than that of good ones.
Furthermore, there are no reasons to process the remaining pixels in a fixed order, one by one,
and line by line. On the contrary, pixels are ordered in a queue by a hierarchic method, /2/,
realizing a peculiar patchwork, or tiling, of the interferogram. The same rule is iteratively
applied as many times as necessary, depending on the chosen spatial resolution, and until a
predefined minimum pixel information content is reached. The ith step is as follows. Credited
with the best score, pixel (l,m) is at the top of the queue. It occupies the centre of a
rectangular portion of the interferogram, or tile, whose dimension and position result from the
previous iteration. The ith step consists in dividing into two halves this rectangle, and in
computing the score of the two new center-pixel. This score is the product of the rectangle
area by the total phase increment of the pixel during the analysed sequence, as computed by
wavelets. While tile (l,m) disappears, the two new tiles are ordered in the queue according to
their score. The(i+1)th iteration then proceeds with the tile of highest rank.. No regions are left
unprocessed and no time is wasted in processing meaningless zones.
Gains of 10 in computation time have been experimentally recorded on a series of examples,
involving holographic and speckle fringes, by the conjoint use of data reduction and smart
queuing, /2/.
4.2 Parallel and distributed processing
First, the initial program has been entirely rewritten by adopting a multihtreading approach:
the program is split into different parts, or threads, to be executed simultaneously by the
operating system. Then, two types of architecture, a dual-processor PC (Intel Celeron 300) on
one hand, and a network of PCs on the other hand, have served to test the multithreading
program, /2/.
Without going too deeply into the structure of this program, it is worth underlining that an
additional gain of a factor 2 to 3 in the computation time is obtained. The improved wavelet
program is, therefore, 20 to 30 time faster than the initial one, allowing to complete the
processing of a standard experiment in some 20 minutes.
5. Applications
Besides verifications and academic experiments, as for instance the uniform in-plane rotation
of a diffuser measured by in-plane speckle interferometry in /2/, several real measurements
have been performed, /1,35-36/. These measurements are related to the thermal deformation
of a space telescope structure, the microcraking behaviour of a reactive powder concrete
beam, the vibration of a metallic plate and the real-time deformation of a rubber specimen.
The corresponding recording techniques were respectively holographic interferometry, inplane speckle interferometry, shearing speckle interferometry and again in-plane speckle
interferometry. Applications in shape measurement by oblique fringe projection are
impending. In all cases, due to a lack of characterization of the method, extreme care has been
exercised to employ the method far from its limits, i.e. with acquisition rates high enough to
ensure always small interferometric changes from frame to frame. The results are very good
and can be compared favourably with those of the dynamic phase-shifting method which can
be applied concurrently to same rough data files.
6. Conclusion
Recent research works carried out by our group on the processing of live frinhes by wavelet
analysis are summarized. The gathered space-time data, obtained by digitization and
quantization of a time-sequence of 2D interferograms, are first broken down into a set of 1D
temporal pixel-signals. Emphasis is then on a proper exploitation of the phase properties of
the Morlet transform, leading directly to the determination of the phase of these
interferometric signals. The implemented algorithm is presented. The whole procedure is
recognised to be fully satisfactory, except for being very computationally demanding. This
drawback is combated by specific processing tools, ranging from data reduction techniques to
optimal queuing and to parallel and distributed computing resources. The result is an
operational computer program. With this tractable and fast program, the outlook is now to
characterize thoroughly the performances of the wavelet method, in particular to shed some
light on the question of the analysis of errors, and to foster the applications in real dynamic
measurements.
7. Acknowledgments
The support of the Swiss National Foundation to the project “Dynamic deformation
measurement: wavelet processing of interference patterns, # 21-050548.97/1” played a key
role in the development of the wavelet program. We are pleased to thank Xavier Colonna de
Lega – actually the inspiring third father of this paper.
8. References
/1/ Colonna de Lega, X.: Processing of non-stationary interference patterns: Adapted phaseshifting algorithms and wavelet analysis. Application to dynamic deformation
measurements by holographic and speckle interferometry, Thesis n° 1666, Swiss Federal
Institute of Technology Lausanne, (1997).
/2/ Cherbuliez, M.: Wavelet analysis of interference patterns and signals: development of
fast and efficient processing techniques, Thesis, Swiss Federal Institute of Technology
Lausanne, (2001).
/3/ Malacara, D.; Servín M.; Malacara Z. : Interferogram analysis for optical testing, Marcel
Dekker, Inc., (1998).
/4/ Schwider, J.: Advanced evaluation techniques in interferometry, Progress in Optics
XXVIII, E. Wolf ed., Elsevier Science Publishers B.V., (1990), 271-359.
/5/ Wyant, J.C.: Use of an AC heterodyne lateral shear interferometer with real time
wavefront correction systems, Appl. Opt., 14(1975), 2622-2626.
/6/ Dändliker, R.: Heterodyne holographic interferometry, Progress in Optics XVII, E. Wolf
ed., North-Holland Publishing Company, (1980), 1-84.
/7/ Johnson, G.W.; Leiner, D.C.; and Moore, D.T.: Phase locked interferometry, Opt. Eng.,
18(1979), 46-52.
/8/ Servín M.; Rodríguez-Vera, R.; and Malacara D.: Noisy fringe pattern demodulated by
an iterative phase locked loop, Opt. And Lasers in Eng., 23(1995), 355-366.
/9/ Suzuki, T.; Muto, T.; Sasaki, O.; and Maruyama, T.: Wavelength-multiplexed phaselocked laser diode interferometer using a phase-shifting technique, Appl. Opt., 36(1997),
6196-6201.
/10/ Tomasini, E.P., ed.: Vibration measurements by laser techniques: Advances and
Applications, SPIE Vol. 4072, (2000).
/11/ Creath, K.: Phase-measurement interferometry techniques, Progress in Optics XXVI, E.
Wolf ed., Elsevier Science Publishers B.V., (1988), 349-393.
/12/ Colucci, D.; and Wizinowich, P: Millisecond phase acquisition at video rates, Appl. Opt.
31(1992), 5919-5225.
/13/ Wang, J.; and Grant, I.: Electronic speckle interferometry, phase-mapping, and
nondestructive testing techniques applied to real-time, thermal loading, Appl- Opt.,
34(1995), 3620-3627.
/14/ Carlsson, T.E.; Wei, A.: Phase evaluation of speckle pattterns during continuous
deformation by use of phase-shifting speckle interferometry, Appl. Opt. 39(2000), 26282637.
/15/ Bruno, L.; and Poggialini, A.: Phase retrieval in speckle interferometry: a one-step
approach, Interferometry in Speckle Light: Theory and Applications, P. Jacquot and J.-M.
Fournier eds., Springer, (2000), 461-472.
/16/ Colonna de Lega, X. ; and Jacquot, P.: Deformation measurement with object-induced
dynamic phase shifting, Appl. Opt. 35(1996), 5115-5121.
/17/ Colonna de Lega, X. ; Jacquot, P.: Interferometric deformation measurement using object
induced dynamic phase shifting, SPIE Vol. 2782, (1996), 169-179.
/18/ Johnson, M.; and Delaporte, Y.: Fiber vibrometer with three-phase fringe-analysis, Opt.
Comm. 101(1993), 1-4.
/19/ Kwon, O.Y.; and Shough D.M.: Multichannel grating phase-shift interferometers, SPIE
Vol. 599, (1985), 273-279.
/20/ Kujawinska, M: Spatial phase measurement methods, Interferogram Analysis, D.W.
Robinson and G.T. Reid eds., IOP Publishing, (1993), 141-193.
/21/ van Haasteren, A.J.P.; and Frankena, H.J.: Real-time displacement measurement using a
multicamera phase-stepping speckle interferometer, Appl. Opt. 33(1994), 4137-4142.
/22/ Takeda, M; Ina, H.; and Kobayashi, S.: Fourier-transform method of fringe-pattern
analysis for computer-based topography and interferometry, J. Opt. Soc. Am., 72(1982),
156-160.
/23/ Pedrini, G.; and Tiziani, H.J.: Double-pulse electronic speckle interferometry for
vibration analysis, Appl. Opt., 33(1994), 7857-7863.
/24/ Saldner, H.O.; Molin, N.E.; and Stetson, K.A.: Fourier-transform evaluation of phase
data in spatially-biased TV holograms, Appl. Opt., 36(1996), 332-336.
/25/ Davila, A.; Kaufmann, G.H.; and Pérez-López, C.: Transient deformation analysis by a
carrier method of pulsed electronic speckle–shearing interferometry, Appl. Opt.,
37(1998), 4116-4122.
/26/ Yu, Q; Andersen, K.; Osten, W.; and Jüptner, W.: Noise free normalited fringe patterns
and local pixel transform for strain extraction, Appl. Opt., 24(1985), 3783-3790.
/27/ Marroquin, J.L.; Rivera, M. ; Botello, S. ; Rodríguez-Vera, R.; Servín M.: Regulaization
methods for processing fringe-pattern images, Appl. Opt. 38(1999), 788-794.
/28/ Berger, E.; von den Linden, W.; Dose, V.; Ruprecht M.W.; and Koch, A.W.: Aproach for
the evaluation of speckle deformation measurements by application of the wavelet
transformation, Appl. Opt., 36(1997), 7455-7460.
/29/ Sandoz, P.: Wavelet transform as a processing tool in white-light interferometry; Optics
Letters, 22(1997), 1065-1067.
/30/ Federico, A.; Kaufmann, G.H.; and Serrano E.P.: Speckle noise reduction in ESOI
fringes using wavelet shrinkage, Interferometry in Speckle Light: Theory and
Applications, P. Jacquot and J.-M. Fournier eds., Springer, (2000), 397-404.
/31/ Krüger, S.; Wernike, G.; Osten, W.; Kayser, D.; Demoli, N.; Gruber, H.: Fault detection
and feature analysis in interferometric fringe patterns by the application of wavelet filters
in convolution processors, J. Electro. Imag., 10(2001), 228-233.
/32/ Colonna de Lega, X.: Continuous deformation measurement using dynamic phaseshifting and wavelet transforms, Applied Optics and Optoelectronics 1996, K.T.V.
Grattan ed., Institute of Physics Publishing, (1996), 261-267.
/33/ Gradshteyn, I.S.; and Ryzhik, I.M.: Tables of Integral, Series, and Products, Academic
Press, (1994), n° 3.896.4, 3.898.2 & 3.898.3.
/34/ Wong, K.K; and De La Rue, R.M.: Electro-optic-waveguide frequency translator in
LiNbO3 fabricated by proton exchange, Opt. Lett., 7(1982), 546-548.
/35/ Jacquot, P.; Lehmann, M.; and Colonna de Lega, X.: Deformation analysis of a
communication telescope structure under non-uniform heating using holographic
interferometry, SPIE Vol. 3293, (1998), 102-113.
/36/ Jacquot, P.; Lehmann, M.; Colonna de Lega, X.; and Facchini, M.: Speckle
interferometry improvements for applications in civil engineering, Advanced Optical
Methods and Applications in Solid Mechanics, A. Lagarde ed., Kluwer Academic
Publishers, (2000), 199-212.


© Copyright 2026