
Population Pressure and Migration
JournalofPhilippine
Development
Number
Twenty_ix,
Volume
XV,NO.1,1988
POPULATION PRESSURE AND MIGRATION: IMPLICATIONS
FOR UPLAND DEVELOPMENT IN THE PHILIPPINES*
Ma. Concepcion J. Cruz, Imelda Zosa-Feranil
and Cristela L. Goce**
I,
Introduction
The present trend of increasingpopulationpressureon the forest
resourcesof many developingcountriesand the projectionsup to the
beginningof the next centurybothindicatea cdsis. Wardingoff this crisis
shallrequireactiontobe takenona scalefargreaterthancurrentlyprovided
for or imagined.
The majorbreakthroughin policyshouldbe the properrecognitionof
theuplandpopulationissueas "critical"or onethat needsto be addressed
directlyand swiltly.The adoptionof a realisticand comparativepopulation
base figure is the initialstep toward a comprehensivepolicy for forest
resourcesdevelopment.This paperdiscussesthe role of populationpressure and migrationinPhilippineuplanddevelopment.Itis basedon a study
which was completedin August 1986 by the Center for Policyand
DevelopmentStudiesof the Universityof the Philippinesat Los Bahos
(CPDS-UPLB) and funded by the PhilippineInstitutefor Development
Studies (PIDS) and the InternationalDevelopment Research Centre
(IDRC), The completereportand a detaileddescriptionofthestudyisfound
in Cruz, Zosa-Feraniland Goce (1986).
*This paperis based largelyon the integratedsummaryreportentitled
"Population
PressureandMigration:
implications
forUplandDevelopment,"
PIDS
WorkingPaperNo.86-02.
"*Assistant
Professor
andHead,Environmental
Education
Division,Institute
ofEnvironmental
ScienceandManagement
(IESAM),University
ofthePhilippines
at LosBaSos(UPLB);Assistant
Professor,
University
ofthePhilippines
Population
Institute;
andformerInstructor,
Department
of Economics,
Collegeof Economics
andManagement
(CEM),University
ofthePhilippines
at LosBaRos,respectively.
16
JOURNAL
OFPHILIPPINE
DEVELOPMENT
Three levels of analysis, using combined macro and micro data, make
up the different phases of the study. The first phase involved the identification of upland sites using available topographic maps and serial photographs. Population figures were then estimated from the 1980 Census of
Population. The description of the results of this first phase is provided in
Part II.
The second phase focused on the major migration streams identified
from the Census. A preliminary analysis of migration from lowland to upland
areas was first conducted by estimating net migration at the regional,
provincial, and municipal levels. Then, three types of macro migration
models, using multiple regression were constructed to evaluate the macrolevel determinants of upland population movements. Part III summarizes
the results of this phase.
In the third phase, upland migration is analyzed from the .perspective
of micro, village-level information. Three villages in an upland area (Mount
Makiling watershed ) were used to evaluate circumstances of movement,
frequency and mode of travel, and the socioeconomic correlates of migrant
behavior such as income, occupation, ownership status, education, and
others. The case study results are presented in Part IV.
Such a comprehensive approach was useful in several ways. First, it
allowed the important characteristics of migration, which were not included
in the national census information, to be incorporated in the analysis.
Second, the aggregate models provided the broad perspective of population
movements which were generally difficult to ascertain from a limited case
study approach.
Lastly, a third advantage was the policy usefulness
generated from combining macro and micro migration information, the
former providing general, national trends of upland migration and the latter
giving specific insights on particular circumstances and effects of movement.
I1.
Philippine
Upland Population
Using the 1980 Census, the study estimated the upland population at
14.4 million persons (see Table 1). Until that time, very few people cared to
hazard a documented estimate (although there were several"guesstimates"
floating around). The large population estimate contrasts with the data on
"detected cases of squatting" in the uplands of the Bureau of Forest
Development (BFD) which uses the figure of 1.3 million persons in 1980
(BFD, 1982).
Using upland population growth trends for the period 1975 to 1980 as
basis, the upland population will decline by 5 percent every 10 years. The
present upland population would then be 17.8 million of which almost one half (48 percent) or 8.5 million persnns occupy forestlands which are part of
CRUZ,ZOSA-FERANIL
ANDGOCE:POPULATION
ANDUPLAND
DEVELOPMENT
17
Table 1
NUMBER OF PROVINCES AND MUNICIPAUTIE$ WITH UPLAND AREAS
AND TOTAL POPULATION OF AREAS CLASSIFIED AS UPLAND (1980)
Number of
Region
I.
ii.
III.
IV.
V.
VI.
VII.
VIII.
IX.
X.
XI.
XlI.
Ilocos
Cagayan
Central Luzon
Southern Tagalog
Bicol
Western Visayas
Central Visayas
Eastern Visayas
Western Mindanao
Northern Mindanao
Southern Mindanao
Central Mindanao
Provinces
Total
Population
Municipalities as of 1980"
7
7
6
10
5
5
3
5
3
6
5
5
115
67
34
72
50
61
72
53
28
55
68
34
1,445,522
1,129,268
843,611
1,299,226
1,059,419
1,477,525
1,839,817
944,817
569,605
1,254,448
1,833,747
743,083
Total Upland
67
709
14,440,088
Total Philippines
73
1,505
48,098,460
Percent of Total Population
92
48
30
• Derived from municipal population data.
Source: Cruz, Zosa-Feranil and Goce (1986). Values derived from the National
Census and Statistics Office, published census for 1980.
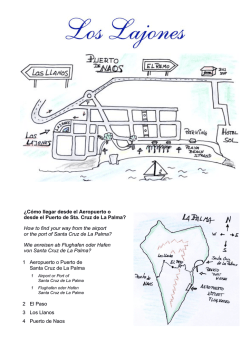
the public domain (Cruz and Zosa-Feranil, 1988). A significant 30 percent
of forestland population (2.55 million) are migrants who have little experience with farming on steep slopes (see Figure 1).
The Philippine government defines upland as comprising:
(1)
marginal lands with slopes 18 percent or higher, (2) lands within identified
mountain zones including table lands and plateaus lying at high elevations,
and (3) lands within terrain classified as hilly to mountainous (BFD, 1982).
Around 14.9 million hectares or one-half of the entire country's land area are
classified as upland. Over 57 percent of the upland area (or 8.5 million
hectares) is suitable for agriculture based on a simple slope classification
defining the limits of upland agriculture as 30 percent slope and above.
18
JOURNAL
OFPHILIPPINE
DEVELOPMENT
Figure 1
ESTIMATED UPLAND AND FORESTLAND POPULATION, 1980 AND 1988
Base Figure
From 1980 National Census
Total UplandPopulation
14.4 million
I
I
Urban = 2.94
million
I
I
Tribal population=
5.0 million*
Current (1988)
Estimate**
1
Occupying
Forestlands=
6.9 million
Occupying
A & D lands =
4.56 million
I
MigrantPopulation=
1,9 million
Projectedfrom 1975 - 1980
GrowthTrends
17.8 million
I
I
Urban= 3.63
million
I
Occupying
forestlands=
8.5 million
Occupying
A & D lands =
5.67 million
I
Tribal population =
5.95 million
Migrant population=
2.55 million
* based on estimates providedby DENR (1986)
** assumes from 1975-1960 growth rates that the upland population will decline
by 5 percent every 10 years.
CRUZ, ZOSA-FERANILAND GOCE: POPULATIONAND UPLAND DEVELOPMENT
1•
19
Estimating Upland Population
There are at leastthree reasons for undertaking a systematic analysis
of upland population movements• The first has to do with the significance
(in both actual number and proportion) of the-growing population of upland
dwellers in the country• The current upland population of 17.8 million
represents 30 percent of the total population of 58 million• The annual
population growth rate for the period 1948 to 1980 is 2.5 percent which
meansthat if such a rate were to continue, population in the uplands would
double in 25 years.
The second reason is the urgency of resolving the critical problems
associated with population stress onforest resources. A greaterdemand for
enforcing effective conservation and forest protection policies is needed
especially if movement intoeasily erodable and critical watershed sites is left
uncontrolled• In addition, man-to-land ratios increase rapidly with in-migration. Migrant settlers often use farming techniques different from those
suited for upland cultivation, leading to such destructive effects as increased erosion, silting and clogging of waterways downstream.
The third reason for arriving at a good population estimate for the
uplands is the needto addresscurrent problemsof lowincome and poverty.
Upland residents havebeenfound to be amongthe "poorest ofthe poor" with
annualper capita incomes of'P2,168 ($108), which isway belowthe average
poverty cut-off for families belonging to the bottom 30 percent income
bracket (Quisumbing and Cruz, 1986; Cruz, et aL, 1987). As of the third
quarter of 1983, the poverty incidence rate in forestry and forest-based
occupations was 47 percent,which is significantly higher than the 43 percent
poverty incidence rate for lowland rice and corn farmers.
It is extremely difficult to estimate upland population because administrative boundaries of municipalities do not correspond with the
government's definition of upland. Nonetheless, Figure 2 specifies a stepby-step procedure for obtaining an adjusted population count using a
settlement density factor (SDF) based on aerial photographs. The SDF is
the ratioof the numberof dwellingswithinan uplandboundaryrelativeto the
totalnumberof dwellingsinthe municipality.This isthen usedas an index
of the numberof residentswithinthe uplandarea.
Forexample, areas lyingentirelywithina mountainzone receivean
SDF valueof 1.0 whilemunicipalities
withone-thirdof houseslocatedinthe
uplandsreceive an SDF value of 0.33. Municipalitieswith 75 percentor
•more of land area lyingwithinan uplandboundaryare consideredin the
populationcount.ASafinalstep,theSDFfigureisthenappliedtothecensus
populationfigureto adjustfor the actual populationresidingin the upland
portion of the municipality. Based on this procedure, there are 302
municipalitiesin 60 provinceswhich can then be classifiedas upland,
20
JOURNAL
OFPHILIPPINE
DEVELOPMENT
Figure 2
IDENTIFICATION PROCEDURE FOR DELINEATING UPLAND SITES
Step, 1 DELINEATION OF MAJOR MOUNTAIN ZONES
L
(using 1:50,000 scale topographic,map)
Mountain Zoning
or Mapping
I
nil
_a
c,oc 'oo
i ,'on
MountainRange
I
of Mountainor
,
YES
of IdentifiedMountain
NO.
1) ...
I= Zones
Include(LIST
in Listing
II
Step. 2 CLASSIFICATION OF AREAS BY MUNICIPALITY
• " Overlay Administrative
I Boundariesof Municipalities
Is
_75%
_"
Witllin - " "_--_|
"_
Mountain _
or more
NO| Exclude
or land area -_
|
in
I in zone?
YES
_
|Listing
] YES
identified Mountain
Zone Municipalities
(LIST OF NO. 2)
"_"
l
Step 3. CLASSIFICATION OF AREAS BY.SLOPE
i
Overlay of Slope "i
Map per Province
1
q
75% or more
of area within
18% or more
in 18% or
more
slope
land zone
YES
Include in.Re'visedListing--I
and ClassifyArea by Slope I -_
I Categories (LIST NO. 3)
1
YES
Exclude
in
Listing
_
CRUZ,ZO$A-FERANIL
ANDGOCE:POPULATION
ANDUPLANDDEVELOPMENT
Step 4. TWO-STAGE
VERIFICATION
" Identify municipalitieswith less
than 75% of land area in mountain
zone, but with total area of
1,000 hectares or more
IJ
Check area's topography
Using aerial photographs
lOOO
oreha.'o;_
in _ j
NO_1
jExc,u_e
Listing i.l
Include in Listing of Upland I
Municipalities
I
Compute from aerial
photograph percentage
of settlement's located
in uplands
Include percentage information
of settlement density in listing
of upland municipalities
(LIST NO. 4)
V
'-Cross-reference listing with BFD
list of projects and available
listing of upland development
projects of non-BFD agencies and
from NGOs
as FINAL LIST
Adopt",t
no.'
I
'Check land area coverage of these
stee usng aer a photograPhs
Area and include information in
I Estimate
settlement
revised
list (FINALDensity
LIST) of .I
21
22
JOURNAL OFPHILIPPINE DEVELOPMENT
Step5. VALIDATIONANDFEEDBACK
I
governmentagencies(mainlyBFD)
SendFINALLISTtoconcerned
I
and applyverificationprocedure
Incorporatereactions/feedback
I
•
I
I ReviseFINALLISTif
needed '1
I
representing48 percent of the entire listing of municipalities in the Philippines (see Table 1).
Table 2 contains Upland population estimates for the period 1948 to
1980. The period of rapidgrowth in upland population occurred in the years
1960 to 1970, at an average of 3.09 percent per year. Although the upland
population growth rate gradually declined in the succeeding years (2.5
percent per year), population size has grown steadily.
The attractiveness of upland sites varies markedly across the 12
regions of the Philippines, with density levels ranging from 61 persons/
square kilometer in the Cagayan Valley region to 280 persons/square
kilometer in Central Visayas (see Table 3). The highlands of Cagayan
Valley, Southern Tagalog, and Southern Mindanao comprise 45 percent of
the total uplands but their combined population accounts for only 20 percent
of the total upland population for the years 1948 to 1980. Meanwhile, the
regions of Central and Western Visayas,which represent 10percent of the
total upland population, comprise only 5 percent of total land areaclassified
as upland.
The average population density for all upland areas was 39 persons/
square kilometer in 1948. This increased dramaticallyto 74 persons/square
kilometer in 1970 and then rose sharply to 119 persons/square kilometer in
1988. Some areas exhibit rapidincreases in population due to the very large
influx of migrants. The proximity of the province of Laguna to Metropolitan
Manila,for example, partly explains the doubling of population in its upland
in the period 1960to 1975 when resettlementfrom crowded urban centers
accelerated.
GRUZ,ZOSA-FERANIL
ANDGOCE:
POPULATION
ANDUPLAND
DEVELOPMENT
23
Table 2
UPLAND POPULATION REGION, 1948-1988
Region
1948
PHILIPPINES 5867586
1960
1970
1975
1980
1988*
8190012 11108731 12703070 14440088 17835118
I. Ilocos
755878
973245 1205127
II. Cagayan 402065
591987
832473
III. Central
Luzon
284968
408994
633034
IV, Southern
Tagalog 422012
665626
957965
V. Bicol
496408
740710
916094
VI, Western
Visayas 860566 1068708 1178576
VII. Central
Visayas 1035154 1216953 1462250
VIII, Eastern
Visayas 566555
659191
794222
IX. Western
Mindanao 198936
274666
422081
X. Northern
Mindanao 384123
553919
875480
XI. Southern
Mindanao 308713
688510 1224869
XII, Central
Mindanao 152208, 347503
606560
1317257
971231
1445522
1129268
1677784
1437203
742182
843611
1035907
1129221
987626
1299226
1059419
1659935
1184988
1362450
1477525
1681552
1639949
1839817 2212068
863411
944817
1091472
460556
569605
800166
1047295
1254448
1674991
1503734
1833747
259278
678158
743083
859774
,I,L
J.IIV_
Basic sourceof data: Cruz, Zosa-Feraniland Goce (1986),
* Estimated populationfor 1988 basedon populationprojectionsfrom the 1975-80
level.The estimatesassumethatpopulationinvariousregionswilldeclinefromthe
1975-80 level by 5 percentevery 10 years,
24
JOURNAL
OFPHILIPPINE
DEVELOPMENT
Table 3
UPLAND LAND AREA AND POPULATION DENSITY BY REGION,
1948-I 988*
Region
Land
Area
(sq. km.)
1948
PHILIPPINES
149698.7
39
55
15121.5
23437.3
50
17
6118.9
I. Ilocos
II. Cagayan
III. Central
Luzon
IV. Southern
Tagalog
V. Bicol
VI. Western
Visayas
VII. Central
Visayas
VIII. Eastern
Visayas
IX. Western
Mindanao
X. Northern
Mindanao
Xl. Southern
Mindanao
XII. Central
Mindanao
1960 1970
1975
1980
1988
74
85
96
119
64
25
80
36
87
41
96
48
111
61
47
67
103
121
138
169
23062.4
7187.6
18
69
29
103
42
127
49
137
56
147
72
165
10079.5
85
106
117
135
147
167
7891.6
131
154
185
208
233
280
8537.6
66
77
93
101
111
128
5520.3
36
50
76
83
103
145
11761.9
33
47
74
89
107
142
21281.7
15
32
58
70
86
118
9699.2
16
36
63
70
77
89
" Densitymeasured as number of persons per square kilometer.
Basic sourceof data: Cruz, Zosa-Feraniland Goce (1986).
2.
Dependency
Ratio
Over 43 percent of the upland population _re in the young age bracket
of 0-14 years, while 54 percent are of working age (15-64 years). Such an
age distribution indicates a relatively high dependency burden as the figures
in Table 4 show. On the regional and provincial levels, dependency ratios
do not vary significantly except for a few areas with a very high dependency
burden. These areas are found mostly in the Bicol region with dependency
figures larger than 200.
Table
DEPENDENCY/:IATIOS
(IN
SQ.
4
AND
KM.)
o
FOREST
COVER
VARIABLES
(_
"rl
Dependency
1980
Level
Percent
Age
15-64
Years
Density
L eve/
1975
1975
Total
Forest
Land
Alienable &
Disposable
Land
Density
Level
1980
1984
Total
Forest
Land
-rim
AhenabJe &
DisposaMe
Land
_
_.
63
High Dependency
(190 or more)
Bicol
EasternVisayas
Central M[ndanae
Western Visayas
'_
49
52
52
53
137
101
70
135
5,561
1t,929
18,310
7,032
(32)
(56)
(63)
(35)
12,071
9,502
10,696
12,190
(68)
(44)
(37)
(65)
147
111
77
147
5,500
I0,600
14,000
6,500
(31)
(50)
{60)
{32)
12,100
10,800
9,400
12,700
(69)
(50)
(40)
(68)
Moderate Dependency
(185-189)
Z
Z
t"e
SeuthernTagalog
Southern Mindanao
53
53
49
70
28,890
I6,356
(61)
(60)
18,623
10,970
(39)
(40)
56
86
-27,900
20,100
(59)
(64)
19,600
11,500
{41)
(36)
Cagayar_
Weste,'nMindaneo
54
54
41
83
26,253
10,'[08
(72)
(54)
10,150
8,578
(28)
(46)
48
103
26,200
9,900
(72)
(53)
10,300
8,700
(28)
(47)
Low Dependency
z
C3
<
m
t£
(<185)
I;ocos
Central Visayas
Central Luzon
Northern Mindanae
C
55
55
55
56
87
208
121
89
12,5o7
6,903
8,102
18,344
(57)
(46)
(44)
(65)
9,620
8,049
10,175
9,983
Source: Cruz, Zesa-Feranil and Gece (1986), Table 3.16, p, 67,
Note: All numbers in parentheses are percentages,
(43)
(54)
(56)
(35)
96
233
138
107
12,4o0
6,700
8,100
18,100
(58)
(45)
(44)
(64)
9,1o0
8,200
10,300
10,3Q0
(42)
(55)
(56)
(36)
z
"-_
I_,
26
JOURNAL
OFPHILIPPINE
DEVELOPMENT
Around 39 municipalities can be characterized as =critical" areas -that is, having a very highdependency burden and located in easily e rodable
sites, with average slopes of 30 percent or higher. In these areas the need
to exploit forest resources is so great that carrying capacity limits are
reached much earlier than in other sites (refer to Table 4).
II1.
Determlnantsof
Upland Migration
The adjusted migration figures in Table 5 represent the proportion of
the total migrant population moving to the uplands for the period 1975 to
Table 5
MIGRATION TO UPLAND AREAS, 1975-1980
Intra-Regiona/
Region
Migrants to
Up/and Areas
from Other
Provinces of the
Same Region
I. Ilocos
II. Cagayan
II1. Central
Luzon
IV. Southern
Tagalog
V. Bicol
VI. Western
Visayas
VII. Central
Visayas
VIII. Eastern
Visayas
IX. Western
Mindanao
X. Northern
Mindanao
XI. Southern
Mindanao
XII. Central
Mindanao
Inter-Regional
In-Migrants to
Up/and Areas
from Other
Regions
Total Out-Migrants Regional
Lost to Up/and
Up/and
Areas in Other
Net
Regions
Migration
14657
8680
17279
176'70
18017
8912
-738
8758
5855
17792
15775
2017
11361
5684
40216
11094
12101
13487
28115
-2393
6644
9951
23934
-13983
4959
20332
39950
- 19618
2860
10056
18985
-8929
2881
8354
14668
-6314
21781
48228
23088
25140
23653
47120
21863
25257
5247
26195
16147
10048
Source: Cruz, Zosa-Feranil and Goce (1986), Table3.22, p. 77.
CRUZ, ZOSA-FEFIANILAND GOCE: POPULATIONAND UPLAND DEVELOPMENT
27
1980. Since migrationdata duringintercensalyearsare not available,the
figuresare likelyto be underestimated.
After 1948,twogeneralmigrationpatternsmaybe observed.The first
patternfromthe earlypostwaryearsupto 1960,isthe movementof people
fromthe Visayasregionsto the frontierlandsof Mindanao. The second
waveof migrationoccurredalter 1960, andisthepredominantlyurbanward
movementalthoughsizeablemigrationalsooccurredin manyuplandareas
(Perez, 1978). Infact,in theearlyseventies,some47,000 migrantsmoved
to the uplandsof SouthernTagalog and Central Luzon from the urban
centersof MetropolitanManila.
Overall, the largestnet migrationto uplandareas occurredin lands
withrelativelylowpopulationdensity.Therewas a moderatelylowdependency levelin someregionssothatthepotentialfor absorbingnew migrants
was muchlargercomparedto the relativelypopulatedareas. Thiswas the
case for SouthernTagalogand SouthernMindanaobefore 1970, but as
populationincreasedin these regionsthere was a substantialdrop in inmigrationduringthe succeedingyears.
The generalpatternof movementsacrossregionsischaracterizedby
longdistancetravelwhich is selectiveof age and sex. The early-period
migrants(postwarupto 1960)tendedtobe youngand males. Forexample,
65 percentof totalmigrantstotheuplandsin NorthernMindanaowere males
between20 and 34 yearsofage (WernstedtandSimkins,1965). Migration
inthe laterperiod(after1960)wasstilldominatedbymales,butthesetended
to be older(45-54 years). These latermigrantsalsotravelledmuchlonger
distances,originatingfrom variousplacesand oftencrossingmajorisland
groupings. A significantpercentage of females (80 percent of lifetime
migrantsin 1975) was observed to have constitutedthe second-wave
movementsfollowingthe earlieryoung,male-dominatedmigrationstreams
once more establishedmutes were set. Such a two-stage pattern of
movementprevailedthroughoutthe country,regardlessof areas of origin
and destination.
The presenceof relativesand friendsin destinationareasservedas
a significantinducementfor movement.Especiallyamongyoungmigrants,
distancedid not serve as a deterrentto movementas long as there was
ethnicsimilarityin the placeof destination.The presenceof manygroups
of peoplewhospeakthesame languageorwhocomefromthesameethnic
,groupingprovidedmajorinducementstotransfer.Thiswastrueof migration
into the Mindanao uplands,where manyfrontiersites were even named
after placesof originin the Visayas.
Agriculturalproductivity,as it affectsincomeand employmentat the
place of origin,greatlyaffectedthe likelihoodof movement(Gonzalesand
Pernia, 1985). Higherrates of out-migrationwere observed,for example,
in communitieswithlessfavorableagriculturalconditions(Otsuka,1987).
28
JOURNALOF PHILIPPINE DEVELOPMENT
Hayami (1979) noted a significant declinein population when average farm
sizes increased in Laguna province from 28.8 hectares to 45 hectares. The
impact of existing land reform in overcoming pressures to limited land, and
in expanding access to cultivable lands, has been minimal. Infact, there is
at present a greater concentration of income and assets among large farms
and increased landlessness in the rural sector. The ratio of cultivated land
to population declined from 0.18 in 1960 to 0.11 in 1975, the years when
upland population grew at a high rate of 3.03 percent per year (David and
Otsuka, !987).
1.
Econometfc Models of Migration
Three macro-migrationeconometric modelswere used to estimatethe
relative contributions of different factors to population movements in the
uplands. These models are: (1) the modified'gravity model, which evaluates migration across regional boundaries, (2) the quasi push-pull model
which explains_nter-provincial movements, and (3) the pull model, which
analyzes short-distance movements across municipal boundaries. The
need to use three models follows from the observation that different factors
emerge as significant depending on the nature of population movements.
a.
Migration Factors. The principal factors affecting inter-area
migration flows are classified intothoseassociated closely eitherwith areas
of origin or of destination. For example, population at the place of origin is
expected to influence migrationthrough its effects on the marginal product
gf labor. Populationin the area of destination, on the other hand, serves as
a proxy for size of the labor market, the larger population centers having a
greater number of job opportunities.
Correlates of processes related to origin and destination may be
divided into personal characteristics of migrants and factors relating to the
land. The usual variables associated with personal migrant characteristics
are education and occupation. Education is measured by the literacy rate
and is treated as an "amenity variable", the more literate population having
the greater mobility. Literacy rate servesas a proxy measure of access to
education services and does not reflect actual levels of educational attainment among migrants. Occupation is measured as the ratio of gainful
workers (15-64 years) to the total employed in agriculture, fishing, and
forestry.
The important land-based factors are availability of arable land and
forest cover. Land availability is adjusted to reflect the average size of
landholdings, site quality, and land tenure. Land size and quality are
measurable from secondary data. Tenure is includedas a binary variable
for presence or absence of long-term property arrangements.
CRUZ, ZO_A-FERANIL AND GOCE: POPULATION AND UPLAND DEVELOPMENT
29
Forest cover serves as a proxyforlandsuitability,withareas of dense
forest cover being more productiveand stable. Forest cover is also
correlatedwithdensity,i.e. high-densityareastendto havelessforestcover
owingto the conversionof forest landsto agriculturaluse.
Distancebetweenareas oforiginand destinationhas normallybeen
associatedwithvariablecostsof transfer. Distancehasa strongdeterrent
effect on movement, that is, longer distances tend to impose greater
financial, physicaland psychiccosts. In the specificcase of lowland-toupland movements,stage migrationis utilized to dampen the effect of
distance on the decisionto migrate. Since long-distance moves are
generallyby sea, the availabilityol portsof disembarkationand accessible
transportationwill have a close interactionwithdistance.
b.
Results of Macro-Migration Models. The results of all three
macro-migrationmodelsindicatethatthe availabilityof landin the uplands
is the more importantdeterminantof movementcompared with factors
associatedwiththeareaoforigin.However,thereare significantdifferences
in the determinantsdependingon typeof movement. As expected,in the
long distanceinter-regionalflows,the actual lengthof distancetravelled
emergedas significant.Thisobservationisconsistentwith nationalmigration trends, where inter-regionalflows were larger than intra-regional
migration(Perez, 1978). For the relativelyshorter,inter-provincial(intraregional)flows, demographicfactors suchas populationand educationat
the areasofdestinationservedas thesignificantexplanatoryvariables. At
the municipalitylevel (moveswithinprovince)land-relatedvariableswere
more significantthandemographicfactors.
c.
Inter-regional Migration Function. Inter-regionalmigrationis
specified in terms of the "gravitymodel", that is, gross migration is
influencedby the numberof actualmoversand the distanceof movement
(Shyrock,Siegel, et aL, 1971). However,the modelcontainsmajor limitationswhich may restrictits explanatoryvalue. For example, the relative
elasticitiesoforiginanddestinationpopulationsare assumedtobe constant.
In thisway itfailsto explainwhypopulationat destinationis proportionalto
grossmigration.Secondly,havinga linearform,thegravitymodelcan only
inadequately capture migrationdecisionmaking and is-inferior to the
standardprobabilisticmigrationmodelssuchasthe Iogitor polytomousIogit
functions.
Table 6 presents the results of the measurements. Two factors,
namely distance (DIST) and demographic size (POPi and POPj), account
for the large variability in migration. The proportion of urban population is
also significant and negatively correlated with migration, implying that the
more denselypopulated areaswith a higher percentageof urban population
30
JOURNAL
OFPHILIPPINE
DEVELOPMEN'I
_
Table 6
REGRESSION RESULTS OF INTER-REGIONAL MIGRATION MODEL
Coefficient
Intercept
T-value
- 706.377
POPi (Populationat
Placeof Origin, 1975)
0.0024
2.562**
POPj (Populationat
Place of Destination,1980)
0.0026
2.562**
DIST (Distance)
Forest Cover
Percent Urban
Population,1980
- 3.070
0.0273
- 61.6976
R - square
0.6419
F-value
3.3645
N (samplesize)
- 2.538**
0.734
1.355"
30
* significantat 10% level
** significantat 5% level
Source: Cruz, Zosa-Feraniland Goce (1986); takenfrom Table 4.5a, p. 121.
attract less migrants since land is less available. It will be noted, however,
that forest cover is insignificant, although present urban population may be
expected to have captured some of its effects. Distance is highly significant
and negative, implying that it serves as a major deterrent to movement.
d.
Inter-provincial Migration Function.
A quasi push-pull
model iS used in explaining province-to-province movements within a
region. The variables included in the model proceed from a dichotomy
between conditions at the origin and at the destination. Unfavorable
conditions at the place of origin encourage out-migration while prospects of
a better life and good economic conditions at the place of destination tend
to induce in-migration.
The results presented in Table 7 show that economic conditions at the
place of destination have a greater effect on migration than the combined
CRUZ,ZOSA-FERANIL
ANDGOCE:
POPULATION
ANDUPLAND
DEVELOPMENT
31
Table 7
REGRESSION RESULTS OF INTER-PROVINCIAL MIGRATION MODEL
Coefficient
Intercept
T-value
3517.72
POPi (Populationat
Place of Origin, 1975)
0.0001
0.1129
POPj (Populationat
Place of Destination,1980)
0.00123 _
1.3447"
PDi (PopulationDensityat
Placeof Origin, 1980)
0.8208
0.3842
PDj (PopulationDensityat
Placeof Destination,1980)
- 2.9136
- 1.6680*
EDUCj (Education)
57.0743
2.5244**
LA (LandAvailabilityat
Place of Destination,1980)
- 0.0812
- 0.0974
DIST (Distance)
- 0.6488
- 0.5152
EMPj (EmploymentOpportunities
at Placeof Destination,1980)
6.0927
0,2770
R - square
0.4586
F-value
1.3651
N (samplesize)
50
* significantat 10% level
** significantat 5% level
Source: Cruz,Zosa-Feranil,and Goce (1986); takenfrom Table 4.3a, p. 115.
origin-related variables. However, this may be due to lack of information in
the sending areas rather than the actual contributions of such variables to
migration decisionmaking. Gonzales and Pernia (1983), for example,
argue that the extent of migration at the place of origin serves as an indicator
of agricultural productivity. High income levels and greater economic
oppOrtunities at the place of origin reduce the likelihood of out-migration as
32
JOURNAL OF PHILIPPINE DEVELOPMENT
shownbyinter-regionalmigrationtrendsfor 1960 to 1970. Otsuka's(1987)
study of three villages with different production environments shows that
areas with high adoption rates for modern rice varieties displayed a
substantially larger population growth rate of 2.45 percent per year. Less
favorable sites, such as those using rainfed agriculture, had large outmigration. Man-land ratios increased markedlyin the irrigated areas (6.29
persons/hectare) relative to the rainfed sites (4.7 persons/hectare).
Three variables are significant in explaining movements within a
region. These are population at destination (POPj), population density at
destination (PDj), and education (EDUC). These variables indicate that
area characteristics in the receiving provinces exert greater influence on
migrant decisionmaking. However,these factors explain only 45 percent
of the variation in inter-provincial migration.
The significant effect of the education variable on migration should be
noted. Higher literacy rates at places of destination tend to attract more
migrants while larger population densities have the opposite effect. However, migrants tend to be more literate as shown in their manner of
evaluating economic options and in their ability to take risks in order to
improve their livelihood.
e.
Inter-municipality Migration Function. In general, short-distance populationmovements(withinprovince)are sensitivetothree factors
-- populationat the placeof destination(POPj), landavailability(LA), and
sitequality(DSLP) as measuredbyaverageslope. Incontrastto theeffect
of distanceon movementshownin the previousmodels,absolutepopulationlevelsat theplaceofdestination,ratherthandistance,servedto induce
migration through its effect on informationflow. A larger population
increasesthechancesofestablishingcontactsand findingethnicsimilarity
(suchas friendsand relatives,or thosewhospeakthe same dialect).
Table 8 presentsthe resultsof the modelshowingthe importanceof
allland-relatedfactorsexceptLUIA, whichisthe percentageof arable land
to total agriculturalland. The inadequate measurementof "arable" land
(being based solelyon slope)possiblycontributedto itspoor performanoe
in the model. Sincethe movementsare relativelyshorter comparedto the
previousmodels,the distancevariablewas notsignificanteither.
The appearanceof the landarea variable(LA) as highlysignificantis
asexpected. However,itsrelativecontributionto inter-municipalitymigrationisquitelow(0.89). In contrast,theslopevariable(DSLP),whichserves
astheenvironment'simpactonpopulationmovement,hasan inverseeffect
onmigration.The effectissubstantial,a onepercentincreaseinsteepness
(slope) causinga three percentdecline in migration. Both land-based
variablesexplainmorethanone-halfof the variationin migration.
Anothersignificantland-relatedfactoristhe presenceof non-farming
CRUZ,ZOSA_FERANIL
ANDGOCE:
POPULATION
ANDUPLAND
DEVELOPMENT
33
Table 8
REGRESSION RESULTS OF INTER-MUNICIPALITY MIGRATION MODEL
Coefficient
Intercept
T-value
722.486
POPi (Populationat
Place of Destination,1980)
0.0040
10.284*°
LA (LandAvailability)
0.8949
2.745**
LUIA (PercentArable Land
to TotalAgriculturalLandArea)
1,669
0.544
DSLP (DummyVariablefor Slope)
- 320,921
DIST (Distance)
NFOP (Availabilityof Jobs)
- 23,1108
- 220,880
R - square
3.109"*
0.129
- 1.111"
0,7467
F-value
32,1369
N (samplesize)
160
* significantat 10% level
** significantat 5% level
Source: Cruz, Zosa-Feraniland Goce (1986); taken from Table 4.1, p. 106.
opportunities (NFOP), which is treated as a binary variable for logging or
non-logging sites. It is hypothesized that the availability of jobs in logging
concessions would lead to greater in,migration. However, the coefficient
turned out to be negative, indicating that migrant preferences were oriented
more towards agricultural opportunities as shown by the land availability
variable rather than off-farm work. Overall, the "pull" model used in
explaining inter-municipality migration was significant, explaining almost 75
percent ofthe variation in migrant behavior.
IV.
Case Study of Upland Migration
Most studies of internal migration in the Philippines are based on
demographic data obtained from various censuses and analyzed at the
34
JOURNAL
OF PHILIPPINE
DEVELOPMENT
provincial and regional levels. While Part III evaluated migration trends
using macro data, this section focuses on the analysis of upland migration
within the specific context of a particular
community
and environment.
Three topics are included:
(1) migrant
adjustment
processes
after
movement,
arrival, and
1.
(2) "factors influencing"
migrant livelihood opportunities
upon
(3) variations in resource use and access to forest resources.
Geographic
Description
and Location
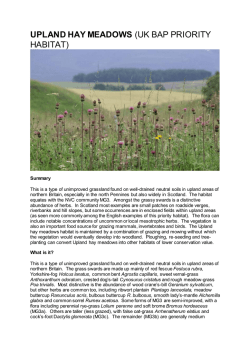
The communities
in the case study are Putho-Tuntungin,
Lalakay, and
Puting Lupa, all located within the Mount Makiling watershed
surrounding
/he municipalities
of Los Ba_os, Calamba, and Bay in Laguna province,
and Sto. Tomas municipality
in the nearby province of Batangas.
Map 1
shows the general location of the study sites, and Table 9 provides
a
breakdown
of the population
and sample included in the socio-economic
survey.
The Makiling forest covers about 4,244 hectares,
with elevations
varying
from 200 to 2,000 meters
above
sea level (Lantican,
1974).
The
Table 9
DISTRIBUTION OF THE POPULATION AND SAMPLE
FOR THE UPLAND MIGRATION SURVEY
PuthoTuntungin
Lalakay
Total Household Population'
588
377
120
1,085
Total No. of Migrant Households 2
356
260
87
703
Percent Migrant Households to
Total Household Population
60.5
69.0
Total Sample Size (n)
18
13
Percent of Sample to Total
Migrant Household Population
5.1
PutingLupa
5.0
72.5
9
10.3
Total
64.8
40
5.7
' Data generated from the barangay captain's enumeration of the sitio's population
in 1985.
2 Based on barangay captain's assessment of migrant households in the sitio as of
1985. "Migrant" defined as moving residence from a different municipality or
province.
Source: Cruz, Zosa-Feranil
and Goce (1986); Table 5.1, p. 133.
,.n
t.N
Map I
LOCATION MAP OF THREE MIGRATION STUOY SITES (IN MT. MAKILING)
,.I)_
.'o
|
"11
m
°
°
.m.
Z
_'
PUTPNGLUPA
pUTHO TuNTU,htG|N
0
Z
C
"o
0
0
m
<
m
tO
m
36
JOURNAL OF PHILIPPINE DEVELOPMENT
forest serves as an upper catchment for over 2,000 hectares of irrigated
ricelandsin the surrounding municipalitiesof Galauan, San Juan, Calamba
andLos 13ahosin Laguna province and thesole catchmentfor Laguna Lake.
Most of the Makiling highlands are rugged and steep. Along the
western slopeis a seriesof hillyto flat landswith numerouscollectingbasins
and marshlands. On the eastern slopes, the Cambantoc River has an
extensive tributanj that allows some form of upland agriculture.
In general, soilsin the Makilingforest are suitable for upland agricullure, being well-drained. The dominant soil type is volcanic and the soil
series is Macalod clay loam (UPLB-CF, 1979). The dark brown topsoil
reaches a depth of 35 to 40 centimeters, The subsoilis gravelly.clay loam
with a substratumconsistingof hard rocks.
The heaviest rainfall occurs in the monthsof Augustthrough November,with an average monthly precipitationof 250 ram. The dry months are
January until May. For the period 1966to 1985,the average yearly rainfall
was 1,845.9 mm, which was significantly higher than the 965 mm average
for the entire country.
2.
Settlement History
Historical accounts of activities in Mount Makiling indicate that settlement in the nearby towns of Bay and Los Ba_os started as early as 1593.
Franciscan missionaries built a church and sanitarium called Agua Santas,
referring to the natural hot spring water of volcanic origin. Based on
available census data and accounts of key informants, there were three
significant stages of migration that evolved after the 17th century.
The first stage was in the early years of settlement up to 1918. Most
of the early migrants settledon the Western side,with an average population
growth rate of 4.3 percent per year.
The second stage of in-migration occurred with the opening up of
interior forest lands starting in 1960,with movements sustained up to 1970.
The rateof populationgrowth during this period escalated to 8.4 percent per
year, the largest increases occurring in the years 1960 to 1963. By 1960,
in fact, the population had already increased three-fold from the 1948
population level, but it was in 1965 when frontier migration peaked.
In the third stage of population movement (after 1970), there was a
slight decline in in-migration. A larger proportion of migrants was made up
of landless workers from the nearby municipalities of Quezon province,
although a significant number also came from the Bicol region. Migration
into the interior forest continued, and as lands became scarce, two new
practices emerged.
Thefirst practice involvedthe maintenanceof two farming households.
One household would maintain the productive farm plot, which would
CRUZ, ZOSA-FERANIL AND GOCE: POPULATIONAND UPLAND DEVELOPMENT
37
normally belocated nearthe village settlementatthefoothills.The otherplot
wouldbe less productiveand locatedin the steeperportionsof the forest.
This plotwouldbe cultivatedby relativesorfriendswhohad newlyarrived,
usuallyfor a periodofaboutsix monthsto a year, untila separateplotcould
be found.
The secondpracticeinvolvedthe recruitmentof landlessworkers,
mostlyfrom the Bicol region. These landlesslaborerswould be given
around300 squaremetersof homelotin exchangefor one year of laborin
thecultivationof uplandcrops. By 1980 manyof the recruitedlaborershad
set up swiddensin the remotesteepersectionsof theforest.
3.
Profi/e of Migrants in Maki/ing
A large proportionof migrantsin the Makilingcase study siteswere
bornin the SouthernTagalogregion. In fact,42 percentof migrantscame
from nearby Batangasprovince. The long-distancemigrantscame from
NorthernLuzonbuta good15 percento! migrantsoriginatedfromthe Bicol
and the Visayas.
a.
Age-Sex Characteristics. The average age of migrantsis 48
years, the householdsize beingsix. The averageage of migrantswas 26
yearsat the timethey arrivedat Mount Makiling,whichis consistentwith
otherstudiesoffrontiermigrationwheretheaverageageof migrantsranged
from23 to 28 years(Wernstedtand Simkins,1965).
Thereisa slightlymale predominanceamongthe populationat Mount
Makiling,witha sex ratioof 103 malesfor every100 females. Duringthe
yearsof rapid in-migration,the populationwas predominantlymale, with a
male-femaleratioof 116.
b.
Marriage and Kinship Ties. About one-half of migrantswho
movedintothe Makilingarea in 1960 to 1970 were married,the restbeing
singlemales. Aspopulationmovementsprogressed,therewas a significant
declinein the proportionof unmarriedmigrants(28 percentin 1980).
Kinshiptiesarereflectedinthenumberofrelativesresidinginthe area
at thetimeof movement.The meannumberof relativesatthe timeof arrival
was three in 1950, increasingto fivein 1980.
Among single migrantswho moved to Mount Makiling and later
married,about83 percentchosepartnerscomingfrom the sameplacesof
origin. This preference for marrying within their own ethnic grouping
reinforcedtheclosenessof variousmigrantfamilies.
c.
Tenure. TOdifferentiatebetweenvarioustypesot landaccess,
land tenure data were gathered. However,since many householdshad
38
JOURNAL OF PHILIPPINE DEVELOPMENT
access to severalparcelsof landundervaryingpropertyarrangements,the
dominanttenurestatuswas definedas that pertainingto the piece of land
whichprovidedthe highestincomeand on whichthe householdspent a
majorityof its labortime.
In general,there are four dominantpropertyarrangementsas perceived by respondents.These arrangementsare: owner,tenant, lessee,
and freeholder. Owners arethosewith legalclaimsto the land,suchas a
Certificateof Land Title or receiptsfrom paymentof taxes. Tenants are
residentcultivatorsof lands"ownedorclaimed"byabsenteelandlords.The
tenancyarrangementvaries, rangingfrom a 50-50 to-a70-30 sharingwith
landlordsreceiving30 percentof harvestbut notcontributingto thecostof
production.Lease arrangements,on the otherhand, are basedon a fixed
payment(whetherin cash or kind)to an "owneror claimant". There were
onlythreecases where a writtenlease contractwas made, the rest being
oral agreements.
The freeholdconceptisthedominantformof tenureat MountMakiling,
accountingfor over one-half of the sample farms. Under the freehold,
propertyarrangementsare categorizedin three ways. The firstclassification uses numberof years of occupyingthe land as the solecriterionfor
legitimizinga claim. Migrantswhohavestayedinthe landpriorto 1960 are
considered"owners," whilethose who came after 1960 are labelledas
"claimantsor occupants." Migrants who arrived after 1980 are called
"squatters."
The secondtypeOf=treeuser" followsthe government'sstewardship
concept. The user holdsa legitimaterightto the land througha 25-year
contractwiththemunicipalgovernment.The userpaysan annuallandtax,
but in essencesucha tax is =illegal."
The thirdcategoryof free usetreatsthe landasa =common"resource
among two or more familiesbelongingto a single lineageor clan. Each
family is entitledto the producefrom the landif one contributeslabor and
shares in the costof inputs.
A majorityof free users tend to occupy large landholdings,while
tenants and lessees have comparativelysmalleraverage landsizes. In
terms of incomeearned, however, the oppositetrend can be observed
where ownerstendedto havehigherincomesthanfree users. Tenantsand
lessees have the smallest incomes, with 80 percent and 50 percent,
respectivelyhavingincomesless thant_5,000 per year (see Table 10).
4.
Up
Agricu/ture
Agriculture in the uplands of Mount Makiling is characterized by a
diverse cropping pattern, There are 42 obslved crop mixes with an
average of four types of crops planted per parcel of land. Perennials are
CRUZ,ZOSA+FERANIL
ANDGOCE:
POPULATION
ANDUPLAND
DEVELOPMENT
39
Table 10
- DISTRIBUTION OF INCOME AND LANDSIZE
BY TENURE STATUS (N=40)
,
Tenure Status
Owner
Landsize(hectares)
Lessthan 1 ha.
1.0 - 1.9
2.0 - 2.9
3.0 -3.9
4.0 - 4.9
5.0 and above
Total
Average Annual
Income(P)
Lessthant=5,000
'P' 5,000 - 7,999
1=' 8,000-10,999
'P'I1,000 - 20,999
t=21,000 - 30,000
Morethant==30,000
Total
Numberof Observations
...........
33.3
33.3
33.3
99.9
.............
33.3
Tenant
40.0
20.0
20.0
58.3
25,0
16.7
20.0
100.0
Total
100.0
25.0
20.0
5.0
20.0
30.00
100.0
35.0
20.0
10.0
5.0
15.0
15.0
100.0
PercentageDistribution.........
80.0
66.6
3
(7.5%)
Free Use
PercentageDistribution.........
20.0
99.9
Rent/
Lease
100.0
41.7
33.3
8.3
8.3
8.3
99.9
5
12
(12.5°/.) (30.0%)
50.0
30.0
5.0
10.0
5.0
50.0
25.0
7.5
7.5
7.5
2.5
100,0
100.0
20
(50.0%)
40
(100%)
Source:Cruz, Zosa-Feranil and Goce (1986); Table 5.10, p. 166.
found mostly in the upper slopes but many fruit trees such as jackfruit are
already on the nearby hilly sideslopes.
Fields are burned and cleared from March until May, when the fields
are relatively dry. Cutting of grass and other standing vegetation takesthree
weeks, but in general, fields are never completely cleared of vegetation.
The small proportion of households cultivating upland rice indicates
that many families are avoiding the laborious work of land levelling. There
is also a prolonged rainy season but fields are not adequately drained
making water control even in semi-terraced fields difficult.
40
JOURNAL OF PHILIPPINE DEVELOPMENT
The peak-labor periods coincide with the dry months which are
normallysuitablefor clearingand burning. The other laborpeak occursin
Novemberwhere a second ricecrop is plantedtogetherwith corn. Hired
labor appearsto be the dominantform of labor contractfor rice.
Farming activities take up 86 percent of the total labor allocated and
74 percent of family labor. Of the 25 hoursper week spent in the cultivation
of crops, about two-thirds (or 17 hours) are spent on own fields. The other
|hird (8 hours) is given over to work in other farms or to off-farm work (4
hours).
5.
Exploratory Model of Production and Income
In this section, an exploratory production-income model is discussed
to explain differences in income among migrant households. The model is
designed to evaluate income or production-related consequences of migration, rather than seeking the determinants of migration, which was done in
Section 3.0. However, as Da Vanzo (1981) points out, because the
consequences of migration are often anticipated and in fact are key
determinants of the final decision to move, some of the conceptual and
methodological issues considered in this discussion can be viewed as
common to both types of migration models.
A multipleregression model,using ordinary leastsquares, is used with
total household income (measured as the inputted value of total production) as dependent variable and three sets of independent variables. The
latter are: (1)site-quality factors, (2) variables related to access to
resources, and (3) household-labor characteristics. Land distribution or
equity measurements aretreated separately in the next section using a Gini
ratio of land concentration.
The earlier work of Cruz et aL (1987) on upland corn production in two
other survey sitesin the Philippinesindicatesthat land sizewas insignificant
relative to site-quality factors and that crop diversificationfor soil conservation tended to reduce output. In this study, it was assessed that labor
availability was more constraining than land.
To approximate site quality, scores are assigned depending.on a
combined slope and soil fertility criterion. The land size variable (V2)
appears as a site-quality controlling factor. It is hypothesized that families
with marginal, less fertile lands tend to acquire more lands to compensate
for the lossin fertility.
The second set of factors have to do with differences in a household's
access to resources. Access is measured in terms of amount of credit
received (V3) and presence of relatives as potential sources of credit and
other services (V4). The latter variable (V4) serves the additional function
of testing for a household's security, households with more relatives being
CRUZ,ZOSA.FERANIL
AND GOCE: POPULATIONAND UPLAND DEVELOPMENT
41
more stable.
Household characteristics refer to the nature of the household as
production unit. The dependency ratio (V5) provides information on the
' household's consumption demand relative to its work force. A binary
variable for non-farm income (V6) is also included to reflect presence of
supplementary income sources. Percent of output sold in the market (V7)
is expected to be positively correlated with income, but intervening factors
like market prices and transport, and hauling costs are not directly computed.
Households with more than one parcel to cultivate normally plant
perennials in the other parcel. V8 is a binary variable, receiving a value of
one if perennials areplanted. One expects it to be positively correlated with
income. Education (V9) is also directly related to income. Finally, V10, a
binary variable for presence of conservation Practices, tests whether the
application of conservation techniques affects income negatively. For
example, Segura-delos Angeles (1985) points out that the higher income
farms were less likely to adopt soil conservation practices.
6.
Measurement Results of Production-Income Model
Table 11 contains a summary of the results of the regression estimates. In general, the results indicate that the demographic dependency
burden is significant,reinforcingthe belief that labor, rather than land, isthe
constraining factor in the uplands. The land variable appeared significant
but it contributes less than 30 percent of the variation in income.
Site quality is significant, but the values of the coefficients were much
lower than anticipated, comparedto the large30 to 40 percent effecton corn
yield earlier cited by Cruz et al. (1987) for two other sites with similar
environments. With respect to credit (V3), one must explain its negative
coefficient.The presenceof largeloanamountsmayhaveserved toreduce
overallincomeitselfasinterestpaymentsmayhave increasedtotalproductionexpenses. Inaddition,thelowcoefficientvalueforcreditshowsthatthe
roleof formalcreditin augmentingincome maynot be very significant,so
thatthewiderangeofkinshipties maymorethanoffsetthenon-availability
of credit.
Participationin the local market is measured by percent of total
productionsold(V7). The highlysignificantvalue and positivesignof the
coeffident indicatethe importantrole of commercializationof outputin
improvingthe value of total production.It alsoshowsthe significanceof
farmers'accessto markets in augmentingfarm incomes.
Mostof the binaryvariablesturnedoutto be significant.Presenceof
relatives(V4) ispositiveand significantas expected. Presenceof perennials (V8) and conservationpractices(VIO) arebothsignificant,showingthe
42
JOURNAL
OFPHILIPPINE
DEVELOPMENT
Table 11
REGRESSION RESULTS OF PRODUCTION-INCOME MODEL
.i
Coefficient
Intercept
T-value
793.14
V1
Site Quality
0.0924
1.937"
V2
Landsize
0.2713
1.9768"*
V3
Amountof CreditReceived
- 0.0111
1.9765"*
V5
EconomicDependency
0.0098
2.8607**
V7
PercentOutputSold in Market
0.1352
2.1765"
V8
Percent of Parcel
Plantedto Perennials
0.2744
1.9449"*
Education
0.0937
1.1765
V9
V10 DummyVariab• for Presence
of ConservationPractices
- 0.1398
R - square
F-value
N (samplesize)
0.669
7.63
80
- 2.0807**
• significantat 10% level
•* significantat 5% level
Source: Cruz, Zosa-Feranil,and Goce (1986); takenfrom Table 5.16, p. 190.
importance of land-related factors. The negative sign of V10 supports the
view that conservation techniques are in fact costly for a household to
shoulder so that subsidies may be needed to compensate for the loss in
income. Lastly_,education (V9) appeared significant but with a low coefficient, indicating a primarily neutral effect of education on migrant incomes.
To summarize, the important determinants of migrant incomes are: (1)
acquisition of lands of good quality, (2) access to credit for purchase of
inputs, (3) increased commercialization of farming activities, (4) promotion
of diversified cropping patterns, ancl (5) planting of perennials. The
presence of relatives also had a positive impact on income. The negative
sign for use of conservation practices (V10) supports the argument for
increased public subsidy for soil conservation.
CRUZ,ZOSA-FERANIL
ANDGOCE:POPULATION
ANDUPLANDDEVELOPMENT
7.
43
Equity Considerations
An examinationof land distributionin Mount Makilingis made by
comparingGiniratios for two sets of landholdings:(1)lands in the entire
uplandvillagehavingdifferenttypes of tenurialarrangements and (2) lands
found only within the forest zone which are predominantly under a freehold
system. The results of the estimates of land distribution and their corresponding Gini ratios are shown in Table 12.
Ingeneral, the Gini ratio measuresthe degree of relative inequality in
the allocation of landholdings. The desired ratio is a value close to zero.
Land distribution for the entire area is relatively unequal, with a Gini ratio of
0.697. Around 12 percent of households own over 66 percent of the land
while 55 percent of the population have accessto only 8 percent of the land
area.
in contrast, land distribution in the forest zone tends to be more
equitable under a freehold system. Under such a system, some form of
common property arrangement exists allowing "free use" of land resources
but not complete, open access. Informal rules and sanctions for controlling
membership in the community and access to unoccupied lands exist to
Table12
GINI RATIOOF CONCENTRATION
BASEDONNUMBEROF
HOUSEHOLDS
ANDSIZEOF LANDHOLDINGS
(N=40)
Farm Size
(ha.)
Number
Disldbution Cumulative Total
of
of.
Percentage Land
Households Households Distribution Area
of Households
Lessthan 1.0
1.0- 1.9
2.0 - 2.9
3.0 - 4.9
More than 5.0
Total
14.0
8.0
7.0
60.0
50.0
35.0
20.0
17.5
15.0
12.5
35.0
55.0
72.5
87.5
100.0
400.
Percent
Cumulative
Distribution Percent
of Land
Distribution
Area
of LandArea
23.8
58,7
67.0
209.5
720.0
1,079,01
Gini Ratio:
EntireArea = 0.697
ForestArea = 0,244
Ratio of Highestto LowestFifth = 30.33
Note: Format of Table adopted from Ledesma(1982)
$oul;c_e:
Cruz, Zosa-Feranil and Goce (1986); Table 5,17, p. 192.
2.20
5.44
6.21
19.42
66.73
2.20
7.64
13,85
33.27
100.00
44
JOURNALOF PHILIPPINE DEVELOPMENT
guard against squatting,althoughtechnicallythe forest occupants in these
lands do not have legal claims to the lands they currently occupy. The
distribution of claims to these freehold lands is more equitable: 50 percent
of the population occupy 37 percent of lands. The Gini ratio is significantly
lower at 0.244, a ratio comparable to a lowland rice growing community
where full-scale land reform has been implemented (Ledesma, 1982).
However,these findings do not necessarilylead to the conclusion that
all tenure in the uplands should be converted to freehold. The Gini ratios
indicate rather that land distribution tends to be more equitable when
communal rulesof land acquisitionpredominateover private property where
some form of land marketoperates in the distribution of landholdings. But
many questions still remain regarding the process of land distribution once
new settlements are formed after migration. These include questions
regarding: (1) who controls the distribution of lands, (2) who determines
land allocationfor new migrants, and (3) how oldsettlers control squatting
in previously-claimed lands. Answers to these and other questions will be
important in formulating a land redistribution scheme for the uplands.
V.
Summary
There is a needto address the larger issueof population growth and
the increasing attractiveness of forestlands as places of destination. National population growth trends indicate critical levels of overpopulation in
less than 20 years. The country is projected to reach around 76.9 million
persons by the end of the century, and at least 125 million by the time zero
population growth is attained in the year 2075 (Vu and Elwan, 1982). The
birth rate of 2.59 percent per year is substantial, given that the upland
population is large so that even a small rate of increase can produce
considerable yearly increments.
In broad terms, forest farmers in the Philippines could be clearing, at
the very least500,000 hectaresofforest each year, whether on a permanent
or temporary basis. Many of these migrant farmers convert lands from
secondary forest. In some regionsof the country, such as Cagayan,
Southern Tagalog, and Southern and Central Mindanao, population densities are low enough to allow the forest to be used while sustaining its quality,
with the prospect of eventual regeneration. However, there is no sign that
the rate of increase in uplandpopulation will significantly decline to less than
two percent per year.
Government programs must also address poverty in the uplands, the
upland dweller being one of the "poorest of the poor" in Philippine society.
The upland migrant mustbe viewed as a =victim,"ratherthan the "perpetrator," of forest destruction. Indeed their characterization as "shifting cultivators" is much less appropriate than that ot the "shifted cultivators"-- the
CRUZ, ZOSA.FERANILAND GOCE: POPULATIONAND UPLAND DEVELOPMENT
45
upland migrants are oftenpushedintomarginalenvironmentsas accessto
cultivablelandsand unemploymentworsen(Myers, 1984).
The complementation
ofinstitutional
withtechnicalchangeisprobably
nowhereas apparentas it isin thecase of ensuringsustainablecultivation
in the uplands. The case studyin MountMakiling,Laguna,indicatesthat
securetenure and appropriatetechnicalsupportare importantminimum
elementsfor any realisticprogramforthe uplands.
The more equitable incomedistributionamong lands with secure
claimsin MountMakiling,aswellasthe highlysignificanteffectof tenureon
familyincome,indicatesthatthereisa caseforlegitimizingclaimsofexisting
residents. The widespreadpracticeof multi-croppingand agroforestry
amongthe samplerespondentsalsopointto theimportantcontributionsby
the scientificcommunityand theeffectivenessof extensionactivities.
The productionstrategyin Mount Makilingencouragesdiversified,
multi-storledcropping. The resultsof the exploratoryproduction-income
regressionmodelshowthepositiveeffecton migrantincomesfor bothfood
and fuelwoodusesof treesthroughthe efficientcombinationof annualand
perennialplantsand herbaceousand woodyspecies.
In twodocumentedfarm households,a multiplelayeringof cropswas
observed. At the groundlevel,a short-stemmedcereal (uplandglutinous
rice)was plantedalongsidevegetableslikecarrots,squash,and someroot
crops. A second layerfrom2 to 5 metersin heightwere thetaller-standing
corn, cassava,and fruittrees (bananaand papaya). Then a thirdlayerof
rambutanand/coconuttrees exploitthe sun'senergyallowingthe rootsof
treesto serveto bringup nutrientsusefulto othercrops. Suchexamplesof
"forestgardens" among upland migrantsin Mount Makilingsuggestthe
viabilityof expandingappropriateextensionprograms,at thesametimethat
land securityis achievedthroughchangesin propertyrights.
REFERENCES
Bureauof ForestDevelopment.
AnnualReport.Bureauof ForestDevelopment,
Republic
of thePhilippines,
1982.
Cruz,Ma.Concepcion
J. andImeldaZosa-FeraniL
"PolicyImplications
of PopulationPressureinPhilippine
Uplands."
Paperprepared
forWorldBankSeminar
onForestry,
Fisheries,
andAgriculture
Resources
Management
Study,1988.
Cruz,Ma. Concepcion
J., ImeldaZosa-Feranil
andCristelaL. Goce."Population
PressureandMigration:
Implications
forUplandDevelopment
inthePhilippines."Philippine
Institute
forDevelopment
StudiesandCenterforPolicyand
Development
StudiesWorkingPaper86-06,1986.
Cruz,Ma.Concepcion
J. etal.*Philippine
UplandProduction
Systems:
AnIntegrativeAnalysis
ofThreeSites.Institute
ofEnvironmental
ScienceandManagement,U. P. LosBa5osand International
Development
ResearchCentre,
1987.
46
JOURNAL
OFPHILIPPINE
DEVELOPMENT
Da Vanzo,Julie. "Micro-economicApproachesto StudyingMigrationDecisions."In
GordonF. deJong and RobertW. Gardner,eds. M_grationDecision Making:
Multidisciplinary Approaches to Micro/eve/Studies in Developed and Developing Countries. New York:PergamonPress, 1981.
David, C. C. and K. Otsuka. Differential impact of Technical Change Between
Favorable and Unfavorable Areas. Laguna,Philippines:InternationalRice
Research Institute,1987.
Gonzales, Virginiaand Ernesto Pernia. "Patternsand Determinantsof inter-RegionalMigration."Inthe Spatial and UrbanDimensions of Development in the
Philippines. Makati: PhilippineInstitutefor DevelopmentStudies, 1983.
Hayami, Yujiro. Economic Consequences of New Rice Technology: A View From
the Barrio. Laguna,Philippines:InternationalRice ResearchInstitute,1979.
Lantican, D. M. "TheMakilingForest."Forestry Digest. 1974.3:46-47.
Ledesma, AntonioJ. Landless Workers and Rice Farmers: Peasant Subclasses
Under Agrarian Reform in TwoPhilippine Villages. Laguna,Philippines:InternationalRice ResearchInstitute,1982.
Myers,Norman. The Primary Source: Tropical Forests and Our Future. New York:
W.W. Nortonand Company, 1984.
Otsuka, Keijiro.Technical Change and Land Reform Implementation: A Comparative Analysis of Five Rice-Dependent Villagesin the Philippines. Laguna,Philippines:InternationalRice Research Institute,1987.
Perez, Aurora."InternationalMigration."In Population of the Philippines. Bangkok,
Thailand:CountryMonographSeries No. 5, UN-ESCAP, 1978.
Quisumbing,Ma. Agnes R. and Ma. ConcepcionJ. Cruz. "RuralPoverty and
Poverty Programsin the Philippines."Los Ba_os:Centerfor Policyand DevelopmentStudiesWorkingPaper No, 86-04, 1986.
Segura-delosAngeles,Marian."Economicand SocialImpactAnalysisof an Upland
DevelopmentProjectin NuevaEcija,Philippines.*JoumalofPhi/ippineDevelopment. PhilippineInstitutefor DevelopmentStudies,1985.22(2):324-394.
Shyrock,H. S., S.S. Siegel and Associates.The Methods and Material of Demography. Vol. 2,Washington,D.C. US Bureauof Census, 1971.
Universityof the Philippinesat Los BaSos,Collegeof Forestry."ProposedMakiling
ForestDevelopmentProgram."Laguna,Philippines,1979.
Vu, M.T. and E. Elwan."Short:termPopulationProjection1980-2000 and Long-term
Projection2000 to StationaryStage by Age and Sex for All Countriesof the
World."Washington,D.C.: The WorldBank, 1982.
Wernstedt, Frederick L. and Paul D. Simkins. "Migration and Settlement of
Mindanao."Journal of Asian Studies, (1965) 25:83-103.

© Copyright 2026