
Download (pdf, 10.67KB) - The International Council on Clean
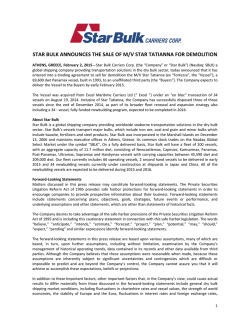
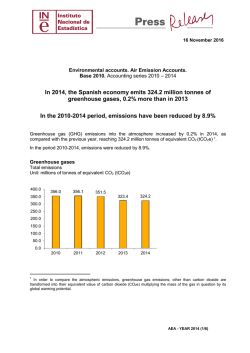
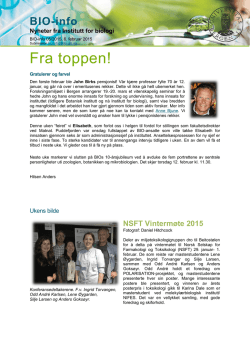
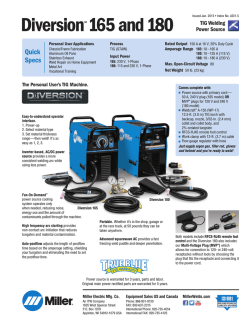
WORKING PAPER 2015-1
Air pollution from marine vessels in
the U.S. High Arctic in 2025
Authors: Alyson Azzara and Dan Rutherford
Date: 29 January 2015
Keywords: Marine emissions, marine black carbon, Arctic protection
Executive summary
Marine vessels are a large source of greenhouse gas and
air pollutant emissions, including CO 2, NO X, SO X, particulate matter and black carbon, which impact local air
quality, human health, and the global climate. Since the
record-low Arctic Sea ice extent recorded in September
of 2012, vessel activity and the associated impacts have
been the focus of a number of different strategies for
addressing operations, activities, and environmental
concerns. The 2013 release of the U.S. National Strategy
for the Arctic Region (NSAR) and its Implementation Plan
(IP) in January 2014 highlight the issues of importance,
including shipping and maritime infrastructure. A report
recently released by the U.S Committee on the Marine
Transportation System (CMTS) under the Department of
Transportation (DOT)1 presented a set of scenarios for
increased Arctic maritime activity in 2025. This study
presents an emissions inventory based on the low- and
mid-range scenarios indicating a potential 150 to 600
percent increase in emissions by 2025. Potential policies
to constrain emissions growth include a global switch
to cleaner marine fuels and the expansion of existing
emission control area for marine vessels.
Black carbon is second only to CO2 among anthropogenic emissions of climate pollutants (Bond et al, 2013)3.
Lacking additional controls, it is estimated that global BC
emissions from marine vessels may more than quintuple
from 2004 to 2050, to a total of more than 744,000 tons
BC, due to increased shipping demand. A growing share
of those emissions will occur within the Arctic, due to
vessel diversion.
International regulations on pollution from ships are
found within the IMO’s International Convention on the
Prevention of Pollution from Ships (MARPOL 73/78). 4
MARPOL contains six annexes to address various sources
of pollution from ships. Most recently MARPOL was
amended through the “1997 Protocol,” which added
Annex VI, Regulations for the Prevention of Air Pollution
from Ships. MARPOL Annex VI sets limits on NOX and SOX
emissions from ship exhaust, and prohibits deliberate
emissions of ozone-depleting substances.
Marine vessels are a large source of greenhouse gas
and air pollutant emissions, including carbon dioxide
(CO2), nitrogen and sulfur oxides (NOX and SOX), particulate matter (PM) and black carbon (BC), which impact
local air quality, human health, and the global climate.
According to the International Maritime Organization’s
(IMO) 3rd GHG study2 emissions of NOX could increase
globally by as much as 300%, and PM by 280% by 2050.
There are two sets of emission and fuel quality requirements defined by Annex VI: (1) global requirements,
and (2) more stringent requirements applicable to ships
in Emission Control Areas (ECA). Global requirements
include Tier II engine standards (NOX) and a global limit
on marine bunker fuel sulfur content, currently set at
3.5% compared to a global average of 2.7%. This limit is
scheduled to reduce to 0.5% in 2020, although members
of the shipping industry are currently calling for IMO to
delay the requirement until at least 2025. Regionally,
ECAs can be designated for SOX and PM, and/or NOX,
subject to a proposal from a Party to Annex VI. Currently,
North America and the US Caribbean have established
emission control areas for NOX requiring new-build ships
to meet progressively tougher NOX standards in addition
1
3
1. Marine emissions in perspective
2
Azzara, A. J., Wang, H., and Rutherford, D. 2015. A 10-year Projection
of Maritime Activity in the U.S. Arctic Region. A Report to the
President. U.S. Committee on the Marine Transportation System,
Integrated Action Team on the Arctic, Washington, D.C., 73 p.
MEPC 67/INF.3, Third IMO GHG Study 2014 — Final report. Marine
Environment Protection Committee, International Maritime
Organization, London.
© INTERNATIONAL COUNCIL ON CLEAN TRANSPORTATION, 2015
Bond et al. (2013). Bounding the role of black carbon in the climate
system: A scientific assessment, Journal of Geophysical Research:
Atmospheres, Vol 118, 5380-5552.
4 International Convention for the Prevention of Pollution from
Ships (MARPOL), http://www.imo.org/About/Conventions/
ListOfConventions/Pages/International-Convention-for-thePrevention-of-Pollution-from-Ships-(MARPOL).aspx
WWW.THEICCT.ORG
AIR POLLUTION FROM MARINE VESSELS IN THE U.S. HIGH ARCTIC IN 2025
to limits for SOX emissions requiring the use of either 0.1%
sulfur fuel or exhaust gas scrubbers. Neither ECA extends
west of Kodiak, Alaska, and neither includes the Aleutian
Islands or areas north into the Arctic.
International regulations do not directly restrict the
emission of black carbon from marine vessels, although
it is generally understood that improving fuel quality also
controls black carbon. This has been an ongoing topic of
discussion for several IMO environmental subcommittees,
including the Ship Design and Construction (SDC) subcommittee and the Pollution Prevention and Response (PPR)
Subcommittee. Most recently, PPR recommended the IMO
adopt the scientific consensus definition of black carbon
and identified a need for additional research to identify
the most appropriate measurement method(s) to measure
marine BC emissions consistent with this definition.5
2. The Emerging U.S. Arctic Strategy
In September of 2012, Arctic sea ice reached the lowest
extent ever recorded.6 In the years since, a number of
different strategies for addressing operations, activities,
and environmental concerns in changing Arctic conditions
have emerged. Active groups include U.S. departments
and agencies, equivalents in other Arctic nations, and
forums such as the Arctic Council and IMO. In 2013 the U.S.
released a National Strategy for the Arctic Region recognizing the efforts of over 20 Federal and state agencies
and departments and setting out priority actions reaching
to 2018. The US Arctic Strategy is especially important
because the U.S. will assume the chairmanship of the
Arctic Council in 2015.
The 2013 release of the U.S. National Strategy for the
Arctic Region (NSAR)7 and its Implementation Plan (IP)8
in January 2014 highlight issues of importance for the
Administration, including shipping and maritime infrastructure. In a recently released report compiled by the
Department of Transportation, a set of scenarios for Arctic
maritime activity in 2025 were presented. These included
estimates for Arctic shipping growth based on current
economic trends as well as additional diversion of vessels
through the Arctic from other international shipping routes
attributable to increasing access due to Arctic melting
5
Report of the Working Group on Air Pollution from Ships, PPR 2/
WP.5 (2015) Second Session of the Subcommittee on Pollution
Prevention and Response, International Maritime Organization, 22
January, London.
6 National Snow and Ice Data Center. Accessed at http://nsidc.org/
arcticseaicenews/2012/09/arctic-sea-ice-extent-settles-at-recordseasonal-minimum/
7 National Strategy for the Arctic Region, http://www.whitehouse.gov/
sites/default/files/docs/nat_arctic_strategy.pdf
8 Implementation Plan for the National Strategy for the Arctic
Region, http://www.whitehouse.gov/sites/default/files/docs/
implementation_plan_for_the_national_strategy_for_the_arctic_
region_-_fi....pdf
2 INTERNATIONAL COUNCIL ON CLEAN TRANSPORTATION (table 1). Lastly, the report incorporated estimates for
the impacts of oil and gas exploration on vessel activity.
The report did not, however, explore the environmental
impacts of increased shipping in terms of air emissions or
the potential climate impacts from increases in short-lived
climate pollutants such as black carbon.
This working paper fills this gap by providing an emissions
estimate for the projected traffic growth outlined in that
report. A summary of the methodology, which applies the
same set of assumptions for economic growth and vessel
diversion as the DOT report, is provided in the Annex to
this paper. This report focuses on the low- and mid-range
diversion scenarios. The low-diversion scenario assumes
2% diversion from the Panama and Suez canals between
July and November of 2025. This equates to approximately
1% of the total annual traffic through those canals. The
mid-range estimate assumes that approximately 2% of
annual vessel traffic through those canals is diverted
through the Bering Strait in 2025, largely through the
Northern Sea Route nearest to Russia. These diversion
scenarios were combined with regional traffic growth projections to estimate potential criteria-pollutant emissions
assuming the use of current fuels compared to the implementation of requirements for the use of low-sulfur fuel of
either 0.5% or 0.1%.
This paper does not address the potential increases from
oil and gas exploration because of the complexity involved
in estimating the vessel activity from an exploratory
drilling program consisting of many types of vessels. The
potential increases in vessel activity associated with oil
and gas exploration as outlined in the DOT report would
increase emissions from vessels beyond those estimated
in this paper.
Table 1. 2025 vessel diversion traffic in the U.S. Arctic with and
without container vessels
Annual Diversions
w/o Containers
by Rate
Vessel type
5%
2%1
8%
Annual Diversion
with Containers
2%
5%
8%
Tankers
57
141
226
57
141
226
Bulk Carriers
53
134
214
53
134
214
7
18
29
7
18
29
103
258
413
220
551
882
General Cargo
Container
Totals
117
293
469
Source: Azzara, A. J., Wang, H., and Rutherford, D. 2015. A 10-year
Projection of Maritime Activity in the U.S. Arctic Region. A Report to
the President. U.S. Committee on the Marine Transportation System,
Integrated Action Team on the Arctic, Washington, D.C., 73 p.
[1] Percent diversions are based on a July through November diversion
from the Panama and Suez canals. These percent diversions equate to
1%, 2%, and 3%, respectively, of total annual volume through the canals.
WORKING PAPER 2015-1
AIR POLLUTION FROM MARINE VESSELS IN THE U.S. HIGH ARCTIC IN 2025
3. Findings
Based on emissions calculations for the low-growth vessel
diversion, not including container ships, this increase
in activity would cause at least a 150 to 230 percent
increase above 2011 levels if the current fuel regulations
continue in force through 2025. Assuming container
vessel diversion, low-growth scenario emissions (table 2)
would increase by 200 to 300 percent above 2011 levels,
assuming continued use of heavy fuel oil (HFO) and
marine diesel oil (MDO).
Table 3. Emissions for mid-range growth scenario by fuel
type, tonnes
Pollutant
2011
Emissions
2025
emissions,
Emissions
baseline Percent with 0.5%
fuel
change sulfur fuel
Percent
change
CO2
11,000
54,000
+390%
54,000
+390%
NOX
253
1,470
+480%
1,400
+450%
PM
17
120
+580%
32
+90%
SOX
130
830
+520%
170
+30%
BC
1.3
6.9
+435%
2.5
+90%
Table 2. 2011 and 2025 low growth scenario emissions from Arctic Shipping for current fuels, 0.5%, and 0.1% sulfur fuel
2025 emissions (tonnes)
Base fuel
0.1% sulfur
Pollutant
2011 emissions
(tonnes)
Container diversion
No container
diversion
No container
diversion
No container
diversion
CO2
11,000
34,000
28,000
28,000
28,000
NOX
250
910
740
700
700
PM
17
71
56
17
11
SOX
130
510
410
88
18
BC
1.3
4.9
3.5
1.2
1.2
In contrast to the continued use of HFO and MDO,
the use of 0.5% sulfur fuel in 2025 for the low-growth
scenario would reduce SOX emissions by 35% and BC by
5% relative to 2011, while keeping PM roughly constant.
Additional reductions are seen for 0.1% fuel in 2025, the
sulfur content currently required in ECAs, which decrease
SOX, PM, and BC emissions by 87%, 35%, and at least
5%, respectively (figure 1). These decreases would occur
despite an additional 120 ocean going vessels traveling
through the U.S. Arctic compared with the 2011 baseline.
600
U.S. Emissions of PM10, SOX and BC from Shipping
PM
500
SOX
BC
6000
5000
400
4000
300
3000
200
2000
100
1000
0
0
current
2025 w/
containers
2025 w/o
2025
2025
containers 0.5% sulfer 0.1% sulfer
Figure 1. Comparison of the potential reduction in emissions
with the application of 0.5% and 0.1% fuel for Arctic vessels
assuming the low growth scenario.
WORKING PAPER 2015-1
Emissions of BC (kg)
Emissions of PM and SOX (tons)
0.5% sulfur
The low-growth scenarios are conservative estimates
of vessel traffic growth in 2025. Additional growth is
possible depending on a number of variables discussed
in the DOT report, including infrastructure, insurance
costs, and access due to the receding summer ice cover.
Even without the inclusion of container vessels, emissions
for the mid-range growth scenario (table 3) increase on
the order of four to six times, with the largest increase
in PM assuming the current fuel mix. Following the trend
in the low-growth example, the use of 0.5% fuel reduces
the potential 2025 emissions by a factor of five for SOX,
PM, and black carbon over what would be emitted if no
change in fuel sulfur content occurred.
4. Conclusions and Recommendations
Combined with these potential increases in marine
emissions, the current lack of regional environmental
requirements for vessels transiting and operating in the
U.S. Arctic may lead to an increasing impact on human
health for Arctic communities and for the global climate.
U.S. Departments as well as the Arctic Council and other
Arctic governments have stressed the need for governments to consider the issues of community health
and resilience. Additional emissions of climate-forcing
pollutants such as black carbon and carbon dioxide
combined with emissions of PM and NOX, which can be
linked with respiratory health issues, may place additional
stress on the Arctic environment and Arctic communities.
INTERNATIONAL COUNCIL ON CLEAN TRANSPORTATION 3
AIR POLLUTION FROM MARINE VESSELS IN THE U.S. HIGH ARCTIC IN 2025
If diversion of vessels from other international routes
increases, a growing share of pollution will come from
larger vessels that are regulated internationally, and
emissions from larger oceangoing vessels such as
tankers and bulk carriers (2-stroke engines) will begin to
outnumber smaller domestic vessels (figure 2). While the
U.S. has adopted relatively strict NOX and PM domestic
emission standards for smaller (C1 and C2) engines,
there are currently no PM standards for engines on
oceangoing vessels; furthermore, as noted above, there
are widespread calls to delay the global 0.5% fuel sulfur
limit to 2025 or beyond. The lack of regional restrictions
in the Arctic leaves the area vulnerable to increasing
emissions from international traffic that is less tightly
regulated than under U.S. law.
2011 Fuel Use by Engine Type
4-stroke
2-stroke
31%
69%
A number of policies can mitigate shipping emissions
growth in the U.S. Arctic between now and 2025.
Upholding the implementation date of 0.5% fuel sulfur,
rather than delaying to 2025 or later, would provide
benefits beginning in 2020 extending through the period
of time when increases in vessel traffic are actively
occurring. Extending the North American ECAs into
Arctic waters would provide additional air-quality and
human health benefits associated with 0.1% sulfur fuel
and the use of Tier III engines for reduced NOX. Regional
benefits would be increased by cooperative bilateral
action with Canada, or additionally multilateral action
with other Arctic nations to extend the Arctic ECA to
larger areas of the Arctic.
Other potential avenues for reducing Arctic emissions
from vessels include designations of Marine Protected
Areas (MPA) under domestic conservation frameworks,
or possibly the designation of particularly sensitive sea
areas (PSSA) under the IMO. Both options would provide
guidelines for limiting vessel operations within the areas
and specifying either speed limits or fuel requirements
for operation, both of which could reduce emissions.
As interest in the Arctic as an international shipping route
increases and ice extent diminishes, growth in maritime
activity becomes more likely. Initial steps to address the
need for enhanced infrastructure, emergency response,
and communication are under discussion; environmental
policies to protect human health and the global climate
should be considered in parallel.
2025 Fuel Use by Engine Type
4-stroke
2-stroke
31%
69%
Figure 2. Share of 2011 and 2025 pollution as indicated
by fuel use by engine type, low growth scenario without
container vessel diversion.
4 INTERNATIONAL COUNCIL ON CLEAN TRANSPORTATION WORKING PAPER 2015-1
AIR POLLUTION FROM MARINE VESSELS IN THE U.S. HIGH ARCTIC IN 2025
Annex: Methodology
This study closely follows the methodology adopted
in the DOT report. To establish baseline emissions, this
study used 2011 satellite Automatic Information System
(AIS) data from July to November for vessel activity
from just south of the Bering Strait. 148 vessels from 12
categories were used to estimate emissions from this
area and timeframe. Using the unique MMSI number
assigned to each vessel, vessel speed over ground information was extracted. The speed data were used to
estimate engine load based on the design speed of each
individual vessel assessed. Vessel engine and fuel characteristic were accessed from Clarkson’s World Fleet
Register and used to calculate main engine power and
fuel use based on average load using a cubic function.9
Where possible, multiple vessels for each vessel class
were used to create average representative engine
power and fuel use, otherwise, representative vessels
were selected to characterize the general specifications for the vessel class. Due to a lack of data, average
auxiliary engines loads were assumed to be the same as
for main engines.
For each vessel category, total work in kWh and total fuel
use were calculated based on the average engine load
and associated fuel use. Emission factors for CO2, NOX,
SOX, PM10 and BC (table 4) were used to calculate total
emissions from the 2011 activity used as the baseline
for this analysis. Emission factors from the Port of Long
Beach emission inventory10 were used for all emissions
except black carbon. BC emission factors from Wang
and Minjares11 were used for HFO and MDO fuel types,
while a BC emission factor from a DNV report 12 on
emissions in the Arctic was used to represent BC for
0.5% and 0.1% sulfur fuel. The analysis was broken up into
6 portions representing 3 fuel types and vessel growth
and diversion including and not including container
vessels. Three possible future regulatory environments
were developed in 2025 based 2011 fuel (HFO and MDO),
0.5% sulfur fuel, and 0.1% sulfur fuel.
9 Port of Long Beach 2011 Emission Inventory, Equation 2.3
Accessed at: http://www.polb.com/civica/filebank/blobdload.
asp?BlobID=10194
10 Port of Long Beach 2011 Emission Inventory.
11 Wang, H. and Minjares, R. (2012). Global emissions of marine black
carbon: Critical review and revised assessment. TRB 2013 Annual
meeting. Accessed at http://docs.trb.org/prp/13-1503.pdf
12 DNV HFO in the Arctic-Phase 2 2013-1542-16G8ZQC-5/1. Accessed
at http://www.pame.is/images/03_Projects/AMSA/Heavy_Fuel_
in_the_Arctic/HFO%20in%20the%20Arctic%20Phase%20II%20
final%20report%20by%20DNV_signed.pdf
WORKING PAPER 2015-1
Table 4. Emission factors by vessel category
Emission factors by engine type and fuel sulfur
(g/kWh unless noted)
Pollutant
4-stroke
MDO
CO2
4-stroke
HFO
683
2-stroke
HFO
683
620
NOX
13.2
14
18.1
PM10
0.705
1.5
1.5
SOX
6.38
11.5
10.5
0.593
0.593
0.49
BC
(kg/ton fuel)
Emission factors for engine and fuel sulfur level
(g/kWh unless noted)
Pollutant
CO2
4-stroke
0.5%
683
4-stroke
0.1%
683
2-stroke
0.5%
620
2-stroke
0.1%
620
NOX
13.2
13.16
17.0
17.0
PM10
0.375
0.255
0.375
0.255
SOX
2.13
0.426
1.95
0.389
BC
(kg/ton fuel)
0.18
0.18
0.18
0.18
Future vessel activity was projected as per the DOT
report, which assumed global traffic growth rates of
1.3%, 3%, and 3.3% growth for the low-, mid-, and highgrowth cases. Estimated vessel diversions were based
on current vessel traffic through the Suez and Panama
canals for the months of July–November, reflecting the
seasonality of access for vessels in the Arctic. Only four
vessel classes were considered: container, bulk carriers,
general cargo, and container ships. Diversion scenarios
were categorized as low (2%), medium (5%) and high
(8%), corresponding to approximately 1%, 2%, and 3%, of
total annual traffic in the Panama and Suez canals.
To account for the varying views on the Arctic as a
container vessel route, estimates for diversion including
and not including container vessels were done. To
calculate the diversion distances, distances within the
U.S. High Arctic along the Northern Sea Route (NSR) of
575 km and Northwest Passage (NWP) of 1980 km as
outlined in the DOT report were used. Those distances
were applied to the respective vessel diversions for
each route and vessel class assuming that 90% of
vessels were diverted to the NSR and only 10% to
the NWP. In addition, no container ship diversion was
assumed through the NWP. Future scenarios for oil
and gas exploration were also investigated as part of
the DOT scenarios for vessel growth. Due to the high
level of variability in activity for vessels supporting oil
and gas exploration, emissions associated with those
scenarios were not estimated.
INTERNATIONAL COUNCIL ON CLEAN TRANSPORTATION 5

© Copyright 2026