
Dunedin Income Growth Investment Trust DIG
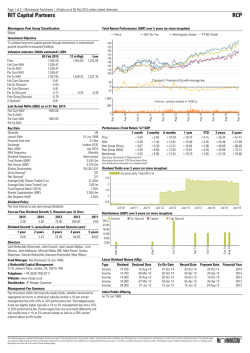
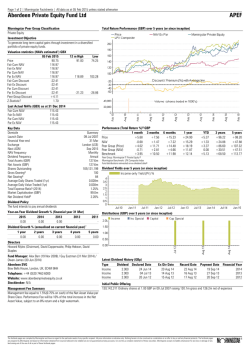
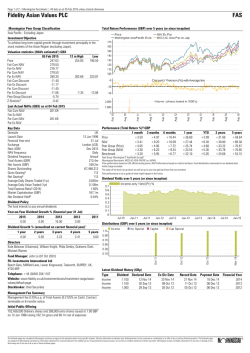
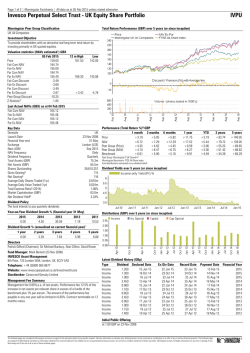
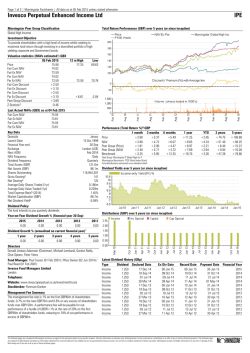
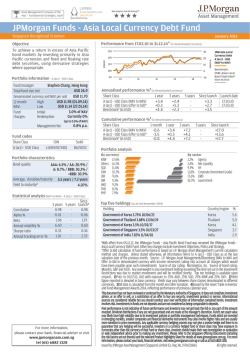
Page 1 of 2 | Morningstar Factsheets | All data as at 05 Feb 2015 unless stated otherwise
Dunedin Income Growth Investment Trust
Morningstar Peer Group Classification
UK Equity Income
DIG
Total Return Performance (GBP) over 5 years (or since inception)
Investment Objective
To achieve growth of income and capital from a portfolio invested mainly in
companies listed or quoted in the UK.
Valuation statistics (NAVs estimated1) GBX
05 Feb 2015
Price
266.25
Fair Cum NAV
280.64
Fair Ex NAV
276.48
Par Cum NAV
284.76
Par Ex NAV
280.61
Fair Cum Discount
-5.13
Fair Ex Discount
-3.70
Par Cum Discount
-6.50
Par Ex Discount
-5.12
Peer Group Discount
-3.27
-3.27
Z-Statistic2
12 m High
285.00
Low
244.50
284.43
247.65
+1.20
-5.12
Last Actual NAVs (GBX) as at 04 Feb 2015
Fair Cum NAV
284.10
Fair Ex NAV
277.36
Par Cum NAV
288.23
Par Ex NAV
281.49
Key Data
Domicile
Launch Date
Financial Year-end
Exchange
Next AGM
NAV Frequency
Dividend Frequency
Total Assets (GBP)
Net Assets (GBP)
Shares Outstanding
Gross Gearing3
Net Gearing4
Average Daily Shares Traded (1yr)
Average Daily Value Traded (1yr)
Total Expense Ratio5 (2014)
Market Capitalisation (GBP)
Net Dividend Yield6
UK
01 Feb 1873
31 Jan
London (LSE)
May 2015
Daily
Quarterly
462.9m
423.7m
151,006,187
109
106
0.070m
0.308m
0.60%
402.1m
4.17%
Performance (Total Return %)8 GBP
1 month 3 months
Price
+4.81
+3.68
NAV
+9.10
+8.98
Peer Group (Price)
+3.31
+3.82
Peer Group (NAV)
+7.19
+7.99
Benchmark
+6.61
+5.90
6 months
+3.47
+7.44
+5.83
+9.81
+5.16
1 year
+9.49
+12.95
+9.01
+13.32
+9.91
YTD
+1.64
+6.79
+1.94
+5.58
+4.49
3 years
+40.62
+43.25
+52.70
+56.51
+34.39
5 years
+96.37
+84.56
+111.96
+105.03
+68.29
Peer Group: Morningstar IT UK Growth & Inc P
Morningstar Benchmark: FTSE All-Share Index
Fund distributions reinvested on ex-dividend date8
Dividend Yields over 5 years (or since inception)
Dividend Policy
The fund intends to pay quarterly dividends
Year-on-Year Dividend Growth % (financial year 31 Jan)
2016
0.00
2015
0.00
2014
3.26
2013
0.94
2012
3.90
Distributions (GBP) over 5 years (or since inception)
Dividend Growth % (annualised on current financial year)7
1 year
43.69
2 years
0.00
3 years
1.07
4 years
1.04
5 years
1.61
Directors
Rory Macnamara (Chairman), John Carson, Catherine Claydon, Elisabeth
Scott, P H Wolton
Fund Manager: Ben Ritchie (31 Mar 2013) / Jeremy Whitley (19 Nov
2009)
Aberdeen Asset Management
40 Princes Street, Edinburgh, UK, EH2 2BY
Telephone: +44 (0)131 528 4000
Website: www.dunedinincomegrowth.co.uk
Stockbroker: JP Morgan Cazenove
Management Fee Summary
Management fee 0.45% on the first GBP225m, 0.35% on the next
GBP200m, and 0.25% on amounts over GBP425m p.a. of Net Assets.
Contract terminable on six months notice.
Latest Dividend History (GBp)
Type
Income
Income
Income
Income
Income
Income
Income
Income
Income
Income
Income
Income
Dividend Declared Date
2.575
14 Jan 15
2.575
08 Oct 14
2.575
04 Jul 14
3.375
24 Mar 14
14 Jan 14
2.575
08 Oct 13
2.575
05 Jul 13
2.575
25 Mar 13
3.250
15 Jan 13
2.500
09 Oct 12
2.500
25 Jul 12
2.500
26 Mar 12
6.900
Ex Div Date
05 Feb 15
06 Nov 14
06 Aug 14
07 May 14
05 Feb 14
06 Nov 13
07 Aug 13
01 May 13
06 Feb 13
07 Nov 12
08 Aug 12
18 Apr 12
Record Date
06 Feb 15
07 Nov 14
08 Aug 14
09 May 14
07 Feb 14
08 Nov 13
09 Aug 13
03 May 13
08 Feb 13
09 Nov 12
10 Aug 12
20 Apr 12
Payment Date
27 Feb 15
28 Nov 14
29 Aug 14
30 May 14
28 Feb 14
29 Nov 13
30 Aug 13
31 May 13
28 Feb 13
30 Nov 12
31 Aug 12
25 May 12
Initial Public Offering
on 21 Nov 1949
The factbook pages are compiled by Morningstar and have no regard to the particular needs of any specific recipient. All price information is indicative only. Nothing herein is to be construed as a solicitation or an offer to buy or sell any financial products. The factbook pages
are prepared by Morningstar and based on information obtained from sources believed to be reliable but are not guaranteed as being accurate, nor are they a complete statement of these securities. Morningstar accepts no liability whatsoever for any loss or damage of any
kind arising out of the use of all or part of these factbook pages.
Financial Year
2015
2015
2015
2014
2014
2014
2014
2013
2013
2013
2013
2012
Page 2 of 2 | Morningstar Factsheets | All data as at 05 Feb 2015 unless stated otherwise
Dunedin Income Growth Investment Trust
DIG
Risk & Return9
Discrete Monthly Price & NAV Total Return % (GBP)
Sector Breakdown (%)
Discrete Yearly Price & NAV Total Return % (GBP)
Geographic Breakdown (%)
Risk & Correlation
Alpha (NAV) 11
Beta (NAV)12
R-squared (NAV)13
Sharpe (NAV)14
Price Volatility15
NAV Volatility15
Benchmark Volatility15
Peer Group Price Volatility15
Peer Group NAV Volatility15
3 months
0.04
1.10
0.95
2.07
19
16
15
12
14
6 months
0.01
1.09
0.95
0.96
19
15
13
12
13
1 year
0.16
1.08
0.88
0.91
16
13
11
11
11
3 years
0.07
1.11
0.89
1.02
17
13
12
11
11
5 years
0.15
1.02
0.89
0.88
20
15
15
14
14
Additional Performance (Total Return%8) GBX
Largest Holdings (% Portfolio10) as at 31 Dec 2014
Royal Dutch Shell Plc B
HSBC Holdings Plc
GlaxoSmithKline Plc
British American Tobacco
Prudential Plc
Unilever Plc
AstraZeneca
Centrica Plc
Pearson
Cobham Plc
Total
Capital Structure
Number of Shares
151,006,187
2,671,748
Loan CCY
GBP
GBP
EUR
4.8%
4.5%
4.4%
4.4%
4.2%
4.1%
4.1%
3.9%
3.6%
3.5%
41.5%
Share Type
Ord 25p
Treasury Shares
£m
28.6
6.0
4.6
Redemption
30 Apr 2019
Period
2015
2014
2013
2012
2011
2010
Since FTSE 2009 Low (13 Mar 09)
Since Sub-Prime (20 Nov 07)
Since FTSE 2007 Peak (13 Oct 07)
Price
+1.64
+0.68
+21.42
+18.66
-0.48
+27.22
+191.26
+59.31
+42.34
NAV Peer Price
+6.79
+1.94
+1.14
+4.01
+21.89
+28.29
+12.82
+17.43
+1.42
+2.08
+16.07
+25.29
+197.13
+201.46
+48.11
+89.63
+34.56
+71.56
Peer NAV Benchmark
+5.58
+4.49
+4.22
+1.18
+29.60
+20.81
+14.50
+12.30
+3.31
-3.46
+16.76
+14.51
+210.71
+153.86
+76.23
+49.61
+62.63
+38.25
Wind-up Provisions/Buy Back Policy
The Fund has an unlimited life. The Board is authorised to make market purchases of up to 14.99% of the Funds
issued shares which will be held in treasury with an option of re-issuing at a later date but no option of re-issuing at
a discount to NAV. Resolution last renewed at the AGM held on 23-May-13. Directors can allot securities without
considering current pre-emption provisions.
Coupon
7.875%
1.454%
0.954%
Net Dividend Yield – This is calculated by dividing the current financial years dividends (this will include prospective dividends) by the current price.
Dividend Growth – The annualised percentage growth in dividends. Based upon the current financial year, including any future estimates or forecasts.
Performance – Calculated using start and end period Share Prices or NAV Dividends are reinvested on the ex-dividend date at the prevailing Share Price or NAV.
Risk & Return – 1 Year ex income par NAV total return performance against 1 Year NAV volatility. Please see notes 8 and 15 for performance and volatility definitions
respectively.
2
10 Portfolio – In order to calculate the portfolio value we deduct any holdings in cash only (Note that Fixed Interest is not included).
11 Alpha – The difference between the fund’s average excess total return and the benchmark’s average excess total return.
3
12 Beta – The sensitivity of the fund to broad market movements. A Beta of 0.5 would imply the fund will move by half as much as the index.
4
13 R-squared – A measure of correlation between the fund and index. A value of 0.8 means that 80% of the fund’s NAV changes can be explained by changes in the index.
14 Sharpe – A risk-adjusted return measure, calculated by dividing the fund’s average monthly excess total return over the risk-free rate by the standard deviation of those returns.
5
The figure shown is the annualized Sharpe Ratio.
15 Volatility – The annualized standard deviation of the logged daily returns, adjusting for distributions from capital.
The factbook pages are compiled by Morningstar and have no regard to the particular needs of any specific recipient. All price information is indicative only. Nothing herein is to be construed as a solicitation or an offer to buy or sell any financial products. The factbook pages
are prepared by Morningstar and based on information obtained from sources believed to be reliable but are not guaranteed as being accurate, nor are they a complete statement of these securities. Morningstar accepts no liability whatsoever for any loss or damage of any
kind arising out of the use of all or part of these factbook pages.
1
NAV Estimation - Fair value of debt refers to the market price of the debt if it is traded or, if it is not traded, an
estimation of its value calculated using points over gilt methodology.
Cum Income NAVs include net revenue in the financial year to date. All estimates are fully diluted for the effects of
warrants, convertibles or treasury shares. NAV estimations are created and maintained by Morningstar. For more
detailed methodology document please contact [email protected]
Z-Statistic 1y – Shows whether the fund’s current discount is significantly higher or lower than the average over the
past year, calculated as (Current Discount – Mean) / Std Dev
Gross Gearing – The ratio of estimated gross Assets to the Net Assets, expressed as a percentage
Net Gearing – The ratio of estimated Gross Assets minus cash and fixed interest to the Net Assets, expressed as a
percentage. Cash and fixed interest represents not-equity exposure.
Total Expense Ratio – (Total Expenses – Performance Fees – Cost of Leverage – Tax – Restructuring Costs) /
Average Net Assets
6
7
8
9

© Copyright 2026