
Draft 2014-2015 Transmission Plan
Forward to DRAFT 2014-2015 Transmission Plan Thank you for your participation in the ISO transmission planning process, and your review of this draft transmission plan. The objective of the draft transmission plan is to represent the current thinking of the ISO in moving towards final recommendations in each year’s transmission planning process. In reviewing the draft transmission plan, it is important to remember that the draft transmission plan is structured and written as a draft and not as a discussion document. Consequently, it is written in the same format and tone as the final transmission plan though it is open to change based on stakeholder input and new information as we move to finalizing the plan in March. The ISO’s objective each year is to provide a comprehensive overview with the goal of providing draft recommendations on all decisions we expect to see made in the course of the planning cycle. 2014-2015 ISO Transmission Plan February 2, 2015 Table of Contents Executive Summary ..................................................................................................... 1 Introduction ...................................................................................................... 1 The Transmission Planning Process ................................................................ 3 Collaborative Planning Efforts .......................................................................... 4 Advancing Preferred Resources ....................................................................... 6 Reliability Assessment...................................................................................... 7 33 Percent RPS Generation Portfolios and Transmission Assessment............. 8 Economic Studies ........................................................................................... 12 Conclusions and Recommendations .............................................................. 12 Chapter 1 ................................................................................................................... 14 1 Overview of the Transmission Planning Process ............................................ 15 1.1 Purpose ........................................................................................ 15 1.2 1.2.1 1.2.2 1.2.3 Structure of the Transmission Planning Process ........................... 18 Phase 1 ................................................................................... 18 Phase 2 ................................................................................... 21 Phase 3 ................................................................................... 23 1.3 Interrelated Processes and initiatives ............................................ 25 Chapter 2 ................................................................................................................... 32 2 Reliability Assessment – Study Assumptions, Methodology and Results ........ 33 2.1 2.1.1 2.1.2 2.2 2.2.1 2.2.1.1 2.2.2 2.2.3 Overview of the ISO Reliability Assessment .................................. 33 Backbone (500 kV and selected 230 kV) System Assessment............................................................................. 33 Regional Area Assessments.................................................... 33 Reliability Standards Compliance Criteria...................................... 35 NERC Reliability Standards ..................................................... 35 System Performance Reliability Standards (TPL-001 to TPL-004) .. 35 WECC Regional Criteria .......................................................... 35 California ISO Planning Standards .......................................... 35 2.3 2.3.1 2.3.1.1 Study Methodology and Assumptions ........................................... 36 Study Methodology .................................................................. 36 Generation Dispatch ....................................................................... 36 2.3.1.2 Power Flow Contingency Analysis .................................................. 36 2.3.1.3 Transient Stability Analyses ............................................................ 36 2.3.2 2.3.3 2.3.3.1 Preferred Resources Methodology .......................................... 37 Study Assumptions.................................................................. 38 Study Horizon and Study Years ...................................................... 38 2.3.3.2 Peak Demand ................................................................................. 38 California ISO/MID i 2014-2015 ISO Transmission Plan February 2, 2015 2.3.3.3 Stressed Import Path Flows ............................................................ 41 2.3.3.4 Contingencies ................................................................................. 41 2.3.3.5 Generation Projects ........................................................................ 42 2.3.3.6 Transmission Projects .................................................................... 43 2.3.3.7 Load Forecast ................................................................................ 43 2.3.3.8 Reactive Power Resources ............................................................ 43 2.3.3.9 Operating Procedures..................................................................... 44 2.3.3.10 Firm Transfers ................................................................................ 44 2.3.3.11 Protection Systems......................................................................... 46 2.3.3.12 Control Devices .............................................................................. 46 2.4 2.4.1 2.4.2 2.4.3 Northern California Bulk Transmission System Assessment ......... 47 Northern California Bulk Transmission System Description ..... 47 Study Assumptions and System Conditions ............................ 48 Assessment and Recommendations ....................................... 51 2.5 2.5.1 2.5.1.1 PG&E Local Areas Assessment .................................................... 54 Humboldt Area ........................................................................ 54 Area Description ............................................................................. 54 2.5.1.2 Area Specific Assumptions and System Conditions ........................ 54 2.5.1.3 Assessment and Recommendations............................................... 56 2.5.2 2.5.2.1 North Coast and North Bay Areas ........................................... 58 Area Description ............................................................................. 58 2.5.2.2 Area-Specific Assumptions and System Conditions ........................ 58 2.5.2.3 Assessment and Recommendations............................................... 60 2.5.3 2.5.3.1 North Valley Area .................................................................... 62 Area Description ............................................................................. 62 2.5.3.2 Area-Specific Assumptions and System Conditions ........................ 62 2.5.3.3 Assessment and Recommendations............................................... 63 2.5.4 2.5.4.1 Central Valley Area ................................................................. 65 Area Description ............................................................................. 65 2.5.4.2 Area-Specific Assumptions and System Conditions ........................ 66 2.5.4.3 Assessment and Recommendations............................................... 67 2.5.5 2.5.5.1 Greater Bay Area .................................................................... 68 Area Description ............................................................................. 68 2.5.5.2 Area-Specific Assumptions and System Conditions ........................ 69 2.5.5.3 Assessment and Recommendations............................................... 70 2.5.6 2.5.6.1 Greater Fresno Area ............................................................... 73 Area Description ............................................................................. 73 2.5.6.2 Area-Specific Assumptions and System Conditions ........................ 73 2.5.6.3 Assessment and Recommendations............................................... 75 California ISO/MID ii 2014-2015 ISO Transmission Plan February 2, 2015 2.5.7 2.5.7.1 Kern Area ................................................................................ 76 Area Description ............................................................................. 76 2.5.7.2 Area-Specific Assumptions and System Conditions ........................ 76 2.5.7.3 Assessment and Recommendations............................................... 77 2.5.8 2.5.8.1 Central Coast and Los Padres Areas ...................................... 80 Area Description ............................................................................. 80 2.5.8.2 Area-Specific Assumptions and System Conditions ........................ 81 2.5.8.3 Assessment and Recommendations............................................... 82 2.6 2.6.1 2.6.2 2.6.3 2.6.3.1 Southern California Bulk Transmission System Assessment ......... 84 Area Description ...................................................................... 84 Area-Specific Assumptions and System Conditions ................ 86 Assessment and Recommendations ....................................... 92 Conclusions and Assessments ....................................................... 92 2.6.3.2 Preferred Resources Assessment (Non-Conventional Transmission Alternative Assessment) .......................................................... 97 2.6.3.3 Summary of Recommendations ...................................................... 97 2.6.4 2.6.4.1 Consideration of alternatives for future additional needs for LA Basin / San Diego and Imperial Area ................................. 99 Interaction between LA Basin / San Diego Area Local Reliability Needs and Imperial Valley Area Deliverability ......... 99 2.6.4.2 Preliminary Evaluation of Potential Back-up Transmission Solutions that Provide Both Reliability Benefits for the LA Basin / San Diego Area and Generation Deliverability Benefits for the Imperial County Area .................................... 100 2.6.4.3 Findings ........................................................................................ 108 2.7 2.7.1 2.7.1.1 SCE Local Areas Assessment..................................................... 109 Tehachapi and Big Creek Corridor ........................................ 109 Area Description ........................................................................... 109 2.7.1.2 Area-Specific Assumptions and System Conditions ...................... 109 2.7.1.3 Assessment and Recommendations............................................. 110 2.7.2 2.7.2.1 North of Lugo Area ................................................................ 111 Area Description ........................................................................... 111 2.7.2.2 Area-Specific Assumptions and System Conditions ...................... 111 2.7.2.3 Assessment and Recommendations............................................. 112 2.7.3 2.7.3.1 East of Lugo .......................................................................... 113 Area Description ........................................................................... 113 2.7.3.2 Study Assumptions and System Conditions.................................. 113 2.7.3.3 Assessment and Recommendations............................................. 114 2.7.4 2.7.4.1 Eastern Area ......................................................................... 115 Area Description ........................................................................... 115 2.7.4.2 Area-Specific Assumptions and System Conditions ...................... 115 California ISO/MID iii 2014-2015 ISO Transmission Plan February 2, 2015 2.7.4.3 Assessment and Recommendations............................................. 117 2.7.4.4 Recommendations........................................................................ 117 2.7.5 2.7.5.1 Los Angeles Metro Area ........................................................ 118 Area Description ........................................................................... 118 2.7.5.2 Area-Specific Assumptions and System Conditions ...................... 118 2.7.5.3 Assessment and Recommendations............................................. 122 2.8 2.8.1 2.8.2 2.8.3 Valley Electric Association Local Area Assessment .................... 126 Area Description .................................................................... 126 Area-Specific Assumptions and System Conditions .............. 126 Assessment and Recommendations ..................................... 127 2.9 2.9.1 2.9.2 2.9.3 San Diego Gas & Electric Local Area Assessment ...................... 128 Area Description .................................................................... 128 Area-Specific Assumptions and System Conditions .............. 128 Assessments and Recommendations.................................... 132 Chapter 3 ................................................................................................................. 136 3 Special Reliability Studies and Results ......................................................... 137 3.1 Overview ..................................................................................... 137 3.2 3.2.1 3.2.2 3.2.3 Reliability Requirement for Resource Adequacy ......................... 137 Local Capacity Requirements ................................................ 137 Summary of Study Results for the 2024 Long-term LCR Assessment of the combined LA Basin / San Diego LCR areas ............................................................................. 141 Resource adequacy import capability .................................... 148 3.3 Locational Effectiveness Factors ................................................. 150 3.4 Over Generation Assessment ..................................................... 160 Chapter 4 ................................................................................................................. 175 4 Policy-Driven Need Assessment................................................................... 175 4.1 4.1.1 4.1.2 4.1.2.1 Study Assumptions and Methodology ......................................... 175 33% RPS Portfolios ............................................................... 175 Assessment Methods for Policy-Driven Transmission Planning ................................................................................ 178 Production Cost Simulation .......................................................... 179 4.1.3 4.1.3.1 Base Case Assumptions ....................................................... 179 Starting Base Cases Comparison of All Portfolios ........................ 179 4.1.3.2 Load Assumptions ........................................................................ 179 4.1.3.3 Conventional Resource Assumptions ........................................... 180 4.1.3.4 Transmission Assumptions ........................................................... 180 4.1.4 4.1.4.1 Power Flow and Stability Base Case Development ............... 180 Modeling Renewable Portfolio ...................................................... 180 4.1.4.2 Generation Dispatch and Path Flow in Base Cases ...................... 182 4.1.5 California ISO/MID Testing Deliverability for RPS ................................................ 183 iv 2014-2015 ISO Transmission Plan February 2, 2015 4.1.5.1 Deliverability Assessment Methodology ........................................ 183 4.1.5.2 Deliverability Assessment Assumptions and Base Case............... 183 4.1.5.3 Screening for Potential Deliverability Problems Using DC Power Flow Tool ............................................................. 186 4.1.5.4 Verifying and refining the analysis using AC power flow tool......... 186 4.2 4.2.1 4.2.1.1 Policy-Driven Assessment in Northern CA (PG&E Area) ............. 187 PG&E Policy-Driven Powerflow and Stability Assessment Results and Mitigations ........................................................ 188 PG&E Bulk System....................................................................... 189 4.2.1.2 Humboldt Area.............................................................................. 192 4.2.1.3 North Coast and North Bay Area .................................................. 194 4.2.1.4 North Valley Area ......................................................................... 195 4.2.1.5 Central Valley Area ....................................................................... 195 4.2.1.6 Greater Bay Area.......................................................................... 195 4.2.1.7 Fresno .......................................................................................... 196 4.2.1.8 Kern Area ..................................................................................... 196 4.2.1.9 Central Coast and Los Padres Areas............................................ 197 4.2.2 4.2.3 4.2.4 4.3 4.3.1 4.3.2 4.3.3 4.3.4 Northern PG&E System Policy-Driven Deliverability Assessment Results and Mitigations ..................................... 198 Southern PG&E System Policy-Driven Deliverability Assessment Results and Mitigations ..................................... 200 PG&E Area Policy-Driven Conclusions .................................. 201 Policy-Driven Assessment in Southern California ........................ 202 Southern California Policy-Driven Powerflow and Stability Assessment Results and Mitigations ..................................... 206 SCE and VEA Area Policy-Driven Deliverability Assessment Results and Mitigations ......................................................... 212 SDG&E Area Policy-Driven Deliverability Assessment Results and Mitigations ......................................................... 216 Southern California Policy-Driven Conclusions ...................... 220 Chapter 5 ................................................................................................................. 221 5 Economic Planning Study ............................................................................. 221 5.1 Introduction ................................................................................. 221 5.2 Study Steps................................................................................. 222 5.3 Technical Approach .................................................................... 223 5.4 Tools and Database .................................................................... 225 5.5 5.5.1 5.5.2 5.5.3 5.5.4 5.5.5 Study Assumptions ..................................................................... 227 System modeling ................................................................... 227 Load demand ........................................................................ 227 Generation resources ............................................................ 229 Transmission assumptions and modeling .............................. 229 Financial Parameters Used in Cost-Benefit Analysis ............. 234 California ISO/MID v 2014-2015 ISO Transmission Plan February 2, 2015 5.5.5.1 Cost analysis ................................................................................ 234 5.5.5.2 Benefit analysis ............................................................................ 234 5.5.5.3 Cost-benefit analysis .................................................................... 235 5.6 5.6.1 5.6.2 Congestion Identification and Scope of High Priority Studies ...... 236 Congestion identification ....................................................... 236 Scope of high-priority studies ................................................ 238 5.7 5.7.1 5.7.2 5.7.2.1 Congestion Mitigation and Economic Assessment ...................... 239 Lodi – Eight Mile 230 kV line congestion ............................... 241 Simulation results and economic assessment ....................... 241 Hourly power flows ....................................................................... 241 5.7.2.2 Load payment reduction ............................................................... 242 5.7.2.3 Energy benefit .............................................................................. 243 5.7.2.4 Capacity benefit ............................................................................ 243 5.7.2.5 Cost estimate ............................................................................... 244 5.7.2.6 Recommendation ......................................................................... 244 5.8 Summary..................................................................................... 245 Chapter 6 ................................................................................................................. 246 6 Other Studies and Results ............................................................................ 247 6.1 6.1.1 6.1.2 6.1.3 6.1.4 Long-Term Congestion Revenue Rights Simultaneous Feasibility Test Studies ............................................................... 247 Objective ............................................................................... 247 Data Preparation and Assumptions ....................................... 247 Study Process, Data and Results Maintenance ..................... 248 Conclusions ........................................................................... 248 Chapter 7 ................................................................................................................. 249 7 Transmission Project List.............................................................................. 249 7.1 Transmission Project Updates..................................................... 249 7.2 Transmission Projects found to be needed in the 2014-2015 Planning Cycle ............................................................................ 262 7.3 Competitive Solicitation for New Transmission Elements ............ 264 7.4 Capital Program Impacts on Transmission High Voltage Access Charge ........................................................................................ 265 Background ........................................................................... 265 Input Assumptions and Analysis ............................................ 266 7.4.1 7.4.2 California ISO/MID vi 2014-2015 ISO Transmission Plan February 2, 2015 Appendix A System Data Appendix B Reliability Assessment Appendix C Reliability Assessment Study Results Appendix D San Francisco Peninsula Extreme Event Assessment Appendix E 2024 LCR Analysis Final Report and Study Results Appendix F Background Paper on Methodology for Calcualting Locational Effectiveness Factors Appendix G 2014 Request Window Submittals Appendix H Contingencies on the ISO System that may Impact Adjacent Systems California ISO/MID vii 2014-2015 ISO Transmission Plan February 2, 2015 Intentionally left blank California ISO/MID viii 2014-2015 ISO Transmission Plan February 2, 2015 Executive Summary Introduction The 2014-2015 California Independent System Operator Corporation Transmission Plan provides a comprehensive evaluation of the ISO transmission grid to identify upgrades needed to successfully meet California’s policy goals, in addition to examining conventional grid reliability requirements and projects that can bring economic benefits to consumers. This plan is updated annually, and is prepared in the larger context of supporting important energy and environmental policies while maintaining reliability through a resilient electric system. In recent years, California enacted policies aimed at reducing greenhouse gases and increasing renewable resource development. The state’s goal, to have renewable resources provide 33 percent of California’s retail electricity consumption by 2020, became the principal driver of substantial investment in new renewable generation capacity both inside and outside of California. While the bulk transmission needs to meet this objective have largely been identified and are moving forward, the plan is tested in each planning cycle with updated information to ensure it is still adequate to support the 33 percent renewable energy goal. As well, the early retirement of the San Onofre Nuclear Generating Station coupled with the impacts of potential retirement of gas-fired generation in the San Diego and LA Basin areas – largely to eliminate coastal water use in “once-through cooling” have created both opportunities for development of preferred resources as well as challenges in ensuring continued reliable service in these areas. The transmission plan describes the transmission necessary to meet the state’s needs. Key analytic components of the plan include the following: • continuing to refine the plans for transmission needed to support meeting the 33 percent RPS goals over a diverse range of renewable generation portfolio scenarios, which are based on plausible forecasts of the type and location of renewable resources most likely to be developed over the 10 year planning horizon; • supporting advancement of preferred resources in meeting southern California needs, taking immediate steps regarding “least regrets” transmission that can contribute to the overall solution, and providing a framework for future consideration of additional transmission development; • identifying transmission upgrades and additions needed to reliably operate the network and comply with applicable planning standards and reliability requirements; and • performing economic analysis that considers whether transmission upgrades or additions could provide additional ratepayer benefits. Increased opportunity for non-transmission alternatives, particularly preferred resources and storage, continues to be a key focus of the transmission planning analysis. In this regard, the ISO’s transmission planning efforts focus on not only meeting the state’s policy objectives in advancing policy-driven transmission, but also to help transform the electric grid in an California ISO/MID 1 2014-2015 ISO Transmission Plan February 2, 2015 environmentally responsible way. The focus on a cleaner lower emission future governs not only policy-driven transmission, but our path on meeting other electric system needs as well. Our comprehensive evaluation of the areas listed above resulted in the following key findings: • the ISO identified 7 transmission projects with an estimated cost of approximately $352 million as needed to maintain transmission system reliability; • one of the reliability-driven projects, the Martin 230 kV bus extension project, resulted from the extensive analysis of the San Francisco peninsula which had been identified by PG&E as being particularly vulnerable to lengthy outages in the event of extreme (NERC Category D) contingencies. The analysis commenced in the 2013-2014 planning cycle, and concluded in this 2014-2015 planning cycle. This work ultimately concluded that while an additional an additional supply to the peninsula would not materially impact reliability of supply or service restoration times on the peninsula, further reinforcement of the existing system on the peninsula is necessary. One aspect, the Martin bypass, requires ISO approval – the other aspects are more appropriately classified as capital maintenance, and are being undertaken by PG&E with the support of the ISO; • the ISO’s analysis indicated in this planning cycle that the authorized resources, forecast load, and previously-approved transmission projects working together meet the reliability needs in the LA Basin and San Diego areas. However, due to the inherent uncertainty in the significant volume of preferred resources and other conventional mitigations, the ISO has performed extensive analysis of transmission alternatives in the event other resources fail to materialize; • consistent with recent transmission plans, no new major transmission projects have been identified at this time to support achievement of California’s 33 percent renewables portfolio standard given the transmission projects already approved or progressing through the California Public Utilities Commission approval process. However; o the ISO has identified a transmission operational solution that, coupled with previously approved transmission reinforcements, restores the deliverability of future renewable generation from the Imperial Valley area to the levels that were supported before the early retirement of the San Onofre Nuclear Generating Station. The early retirement of the San Onofre Nuclear Generating Station had materially changed flow patterns in the area, resulting in a significant decline in forecast deliverability from the Imperial area as set out in the 2013-2014 Transmission Plan. These new measures, in combination with previously approved transmission projects is projected to provide over 1700 MW of incremental transmission deliverability for the Imperial area. As approximately 1200 MW of new renewable generation interconnecting to either the ISO or IID in the Imperial area is already moving forward, there is sufficient transmission deliverability projected to support an additional 500 to 750 MW of renewable resources, depending on the precise resource locations within the Imperial area; California ISO/MID 2 2014-2015 ISO Transmission Plan o February 2, 2015 the ISO analyzed as a sensitivity study the transmission requirements necessary to deliver up to 2500 MW incremental renewable generation, above existing levels, from the Imperial area; and • one economic-driven transmission project, the Lodi-Eight Mile 230 kV project, is being recommended for approval; and • the ISO tariff sets out a competitive solicitation process for reliability-driven, policy-driven and economic-driven regional transmission facilities found to be needed in the plan. None of the transmission projects in this transmission plan include facilities eligible for competitive solicitation. This year’s transmission plan is based on the ISO’s transmission planning process, which involved collaborating with the California Public Utilities Commission, the California Energy Commission and many other interested stakeholders. Summaries of the transmission planning process and some of the key collaborative activities are provided below. This is followed by additional details on each of the key study areas and associated findings described above. The Transmission Planning Process A core responsibility of the ISO is to plan and approve additions and upgrades to transmission infrastructure so that as conditions and requirements evolve over time, it can continue to provide a highly reliable and efficient bulk power system and well-functioning wholesale power market. Since it began operation in 1998, the ISO has fulfilled this responsibility through its annual transmission planning process. The ISO’s planning process has evolved to address emerging needs and issues. The State of California’s adoption of new environmental policies and goals created a need for some important changes to the planning process. The ISO amended its tariff to address those needed changes, and the Federal Energy Regulatory Commission (FERC) approved the ISO tariff amendments on December 16, 2010. The amendments went into effect on December 20, 2010. The ISO’s regional planning process was further refined in response to FERC Order No. 1000, and those changes went into effect October 1, 2013. FERC Order No. 1000 further led to the development of interregional coordination framework with the ISO's neighboring planning entities. This framework was developed through extensive collaboration with the neighboring planning entities, resulting in joint tariff language among all four parties. FERC has subsequently recently approved the ISO’s interregional process filing effective October 1, 2015, subject to a second compliance filing. The ISO has also continued with implementing the integration of the transmission planning process with the generation interconnection procedures, based on the Generator Interconnection and Deliverability Allocation Procedures (GIDAP) approved by FERC in July 2012. The principal objectives of the GIDAP were to 1) ensure that, in the future, all major transmission additions and upgrades to be paid for by transmission ratepayers would be identified and approved under a single comprehensive process — the transmission planning process — rather than some projects coming through the transmission planning process and California ISO/MID 3 2014-2015 ISO Transmission Plan February 2, 2015 others through the generator interconnection process; 2) limit ratepayers’ exposure to potentially costly interconnection-driven network upgrades that may not be most cost effective means for achieving policy goals; and 3) enable the interconnection study process to determine reasonable network upgrade needs and associated cost estimates in a context where the volume of the interconnection queue vastly exceeds the amount of new generation that will actually be needed and built. Collaborative Planning Efforts The ISO, utilities, state agencies and other stakeholders continue to work closely to assess how to meet the environmental mandates established by state policy. The collaboration with these entities is evident in the following initiatives. State Agency Coordination in Planning State agency coordination in planning has continued to be improved in 2014 building further improvements into the development of unified planning assumptions that have enhanced this year’s plan as well as setting a stage for enhancements in future transmission planning cycles . The development of the unified planning assumptions for this planning cycle benefited from further improvements in coordination efforts between the CPUC, the CEC and the ISO. Building from previous collaboration efforts focused on a single “managed” load forecast, staff undertook an inter-agency process alignment forum to improve infrastructure planning coordination within the three core processes: • • • Long-term forecast of energy demand produced by the CEC as part of its biennial Integrated Energy Policy Report (IEPR), Biennial Long Term Procurement Plan proceeding (LTPP) conducted by the CPUC, and Annual Transmission Planning Process (TPP) performed by the ISO. The agencies also agreed on an annual process to be performed in the fall of each year to develop planning assumptions and scenarios to be used in infrastructure planning activities in the coming year. The assumptions include demand, supply and system infrastructure elements, including the renewables portfolio standard (RPS) portfolios discussed in more detail below. (Please refer to the subsection “33 Percent RPS Generation Portfolios and Transmission Assessment” below.) The results of the CPUC’s annual process feeding into this 2014-2015 transmission planning process were communicated via an assigned commissioner’s ruling in the 2014 LTPP 1. These assumptions are further vetted by stakeholders through the stakeholder process in developing each year’s study plan. Based on the process alignment achieved to date and the progress on common planning assumptions, the ISO anticipates conducting future transmission planning process studies, 101 Rulemaking 13-12-010 ”Assigned Commissioner's Ruling Technical Updates to Planning Assumptions and Scenarios for Use in the 2014 Long-Term Procurement Plan and 2014-2015 CAISO TPP” on February 27, 2014, with a technical update adopted on May 14, 2014. California ISO/MID 4 2014-2015 ISO Transmission Plan February 2, 2015 year Local Capacity Requirement studies, and system resource studies (including operational flexibility) during each transmission planning cycle, using the consistent planning assumptions established for both processes. Preliminary Reliability Plan for LA Basin and San Diego: In response to the announced closure of the San Onofre Nuclear Generating Station on June 7, 2013, the staff of the California Public Utilities Commission, the California Energy Commission and ISO developed a Preliminary Reliability Plan for the LA Basin and San Diego area. The draft, released on August 30, 2013, was developed in consultation with SWRCB, SCE, SDG&E and South Coast Air Quality Management District (SCAQMD) and describes the coordinated actions the CPUC, CEC, and CAISO staff are pursuing in the near term (4 years) and the longterm (7 years). These actions collectively comprised a preliminary reliability plan to address the closure of San Onofre, the expected closure of 5,068 MW of gas-fired generation that uses once-through cooling technology, and the normal patterns of load-growth. The reliability plan identified challenging goals that needed to be fully vetted in the public decision making processes of the appropriate agency, with a focus on ensuring reliability, finding the most environmentally clean grid solutions, and urgently pursuing the variety of decisions that must ultimately be made and approved by key state agencies. Also, implementing the specific mitigation options required decisions to be determined through CPUC or CEC proceedings, through the ISO planning process or both. Considerable progress has been made in the various proceedings; the results of this progress are discussed below (see “Reliability Assessment”) and indicate that the authorized resources and approved transmission are sufficient to meet the currently forecast needs. Staff is continuing to monitor the progress of the demand-side programs, the utilities’ progress in procuring authorized resources, and the progress of approved transmission mitigations. Inter-regional Planning Requirements of FERC Order 1000 In July 2011, FERC issued Order No. 1000 on “Transmission Planning and Cost Allocation by Transmission Owning and Operating Public Utilities.” The order required the ISO to make a filing demonstrating that the ISO is a qualified regional planning entity under the definition of the order, and modifying the ISO tariff as needed to meet the regional planning provisions of the order as noted earlier. It also required the ISO to develop and file common tariff provisions with each of its neighboring planning regions to define a process whereby each pair of adjacent regions can identify and jointly evaluate potential inter-regional transmission projects that meet their transmission needs more cost-effectively or efficiently than projects in their regional plans, and to specify how the costs of such a project would be assigned to the relevant regions that have selected the inter-regional project in their regional transmission plans. Through collaborative efforts, the four planning regions reached agreement joint tariff language that was ultimately proposed for inclusion placed in each transmission utility provider’s tariff. On May 10, 2013 the ISO, along with transmission utility providers belonging to the NTTG, and WestConnect planning regions jointly submitted their Order 1000 interregional compliance filings. The ColumbiaGrid transmission utility providers submitted the joint tariff language in June 2013 as part of the ColumbiaGrid interregional. The ISO considers these filings to be a California ISO/MID 5 2014-2015 ISO Transmission Plan February 2, 2015 significant achievement by all four planning regions and a reflection of their commitment to work towards a successful and robust interregional planning process under Order 1000. A FERC order on these initial filings was issued on December 18, 2014, largely adopting the filings with an effective date of October 1, 2015. The ISO is required to file a second compliance filing relating to certain details of benefit assessments to be used in interregional cost allocation processes. The ISO and its neighbors are also undertaking coordination activities to the extent possible prior to the actual effective date. Advancing Preferred Resources Building on efforts in past planning cycles, the ISO is continuing to make material strides in facilitating use of preferred resources to meet local transmission system needs. The ISO issued a paper 2 on September 4, 2013, as part of the 2013-2014 transmission planning cycle in which it presented a methodology to support California’s policy emphasis on the use of preferred resources 3 — energy efficiency, demand response, renewable generating resources and energy storage — by considering how such resources can constitute non-conventional solutions to meet local area needs that otherwise would require new transmission or conventional generation infrastructure, with initial work based on a generic suite of preferred resources until procurement activities provided better information on the detailed characteristics being provide by the market. While the ISO initially considered trying to augment the generic suite of resources, the ISO has reviewed the existing methodology and concluded that further refinement of the generic suite of preferred resources forming the basis of the methodology would not be practical or effective until more detailed information is available about the types of preferred resource options being brought forward in the existing procurement processes. Instead, efforts were focused on testing the resources provided by the market into the utility procurement processes for preferred resources. The ISO has provided additional support in advancing the cause of preferred resources in a number of forums, which are described in more detail in chapter 1, and include actively supporting the development of an energy storage roadmap in concert with state energy agencies and participating actively in the CPUC’s demand response related proceedings supporting identification of the necessary operating characteristics so that the demand response role in meeting transmission system increases as design and implementation issues are addressed. 2 http://www.caiso.com/Documents/Paper-Non-ConventionalAlternatives-2013-2014TransmissionPlanningProcess.pdf To be precise, “preferred resources” as defined in CPUC proceedings applies more specifically to demand response and energy efficiency, with renewable generation and combined heat and power being next in the loading order. The term is used more generally here consistent with the more general use of the resources sought ahead of conventional generation. 3 California ISO/MID 6 2014-2015 ISO Transmission Plan February 2, 2015 Reliability Assessment The reliability studies necessary to ensure compliance with North American Electric Reliability Corporation (NERC) and ISO planning standards are a foundational element of the transmission plan. During the 2014-2015 cycle, ISO staff performed a comprehensive assessment of the ISO controlled grid to ensure compliance with applicable NERC reliability standards. The analysis was performed across a 10-year planning horizon and modeled summer on-peak and off-peak system conditions. The ISO assessed transmission facilities across voltages of 60 kV to 500 kV, and where reliability concerns were identified, the ISO identified mitigation plans to address these concerns. These mitigation plans include upgrades to the transmission infrastructure, implementation of new operating procedures and installation of automatic special protection schemes. All ISO analysis, results and mitigation plans are documented in the transmission plan. In total, this plan proposes approving 7 reliability-driven transmission projects, representing an investment of approximately $352 million in infrastructure additions to the ISO controlled grid. The majority of these projects (5) cost less than $50 million and has a combined cost of $98 million. The remaining two projects with costs greater than $50 million have a combined cost of $254 million and consist of the following: • North East Kern 70 to 115 kV Voltage Conversion – Converting two existing 70 kV circuits in the area to 115 kV, reconductoring an existing 115 kV line with larger conductor, and upgrading an existing substation to breaker-and-a-half configuration. • Martin 230 kV bus extension project – Reconfiguring the existing 230 kV transmission terminating at Martin to provide one 230 kV path bypassing the Martin substation. These reliability projects are necessary to ensure compliance with the NERC and ISO planning standards. A summary of the number of projects and associated total costs in each of the four major transmission owners’ service territories is listed below in table 1. Because Pacific Gas and Electric (PG&E) and San Diego Gas and Electric (SDG&E) have lower voltage transmission facilities (138 kV and below) under ISO operational control, a higher number of projects are usually identified mitigating reliability concerns in those utilities’ areas, compared to the lower number for Southern California Edison (SCE). The number of reliability-driven transmission projects identified in this planning cycle is significantly reduced from previous cycles; this reflects the progress made in previous planning cycles addressing longer term reliability needs as well as the increased reliance on preferred resources. California ISO/MID 7 2014-2015 ISO Transmission Plan February 2, 2015 Table 1 – Summary of Needed Reliability-Driven Transmission Projects in the ISO 2014-2015 Transmission Plan Service Territory Number of Projects Cost (in millions) Pacific Gas & Electric (PG&E) 2 $254 Southern California Edison Co. (SCE) 1 $5 San Diego Gas & Electric Co. (SDG&E) 4 $93 Valley Electric Association (VEA) 0 0 Total 7 $352 The majority of identified reliability concerns are related to facility overloads or low voltage. Therefore, many of the specific projects that comprise the totals in table 1 include line reconductoring and facility upgrades for relieving overloading concerns. Several initially identified reliability concerns were mitigated with non-transmission solutions. These include generation redispatch and, for low probability contingencies, possible load curtailment. As noted earlier, one new project is part of a larger basket of reinforcements planned for the San Francisco area. The other mitigations planned to improve the reliability on the peninsula, both to reduce risk of outage and to improve service restoration following a more severe event, are more appropriately considered capital maintenance. • the ISO’s analysis indicated in this planning cycle that the authorized resources, forecast load, and previously-approved transmission projects working together meet the reliability needs in the LA Basin and San Diego areas. However, due to the inherent uncertainty in the significant volume of preferred resources and other conventional mitigations, the ISO has performed extensive analysis of alternatives in the event other resources fail to materialize. 33 Percent RPS Generation Portfolios and Transmission Assessment The transition to greater reliance on renewable generation has created significant transmission challenges because renewable resource areas tend to be located in places distant from population centers. The ISO’s transmission planning process has balanced the need for certainty by generation developers as to where this transmission will be developed with the planning uncertainty of where resources are likely to develop by creating a structure for considering a range of plausible generation development scenarios and identifying transmission elements needed to meet the state’s 2020 RPS. Commonly known as a least regrets methodology, the portfolio approach allows the ISO to consider resource areas (both in-state and out-of-state) where generation build-out is most likely to occur, evaluate the need for California ISO/MID 8 2014-2015 ISO Transmission Plan February 2, 2015 transmission to deliver energy to the grid from these areas, and identify any additional transmission upgrades that are needed under one or more portfolios. The ISO 33 percent RPS assessment is described in detail in chapters 4 and 5 of this plan. Public policy requirements and directives are an element of transmission planning that was added to the planning process in 2010. Planning transmission to meet public policy directives is a national requirement under FERC Order No. 1000. It enables the ISO to identify and approve transmission facilities that system users will need to comply with state and federal requirements or directives. The primary policy directive for last four years’ planning cycles and the current cycle is California’s Renewables Portfolio Standard that calls for 33 percent of the electric retail sales in the state in 2020 to be provided from eligible renewable resources. As discussed later in this section, the ISO’s study work and resource requirements determination for reliably integrating renewable resources is continuing on a parallel track outside of the transmission planning process, but steps are taken in this transmission plan to incorporate those requirements into annual transmission plan activities. In consultation with interested parties, CPUC staff developed three renewable generation scenarios for meeting the 33 percent RPS goal in 2020, with one of these being a sensitivity study for informational purposes that included significantly higher levels of renewable generation in the Imperial area. The reduced number of scenarios from previous transmission planning cycles and less variability between several of the scenarios are indicative of there being greater certainty around the portfolios, as utilities have largely completed their contracting for renewable resources to meet the 2020 goals. The ISO assessment in this planning cycle did not identify a need for new transmission projects to support achievement of California’s 33 percent renewables portfolio standard given the transmission projects already approved or progressing through the California Public Utilities Commission approval process. As noted above, however, the ISO did identify some transmission operational solutions for improving transmission deliverability out of the Imperial area. More specifically: • the ISO has identified operational solutions that, coupled with previously approved transmission reinforcements, restores the deliverability of future renewable generation from the Imperial Valley area to the levels that were forecast before the early retirement of the San Onofre Nuclear Generating Station. The early retirement of the San Onofre Nuclear Generating Station had materially changed flow patterns in the area, resulting in a significant decline in forecast deliverability from the Imperial area as set out in the 2013-2014 Transmission Plan. These new measures, in combination with previously approved transmission projects, result in a forecast of over 1700 MW incremental capacity for new renewables above existing facilities. As approximately 1000 MW of new renewable generation is already moving forward in the ISO or IID in the Imperial area, there remains a forecast of between 500 and 750 MW being available above renewables projects already moving forward, depending on the precise location within the Imperial area, and California ISO/MID 9 2014-2015 ISO Transmission Plan • February 2, 2015 the ISO also analyzed as a sensitivity study the transmission requirements necessary to deliver up to 2500 MW incremental renewable generation, above existing levels, from the Imperial area. Table 2 provides a summary of the various transmission elements of the 2014-2015 Transmission Plan for supporting California’s RPS in addition to providing other reliability benefits. These elements are composed of the following categories: • major transmission projects that have been previously approved by the ISO and are fully permitted by the CPUC for construction; • additional transmission projects that the ISO interconnection studies have shown are needed for access to new renewable resources but are still progressing through the approval process; and • major transmission projects that have been previously approved by the ISO but are not yet permitted. California ISO/MID 10 2014-2015 ISO Transmission Plan February 2, 2015 Table 2: Elements of 2014-2015 ISO Transmission Plan Supporting Renewable Energy Goals Transmission Facility Online Transmission Facilities Approved, Permitted and Under Construction Sunrise Powerlink (completed) 2012 Tehachapi Transmission Project 2016 Colorado River - Valley 500 kV line (completed) 2013 Eldorado – Ivanpah 230 kV line (completed) 2013 Carrizo Midway Reconductoring (completed) 2013 Additional Network Transmission Identified as Needed in ISO Interconnection Agreements but not Permitted Borden Gregg Reconductoring 2019 South of Contra Costa Reconductoring 2016 West of Devers Reconductoring 2019 Coolwater - Lugo 230 kV line 2018 Policy-Driven Transmission Elements Approved but not Permitted Mirage-Devers 230 kV reconductoring (Path 42) 2015 Imperial Valley Area Collector Station 2015 Sycamore – Penasquitos 230kV Line 2017 Eldorado-Mohave and Eldorado-Moenkopi 500 kV Line Swap 2016 Lugo – Eldorado series cap and terminal equipment upgrade 2016 Warnerville-Bellota 230 kV line reconductoring 2017 Wilson-Le Grand 115 kV line reconductoring 2020 Suncrest 300 Mvar SVC 2017 Lugo-Mohave series capacitors 2017 Additional Policy-Driven Transmission Elements Recommend for Approval None identified in 2014-2015 Transmission Plan California ISO/MID 11 2014-2015 ISO Transmission Plan February 2, 2015 Economic Studies Economic studies of transmission needs are another fundamental element of the ISO transmission plan. The objective of these studies is to identify transmission congestion and analyze if the congestion can be cost effectively mitigated by network upgrades. Generally speaking, transmission congestion increases consumer costs because it prevents lower priced electricity from serving load. Resolving congestion bottlenecks is cost effective when ratepayer savings are greater than the cost of the project. In such cases, the transmission upgrade can be justified as an economic project. The ISO economic planning study was performed after evaluating all policy-driven transmission (i.e., meeting RPS) and reliability-driven transmission. Network upgrades determined by reliability and renewable studies were modeled as an input in the economic planning database to ensure that the economic-driven transmission needs are not redundant and are beyond the reliability- and policy-driven transmission needs. The engineering analysis behind the economic planning study was performed using a production simulation and traditional power flow software. Grid congestion was identified using production simulation and congestion mitigation plans were evaluated through a cost-benefit analysis. Economic studies were performed in two steps: 1) congestion identification; and 2) congestion mitigation. In the congestion identification phase, grid congestion was simulated for 2018 (the 5th planning year) and 2023 (the 10th planning year). Congestion issues were identified and ranked by severity in terms of congestion hours and congestion costs. Based on these results, the five worst congestion issues were identified and ultimately selected as high-priority studies. In the congestion mitigation phase, congestion mitigation plans were analyzed for the five worst congestion issues. In addition, two economic study requests were submitted. Based on previous studied, identified congestion in the simulation studies, and the study requests, the ISO identified 5 high priority studies, which were evaluated in the 2013-2014 planning cycle. The analyses compared the cost of the mitigation plans to the expected reduction in production costs, congestion costs, transmission losses, capacity or other electric supply costs resulting from improved access to cost-efficient resources. Based on the economic analysis, the ISO is recommending proceeding with the Lodi-Eight Mile 230 kV project. The project consists of reconductoring the existing 230 kV circuit to a higher ampacity, to alleviate thermal limits. The estimated cost of this economic-driven project is $7 million. Conclusions and Recommendations The 2014-2015 ISO Transmission Plan provides a comprehensive evaluation of the ISO transmission grid to identify upgrades needed to adequately meet California’s policy goals, address grid reliability requirements and bring economic benefits to consumers. This year’s plan identified 8 transmission projects, estimated to cost a total of approximately $359 million, as needed to maintain the reliability of the ISO transmission system, meet the state’s renewable energy mandate, and deliver material economic benefits. As well, the ISO has identified the need to continue study in future cycles focusing on: California ISO/MID 12 2014-2015 ISO Transmission Plan February 2, 2015 • continuing the coordinated and iterative process of assessing southern California (LA Basin and San Diego area) needs with an emphasis on preferred resources, and in particular, assessing the progress made on the planned mitigations to consider the need for additional, alternative measures; • continuing to explore and refine methodologies to ensure the maximum opportunity for preferred resources to meet transmission system needs; and • exploring the infrastructure needs for future additional renewable energy development in anticipation of higher reliance upon these resources in future government policy direction. California ISO/MID 13 2014-2015 ISO Transmission Plan February 2, 2015 Intentionally left blank California ISO/MID 14 2014-2015 ISO Transmission Plan February 2, 2015 Chapter 1 1 Overview of the Transmission Planning Process 1.1 Purpose A core ISO responsibility is to identify and plan the development of solutions to meet the future needs of the ISO controlled grid. Fulfilling this responsibility includes conducting an annual transmission planning process (TPP) that culminates in a Board of Governors approved, comprehensive transmission plan. The plan identifies needed transmission solutions and authorizes cost recovery through ISO transmission rates, subject to regulatory approval, as well as identifying other solutions that will be pursued in other venues to avoid building additional transmission facilities if possible. The plan is prepared in the larger context of supporting important energy and environmental policies and assisting in the transition to a cleaner, lower emission future while maintaining reliability through a resilient electric system. This document serves as the comprehensive transmission plan for the 2014-2015 planning cycle. The plan primarily identifies needed transmission facilities based upon three main categories of transmission solutions: reliability, public policy and economic needs. The plan may also include transmission solutions needed to maintain the feasibility of long-term congestion revenue rights, provide a funding mechanism for location-constrained generation projects or provide for merchant transmission projects. The ISO also considers and places a great deal of emphasis on the development of non-transmission alternatives; both conventional generation and in particular, preferred resources such as energy efficiency, demand response, renewable generating resources and energy storage programs. Though the ISO cannot specifically approve non-transmission alternatives as projects or elements in the comprehensive plan, these can be identified as the preferred mitigation in the same manner that operational solutions are often selected in lieu of transmission upgrades. Further, load modifying preferred resource assumptions are also incorporated into the load forecasts adopted through state energy agency activities that the ISO supports, and provide an additional opportunity for preferred resources to address transmission needs. The ISO’s activities to further refine opportunities for preferred resources have evolved in this transmission planning cycle, both within the planning process and in parallel activities in other processes. The further refinement of the policy and implementation frameworks for preferred resources across the industry will be critical in enabling these resources to play a greater role in addressing transmission needs beyond the specific geographic areas targeted to date. The ISO identifies needed reliability solutions to ensure transmission system performance is compliant with all North American Electric Reliability Corporation (NERC) standards and Western Electricity Coordinating Council (WECC) regional criteria as well as with ISO transmission planning standards. The reliability studies necessary to ensure such compliance comprise a foundational element of the transmission planning process. During the 2014-2015 cycle, ISO staff performed a comprehensive assessment of the ISO controlled grid to verify compliance with applicable NERC reliability standards. The analysis was performed across a 10-year California ISO/MID 15 2014-2015 ISO Transmission Plan February 2, 2015 planning horizon and it modeled summer on-peak and off-peak system conditions. The ISO assessed transmission facilities across a voltage range of 60 kV to 500 kV. The ISO also identified plans to mitigate any observed concerns that included upgrading transmission infrastructure, implementing new operating procedures and installing automatic special protection schemes, and identifying the potential for conventional and non-conventional resources to meet these needs. In recommending solutions for the identified needs, the ISO takes into account an array of considerations; furthering the state’s objectives of transitioning to a cleaner future plays a major part in those considerations. Building on previous transmission plans, the ISO placed considerable emphasis in the 20142015 planning cycle on the Los Angeles basin and San Diego area requirements that address the implications of the San Onofre Nuclear Generating Station’s early retirement coupled with the anticipated retirement of once-through-cooling gas fired generation. The high expectations on preferred resources playing a part of a comprehensive solution, which also includes transmission reinforcement and conventional generation, has also resulted in the analysis of preferred resources also focusing in that area. ISO analyses, results and mitigation plans are documented in this transmission plan. 4 These topics are discussed in more detail below. Public policy-driven transmission solutions are those needed to enable the grid infrastructure to support state and federal directives. As in recent past transmission planning cycles, the state directive SBX1-2 is the primary driver of policy driven analysis in this transmission plan; the law, also known as the Renewables Portfolio Standard, requires 33 percent of the electricity sold annually in the state to be supplied from qualified renewable resources by the year 2020. Achieving this policy requires developing substantial amounts of renewable generating resources, along with building new infrastructure to deliver the power produced by these facilities to consumers. However, in this 2014-2015 planning cycle, the ISO is taking preliminary steps to explore options anticipating growing renewable generation needs beyond a 33 percent RPS framework, and is also taking first steps to incorporate renewable integration needs into the annual transmission planning process. The interplay between southwestern California reliability needs and the potential for further renewable generation development in the southeast portion of the state have also been highlighted in the analysis conducted this year, and discussed in this transmission plan. Economic-driven solutions are those that offer economic benefits to consumers that exceed their costs as determined by ISO studies, which includes a production simulation analysis. 4 As part of efforts focused on the continuous improvement of the transmission plan document, the ISO has made several changes in documenting study results from prior years’ plans. This document continues to provide detail of all study results necessary to transmission planning activities. However, consistent with the changes made in the 2012/2013 transmission plan, additional documentation necessary strictly for demonstration of compliance with NERC and WECC standards but not affecting the transmission plan itself is being removed from this year’s transmission planning document and compiled in a separate document for future NERC/FERC audit purposes. In addition, detailed discussions of material that may constitute Critical Energy Infrastructure Information (CEII) are restricted to appendices that are shared only consistent with CEII requirements. High level discussions are provided in the publicly available portion of the transmission plan, however, to provide a meaningful overview of the comprehensive transmission system needs without compromising CEII requirements. California ISO/MID 16 2014-2015 ISO Transmission Plan February 2, 2015 Typical economic benefits include reductions in congestion costs and transmission line losses, as well as access to lower cost resources for the supply of energy and capacity. California ISO/MID 17 2014-2015 ISO Transmission Plan February 2, 2015 1.2 Structure of the Transmission Planning Process The annual planning process is structured in three consecutive phases with each planning cycle identified by a beginning year and a concluding year. Each annual cycle begins in January but extends beyond a single calendar year. The 2013-2014 planning cycle, for example, began in January 2013 and concluded in March 2014. Phase 1 includes establishing the assumptions and models for use in the planning studies, developing and finalizing a study plan, and specifying the public policy mandates that planners will adopt as objectives in the current cycle. This phase takes roughly three months from January through March of the beginning year. Phase 2 is when the ISO performs studies to identify the needed solutions to the various needs that culminate in the annual comprehensive transmission plan. This phase takes approximately 12 months that ends with Board approval. Thus, phases 1 and 2 take 15 months to complete. The identification of non-transmission alternatives that are being relied upon in lieu of transmission solutions also takes place at this time. It is critical that parties responsible for approving or developing those non-transmission alternatives are aware of the reliance being placed on those alternatives. Phase 3 includes the competitive solicitation for prospective developers to build and own new transmission facilities identified in the Board-approved plan. In any given planning cycle, phase 3 may or may not be needed depending on whether the final plan includes transmission facilities that are open to competitive solicitation in accordance with criteria specified in the ISO tariff. In addition, specific transmission planning studies necessary to support other state or industry informational requirements can be incorporated into the annual transmission planning process to efficiently provide study results that are consistent with the comprehensive transmission planning process. In this cycle, these studies focus primarily on continuing the review of the need and robustness of existing Special Protection Systems, as well as beginning the transition of incorporating renewable generation integration studies into the transmission planning process. 1.2.1 Phase 1 Phase 1 generally consists of two parallel activities: 1) developing and completing the annual unified planning assumptions and study plan; and 2) developing a conceptual statewide transmission plan, which may be completed during phase 1 or phase 2. Improving upon the timelines and coordination achieved in the 2013-2014 planning cycle, the generating resource portfolios used to analyze public policy-driven transmission needs were developed as part of the unified planning assumptions in phase 1 for the 2014-2015 planning cycle. Further efforts are underway to again improve the level of coordination between both the policy-driven generating resource portfolios and other planning assumptions — in particular the load forecast and preferred resource forecasts, and these process improvements will continue in the 2015-2016 planning cycle. California ISO/MID 18 2014-2015 ISO Transmission Plan February 2, 2015 The purpose of the unified planning assumptions is to establish a common set of assumptions for the reliability and other planning studies the ISO will perform in phase 2. The starting point for the assumptions is the information and data derived from the comprehensive transmission plan developed during the prior planning cycle. The ISO adds other information, including network upgrades and additions identified in studies conducted under the ISO’s generation interconnection procedures and incorporated in executed generator interconnection agreements (GIA). In the unified planning assumptions the ISO also specifies the public policy requirements and directives that will affect the need for new transmission infrastructure. The development of the unified planning assumptions for this planning cycle benefited from further improvements in coordination efforts between the CPUC, the CEC and the ISO. With the adoption of new energy and environmental policy goals and the emergence of diverse supply and demand-side technologies, it has become apparent that closer collaboration among the energy agencies and alignment of these processes are needed. In addition to regular communication on planning coordination, staff also undertook an inter-agency process alignment forum to improve infrastructure planning coordination within the three core processes: • • • Long-term forecast of energy demand produced by the CEC as part of its biennial Integrated Energy Policy Report (IEPR), Biennial Long Term Procurement Plan proceeding (LTPP) conducted by the CPUC, and Annual Transmission Planning Process (TPP) performed by the ISO. In addition to aligning the three core processes, the agencies also agreed on an annual process to be performed in the fall of each year to develop planning assumptions and scenarios to be used in infrastructure planning activities in the coming year. The assumptions include demand, supply and system infrastructure elements, including the renewables portfolio standard (RPS) portfolios discussed in more detail below as a key assumption. The results of the CPUC’s annual process feeding into this 2014-2015 transmission planning process were communicated via a ruling in the 2014 LTPP 5. Public policy requirements and directives are an element of transmission planning that was added to the planning process in 2010. Planning transmission to meet public policy directives is a national requirement under FERC Order No. 1000. It enables the ISO to identify and approve transmission facilities that system users will need to comply with state and federal requirements or directives. The primary policy directive for last four years’ planning cycles and the current cycle is California’s Renewables Portfolio Standard that calls for 33 percent of the electric retail sales in the state in 2020 to be provided from eligible renewable resources. As discussed later in this section, the ISO’s study work and resource requirements determination for reliably integrating renewable resources is continuing on a parallel track outside of the transmission planning process, but steps are taken in this transmission plan to incorporate those requirements into annual transmission plan activities. 5 5 Rulemaking 13-12-010 ”Assigned Commissioner's Ruling Technical Updates to Planning Assumptions and Scenarios for Use in the 2014 Long-Term Procurement Plan and 2014-2015 CAISO TPP” on February 27, 2014, with a technical update adopted on May 14, 2014. California ISO/MID 19 2014-2015 ISO Transmission Plan February 2, 2015 The study plan describes the computer models and methodologies to be used in each technical study, provides a list of the studies to be performed and the purpose of each study, and lays out a schedule for the stakeholder process throughout the entire planning cycle. The ISO posts the unified planning assumptions and study plan in draft form for stakeholder review and comment, during which stakeholders may request specific economic planning studies to assess the potential economic benefits (such as congestion relief) in specific areas of the grid. The ISO then specifies a list of high priority studies among these requests (i.e., those which the engineers expect may provide the greatest benefits) and includes them in the study plan when it publishes the final unified planning assumptions and study plan at the end of phase 1. The list of high priority studies may be modified later based on new information such as revised generation development assumptions and preliminary production cost simulation results. The conceptual statewide transmission plan, also added to the planning process in 2010, was initiated based on the recognition that policy requirements or directives such as the RPS apply throughout the state, not only within the ISO area. The conceptual statewide plan takes a wholestate perspective to identify potential upgrades or additions needed to meet state and federal policy requirements or directives such as renewable energy targets. The ISO performs this activity in coordination with regional planning groups and neighboring balancing authorities to the extent possible. In the initial years of this process, the ISO developed its conceptual statewide plan in coordination with other California planning authorities and load serving transmission providers under the structure of the California Transmission Planning Group (CTPG). CTPG activities were largely placed on hold as planning entities have been focused on their compliance filings to address FERC Order No. 1000 requirements and implementing those provisions. The ISO, therefore, developed this year’s conceptual state-wide plan by updating the previous plan using current ISO information and publicly available information from our neighboring planning entities. This approach will need to be revisited as new interregional processes coalesce in response to FERC approvals of regional planning tariffs and steps being taken to advance interregional coordination ahead of approvals on interregional processes as discussed below. The ISO formulates the public policy-related resource portfolios in collaboration with the California Public Utilities Commission (CPUC), with input from other state agencies such as the California Energy Commission (CEC) and the municipal utilities within the ISO balancing authority area. The CPUC plays a primary role formulating the resource portfolios as the agency that oversees the supply procurement activities of the investor-owned utilities and retail direct access providers, which collectively account for 95 percent of the energy consumed annually within the ISO area. The proposed portfolios are reviewed with stakeholders to seek their comments, which are then considered for incorporation into the final portfolios. The resource portfolios have played a crucial role in identifying public policy-driven transmission elements. Meeting the RPS has entailed developing substantial amounts of new renewable generating capacity, which will in turn required new transmission for delivery. The uncertainty as to where the generation capacity will locate has been managed recognizing this uncertainty and balancing the requirement to have needed transmission completed and in service in time to support the RPS against the risk of building transmission in areas that do not realize enough new generation to justify the cost of such infrastructure. This entailed applying a “least regrets” California ISO/MID 20 2014-2015 ISO Transmission Plan February 2, 2015 principle, which first formulates several alternative resource development portfolios or scenarios, then identifies the needed transmission to support each portfolio followed by selecting for approval those transmission elements that have a high likelihood of being needed and well-utilized under multiple scenarios. As we move progressively closer to the 33 percent RPS compliance date of 2020, however, much of the uncertainty about which areas of the grid will actually realize most of this new resource development through the utilities’ procurement and contracting processes. The portfolios designed to meet the 33 percent RPS are therefore showing less variation each year as we move closer to 2020. Turning to a broader landscape of the western interconnection, the ISO participated in an interregional planning coordination meeting along with ColumbiaGrid, Northern Tier Transmission Group, and WestConnect early in 2014. As established FERC Order No. 1000 planning entities, the four planning regions organized the meeting to provide stakeholders throughout the western interconnection an opportunity to hear about each planning region’s planning activities and to discuss near-term interregional coordination opportunities notwithstanding the interregional processes were not yet approved and in effect. Stakeholders were also provided the opportunity to offer their suggestions and proposals for possible interregional transmission opportunities that could be considered by the planning regions. FERC has subsequently recently approved the ISO’s interregional process filing effective October 1, 2015, subject to a second compliance filing. The planning regions intend to hold another informal planning coordination meeting early in 2015 despite the interregional tariff provisions not yet being in effect at that time. 1.2.2 Phase 2 In phase 2, the ISO performs all necessary technical studies, conducts a series of stakeholder meetings and develops an annual comprehensive transmission plan for the ISO controlled grid. The comprehensive transmission plan specifies the transmission solutions to system limitations needed to meet the infrastructure needs of the grid. This includes the reliability, public policy, and economic-driven categories. In phase 2, the ISO conducts the following major activities: • performs technical planning studies as described in the phase 1 study plan and posts the study results; • provides a request window for submitting reliability project proposals in response to the ISO’s technical studies, demand response storage or generation proposals offered as alternatives to transmission additions or upgrades to meet reliability needs, Location Constrained Resource Interconnection Facilities project proposals, and merchant transmission facility project proposals; • completes the conceptual statewide plan if it is not completed in phase 1, which is also used as an input during this phase, and provides stakeholders an opportunity to comment on that plan; California ISO/MID 21 2014-2015 ISO Transmission Plan February 2, 2015 • evaluates and refines the portion of the conceptual statewide plan that applies to the ISO system as part of the process to identify policy-driven transmission elements and other infrastructure needs that will be included in the final comprehensive transmission plan; • coordinates transmission planning study work with renewable integration studies performed by the ISO for the CPUC long-term procurement proceeding to determine whether policy-driven transmission facilities are needed to integrate renewable generation, as described in tariff section 24.4.6.6(g); • reassesses, as needed, significant transmission facilities starting with the 2011-2012 planning cycle that were in GIP phase 2 cluster studies to determine — from a comprehensive planning perspective — whether any of these facilities should be enhanced or otherwise modified to more effectively or efficiently meet overall planning needs; • performs a “least regrets” analysis of potential policy-driven solutions to identify those elements that should be approved as category 1 transmission elements, 6 which is based on balancing the two objectives of minimizing the risk of constructing under-utilized transmission capacity while ensuring that transmission needed to meet policy goals is built in a timely manner; • identifies additional category 2 policy-driven potential transmission facilities that may be needed to achieve the relevant policy requirements and directives, but for which final approval is dependent on future developments and should therefore be deferred for reconsideration in a later planning cycle; • performs economic studies, after the reliability projects and policy-driven solutions have been identified, to identify economically beneficial transmission solutions to be included in the final comprehensive transmission plan; • performs technical studies to assess the reliability impacts of new environmental policies such as new restrictions on the use of coastal and estuarine waters for power plant cooling, which is commonly referred to as once through cooling and AB 1318 legislative requirements for ISO studies on the electrical system reliability needs of the South Coast Air Basin; • conducts stakeholder meetings and provides public comment opportunities at key points during phase 2; and • consolidates the results of the above activities to formulate a final, annual comprehensive transmission plan to post in draft form for stakeholder review and 6 In accordance with the least regrets principle, the transmission plan may designate both category 1 and category 2 policy-driven solutions. The use of these categories better enable the ISO to plan transmission to meet relevant state or federal policy objectives within the context of considerable uncertainty regarding which grid areas will ultimately realize the most new resource development and other key factors that materially affect the determination of what transmission is needed. The criteria to be used for this evaluation are identified in section 24.4.6.6 of the revised tariff. California ISO/MID 22 2014-2015 ISO Transmission Plan February 2, 2015 comment at the end of January and present to the ISO Board for approval at the conclusion of phase 2 in March. When the Board approves the comprehensive transmission plan at the end of phase 2, its approval constitutes a finding of need and an authorization to develop the reliability-driven facilities, category 1 policy-driven facilities and the economic-driven facilities in the plan. The Board’s approval authorizes implementation and enables cost recovery through ISO transmission rates of those transmission projects included in the plan that require Board approval under current tariff provisions. 7 As indicated above, the ISO will solicit and accept proposals in phase 3 from all interested project sponsors to build and own the transmission solutions that are open to competition. By definition, the category 2 solutions in the comprehensive plan will not be authorized to proceed after Board approval, but will instead be identified for a re-evaluation of need during the next annual cycle of the planning process. At that time, based on relevant new information about the patterns of expected development, the ISO will determine whether the category 2 solutions now satisfy the least regrets criteria and should be elevated to category 1 status, should remain category 2 projects for another cycle, or should be removed from the transmission plan. As noted earlier, phases 1 and 2 of the transmission planning process encompass a 15-month period. Thus, the last three months of phase 2 of one planning cycle will overlap phase 1 of the next cycle, which also spans three months. The ISO will conduct phase 3, the competitive solicitation for sponsors to build and own eligible transmission facilities of the final plan, following Board approval of the comprehensive plan and in parallel with the start of phase 2 of the next annual cycle. 8 1.2.3 Phase 3 Phase 3 will take place after the approval of the plan by the ISO Board, if projects eligible for competitive solicitation were approved by the Board in the draft plan at the end of phase 2. Projects eligible for competitive solicitation are reliability-driven, category 1 policy-driven or economic-driven elements, excluding projects that are modifications to existing facilities or local transmission facilities. 9 If transmission solutions eligible for competitive solicitation are identified in phase 2 and approved, phase 3 will start with the ISO opening a project submission window for the entities who propose to sponsor the facilities. The ISO will then evaluate the proposals and, if there are 7 Under existing tariff provisions, ISO management can approve transmission projects with capital costs equal to or less than $50 million. Such projects are included in the comprehensive plan as pre-approved by ISO management and not requiring further Board approval. 8 These details are set forth in the BPM for Transmission Planning. 9 The description of transmission solutions eligible for the competitive solicitation process was modified as part of the ISO’s initial Order 1000 compliance filing. It was accepted by FERC in an April 18, 2013 order and became effective on October 1, 2013 as part of the 2013-2014 transmission planning process. Further tariff modifications were submitted on August 20, 2013 in response to the April 18, 2013 order and a final ruling March 20, 2014. California ISO/MID 23 2014-2015 ISO Transmission Plan February 2, 2015 multiple qualified project sponsors seeking to finance, build and own the same facilities, the ISO will select the project sponsor by conducting a comparative evaluation using tariff selection criteria. Single proposed project sponsors who meet the qualification criteria can move forward to project permitting and siting. California ISO/MID 24 2014-2015 ISO Transmission Plan February 2, 2015 1.3 Interrelated Processes and initiatives The transmission planning process is influenced by a number of other evolving processes. Further documentation of those processes and initiatives can be found on the ISO website. They are briefly summarized below, with an emphasis on their relationship to the current transmission planning cycle. Generator Interconnection and Deliverability Allocation Procedures (GIDAP) In July 2012 the ISO received FERC approval for the GIDAP, which represented a major revision to the existing generator interconnection procedures to better integrate those procedures with the transmission planning process. The GIDAP has been applied to cluster 5 in March 2012 and all subsequent queue clusters. Interconnection requests submitted into cluster 4 and earlier with continue to be subject to the provisions of the prior generation interconnection process (GIP). The principal objective of the GIDAP was to ensure that going forward all major transmission additions and upgrades to be paid for by transmission ratepayers would be identified and approved under a single comprehensive process — the transmission planning process — rather than some projects coming through the transmission planning process and others through the GIP. The most significant implication for the transmission planning process at this time relates to the planning of policy-driven transmission focused on achieving the state’s 33 percent renewables portfolio standard, which has been the dominant factor in policy driven transmission. In that context, the ISO plans the necessary transmission upgrades that the renewable generation forecast in the base renewable portfolio scenario provided by the CPUC is deliverable unless specifically noted otherwise. Through the GIDAP, the ISO then allocates the resulting MW volumes of transmission plan deliverability to those proposed generating facilities in each area that are determined to be most viable based on a set of project development milestones specified in the tariff. Interconnection customers proposing generating facilities that are not allocated transmission plan deliverability but still want to build their projects and obtain deliverability status would be responsible for funding their needed delivery network upgrades at their own expense without being eligible for cash reimbursement from ratepayers. Transmission Plan Deliverability As set out in Appendix DD (GIDAP) of the ISO tariff, the available transmission plan deliverability is calculated in each year’s transmission planning process in areas where the amount of generation in the interconnection queue is greater than the available deliverability, as identified in the generator interconnection cluster studies. In areas where the amount of generation in the interconnection queue is less than the available deliverability, the Transmission Plan Deliverability (TPD) is sufficient. In this year’s transmission planning process, the ISO’s generator interconnection queue was considered up to and including queue cluster 7. California ISO/MID 25 2014-2015 ISO Transmission Plan February 2, 2015 Distributed Generation (DG) Deliverability The ISO’s streamlined, annual process for providing resource adequacy (RA) deliverability status to distributed generation (DG) resources from transmission capacity was developed in 2012 and implemented in 2013, and the ISO completed the first cycle of the new process in 2013 in time to qualify additional distributed generation resources to provide RA capacity for the 2014 RA compliance year. The ISO annually performs two sequential steps. The first step is a deliverability study, which is performed within the context of the transmission planning process, to determine nodal MW quantities of deliverability status that can be assigned to DG resources. The second step is an apportionment of these quantities to utility distribution companies — including both the investorowned and publicly-owned distribution utilities within the ISO controlled grid — who then assign deliverability status, in accordance with ISO tariff provisions, to eligible distributed generation resources interconnected or in the process of interconnecting to their distribution facilities. In the first step, the transmission planning process performs a DG deliverability study to identify available transmission capacity at specific grid nodes to support deliverability status for distributed generation resources without requiring any additional delivery network upgrades to the ISO controlled grid and without adversely affecting the deliverability status of existing generation resources or proposed generation in the interconnection queue. In constructing the network model for use in the DG deliverability study, the ISO models the existing transmission system plus new additions and upgrades that have been approved in prior transmission planning process cycles, plus existing generation and certain new generation in the interconnection queue and associated upgrades. The DG deliverability study uses the nodal DG quantities that were specified in the base case resource portfolio that was adopted in the latest transmission planning process cycle for identifying public policy-driven transmission needs, both as a minimal target level for assessing DG deliverability at each network node and as a maximum amount that can be used by distribution utilities for assigning deliverability status to generators in the current cycle. This ensures that the DG deliverability assessment is aligned with the public policy objectives addressed in the current transmission planning process cycle and precludes the possibility of apportioning more DG deliverability in each cycle than was assumed in the base case resource portfolio used in the transmission planning process. In the second step, the ISO specifies how much of the identified DG deliverability at each node is available to the utility distribution companies that operate distribution facilities and interconnect distributed generation resources below that node. FERC’s November 2012 order stipulated that FERC-jurisdictional entities must assign deliverability status to DG resources on a first-come, first-served basis, in accordance with the relevant interconnection queue. In compliance with this requirement, the ISO tariff specifies the process whereby investor-owned utility distribution companies must establish the first-come, first-served sequence for assigning deliverability status to eligible distributed generation resources. Although this new DG deliverability process is performed as part of and in alignment with the annual transmission planning process cycle, its only direct impact on the transmission planning process is the addition of the DG deliverability study to be performed in the latter part of Phase 2 of the transmission planning process. California ISO/MID 26 2014-2015 ISO Transmission Plan February 2, 2015 FERC Order No. 1000 The FERC issued its final rule in July 2011 on Order No. 1000. 10 Order No. 1000 adopted reforms to the electric transmission planning and cost allocation requirements for public utility transmission providers that were established through Order No. 890 The additional reforms required by Order No. 1000 affected the ISO’s existing regional process as well as directing the ISO to collaborate with neighboring transmission utility providers and planning regions across the Western Interconnection to develop a coordinated process for considering interregional projects. These regional and interregional reforms were designed to work together to ensure an opportunity for more transmission projects to be considered in transmission planning processes on an open and non-discriminatory basis both within planning regions and across multiple planning regions. Regional Tariff The ISO’s tariff complies with the regional tariff requirements of FERC Order No.1000, following the ISO’s last supplemental compliance filing of August 20, 2013. While the ISO’s original tariff was largely compliant with the tariff, adjustments were necessary to fully align with the order in a number of areas. These adjustments have been put in place and implemented. Interregional Tariff Since 2013, the ISO has collaborated with three neighboring planning regions — WestConnect, ColumbiaGrid and Northern Tier Transmission Group (NTTG) — to develop a single set of common policies and procedures for all four planning regions. The ISO, along with transmission utility providers belonging to NTTG and WestConnect jointly submitted on May 10, 2013 their Order No. 1000 interregional compliance filings. The ColumbiaGrid transmission utility providers submitted their joint tariff language in June 2013. The ISO considers these filings to be a significant achievement by all four planning regions and a reflection of their commitment to work towards a successful and robust interregional planning process under Order No. 1000. A FERC order on these initial filings was issued on December 18, 2014, largely adopting the filings with an effective date of October 1, 2015. The ISO is required to file a second compliance filing relating to certain details of benefit assessments to be used in interregional cost allocation processes. The ISO and its neighbors are continuing to explore coordination efforts to the extent they are achievable until the tariff provisions take effect. The ISO’s participation in a public interregional planning coordination meeting along with ColumbiaGrid, Northern Tier Transmission Group, and WestConnect at the ISO facilities in the spring of 2014 referred to in section 1.2 was the most visible of these steps. Renewable Integration Operational Studies The ISO conducts a range of studies to support the integration of renewable generation that includes planning for renewable generation portfolios (chapter 4), generation interconnection process studies conducted outside of the transmission planning process but now more strongly 10 Transmission Planning and Cost Allocation by Transmission Owning and Operating Public Utilities.*** citation California ISO/MID 27 2014-2015 ISO Transmission Plan February 2, 2015 coordinated with the transmission planning process, and renewable integration operational studies that have also been conducted outside of the transmission planning process. Renewable integration operational studies have focused in particular on the need for flexible resource capabilities. In the CPUC 2010-2011 Long-term Procurement Plan (LTPP) proceeding, docket R.10-05-006, the ISO completed an initial study of renewable integration requirements under a range of future scenarios. This work identified in the trajectory scenario up to 4,600 MW of additional flexible resource capacity could be required beyond the projected existing fleet in 2020 after factoring in approved new generation and once through cooling retirements, but not taking into account local capacity requirements in transmission constrained areas. In this transmission plan, the ISO has taken a first step in furthering the understanding of the implications of significant displacement of conventional generation with renewable resources that do not have the same inherent frequency response capabilities. The objectives of the preliminary study set out in chapter 3 were to assess the potential risk of overgeneration conditions in the 2020 timeframe under 33 percent RPS, evaluate the ISO’s frequency response during light load conditions and high renewable production, assess factors affecting frequency response, validate the system and equipment models used in the study, and evaluate mitigation measures for operating conditions during which the ISO’s frequency response obligation (FRO) under NERC standards couldn’t be met. Non-Transmission Alternatives and Preferred Resources Building on efforts in past planning cycles, the ISO is continuing to make material strides in facilitating use of preferred resources to meet local transmission system needs. The ISO issued a paper 11 on September 4, 2013, as part of the 2013-2014 transmission planning cycle in which it presented a methodology to support California’s policy emphasis on the use of preferred resources 12 — energy efficiency, demand response, renewable generating resources and energy storage — by considering how such resources can constitute nonconventional solutions to meet local area needs that otherwise would require new transmission or conventional generation infrastructure. In addition to developing a methodology to be applied annually in each transmission planning cycle, the paper also described how the ISO would apply the proposed methodology in future transmission planning cycles. While the ISO Board of Governors cannot “approve” non-transmission solutions, these solutions can be identified as the preferred solution to transmission projects and the ISO can work with the appropriate state agencies to support their development. This is particularly viable in areas where the transmission solution would not need to be implemented immediately — where time can be set aside to explore the viability of non-conventional alternatives first and relying on the transmission alternative as a backstop. 11 http://www.caiso.com/Documents/Paper-Non-ConventionalAlternatives-20132014TransmissionPlanningProcess.pdf 12 To be precise, “preferred resources” as defined in CPUC proceedings applies more specifically to demand response and energy efficiency, with renewable generation and combined heat and power being next in the loading order. The term is used more generally here consistent with the more general use of the resources sought ahead of conventional generation. California ISO/MID 28 2014-2015 ISO Transmission Plan February 2, 2015 Specific area analysis: Since the development of the 2014-2015 study plan, the ISO has reviewed the existing methodology, and concluded that further subjective refinement of the generic suite of preferred resources forming the basis of the methodology would not be practical or effective until more detailed information is available about the types of preferred resource options being brought forward in the existing procurement processes. Instead, efforts were focused on testing the resources provided by the market into the utility procurement processes for preferred resources. Broader programmatic approach: Also, the ISO is exploring other methods to examine benefits in other geographic areas in this transmission planning process. This will also rely on the preferred resources proposed as alternatives in the request window and other stakeholder comment opportunities in the transmission planning processes. The experience to date has highlighted the broader range of issues that need to be considered in applying preferred resources — especially use-limited resources such as energy storage and demand response — to provide effective alternatives to conventional solutions. These include, for example, consideration of the various uses preferred resources may be put to, and to what extent, if any, those uses conflict with the preferred resources also functioning as a local capacity resource. They also include considering the term of preferred resources if called upon to defer, but not replace the need for conventional alternatives and the framework that should be applied in considering the value of the deferral versus any ongoing obligations to continue to maintain the preferred resources. High potential areas: Each year’s transmission plan identifies areas where reinforcement may be necessary in the future but the reasonable timelines to develop conventional alternatives do not require immediate action. The ISO expects that developers interested in this approach have been reviewing those areas and highlighting potential benefits of preferred resource proposals in their submissions into utilities’ procurement processes. Energy storage: In addition to considering energy storage as part of the overall preferred resource umbrella in transmission planning, the ISO is engaged in a number of parallel activities to assist energy storage development overall that include refining the generator interconnection process to better address the needs of energy storage developers. They also include actively supporting the development of an energy storage roadmap in concert with state energy agencies to identify and set out a framework to guide the way for storage to play a greater role in meeting state energy challenges. Demand response: The ISO continues to support integrating demand response, which includes the bifurcation and clarification of the various programs as either supply side resources or load-modifying resources. These activities, such as participating in the CPUC’s demand response related California ISO/MID 29 2014-2015 ISO Transmission Plan February 2, 2015 proceedings, support identification of the necessary operating characteristics so that the demand response role in meeting transmission system increases as design and implementation issues are addressed. Critical Energy Infrastructure Information (CEII) The ISO protects CEII as set out in the ISO’s tariff. 13 Release of this information also follows tariff requirements. In the course of previous transmission planning cycles, we determined that — out of an abundance of caution on this sensitive area — additional measures should be taken to protect CEII information. Accordingly, the ISO has placed more sensitive detailed discussions of system needs into appendices that are not released through the ISO’s public website. Rather, this information can be accessed through the ISO’s market participant portal after the appropriate nondisclosure agreements are in place. Southern California Reliability Assessment and Renewable Generation in Imperial area The reliability needs in Southern California — the LA Basin and San Diego areas in particular — and the complex interrelationship with deliverability of generation from the Imperial and Riverside areas have received considerable emphasis in past planning cycles. The LA Basin and San Diego area needs have largely been impacted by the retirement of the San Onofre Nuclear Generating Station generation coupled with the impacts of potential retirement of gas-fired generation in the San Diego and LA Basin areas. In keeping with the draft Preliminary Reliability Plan for LA Basin and San Diego developed by the ISO and state agency staff in 2013, forecast procurement of conventional and preferred resources and ISOapproved transmission plans have made significant strides in closing the reliability gap in the area. However, the successfully mitigating reliability concerns remains dependent on materially higher forecast levels of preferred resources than have previously been achieved. Given the uncertainty regarding all of the forecast resources materializing as planned, contingency planning is necessary. The ISO anticipates continuing to monitor the development of the various resources, and is also exploring possible mitigations in the event they are found to be necessary. Sections 2.6 and 3.3 touch on these issues. Further, consistent with the direction received from the CPUC in providing the renewable generation portfolios for study in the 2014-2015 planning cycle, the ISO has updated its analysis of deliverability available from the Imperial area, and considered the implications of achieving the “high Imperial” sensitivity, which tested an additional 1500 MW in the Imperial area above the base portfolio. As part of that analysis, the ISO concluded additional stakeholder input was necessary on a number of issues that did not align cleanly with the timing or focus of TPP stakeholder consultation opportunities. The ISO therefore conducted a separate consultation 13 CAISO tariff Section 20 addresses how the ISO shares Critical Energy Infrastructure Information (CEII) related to the transmission planning process with stakeholders who are eligible to receive such information. The tariff definition of CEII is consistent with the meaning given the term in FERC regulations at 18 C.F.R. Section 388.113, et. seq. According to the tariff, eligible stakeholders seeking access to CEII must sign a non-disclosure agreement and follow the other steps described on the CAISO website. California ISO/MID 30 2014-2015 ISO Transmission Plan February 2, 2015 effort, the “Imperial County Transmission Consultation” effort, which is discussed in section 2.6 to better inform this planning cycle. Topics included high level environmental feasibility considerations and a number of specific deliverability-related topics. This effort has also led to several topics being proposed as potential stakeholder consultation efforts in the ISO’s Stakeholder Initiatives Catalog, where they will be considered, prioritized, and advanced as appropriate within that framework. California ISO/MID 31 2014-2015 ISO Transmission Plan February 2, 2015 Intentionally left blank California ISO/MID 32 2014-2015 ISO Transmission Plan February 2, 2015 Chapter 2 2 Reliability Assessment – Methodology and Results Study Assumptions, 2.1 Overview of the ISO Reliability Assessment The ISO annual reliability assessment is a comprehensive annual study that includes the following: • power flow studies; • transient stability analysis; and • voltage stability studies. The annual reliability assessment focus is to identify facilities that demonstrate a potential of not meeting the applicable performance requirements specifically outlined in section 2.2. This study is part of the annual transmission planning process and performed in accordance with section 24 of the ISO tariff and as defined in the Business Process Manual (BPM) for the Transmission Planning Process. The Western Electricity Coordinating Council (WECC) full-loop power flow base cases provide the foundation for the study. The detailed reliability assessment results are given in Appendix B and Appendix C. 2.1.1 Backbone (500 kV and selected 230 kV) System Assessment Conventional and governor power flow and stability studies were performed for the backbone system assessment to evaluate system performance under normal conditions and following power system contingencies for voltage levels 230 kV and above. The backbone transmission system studies cover the following areas: • Northern California — Pacific Gas and Electric (PG&E) system; and • Southern California — Southern California Edison (SCE) system; and San Diego Gas and Electric (SDG&E) system. 2.1.2 Regional Area Assessments Conventional and governor power flow studies were performed for the local area nonsimultaneous assessments under normal system and contingency conditions for voltage levels 60 kV through 230 kV. The regional planning areas were within the PG&E, SCE, SDG&E, and Valley Electric Association (VEA) service territories and are listed below. California ISO/MID 33 2014-2015 ISO Transmission Plan • PG&E Local Areas o o o o o o o o • February 2, 2015 Humboldt area; North Coast and North Bay areas; North Valley area; Central Valley area; Greater Bay area; Greater Fresno area; Kern Area; and Central Coast and Los Padres areas. SCE local areas o o o o o Tehachapi and Big Creek Corridor; North of Lugo area; East of Lugo area; Eastern area; and Metro area. • Valley Electric Association (VEA) area • San Diego Gas Electric (SDG&E) local area California ISO/MID 34 2014-2015 ISO Transmission Plan February 2, 2015 2.2 Reliability Standards Compliance Criteria The 2014-2015 transmission plan spans a 10-year planning horizon and was conducted to ensure the ISO-controlled-grid is in compliance with the North American Electric Reliability Corporation (NERC) standards, Western Electricity Coordinating Council (WECC) regional criteria, and ISO planning standards across the 2015-2024 planning horizon. Sections 2.2.1 through 2.2.4 below describe how these planning standards were applied for the 2014-2015 study. 2.2.1 NERC Reliability Standards 2.2.1.1 System Performance Reliability Standards (TPL-001 to TPL-004) The ISO analyzed the need for transmission upgrades and additions in accordance with NERC reliability standards, which provide criteria for system performance requirements that must be met under a varied but specific set of operating conditions. The following TPL NERC reliability standards are applicable to the ISO as a registered NERC planning authority and are the primary drivers determining reliability upgrade needs: • • • • TPL-001 — System Performance Under Normal Conditions (Category A); TPL-002 — System Performance Following Loss of a Single Bulk Electric System (BES) Element (Category B); TPL-003 — System Performance Following Loss of Two or More BES Elements (Category C); and TPL-004 — System Performance Following Extreme BES Events (Category D). 14 2.2.2 WECC Regional Criteria The WECC TPL system performance criteria are applicable to the ISO as a planning authority and sets forth additional requirements that must be met under a varied but specific set of operating conditions. 15 2.2.3 California ISO Planning Standards The California ISO Planning Standards specify the grid planning criteria to be used in the planning of ISO transmission facilities. 16 These standards cover the following: • • • address specifics not covered in the NERC reliability standards and WECC regional criteria; provide interpretations of the NERC reliability standards and WECC regional criteria specific to the ISO-controlled grid; and identify whether specific criteria should be adopted that are more stringent than the NERC standards or WECC regional criteria. 14 Analysis of TPL-004 Extreme Events (Category D) or NUC-001 are not included within the Transmission Plan unless these requirements drive the need for mitigation plans to be developed. 15 http://compliance.wecc.biz/application/ContentPageView.aspx?ContentId=71 16 http://www.caiso.com/Documents/TransmissionPlanningStandards.pdf California ISO/MID 35 2014-2015 ISO Transmission Plan February 2, 2015 2.3 Study Methodology and Assumptions The following sections summarize the study methodology and assumptions used for the reliability assessment. 2.3.1 Study Methodology As noted earlier, the backbone and regional planning region assessments were performed using conventional analysis tools and widely accepted generation dispatch approaches. These methodology components are briefly described below. 2.3.1.1 Generation Dispatch All generating units in the area under study were dispatched at or close to their maximum power (MW) generating levels. Qualifying facilities (QFs) and self-generating units were modeled based on their historical generating output levels. 2.3.1.2 Power Flow Contingency Analysis Conventional and governor power flow contingency analyses were performed on all backbone and regional planning areas consistent with NERC TPL-001 through TPL-004, WECC regional criteria and ISO planning standards as outlined in section 2.2. Transmission line and transformer bank ratings in the power flow cases were updated to reflect the rating of the most limiting component or element. All power system equipment ratings were consistent with information in the ISO Transmission Register. Based on historical forced outage rates of combined cycle power plants on the ISO-controlled grid, the G-1 contingencies of these generating facilities were classified as an outage of the whole power plant, which could include multiple units. An example of such a power generating facility is the Delta Energy Center, which is composed of three combustion turbines and a single steam turbine. 2.3.1.3 Transient Stability Analyses Transient stability simulations were performed as part of the backbone system assessment to ensure system stability and positive dampening of system oscillations for critical contingencies. This ensured that the transient stability criteria for performance levels B and C as shown in were met. California ISO/MID 36 2014-2015 ISO Transmission Plan February 2, 2015 Table 2.3-1: WECC transient stability criteria 17 Performance Level Disturbance B Generator Transient Voltage Dip Standard One Circuit Not to exceed 25% at load buses or 30% at non-load buses. One Transformer Not to exceed 20% for more than 20 cycles at load buses. Minimum Transient Frequency Standard Not below 59.6 Hz for 6 cycles or more at a load bus. PDCI C Two Generators Not to exceed 30% at any bus. Two Circuits Not to exceed 20% for more than 40 cycles at load buses. Not below 59.0 Hz for 6 cycles or more at a load bus. IPP DC 2.3.2 Preferred Resources Methodology The ISO issued a paper on September 4, 2013, in which it presented a methodology to support California’s policy emphasis on the use of preferred resources – specifically energy efficiency, demand response, renewable generating resources and energy storage – by considering how such resources can constitute non-conventional solutions to meet local area needs that otherwise would require new transmission or conventional generation infrastructure. The general application for this methodology is in grid area situations where a non-conventional alternative such as demand response or some mix of preferred resources could be selected as the preferred solution in the ISO’s transmission plan as an alternative to the conventional transmission or generation solution. In the 2013-2014 planning cycle as well as in the current planning cycle, the ISO applied a variation of this new approach in the LA Basin and San Diego areas to continue to evaluate the effectiveness of preferred resource scenarios developed by SCE as part of the procurement process to fill the authorized local capacity for the LA Basin and Moor Park areas. In addition to the above efforts focused on the overall LA Basin and San Diego needs, the ISO also continued integrating preferred resources into its reliability analysis focusing on other areas where reliability issues were identified. The reliability assessments considered a range of existing demand response amounts as potential mitigations to transmission constraints. The 17 www.wecc.biz/Reliability/TPL-001-WECC-CRT-2.1.pdf California ISO/MID 37 2014-2015 ISO Transmission Plan February 2, 2015 reliability studies also incorporated the incremental uncommitted energy efficiency amounts as projected by the CEC, distributed generation based on the CPUC Commercial-Interest RPS Portfolio and a mix of proxy preferred resources including energy storage based on the CPUC LTPP 2012 local capacity authorization. These incremental preferred resource amounts are in addition to the base amounts of energy efficiency, demand response and “behind the meter” distributed or self-generation embedded in the CEC load forecast. For each planning area, reliability assessments are initially performed without using preferred resources other than the additional energy efficiency and the base amounts of preferred resources that are embedded in the CEC load forecast to identify reliability concerns in the area. If reliability concerns are identified in the initial assessment, additional rounds of assessments are performed using potentially available demand response, distributed generation, energy storage to determine whether these resources are a potential solution. If preferred resources are identified as a potential mitigation, a second step - a preferred resource analysis as described in September 4, 2013 ISO paper - may then be performed, if considered necessary considering the mix of resources in the particular area, to account for the specific characteristic of each resource including diurnal variation in the case of solar DG and use or energy limitation in the case of demand response and energy storage. As noted in the analysis below, due to the relatively small number of reliability issues identified requiring mitigation, the second step described above was only conducted in the LA Basin and San Diego area continuing with previous years’ analysis. 2.3.3 Study Assumptions The study horizon and assumptions below were modeled in the 2013-2014 transmission planning analysis. 2.3.3.1 Study Horizon and Study Years The studies that comply with TPL-001, TPL-002 and TPL-003 were conducted for the near-term (2015-2019) and longer-term (2020-2024) periods as per the requirements of the reliability standards. According to the requirements under the TPL-004 standard, the studies that comply with the extreme events criteria were only conducted for the short-term scenarios (2015 -2019). Within the near- and longer-term study horizon, the ISO conducted detailed analysis on 2016, 2019 and 2024. Some additional years were identified as required for assessment in specific planning regions. 2.3.3.2 Peak Demand The ISO-controlled grid peak demand in 2014 was 45,090 MW and occurred on September 15 at 4:53 p.m. The PG&E peak demand occurred on July 25, 2014 at 4:56 p.m. with 19,616 MW. The SCE peak occurred on September 15, 2014, at 4:55 p.m. with 23,266MW and for VEA, it occurred on July 1, 2014, at 4:16 p.m. with 120 MW. Meanwhile, the peak demand for SDG&E occurred on September 16 at 3:53 p.m. with 4,895 MW. Most of the ISO-controlled grid experiences summer peaking conditions and thus was the focus in all studies. For areas that experienced highest demand in the winter season or where California ISO/MID 38 2014-2015 ISO Transmission Plan February 2, 2015 historical data indicated other conditions may require separate studies, winter peak and summer off-peak studies were also performed. Examples of such areas are Humboldt, Greater Fresno and the Central Coast in the PG&E service territory. Table 2.3-2 summarizes these study areas and the corresponding peak scenarios for the reliability assessment. California ISO/MID 39 2014-2015 ISO Transmission Plan February 2, 2015 Table 2.3-2: Summary of study areas, horizon and peak scenarios for the reliability assessment Near-term Planning Horizon Study Area 2016 2019 Long-term Planning Horizon 2024 Northern California (PG&E) Bulk System* Summer Peak Summer Off-Peak Summer Peak Summer Light Load Spring Peak Summer Peak Summer Off-Peak Humboldt Summer Peak Winter Peak Summer Off-Peak Summer Peak Winter Peak Summer Light Load Summer Peak Winter Peak North Coast and North Bay Summer Peak Winter Peak Summer Off-Peak Summer Peak Winter Peak Summer Light Load Summer Peak Winter Peak North Valley Summer Peak Summer Off-Peak Summer Peak Summer Light Load Summer Peak Spring Peak Central Valley Stockton) (Sacramento, Sierra, Summer Peak Summer Off-Peak Summer Peak Summer Light Load Summer Peak Spring Peak Greater Bay Area Summer Peak Winter Peak - (SF & Peninsula) Summer Off-Peak Summer Peak Winter Peak - (SF & Peninsula) Summer Light Load Summer Peak Winter Peak - (SF Only) Greater Fresno Summer Peak Summer Off-Peak Summer Peak Summer Light Load Summer Peak Kern Summer Peak Summer Off-Peak Summer Peak Summer Light Load Summer Peak Central Coast & Los Padres Summer Peak Winter Peak Summer Off-Peak Summer Peak Winter Peak Summer Light Load Summer Peak Winter Peak Summer Peak Summer Off-Peak Summer Peak Summer Light Load Summer Peak Fall Peak Southern California Edison (SCE) area Summer Peak Summer Off-Peak Summer Peak Summer Light Load Summer Peak San Diego Gas and Electric (SDG&E) area Summer Peak Summer Off-Peak Summer Peak Summer Light Load Summer Peak Valley Electric Association Summer Peak Summer Off-Peak Summer Peak Summer Light Load Summer Peak Southern system California California ISO/MID bulk transmission 40 2014-2015 ISO Transmission Plan Note: February 2, 2015 Peak load conditions are the peak load in the area of study. Off-peak load conditions are approximately 50-65 percent of peak loading conditions, such as weekends. Light load conditions are the system minimum load condition. Partial peak load condition represents a critical system condition in the region based upon loading, dispatch and facilities rating conditions. 2.3.3.3 Stressed Import Path Flows The ISO balancing authority interacts with neighboring balancing authorities through interconnections over which power can be imported to or exported from the ISO area. The power that flows across these import paths are an important consideration in developing the study base cases. For the 2013-2014 planning study, and consistent with operating conditions for a stressed system, high import path flows were modeled to serve the ISO’s BAA load. These import paths are discussed in more detail in section 2.3.2.10. 2.3.3.4 Contingencies In addition to studying the system under TPL-001 (normal operating conditions), the following provides additional detail on how the TPL-002, TPL-003 and TPL-004 standards were evaluated. Loss of a single bulk electric system element (BES) (TPL-002 — Category B) The assessment considers all possible Category B contingencies based upon the following: • loss of one generator (B1); • loss of one transformer (B2); • loss of one transmission line (B3); • loss of a single pole of DC lines (B4); • loss of the selected one generator and one transmission line (G-1/L-1), where G-1 represents the most critical generating outage for the evaluated area; and • loss of both poles of a Pacific DC Intertie. Loss of two or more BES elements (TPL-003 — Category C) The assessment considers the Category C contingencies with the loss of two or more BES elements which produce the more severe system results or impacts based on the following: • breaker and bus section outages (C1 and C2); • combination of two element outages with system adjustment after the first outage (C3); • loss of both poles of DC lines (C4); • all double circuit tower line outages (C5); • stuck breaker with a Category B outage (C6 thru C9); and • loss of two adjacent transmission circuits on separate towers. Extreme contingencies (TPL-004 — Category D) The assessment considers the Category D contingencies of extreme events which produce the more severe system results or impact as a minimum based on the following: • loss of 2 nuclear units; California ISO/MID 41 2014-2015 ISO Transmission Plan February 2, 2015 • loss of all generating units at a station; • loss of all transmission lines on a common right-of-way; • loss of substation (One voltage level plus transformers); and • certain combinations of one element out followed by double circuit tower line outages. The ISO considers contingencies of transmission facilities in adjacent system in the reliability assessments and are included in the contingency files posted on the ISO transmission planning market participant portal. The ISO also has identified in Appendix H contingencies on the ISO system that may impact adjacent systems for them to consider in the reliability assessments of their systems. 2.3.3.5 Generation Projects In addition to generators that are already in-service, new generators were modeled in the studies depending on the status of each project. The RPS portfolios provided to the ISO by the CPUC and CEC 18 were utilized in developing the base cases. For the reliability assessment the commercial interest portfolio was used. Generation Retirements: Existing generators that have been identified as retiring are listed in table A2-1 of Appendix A. These generators along with their step-up transformer banks are modeled as out of service starting in the year they are assumed to be retired. In addition to the identified generators the following assumptions were made for the retirement of generation facilities. • Nuclear Retirements –Diablo Canyon was modeled on-line and was assumed to have obtained renewal of licenses to continue operation, • Once Through Cooled Retirements – As identified below. • Renewable and Hydro Retirements – Assumed these resource types stay online unless there is an announced retirement date. • Other Retirements – Unless otherwise noted, assumed retirement based resource age of 40 years or more. OTC Generation: Modeling of the once-through cooled (OTC) generating units followed the compliance schedule from the SWRCB’s Policy on OTC plants with the following exception: • base-load Diablo Canyon Power Plant (DCPP) nuclear generation units were modeled on-line; • generating units that are repowered, replaced or having firm plans to connect to acceptable cooling technology; and • all other OTC generating units were modeled off-line beyond their compliance dates. OTC replacement local capacity amounts in southern California that were authorized by the CPUC under the LTTP Track-1 were included. The additional, post-SONGS local capacity amounts proposed or authorized under the CPUC LTTP Track-4 were included in the studies. 18 http://www.caiso.com/Documents/2014-2015RenewablePortfoliosTransmittalLetter.pdf California ISO/MID 42 2014-2015 ISO Transmission Plan February 2, 2015 2.3.3.6 Transmission Projects The study included all existing transmission in service and the expected future projects that have been approved by the ISO but are not yet in service. Refer to tables 7.1.1 and 7.1.2 of chapter 7 (Transmission Project Updates) for the list of projects that were modeled in the base cases but that are not yet in service. Also included in the study cases were generation interconnection related transmission projects that were included in executed generator interconnection agreements (LGIA) for generation projects included in the base case. 2.3.3.7 Load Forecast The assessment used the California Energy Demand Forecast 2014-2024 released by California Energy Commission (CEC) dated January 2014 (posted January 10, 2014) using the Mid Case LSE and Balancing Authority Forecast spreadsheet of February 8, 2014. During 2013, the CEC, CPUC and ISO engaged in collaborative discussion on how to consistently account for reduced energy demand from energy efficiency in these planning and procurement processes. To that end, the 2013 Integrated Energy Policy Report (IEPR) final report, published on January 23, 2014, recommends using the Mid Additional Achievable Energy Efficiency (AAEE) scenario for system‐wide and flexibility studies for the CPUC 2014 LTPP and ISO 2014-15 TPP cycles. Because of the local nature of reliability needs and the difficulty of forecasting load and AAEE at specific locations and estimating their daily load‐shape impacts, using the Low-Mid AAEE scenario for local studies is more prudent at this time. The 1-in-10 load forecasts were modeled in each of the local area studies. The 1-in-5 coincident peak load forecasts were used for the backbone system assessments as it covers a vast geographical area with significant temperature diversity. More details of the demand forecast are provided in the discussion sections of each of the study areas. Light Load and Off-Peak Conditions The assessment evaluated the light load and off-peak conditions in all study areas of the ISO balancing authority to satisfy NERC compliance requirement 1.3.6 for TPL-001, TPL-002 and TPL-003. The ISO light load conditions represented the system minimum load conditions while the off-peak load conditions ranged from 50 percent to 70 percent of the peak load in that area, such as weekends. Critical system conditions in specific study areas can occur during partial peak periods because of loading, generation dispatch and facility rating status and were studied accordingly. 2.3.3.8 Reactive Power Resources Existing and new reactive power resources were modeled in the study base cases to ensure realistic voltage support capability. These resources include generators, capacitors, static var compensators (SVC) and other devices. Refer to area-specific study sections for a detailed list of generation plants and corresponding assumptions. Two of the key reactive power resources that were modeled in the studies include the following: • all shunt capacitors in the SCE service territory; and California ISO/MID 43 2014-2015 ISO Transmission Plan • February 2, 2015 static var compensators or static synchronous compensators at several locations such as Potrero, Newark, Humboldt, Rector, Devers and Talega substations. For a complete resources list, refer to the base cases available at the ISO Market Participant Portal secured website (https://portal.caiso.com/Pages/Default.aspx). 19 2.3.3.9 Operating Procedures Operating procedures, for both normal (pre-contingency) and emergency (post-contingency) conditions, were modeled in the studies. Please refer to http://www.caiso.com/thegrid/operations/opsdoc/index.html for the list of publicly available Operating Procedures. 2.3.3.10 Firm Transfers Power flow into and within the ISO BAA on the major power transmission paths was modeled as firm transfers. In general, the northern California (PG&E) system has two major transfer paths that wheel large amounts of power between northern California and its neighbors. These two major transfer paths are Path 66 (COI) to Oregon and Path 26 to southern California. Other major paths also have to be taken into consideration. Table 2.3-3 lists the range of power transfers that were modeled in each scenario on these paths in the northern area assessment. Negative flow in the table indicates a reversal of flow direction than indicated for the path. Path 15 flow limit is 5400 MW in the south-to-north direction. This direction of flow usually occurs under off-peak load conditions. Under peak load conditions, the flow on Path 15 is in the opposite direction. In the peak power flow cases it was modeled at lower values than its possible limit due to the generation dispatch assumptions that would be needed to achieve the north-to-south Path 15 flow limit. In the summer off-peak cases, Path 15 flow was modeled at its 5400 MW limit. Similarly the 2019 case with minimum load had lower flow on Path 15 (1330 MW) due to the generation dispatch assumptions that would be needed to achieve higher flow. Path 26 flow was modeled up to its north-to-south limit of 4000 MW in the peak load cases. Lower Path 26 flow modeled in the 2019 and 2024 cases was due to the assumption that some of the generation plants in PG&E would retire. Under the off-peak conditions, the Path 26 flow was lower or in the opposite direction. Path 66 (COI) flow was modeled at its north-to-south limit of 4800 MW in all summer peak cases. In the off-peak cases, the Path 66 flow was in the reverse direction, which did not have an impact on the ISO because the limiting facilities and limiting contingencies when the flow on Path 66 is from south to north are in the Northwest. In the winter peak cases, the flow on Path 66 was lower than in the summer peak due to the lower ISO load and thus less need for the imported power from the Northwest. 19 This site is available to market participants who have submitted a non-disclosure agreement (NDA) and is approved to access the portal by the ISO. For instructions, go to http://www.caiso.com/Documents/Regional%20transmission%20NDA. California ISO/MID 44 2014-2015 ISO Transmission Plan February 2, 2015 Table 2.3-3: Major paths and power transfer ranges in the Northern California assessment 20 Path Transfer Capability/SOL Scenario in which Path will be stressed (MW) Path 26 (N-S) 4000 PDCI (N-S) 3100 Path 66 (N-S) 4800 Path 15 (N-S) -5400 Summer Peak Summer Off Peak Path 26 (N-S) -3000 Path 66 (N-S) -3675 Winter Peak Table 2.3-4 lists the major paths in southern California and the study cases in which the paths were stressed to or close to their respective Transfer Capability in the southern California assessment. Table 2.3-4: Major Path flow ranges in southern area (SCE and SDG&E system) assessment Path Transfer Capability/SOL Scenario in which Path will be stressed (MW) Path 26 (N-S) 4000 PDCI (N-S) 3100 Summer Peak West of River (WOR) 11,200 Summer Off Peak East of River (EOR) 9,600 Summer Off Peak San Diego Import 2850 Summer Peak 17,870 Summer Peak SCIT 20 The winter coastal base cases in PG&E service area will model Path 26 flow at 2,800 MW (N-S) and Path 66 at 3,800 MW (N-S) California ISO/MID 45 2014-2015 ISO Transmission Plan 2.3.3.11 February 2, 2015 Protection Systems To ensure reliable operation of the system, many RAS or special SPS have been installed in certain areas of the system. These protection systems drop load or generation upon detecting system overloads by strategically tripping circuit breakers under selected contingencies. Some SPS are designed to operate upon detecting unacceptable low voltage conditions caused by certain contingencies. The SPS on the system are listed in Appendix A. 2.3.3.12 Control Devices Control devices modeled in the study included key reactive resources listed in section 2.3.2.8, the Imperial Valley Flow Controller (Phase Shifting Transformer) and the direct current (DC) controls for the following lines: • Pacific Direct Current Intertie (PDCI); • Inter-Mountain power plant direct current (IPPDC); and • Trans Bay Cable project. For complete details of the control devices that were modeled in the study, refer to the base cases that are available through the ISO Market Participant Portal secured website. California ISO/MID 46 2014-2015 ISO Transmission Plan February 2, 2015 2.4 Northern California Bulk Transmission System Assessment 2.4.1 Northern California Bulk Transmission System Description The figure below provides a simplified map of the PG&E bulk transmission system. Figure 2.4-1: Map of PG&E bulk transmission system The 500 kV bulk transmission system in northern California consists of three parallel 500 kV lines that traverse the state from the California-Oregon border in the north and continue past Bakersfield in the south. This system transfers power between California and other states in the northwestern part of the United States and western Canada. The transmission system is also a gateway for accessing resources located in the sparsely populated portions of northern California, and the system typically delivers these resources to population centers in the Greater Bay Area and Central Valley. In addition, a large number of generation resources in the central California ISO/MID 47 2014-2015 ISO Transmission Plan February 2, 2015 California area are delivered over the 500 kV systems into southern California. The typical direction of power flow through Path 26 (three 500 kV lines between the Midway and Vincent substations) is from north to south during on-peak load periods and in the reverse direction during off-peak load periods. The typical direction of power flow through Path 15 (Los Banos Gates #1 and #3 500 kV lines and Los Banos-Midway #2 500 kV line) is from south to north during off-peak load periods and the flows can be either south to north or north to south under peak conditions. The typical direction of power flow through California-Oregon Intertie (COI, Path 66) and through the Pacific DC Intertie (Bi-pole DC transmission line connecting the Celilo Substation in Washington State with the Sylmar Substation in Southern California) is from north to south during summer on-peak load periods and in the reverse direction during off-peak load periods in California or winter peak periods in Pacific Northwest. Because of this bi-directional power flow pattern on the 500 kV Path 26 lines and on COI, both the summer peak (N-S) and off-peak (S-N) flow scenarios were analyzed, as well as a spring peak with high hydro generation and a minimum load scenario. Transient stability and post transient contingency analyses were also performed for all flow patterns and scenarios. 2.4.2 Study Assumptions and System Conditions The northern area bulk transmission system study was performed consistent with the general study methodology and assumptions described in section 2.3. The ISO-secured website lists the contingencies that were performed as part of this assessment. In addition, specific methodology and assumptions that are applicable to the northern area bulk transmission system study are provided in the next sections. The studies for the PG&E Bulk Transmission System analyzed the most critical conditions: summer peak cases for the years 2016, 2019 and 2024, summer light load and spring peak cases for 2019 and summer off-peak cases for 2016 and 2024. All single and common mode 500 kV system outages were studied, as well as outages of large generators and contingencies involving stuck circuit breakers and delayed clearing of singlephase-to ground faults. Also, extreme events such as contingencies that involve a loss of major substations and all transmission lines in the same corridors were studied. Generation and Path Flows The bulk transmission system studies use the same set of generation plants that are modeled in the local area studies. In this planning cycle, the scope of the study includes exploring the impacts of meeting the RPS goal in 2024 in addition to the conventional study that models new generators according to the ISO guidelines for modeling new generation interconnection projects. Therefore, an additional amount of renewable resources was modeled in the 2019 and 2024 base cases using information in the ISO large generation interconnection queue. Only those resources that are proposed to be on line in 2019 or prior to 2019 were modeled in the 2019 cases. 2016 cases modeled new generation projects that are expected to be in service in 2016 or prior to 2016. A summary of generation is provided in each of the local planning areas within the PG&E area. Because the studies analyzed the most critical conditions, the flows on interfaces connecting Northern California with the rest of the WECC system were modeled at or close to the paths’ flow limits, or as high as the generation resource assumptions allowed. Table 2.4-1 lists all California ISO/MID 48 2014-2015 ISO Transmission Plan February 2, 2015 major path flows affecting the 500 kV systems in northern California along with the hydroelectric generation dispatch percentage in the area. Table 2.4-1: Major import flows for the northern area bulk study Parameter CaliforniaOregon Intertie Flow (N-S) (MW) Pacific DC Intertie Flow (NS) (MW) Path 15 Flow (SN) (MW) Path 26 Flow (NS) (MW) Northern California Hydro % dispatch of nameplate 2016 Summer Peak 2016 Summer OffPeak 2019 Summer Peak 2019 Summer Light Load 2019 Spring Peak 2024 Summer Peak 2024 Summer OffPeak 4800 -2430 4800 450 4800 4800 -3330 3100 0 3100 2000 3100 3100 0 -1730 5400 120 1330 -1330 260 5390 3980 -1080 2400 40 1860 2050 -2100 80 27 80 13 80 80 27 Load Forecast Per the ISO planning criteria for regional transmission planning studies, the demand within the ISO area reflects a coincident peak load for 1-in-5-year forecast conditions for the summer peak cases. Loads in the off-peak case were modeled at approximately 50 percent of the 1-in-5 summer peak load level. The light load cases modeled the lowest load in the PG&E area that appears to be lower than the off-peak load. Table 2.4-2 shows the assumed load levels for selected areas under summer peak and non-peak conditions. California ISO/MID 49 2014-2015 ISO Transmission Plan February 2, 2015 Table 2.4-2: Load modeled in the northern area bulk transmission system assessment Scenario 2016 Summer Peak 2016 Summer Off-Peak 2019 Summer Peak 2019 Spring Peak 2019 Summer Light Load 2024 Summer Peak 2024 Summer Off-Peak California ISO/MID Area Load (MW) Loss (MW) Total (MW) PG&E 28,290 1,040 29,330 SDG&E 5,185 190 5,375 SCE 24,830 450 25,280 ISO 58,305 1,680 59,985 PG&E 13,680 640 14,320 SDG&E 3,570 80 3,650 SCE 13,980 250 14,230 ISO 31,230 970 32,200 PG&E 28,650 1,000 29,650 SDG&E 5,610 210 5,820 SCE 24,810 470 25,280 ISO 59,070 1,680 60,750 PG&E 22,380 940 23,320 SDG&E 3,260 95 3,355 SCE 16,420 265 16,685 ISO 42,060 1,300 43,360 PG&E 11,720 270 11,990 SDG&E 3,575 90 3,665 SCE 14,000 260 14,260 ISO 29,295 620 29,915 PG&E 29,170 980 30,150 SDG&E 6,030 255 6,285 SCE 26,030 550 26,580 ISO 61,230 1,785 63,015 PG&E 14,150 650 14,800 SDG&E 3,700 75 3,775 SCE 17,780 415 18,195 ISO 35,630 1140 36,770 50 2014-2015 ISO Transmission Plan February 2, 2015 Existing Protection Systems Extensive SPS or RAS are installed in the northern California area’s 500 kV systems to ensure reliable system performance. These systems were modeled and included in the contingency studies. A comprehensive detail of these protection systems are provided in various ISO operating procedures, engineering and design documents. 2.4.3 Assessment and Recommendations The ISO conducted a detailed planning assessment based on the study methodology identified in section 2.3 to comply with the reliability standards requirements of section 2.2. Details of the planning assessment results are presented in Appendix B. The ISO study assessment of the northern bulk system yielded the following conclusions: • One overload (Eight Mile-Lodi 230 kV line) is expected under spring peak conditions in 2019 with all facilities in service and with single or multiple contingencies. A possible solution is to use congestion management to reduce loading on the transmission line. • One transmission line (Gates-Midway 500 kV) may load close to 100 percent of its normal rating under 2024 off-peak conditions with all facilities in service. The loading may be reduced by congestion management. • Three overloads are expected under peak load conditions for Category B contingencies including the transmission line overloaded under normal conditions in the 2019 spring peak case and both circuits of the Round Mountain-Table Mountain 500 kV lines in the summer peak cases. Possible solutions are to use congestion management to reduce loading on the Eight Mile-Lodi 230 kV transmission line and to bypass series capacitors on the Round Mountain-Table Mountain 500 kV lines should they overload. • No Category B overloads are expected under off-peak and light load conditions; • A number of potential overloads for Category C contingencies were identified. o For all summer peak cases studied, five overloads were identified for Category C contingencies. One additional overload was identified for the 2016 summer peak case and another overload for the 2024 summer peak case. For the 2019 spring peak case, 13 Category C overloads were identified, including five that were identified for all peak load cases. o Under off-peak conditions a section of the Los Banos-Westley 230 kV line may overload for one Category C contingency. A possible solution is to use congestion management to address the overload. o No overloads were identified under minimum load conditions. An approved transmission project will mitigate one Category C overload that may occur under peak conditions in 2016. Upgrading terminal equipment on one substation that will be performed as a part of the transmission system maintenance will address another Category C overload. Prior to the approved transmission solutions being completed, congestion management may be used. California ISO/MID 51 2014-2015 ISO Transmission Plan February 2, 2015 The ISO-proposed solution to mitigate the identified reliability concerns are to manage COI flow according to the seasonal nomogram and to adjust the Weed Junction phase shifting transformer taps or obtain short term emergency ratings for the Delta-Cascade 115 kV line. Also, the ISO intends to further investigate potential mitigation measures to address the impact of the 500 kV double outage South of Table Mountain to determine if any system upgrades or RAS modifications could be implemented on an economic basis in future planning cycles. Such mitigations could include installing SPS to bypass series capacitors on the Round MountainTable Mountain 500 kV lines #1 and #2 to mitigate their overloads for the outage of the parallel line. The ISO will also work with CDWR to identify the settings on the protection relays on the Midway irrigation pumps and with PG&E to expedite equipment upgrade on the Rio Oso 230 kV substation. Request Window Proposals San Luis Transmission Project The following proposal was submitted in concept as a stakeholder comment. Duke-America Transmission Company, Path 15, LLC (DATCP) comments encouraged the ISO support a 500 kV Alternative to Western Area Power Administration’s (WAPA) proposed 230 kV transmission line between WAPA’s Tracy and San Luis Substations. The comments also noted that WAPA had initiated environmental review of both the 230 kV San Luis Transmission Project and a 500 kV alternative and “to approve the additional capacity (approximately 1000 MW of transfer capability between Los Banos and Tracy) created by the San Luis 500 kV Alternative.” DATC noted in its comments submitted in the 2013-2014 transmission plan that WAPA intends to move forward with the 230 kV line in lieu of paying an estimated $8 million/year for the existing use of the PG&E system commencing in 2016, once an existing 50 year contract with PG&E expires. The ISO understands that the existing service transfers about a 400 MW maximum capacity and between 400 GWh and 600 GWh a year, in the north to south direction. The ISO has participated in discussions with DATC, WAPA and Bureau of Reclamation staff. Through these discussions, the ISO understands WAPA is estimating the cost of a 230 kV line to be in the $240 million range and a 500 kV alternative in the $500 million range. Further, the ISO has been asked to consider 1200 MW being available to the ISO, as WAPA anticipate the 500 kV project providing an additional 1600 MW capacity. The ISO has also not yet had an opportunity to review studies demonstrating an increase in path capability; the studies the ISO has been provided to date are focused on determining if adding the line with no additional injections or withdrawals (as the current system is already delivering these needs) will adversely affect the existing system. The ISO has reviewed the need for additional capacity to address reliability requirements on the ISO controlled grid, and the ISO has not identified reliability requirements addressed by the San Luis Transmission Project in this 2014-2015 planning cycle analysis. Potential policy and economic benefits are addressed later in sections 4.2.1.1.1 and 5.7. California ISO/MID 52 2014-2015 ISO Transmission Plan February 2, 2015 Southwest Intertie Project (SWIP) North Transmission Project The Southwest Intertie Project (SWIP) North Transmission Project was received through the 2014 Request Window as a transmission solution to preserve the COI’s existing import capability and avoid curtailment on existing resources. In addition, the project proponents claim the SWIP North Project will provide more transmission capacity that would allow market participants to further enhance the benefits of the Energy Imbalance Market and for the ISO to access cheaper renewable resources from out-of-state. However, the ISO did not find a reliability need for this project in this planning cycle. The ISO will continue to explore in future planning cycles if there is an economic-driven alternative to reducing COI flows according to the seasonal nomogram. California ISO/MID 53 2014-2015 ISO Transmission Plan February 2, 2015 2.5 PG&E Local Areas Assessment In addition to the PG&E bulk area study, studies were performed for its eight local areas. 2.5.1 Humboldt Area 2.5.1.1 Area Description The Humboldt area covers approximately 3,000 square miles in the northwestern corner of PG&E’s service territory. Some of the larger cities that are served in this area include Eureka, Arcata, Garberville and Fortuna. The highlighted area in the adjacent figure provides an approximate geographical location of the Humboldt area. Humboldt’s electric transmission system is composed of 60 kV and 115 kV transmission facilities. Electric supply to this area is provided primarily by generation at Humboldt Bay power plant and local qualifying facilities. Additional electric supply is provided by transmission imports via two 100 mile, 115 kV circuits from the Cottonwood substation east of this area and one 80 mile 60 kV circuit from the Mendocino substation south of this area. Historically, the Humboldt area experiences its highest demand during the winter season. For the 2014-2015 transmission planning studies, a summer peak and winter peak assessment was performed. In addition, the summer off-peak condition for 2016 and the summer light load condition for 2019 assessments were also performed. For the summer peak assessment, a simultaneous area load of 173 MW in the 2019 and 195 MW in the 2024 time frames were assumed. These load levels include the Additional Achievable Energy Efficiencies (AAEE). For the winter peak assessment, a simultaneous area load of 197 MW and 211 MW in the 2019 and 2024 time frames were assumed. 2.5.1.2 Area Specific Assumptions and System Conditions The Humboldt area study was performed in accordance with the general study assumptions and methodology described in section 2.3. The ISO-secured website lists the contingencies that were evaluated as a part of this assessment. Specific assumptions and methodology applied to the Humboldt area study are provided below. Summer peak and winter peak assessments were performed for the study years 2016, 2019 and 2024. In addition, a 2016 summer off-peak condition and a 2019 summer light load condition were studied. California ISO/MID 54 2014-2015 ISO Transmission Plan February 2, 2015 Generation Generation resources in the Humboldt area consist of market, qualifying facilities and selfgenerating units. The largest resource in the area is the 166 MW Humboldt Bay Power Plant. This facility was re-powered and started commercial operation in the summer of 2010. It replaced the Humboldt power plant, which was retired in November 2010. In addition, the 12 MW Blue Lake Power Biomass Project was placed into commercial operation on August 27, 2010. Table 2.5-1 lists a summary of the generation in the Humboldt area, with detailed generation listed in Appendix A. Table 2.5-1: Humboldt area generation summary Capacity (MW) Generation Thermal 191 Hydro 5 Biomass 62 Total 258 Load Forecast Loads within the Humboldt area reflect a coincident peak load for 1-in-10-year forecast conditions in each study year. Table 2.5-2 and Table 2.5-3 summarize loads modeled in the studies for the Humboldt area. Table 2.5-2: Load forecasts modeled in Humboldt area assessment, Summer Peak 1-in-10 Year Non-Simultaneous Load Forecast Summer Peak (MW) PG&E Area Name Humboldt California ISO/MID 2016 2019 2024 165 169 186 55 2014-2015 ISO Transmission Plan February 2, 2015 Table 2.5-3: Load forecasts modeled in Humboldt area assessment, Winter Peak 1-in-10 Year Non-Simultaneous Load Forecast Winter Peak (MW) PG&E Area Name Humboldt 2016 2019 2024 194 197 211 2.5.1.3 Assessment and Recommendations The ISO conducted a detailed planning assessment based on the study methodology identified in section 2.3 to comply with the reliability standards requirements of section 2.2. Details of the planning assessment results are presented in Appendix B. The ISO study of the Humboldt area yielded the following conclusions: • no Category A thermal violations were identified; • four Category B (G-1/L-1) thermal violations were identified; • low voltages and voltage deviations may occur for Category B and Category C contingencies prior to installation of reactive support on the 60 kV substations in the Maple Creek and Garberville areas; • low voltages and large voltage deviations were identified for various Category C contingencies in the Bridgeville to Garberville 60kV corridor prior to the Bridgeville – Garberville 115kV line being placed in-service; • voltage and voltage deviation concerns were identified on several 60 kV buses in the summer and winter peak conditions for various Category B and Category C contingencies in and around the Blue Lake Power Plant, Arcata, Orick, Big Lagoon and Trinidad substations; • eight transmission facilities may become overloaded for various Category C contingencies both in summer and winter peak conditions. The identified overloads will be addressed by the following proposed solutions: • Complete the approved transmission solution of building a new Bridgeville-Garberville 115 kV transmission line. This transmission solution will address the overload on the various 60kV line sections in the Bridgeville-Mendocino 60 kV corridor that is expected under multiple Category C contingencies and solve voltage concerns in the Bridgeville area. This new 115 kV transmission line project was approved in the 2011-2012 transmission plan. • The voltage concerns in the Arcata load pocket were seen in the 7-10 year time frame, which can be mitigated either through the installation of additional reactive power resources or by reconfiguring the 60 kV lines serving the Arcata area. California ISO/MID 56 2014-2015 ISO Transmission Plan February 2, 2015 • Employ PG&E’s actions plans that include operator actions such as generation adjustments and load dropping to address the various Category C related thermal violations found in the Humboldt area. • On an interim basis, use PG&E action plans to address low voltages and voltage deviation concerns in the most northern part of Humboldt County. No capital project proposals were received from PG&E in this planning cycle for the Humboldt planning area. California ISO/MID 57 2014-2015 ISO Transmission Plan February 2, 2015 2.5.2 North Coast and North Bay Areas 2.5.2.1 Area Description The highlighted areas in the adjacent figure provide an approximate geographical location of the North Coast and North Bay areas. The North Coast area covers approximately 10,000 square miles north of the Bay Area and south of the Humboldt area along the northwest coast of California. It has a population of approximately 850,000 in Sonoma, Mendocino, Lake and a portion of Marin counties, and extends from Laytonville in the north to Petaluma in the south. The North Coast area has both coastal and interior climate regions. Some substations in the North Coast area are summer peaking and some are winter peaking. For the summer peak assessment, a simultaneous area load of 770 MW in 2019 and 771 MW in 2024 time frames was assumed. For the winter peak assessment, a simultaneous area load of 775 MW and 768 MW in the 2019 and 2024 time frames was assumed. A significant amount of North Coast generation is from geothermal (The Geysers) resources. The North Coast area is connected to the Humboldt area by the Bridgeville-Garberville-Laytonville 60 kV lines. It is connected to the North Bay by the 230 kV and 60 kV lines between Lakeville and Ignacio and to the East Bay by 230 kV lines between Lakeville and Vaca Dixon. North Bay encompasses the area just north of San Francisco. This transmission system serves Napa and portions of Marin, Solano and Sonoma counties. The larger cities served in this area include Novato, San Rafael, Vallejo and Benicia. North Bay’s electric transmission system is composed of 60 kV, 115 kV and 230 kV facilities supported by transmission facilities from the North Coast, Sacramento and the Bay Area. For the summer peak assessment, a simultaneous area load of 779 MW and 777 MW in the 2019 and 2024 time frames was assumed. For the winter peak assessment, a simultaneous area load of 878 MW and 884 MW in the 2019 and 2024 time frames was assumed. Like the North Coast, the North Bay area has both summer peaking and winter peaking substations. Accordingly, system assessments in this area include the technical studies for the scenarios under summer peak and winter peak conditions that reflect different load conditions mainly in the coastal areas. 2.5.2.2 Area-Specific Assumptions and System Conditions The North Coast and North Bay area studies were performed consistent with the general study assumptions and methodology described in section 2.3. The ISO secured website lists the contingencies that were performed as part of this assessment. Specific assumptions and methodology that were applied to the North Coast and North Bay area studies are provided below. Summer peak and winter peak assessments were done for North Coast and North Bay areas for the study years 2016, 2019 and 2024. Additionally a 2016 summer light Load condition and a 2019 summer off-peak condition were studied for the North Coast and North Bay areas. Generation California ISO/MID 58 2014-2015 ISO Transmission Plan February 2, 2015 Generation resources in the North Coast and North Bay areas consist of market, qualifying facilities and self-generating units. Table 2.5-4 lists a summary of the generation in the North Coast and North Bay area, with detailed generation listed in Appendix A. Table 2.5-4: North Coast and North Bay area generation summary Capacity (MW) Generation Thermal 54 Hydro 26 Geo Thermal 1,533 Biomass 6 Total 1,619 Load Forecast Loads within the North Coast and North Bay areas reflect a coincident peak load for 1-in-10year forecast conditions for each study year. Table 2.5-5 and table 2.5-6 summarize the substation loads assumed in the studies for North Coast and North Bay areas under summer and winter peak conditions. Table 2.5-5: Load forecasts modeled in North Coast and North Bay area assessments, Summer Peak 1-in-10 Year Non-Simultaneous Load Forecast Summer Peak (MW) PG&E Area Name 2016 2019 2024 North Coast 771 770 771 North Bay 761 779 777 California ISO/MID 59 2014-2015 ISO Transmission Plan February 2, 2015 Table 2.5-6: Load forecasts modeled in North Coast and North Bay area assessments, Winter Peak 1-in-10 Year Non-Simultaneous Load Forecast Winter Peak (MW) PG&E Area Name 2016 2019 2024 North Coast 791 775 768 North Bay 861 878 884 2.5.2.3 Assessment and Recommendations The ISO conducted a detailed planning assessment based on the study methodology identified in section 2.3 to comply with the reliability standards requirements of section 2.2. Details of the planning assessment results are presented in Appendix B. The ISO assessment of the PG&E North Coast and North Bay revealed the following reliability concerns: • No Category A thermal violations were found in this year’s analysis. • Overall there were 8 Category B and 32 Category C overloads identified in this year’s assessment. • Low voltage violations have been found in 4 local pockets for Category B conditions and in 4 local pockets for Category C conditions. • Voltage deviation concerns were identified in 2 local pockets for Category B conditions. The identified violations will be addressed as follows: • • • One Category B overload may require reconductoring a transmission line by the summer of 2023. No mitigation is recommended at this time but will be monitored in future cycles. Certain severe local low voltage and voltage deviation violations under Category C conditions, which were resulting in a voltage collapse in the Mendocino – Garberville 60 kV corridor, will need additional reactive support installed. No mitigation is recommended at this time but will be monitored in future planning cycles. The ISO will continue to work with PG&E on various mitigation alternatives as a part of the conceptual Mendocino long term study. All other Category B and Category C issues already either already have a project approved or have a PG&E operating procedure in place as mitigation. In cases where the approved projects have not yet come into service, interim operating solutions or action plans may need to be put in place as mitigation. The ISO will continue to work with PG&E in developing the interim plans as required. California ISO/MID 60 2014-2015 ISO Transmission Plan February 2, 2015 No capital project proposals were received from PG&E in this planning cycle for the Humboldt planning area. This year’s analysis shows that the previously approved projects in the North Coast and North Bay area are still needed to mitigate the identified reliability concerns. These projects include the following: • Ignacio - Alto 60 kV Line Voltage Conversion Project; • Clear Lake 60kV system reinforcement project; • Napa - Tulucay No. 1 60 kV Line Upgrade; • Tulucay No. 1 230-60 kV Transformer Capacity Increase; • Geyser #3 - Cloverdale 115 kV Line Switch Upgrade; and, • Big River SVC. California ISO/MID 61 2014-2015 ISO Transmission Plan February 2, 2015 2.5.3 North Valley Area 2.5.3.1 Area Description The North Valley area is located in the northeastern corner of the PG&E’s service area and covers approximately 15,000 square miles. This area includes the northern end of the Sacramento Valley as well as parts of the Siskiyou and Sierra mountain ranges and the foothills. Chico, Redding, Red Bluff and Paradise are some of the cities in this area. The adjacent figure depicts the approximate geographical location of the North Valley area. North Valley’s electric transmission system is composed of 60 kV, 115 kV, 230 kV and 500 kV transmission facilities. The 500 kV facilities are part of the Pacific Intertie between California and the Pacific Northwest. The 230 kV facilities, which complement the Pacific Intertie, also run north to south with connections to hydroelectric generation facilities. The 115 kV and 60 kV facilities serve local electricity demand. In addition to the Pacific Intertie, one other external interconnection exists connecting to the PacifiCorp system. The internal transmission system connections to the Humboldt and Sierra areas are via the Cottonwood, Table Mountain, Palermo and Rio Oso substations. Historically, North Valley experiences its highest demand during the summer season; however, a few small areas in the mountains experience highest demand during the winter season. Load forecasts indicate North Valley should reach a summer peak demand of 1038 MW by 2024, assuming load is increasing at approximately 7.8 MW per year. Accordingly, system assessments in this area included technical studies using load assumptions for these summer peak conditions. Table 2.5.3–2 includes load forecast data. 2.5.3.2 Area-Specific Assumptions and System Conditions The North Valley area study was performed consistent with the general study methodology and assumptions described in section 2.3. The ISO secured Market Participant Portal lists the contingencies that were performed as part of this assessment. Additionally, specific methodology and assumptions that are applicable to the North Valley area study are provided below. Generation Generation resources in the North Valley area consist of market, qualifying facilities and selfgenerating units. More than 2,000 MW of hydroelectric generation is located in this area. These facilities are fed from the following river systems: Pit River, Battle Creek, Cow Creek, North Feather River, South Feather River, West Feather River and Black Butt. Some of the large powerhouses on the Pit River and the Feather River watersheds are the following: Pit, James Black, Caribou, Rock Creek, Cresta, Butt Valley, Belden, Poe and Bucks Creek. The largest generation facility in the area is the natural gas-fired Colusa County generation plant, which has a total capacity of 717 MW and it is interconnected to the four Cottonwood-Vaca Dixon 230 kV California ISO/MID 62 2014-2015 ISO Transmission Plan February 2, 2015 lines. Table 2.5-7 lists a summary of the generation in the North Valley area with detailed generation listed in Appendix A. Table 2.5-7: North Valley area generation summary Capacity (MW) Generation Thermal 1,070 Hydro 1,670 Wind 103 Total 2,843 Load Forecast Loads within the North Valley area reflect a coincident peak load for 1-in-10-year forecast conditions for each peak study scenario. Table 2.5-8 shows loads modeled for the North Valley area assessment. Table 2.5-8: Load forecasts modeled in the North Valley area assessment 1-in-10 Year Non-Simultaneous Load Forecast Summer Peak (MW) PG&E Area Name North Valley 2016 2019 2024 937 970 1038 2.5.3.3 Assessment and Recommendations The ISO conducted a detailed planning assessment based on the study methodology identified in section 2.3 to comply with the Reliability Standard requirements of section 2.2. Details of the planning assessment results are presented in Appendix B. The 2014 reliability assessment of the PG&E North Valley area identified several reliability concerns including thermal overloads and low voltages under Category A, B and C contingencies. The 2014 reliability assessment of the PG&E North Valley area revealed several reliability concerns. These concerns consist of thermal overloads and low voltages under, Category A, B and C contingencies. • One facility was identified with thermal overloads for Category A performance requirements. California ISO/MID 63 2014-2015 ISO Transmission Plan February 2, 2015 • One facility was identified with thermal overloads for Category B performance requirements. Four facilities were identified with low voltage concerns and 15 facilities were identified with high voltage deviations. • Twenty-one facilities were identified with thermal overloads for Category C performance requirements. Studies also showed 27 facilities with voltage concerns, and seven facilities with high voltage deviation concerns. The reliability issues identified in this assessment are very similar to those found in last year’s assessment. Previously approved projects within the area address the identified reliability concerns. In addition, current PG&E action plans will be used and the ISO will continue to monitor the issues in future planning cycles. California ISO/MID 64 2014-2015 ISO Transmission Plan February 2, 2015 2.5.4 Central Valley Area 2.5.4.1 Area Description The Central Valley area is located in the eastern part of PG&E’s service territory. This area includes the central part of the Sacramento Valley and it is composed of the Sacramento, Sierra, Stockton and Stanislaus divisions as shown in the figure below. The Sacramento division covers approximately 4,000 square miles of the Sacramento Valley, but excludes the service territory of the Sacramento Municipal Utility District and Roseville Electric. Cordelia, Suisun, Vacaville, West Sacramento, Woodland and Davis are some of the cities in this area. The electric transmission system is composed of 60 kV, 115 kV, 230 kV and 500 kV transmission facilities. Two sets of 230 and 500 kV transmission paths make up the backbone of the system. The Sierra division is located in the Sierra-Nevada area of California. Yuba City, Marysville, Lincoln, Rocklin, El Dorado Hills and Placerville are some of the major cities located within this area. Sierra’s electric transmission system is composed of 60 kV, 115 kV and 230 kV transmission facilities. The 60 kV facilities are spread throughout the Sierra system and serve many distribution substations. The 115 kV and 230 kV facilities transmit generation resources from north to south. Generation units located within the Sierra area are primarily hydroelectric facilities located on the Yuba and American River water systems. Transmission interconnections to the Sierra transmission system are from Sacramento, Stockton, North Valley, and the Sierra Pacific Power Company (SPP) in the state of Nevada (Path 24). Stockton division is located east of the Bay Area. Electricity demand in this area is concentrated around the cities of Stockton and Lodi. The transmission system is composed of 60 kV, 115 kV and 230 kV facilities. The 60 kV transmission network serves downtown Stockton and the City of Lodi. Lodi is a member of the Northern California Power Agency (NCPA), and it is the largest city that is served by the 60 kV transmission network. The 115 kV and 230 kV facilities support the 60 kV transmission network. Stanislaus division is located between the Greater Fresno and Stockton systems. Newman, Gustine, Crows Landing, Riverbank and Curtis are some of the cities in the area. The transmission system is composed of 230 kV, 115 kV and 60 kV facilities. The 230 kV facilities connect Bellota to the Wilson and Borden substations. The 115 kV transmission network is located in the northern portion of the area and it has connections to qualifying facilities generation located in the San Joaquin Valley. The 60 kV network located in the southern part of the area is a radial network. It supplies the Newman and Gustine areas and has a single connection to the transmission grid via a 115/60 kV transformer bank at Salado. Historically, the Central Valley experiences its highest demand during the summer season. Load forecasts indicate the Central Valley should reach its summer peak demand of 4476 MW by 2024 assuming load is increasing by approximately 50 MW per year. California ISO/MID 65 2014-2015 ISO Transmission Plan February 2, 2015 Accordingly, system assessments in these areas included technical studies using load assumptions for these summer peak conditions. Table 2.5-10 includes load forecast data. 2.5.4.2 Area-Specific Assumptions and System Conditions The Central Valley area study was performed consistent with the general study methodology and assumptions described in section 2.3. The ISO-secured website lists contingencies that were performed as part of this assessment. Additionally, specific methodology and assumptions that are applicable to the Central Valley area study are provided below. Generation Generation resources in the Central Valley area consist of market, QFs and self-generating units. The total installed capacity is approximately 3,459 MW with another 530 MW of North Valley generation being connected directly to the Sierra division. Table 2.5-9 lists a summary of the generation in the Central Valley area with detailed generation listed in Appendix A. Table 2.5-9: Central Valley area generation summary Capacity (MW) Generation Thermal 1,359 Hydro 1,545 Wind 894 Biomass 162 Total • • • • 3,960 Sacramento division — there is approximately 970 MW of internal generating capacity within the Sacramento division. More than 800 MW of the capacity (Lambie, Creed, Goosehaven, EnXco, Solano, High Winds and Shiloh) are connected to the new Birds Landing Switching Station and primarily serves the Bay Area loads. Sierra division — there is approximately 1,250 MW of internal generating capacity within the Sierra division, and more than 530 MW of hydro generation listed under North Valley that flows directly into the Sierra electric system. More than 75 percent of this generating capacity is from hydro resources. The remaining 25 percent of the capacity is from QFs, and co-generation plants. The Colgate Powerhouse (294 MW) is the largest generating facility in the Sierra division. Stockton division — there is approximately 1,370 MW of internal generating capacity in the Stockton division. Stanislaus division — there is approximately 590 MW of internal generating capacity in the Stanislaus division. More than 90 percent of this generating capacity is from hydro resources. The remaining capacity consists of QFs and co-generation plants. The 333 MW Melones power plant is the largest generating facility in the area. California ISO/MID 66 2014-2015 ISO Transmission Plan February 2, 2015 Load Forecast Loads within the Central Valley area reflect a coincident peak load for 1-in-10-year forecast conditions of each peak study scenario. Table 2.5-10 shows loads modeled for the Central Valley area assessment. Table 2.5-10: Load forecasts modeled in the Central Valley area assessment 1-in-10 Year Non-Simultaneous Load Forecast Summer Peak (MW) PG&E Area 2016 2019 2024 Sacramento 1181 1201 1291 Sierra 1286 1324 1442 Stockton 1347 1369 1464 Stanislaus 260 264 280 4075 4158 4476 TOTAL 2.5.4.3 Assessment and Recommendations The ISO conducted a detailed planning assessment based on the study methodology identified in section 2.3 to comply with the Reliability Standard requirements of section 2.2. Details of the planning assessment results are presented in Appendix B. The 2014 reliability assessment of the PG&E Central Valley area revealed several reliability concerns. These concerns consist of thermal overloads and low voltages under normal, Categories A, B and C contingencies. • All facilities met the thermal loading performance requirements under normal or Category A conditions. • Ten facilities were identified with thermal overloads for Category B performance requirements. Five facilities were identified with low voltage concerns and 10 facilities were identified with high voltage deviations. • Fifty-one facilities were identified with thermal overloads for Category C performance requirements. Studies also showed 48 facilities with voltage concerns, and 23 facilities with high voltage deviation concerns. The reliability issues identified in this assessment are very similar to those found in last year’s assessment. The previously approved projects within the area address the identified reliability concerns. California ISO/MID 67 2014-2015 ISO Transmission Plan February 2, 2015 2.5.5 Greater Bay Area 2.5.5.1 Area Description The Greater Bay Area (or Bay Area) is at the center of PG&E’s service territory. This area includes Alameda, Contra Costa, Santa Clara, San Mateo and San Francisco counties as shown in the adjacent illustration. To better conduct the performance evaluation, the area is divided into three sub-areas: East Bay, South Bay and San Francisco-Peninsula. The East Bay sub-area includes cities in Alameda and Contra Costa counties. Some major cities are Concord, Berkeley, Oakland, Hayward, Fremont and Pittsburg. This area primarily relies on its internal generation to serve electricity customers. The South Bay sub-area covers approximately 1,500 square miles and includes Santa Clara County. Some major cities are San Jose, Mountain View, Morgan Hill and Gilroy. Los Esteros, Metcalf, Monta Vista and Newark are the key substations that deliver power to this sub-area. The South Bay sub-area encompasses the De Anza and San Jose divisions and the City of Santa Clara. Generation units within this sub-area include Calpine’s Metcalf Energy Center, Los Esteros Energy Center, Calpine Gilroy Power Units, and SVP’s Donald Von Raesfeld Power Plant. In addition, this subarea has key 500 kV and 230 kV interconnections to the Moss Landing and Tesla substations. Last, the San Francisco-Peninsula sub-area encompasses San Francisco and San Mateo counties, which include the cities of San Francisco, San Bruno, San Mateo, Redwood City and Palo Alto. The San Francisco-Peninsula area presently relies on transmission line import capabilities that include the Trans Bay Cable to serve its electricity demand. Electric power is imported from Pittsburg, East Shore, Tesla, Newark and Monta Vista substations to support the sub-area loads. Trans Bay Cable became operational in 2011. It is a unidirectional, controllable, 400 MW HVDC land and submarine-based electric transmission system. The line employs voltage source converter technology, which will transmit power from the Pittsburg 230 kV substation in the city of Pittsburg to the Potrero 115 kV substation in the city and county of San Francisco. In addition, the re-cabling of the Martin-Bayshore-Potrero lines (A-H-W #1 and A-H-W #2 115 kV cable) in 2011 replaced the two existing 115 kV cables between Martin-Bayshore-Potrero with new cables and resulted in increased ratings on these facilities. The new ratings provided by this project will increase transmission capacity between Martin-Bayshore-Potrero and relieve congestion. The ISO Planning Standards were enhanced in 2014 to recognize that the unique characteristics of the San Francisco Peninsula form a credible basis for considering for approval corrective action plans to mitigate the risk of outages for extreme events that are beyond the level that is applied to the rest of the ISO controlled grid. Further, the ISO shall consider the overall impact of the mitigation on the identified risk and the associated benefits that the California ISO/MID 68 2014-2015 ISO Transmission Plan February 2, 2015 mitigation provides to the San Francisco Peninsula area. The ISO Planning Standards were approved by the ISO Board of Governors on September 18, 2014. 2.5.5.2 Area-Specific Assumptions and System Conditions The Greater Bay Area study was performed consistent with the general study assumptions and methodology described in section 2.3. The ISO-secured participant portal provides more details of contingencies that were performed as part of this assessment. In addition, specific assumptions and methodology to the Greater Bay Area study are provided below in this section. Generation Table 2.5-11 lists a summary of the generation in the Greater Bay area, with detailed generation listed in Appendix A. Table 2.5-11: Greater Bay area generation summary Capacity (MW) Generation Thermal 7938 Wind 335 Biomass 13 Total 8286 Load Forecast Loads within the Greater Bay Area reflect a coincident peak load for 1-in-10-year forecast conditions. Table 2.5-12 and Table 2.5-13 show the area load levels modeled for each of the PG&E local area studies, including the Greater Bay Area. California ISO/MID 69 2014-2015 ISO Transmission Plan February 2, 2015 Table 2.5-12: Summer Peak load forecasts for Greater Bay Area assessment 1-in-10 Year Non-Simultaneous Load Forecast Summer Peak (MW) PG&E Area 2016 2019 2024 949 948 941 1,692 1725 1775 San Francisco 967 956 934 Peninsula 969 968 960 Mission 1,366 1387 1386 De Anza 1,035 1029 1012 San Jose 1,881 1868 1833 8,859 8881 8841 East Bay Diablo TOTAL Table 2.5-13: Winter Peak load forecasts for San Francisco and Peninsula Area assessments 1-in-10 Year Non-Simultaneous Load Forecast Winter Peak (MW) PG&E Area 2016 2019 2024 San Francisco 1021 1000 961 Peninsula 917 900 868 2.5.5.3 Assessment and Recommendations The ISO conducted a detailed planning assessment based on the study methodology identified in section 2.3 to comply with the Reliability Standard requirements of section 2.2. Details of the planning assessment results are presented in Appendix B. The 2014-2015 reliability assessment of the PG&E Greater Bay Area has identified several reliability concerns consisting of thermal overloads under Category B and C contingencies. To address the identified thermal California ISO/MID 70 2014-2015 ISO Transmission Plan February 2, 2015 overloads and low voltage concerns, the ISO recommends the following transmission development projects as a part of the mitigation plan. Trans Bay Cable Runback Scheme Modification The ISO assessment has determined that the 115 kV cables in San Francisco area could overload under various Category B and C contingencies. The current TBC runback scheme ramps down 300 MW flow on the TBC to relieve loading on Potrero-Mission (AX) cable for an outage of the Potrero-Larkin #2 (AY-2) cable. However, the current scheme doesn’t mitigate other identified overloads in the San Francisco area. To mitigate these overloads, ISO recommends modifying TBC runback scheme to ramp down flow to zero MW. Furthermore, additional facilities need to be added to the scheme for monitoring outages and load. Below is the list of facilities to be monitored by the scheme. Table 2.5-14: Facilities to be monitored by the scheme Facility Contingency Potrero-Larkin #2 (AY-2) 115kV Cable Potrero-Larkin #1 (AY-1) 115kV Cable Potrero-Mission (AX) 115kV Cable Potrero-Mission (AX) 115kV Cable Potrero-Larkin #2 (AY-2) 115kV Cable Potrero-Mission (AX) 115kV Cable In addition to the TBC runback scheme modification, operational action plans are needed to mitigate overloads under some N-1-1 contingencies. Palo Alto Interim SPS The ISO assessment has determined that the 115 kV lines in Palo Alto area could overload under various Category C contingencies. The City of Palo submitted a solution through the 2012 Request Window proposing upgrades to their system that address the identified reliability concerns. The ISO will continue to work with the Palo Alto and PG&E to assess any interactions between the city’s electric system and the ISO controlled grid. Until the proposed solution is placed in-service, the ISO proposed an interim solution of installing an SPS at Palo Alto substation to address the reliability constraints. San Francisco Peninsula Reliability Concerns Under Extreme Events The 2014-2015 transmission planning process continued to assess the reliability need of the San Francisco Peninsula, to further address the reliability concern regarding supply to the downtown San Francisco area during an extreme event as defined by the reliability standards. The continued focus of the study work was on testing the incremental benefits a major reinforcement, e.g. a new supply to the peninsula to complement existing sources, in aiding in maintaining the electricity supply to the peninsula or aiding in restoration objectives following a major disturbance – considering in particular earthquake hazards. California ISO/MID 71 2014-2015 ISO Transmission Plan February 2, 2015 The ISO’s analysis has concluded that due to the nature of the risks, the existing supplies to the peninsula, and the characteristics of the transmission system within the peninsula, that an additional supply source would not have a material impact on reducing loss of load under a major earthquake event or reducing restoration times. Rather, the ISO working with the PG&E as the local load serving entity and transmission owner of the local transmission facilities have identified a number of alternative measures (hardening and reinforcement) to improve resiliancy on the peninsula itself. These hardening and reinforcement measures generally do not constitute new transmission facilities designed to provide additional load serving capability. Rather, they are generally capital maintenance activities that harden and improve the survivability of the facilities, and as such do not specifically require the approval of the ISO Board of Governors. However, due to the unique nature of the issues faced and the upgrades and reinforcements being contemplated, the ISO’s recommendation is to concur with these mitigations and to support PG&E activities to implement these measures. The mitigation measures themselves are set out in Appendix D of this transmission plan. One enhancement does constitute a new capital project requiring specific ISO approval – the Martin 230 kV Bus Extension Project. The project is estimated to cost between $85-129 million with an in-service date of 2021. Based on the analysis set out in Appendix D, this reinforcement is recommended for approval. The reliability assessment is included in Appendix D of this transmission plan. California ISO/MID 72 2014-2015 ISO Transmission Plan February 2, 2015 2.5.6 Greater Fresno Area 2.5.6.1 Area Description The Greater Fresno Area is located in the central to southern PG&E service territory. This area includes Madera, Mariposa, Merced and Kings counties, which are located within the San Joaquin Valley Region. The adjacent figure depicts the geographical location of the Fresno area. The Greater Fresno area electric transmission system is composed of 70 kV, 115 kV and 230 kV transmission facilities. Electric supply to the Greater Fresno area is provided primarily by area hydro generation (the largest of which is Helms Pump Storage Plant), several market facilities and a few qualifying facilities. It is supplemented by transmission imports from the North Valley and the 500 kV lines along the west and south parts of the Valley. The Greater Fresno area is composed of two primary load pockets including the Yosemite area in the northwest portion of the shaded region in the adjacent figure. The rest of the shaded region represents the Fresno area. The Greater Fresno area interconnects to the bulk PG&E transmission system by 12 transmission circuits. These consist of nine 230 kV lines; three 500/230 kV banks; and one 70 kV line, which are served from the Gates substation in the south, Moss Landing in the west, Los Banos in the northwest, Bellota in the northeast, and Templeton in the southwest. Historically, the Greater Fresno area experiences its highest demand during the summer season but it also experiences high loading because of the potential of 900 MW of pump load at Helms Pump Storage Power Plant during off-peak conditions. Load forecasts indicate the Greater Fresno area should reach its summer peak demand of approximately 3,869 MW in 2024, which includes losses and pump load. This area has a maximum capacity of about 4,923 MW of local generation in the 2024 case. The largest generation facility within the area is the Helms plant, with 1,212 MW of generation capability. Accordingly, system assessments in this area include the technical studies for the scenarios under summer-peak and off-peak conditions that reflect different operating conditions of Helms. In past transmission plans, significant transmission upgrades have been approved in the Fresno area. These are set out in chapter 7. 2.5.6.2 Area-Specific Assumptions and System Conditions The Greater Fresno area study was performed consistent with the general study assumptions and methodology described in section 2.3. The ISO-secured website provides more details of contingencies that were performed as part of this assessment. In addition, specific assumptions and methodology that applied to the Fresno area study are provided below. California ISO/MID 73 2014-2015 ISO Transmission Plan February 2, 2015 Generation Generation resources in the Greater Fresno area consist of market, QFs and self-generating units. Table 2.5-15 lists a summary of the generation in the Greater Fresno area with detailed generation listed in Appendix A. Table 2.5-15: Greater Fresno area generation summary Capacity (MW) Generation Thermal 1,374 Hydro 2,480 Solar 649 Biomass 64 Distributed Generation (DG) 356 Total 4,923 Load Forecast Loads within the Fresno and Yosemite area reflect a coincident peak load for 1-in-10-year forecast conditions for each peak study scenario. Table 2.5-16 shows the substation loads assumed in these studies under summer peak conditions. Table 2.5-16: Load forecasts modeled in Fresno and Yosemite area assessment 1-in-10 Year Non-Simultaneous Load Forecast Summer Peak (MW) PG&E Area Name 2016 2019 2024 Yosemite 1,018 1,081 1,183 Fresno 2,353 2,443 2,576 California ISO/MID 74 2014-2015 ISO Transmission Plan February 2, 2015 2.5.6.3 Assessment and Recommendations The ISO conducted a detailed planning assessment based on the study methodology identified in section 2.3 to comply with the Reliability Standard requirements of section 2.3. Details of the planning assessment results are presented in Appendix B. The ISO study of the Fresno area yielded the following conclusions: • two overloads would occur under normal conditions for summer peak; • 10 overloads would be caused by critical single contingencies under summer peak conditions; and • multiple overloads caused by critical multiple contingencies would occur under summer peak and off-peak conditions. The ISO proposed solutions to address the identified overloads and received two project proposals from PG&E through the 2014 Request Window. The ISO will continue to monitor these two projects in future planning cycles and rely on current action plans to mitigate as the in-service date identified is in the 2022 timeframe. In addition, one load interconnection project was submitted by PG&E through the 2014 Request Window. Load Interconnection on PG&E’s Barton-Airways-Sanger 115 kV line. The ISO concurs with the load interconnection project submitted by PG&E to facilitate the interconnection of the customer owned substation to PG&E’s Barton-Airways-Sanger 115 kV line. California ISO/MID 75 2014-2015 ISO Transmission Plan February 2, 2015 2.5.7 Kern Area 2.5.7.1 Area Description The Kern area is located south of the Yosemite-Fresno area and north of the Southern California Edison’s (SCE) service territory. Midway substation, one of the largest substations in the PG&E system, is located in the Kern area and has 500 kV transmission connections to PG&E’s Diablo Canyon, Gates and Los Banos substations as well as SCE’s Vincent substation. The figure on the left depicts the geographical location of the Kern area. The bulk of the power that interconnects at Midway substation transfers onto the 500 kV transmission system. A substantial amount also reaches neighboring transmission systems through Midway 230 kV and 115 kV transmission interconnections. These interconnections include 230 kV lines to Yosemite-Fresno in the north as well as 115 and 230 kV lines to Los Padres in the west. Electric customers in the Kern area are served primarily through the 230/115 kV transformer banks at Midway and Kern Power Plant (Kern PP) substations and through local generation power plants connected to the lower voltage transmission network. Load forecasts indicate that the Kern area should reach its summer peak demand of 2102 MW in 2024. Accordingly, system assessments in this area included technical studies using load assumptions for summer peak conditions. 2.5.7.2 Area-Specific Assumptions and System Conditions The Kern area study was performed in a manner consistent with the general study methodology and assumptions described in section 2.3. The ISO-secured website lists the contingencies that were studied as part of this assessment. In addition, specific assumptions and methodology that applied to the Kern area study are provided in this section. Generation Generation resources in the Kern area consist of market, qualifying facilities and self-generating units. Table 2.5-17 lists a summary of the generation in the Kern area with detailed generation listed in Appendix A. California ISO/MID 76 2014-2015 ISO Transmission Plan February 2, 2015 Table 2.5-17: Kern area generation summary Capacity (MW) Generation Thermal 3,176 Hydro 22 Solar 189 Biomass 56 Total 3,443 Load Forecast Loads within the Kern area reflect a coincident peak load for 1-in-10-year forecast conditions for each peak study scenario. Table 2.5-18 shows loads in the Kern area assessment. Table 2.5-18: Load forecasts modeled in the Central Valley area assessment 1-in-10 Year Non-Simultaneous Load Forecast PG&E Area Name Kern Summer Peak (MW) 2016 2019 2024 2,008 2,045 2,102 2.5.7.3 Assessment and Recommendations The ISO conducted a detailed planning assessment based on the study methodology identified in section 2.3 to comply with the Reliability Standard requirements of section 2.2. Details of the planning assessment results are presented in Appendix B. In this planning cycle, ISO performed studies for the Kern area consisting of the Kern Outlying and Kern Central subdivisions. This approach was taken to identify and address potential issues due to the different load peaking conditions of these two subdivisions that together constitute the Kern area. The Kern area study results comprise of the two subdivision results. The Kern area study yielded the following conclusions: • no thermal overloads and no voltage concerns would occur under normal (i.e., Category A) conditions; California ISO/MID 77 2014-2015 ISO Transmission Plan February 2, 2015 • thermal overloads involving four sections of two transmission facilities were identified with no voltage concerns under Category B contingency conditions; and • thermal overloads involving 13 facilities were identified with no voltage concerns under Category C contingency conditions. These overloads include the same facilities that were also identified as thermally overloaded under the Category B contingency conditions. To address the identified thermal overload concerns in the Kern area, the ISO is recommending the North East Kern Voltage Conversion Project which will convert the North East Kern Area 70 kV system to 115 kV system to address the identified issues. The estimated cost of the project is between $85 million and $125 million with an expected in-service date of May 2022. PG&E intends to initiate work on this project in 2015 with the conversion within the area being staged until the project is completed in 2022.The proposed project description is given below. North East Kern Voltage Conversion The project converts the existing 19.51 mile Semitropic–Wasco-Famoso line with the Wasco substation by-passed, and the 24.76 mile Kern PP-Kern Oil-Famoso 70 kV lines to 115 kV operations with conductors capable of at least 631 Amps and 742 Amps under normal and emergency conditions, respectively. It also reconductors 10.3 miles of the Lerdo-Kern Oil-7 Standard 115 kV Line (Kern Oil-Lerdo Jct-Lerdo line sections) with a conductor capable of at least 1126 Amps under both normal and emergency conditions, and 0.48 miles of the Smyrna– Semitropic-Midway 115 kV Line (Semitropic Jct-Semitropic line section) with a conductor capable of at least 631 Amps and 742 Amps under normal and and emergency conditions, respectively. Additionally, the project will convert the existing Famoso 115 kV bus to a threebay breaker-and-a-half (BAAH) configuration with capability for future expansion to a five-bay configuration, as well as the Kern Oil 115 kV bus to a four-bay BAAH configuration. It will terminate the new Kern PPP-Kern Oil-Famoso 115 kV Line to the 115 kV bus section “E” and also convert the bus to a four-bay BAAH configuration with sectionalizing breakers connecting to the bus section “D”. As a result, the project will remove the existing Semitropic 115/70 kV transformer and use its terminals for the converted line as well as replace the distribution banks at McFarland and Cawelo B substations with 115/12 kV and 115/4 kV transformer units, respectively. The project will mitigate the NERC Category B and C contingency related thermal overloads as well as the ISO planning standards for combined line and generator outage concerns identified in the Kern area 115 kV system. Some of the Category B concerns involve the overload of the Lerdo-Lerdo Jct 115 kV #1 line following the loss of the Mt Poso Unit #1; loss of Mt Poso Unit #1 & Kern Oil-Witco 115 kV #1 Line (G-1/L-1) overloading Lerdo-Lerdo Jct #1, Petrol Jct-Poso Mt Jct #1 and Petrol Jct-Live Oak #1 115 kV lines. Additional Category B concerns include the loss of PSE Live Oak Unit #1 and Kern-Live Oak 115 kV #1 line (G-1/L-1) overloading Kern Oil-JctKern Water #1 and Kern PP-Kern Water 115 kV #1 lines. Also is the overload of Live Oak-Kern PP 115 kV #1 line due to loss of Kern Oil-Witco 115 kV line, and PSE Live Oak Unit #1 and Kern Oil-Witco 115 kV #1 line (G-1/L-1). The study results show the facilities that are not meeting the NERC Category B conditions also appeared under the Category C conditions. A California ISO/MID 78 2014-2015 ISO Transmission Plan February 2, 2015 detailed list of the facilities that did not meet the required NERC performance criteria including their corresponding loading levels is provided in Appendix C. Additionally, ISO is recommending installation of a special protection scheme (SPS) as part of the already approved Kern PP 230 kV Area Reinforcement Project to mitigate the overload of the Kern PP 230/115 kV #4 transformer bank following the Kern PP 230/115 kV #3 & #4 bank outage (double transformer outage). In the interim, the Semitropic and Famoso summer operating procedures will continue to be in effect. PG&E will be reviewing these existing operating procedures, monitoring the area conditions and coming up with appropriate action plans. California ISO/MID 79 2014-2015 ISO Transmission Plan February 2, 2015 2.5.8 Central Coast and Los Padres Areas 2.5.8.1 Area Description The PG&E Central Coast division is located south of the Greater Bay Area and extends along the Central Coast from Santa Cruz to King City. The green shaded portion in the figure on the left depicts the geographic location of the Central Coast and Los Padres areas. The Central Coast transmission system serves Santa Cruz, Monterey and San Benito counties. It consists of 60 kV, 115 kV, 230 kV and 500 kV transmission facilities. Most of the customers in the Central Coast division are supplied via a local transmission system out of the Moss Landing Substation. Some of the key substations are Moss Landing, Green Valley, Paul Sweet, Salinas, Watsonville, Monterey, Soledad and Hollister. The local transmission systems are the following: Santa Cruz-Watsonville, Monterey-Carmel and Salinas-Soledad-Hollister sub-areas, which are supplied via 115 kV double circuit tower lines. King City, also in this area, is supplied by 230 kV lines from the Moss Landing and Panoche substations, and the Burns-Point Moretti sub-area is supplied by a 60 kV line from the Monta Vista Substation in Cupertino. Besides the 60 kV transmission system interconnections between Salinas and Watsonville substations, the only other interconnection among the sub-areas is at the Moss Landing substation. The Central Coast transmission system is tied to the San Jose and De Anza systems in the north and the Greater Fresno system in the east. The total installed generation capacity is 2,900 MW, which includes the 2,600 MW Moss Landing Power Plant. The PG&E Los Padres division is located in the southwestern portion of PG&E’s service territory (south of the Central Coast division). Divide, Santa Maria, Mesa, San Luis Obispo, Templeton, Paso Robles and Atascadero are among the cities in this division. The city of Lompoc, a member of the Northern California Power Authority, is also located in this area. Counties in the area include San Luis Obispo and Santa Barbara. The 2,400 MW Diablo Canyon Nuclear Power Plant (DCPP) is also located in Los Padres. Most of the electric power generated from DCPP is exported to the north and east of the division through 500 kV bulk transmission lines — in terms of generation contribution, it has very little impact on the Los Padres division operations. There are several transmission ties to the Fresno and Kern systems with the majority of these interconnections at the Gates and Midway substations. Local customer demand is served through a network of 115 kV and 70 kV circuits. With the retirement of the Morro Bay Power Plants, the present total installed generation capacity for this area is approximately 950 MW, including the recently installed photovoltaic solar generation resources, which includes the 550 MW Topaz and 250 MW California Valley Solar Ranch facilities on the Morro Bay-Midway 230 kV line corridor. The total installed capacity does not include the 2,400 MW DCPP output as it does not serve the Los Padres division. Load forecasts indicate that the Central Coast and Los Padres areas summer peak demand will be 778 MW and 623 MW, respectively, by 2019. By 2024, the summer peak loading for Central Coast and Los Padres is forecasted to rise to 802 MW and 641 MW, respectively. Winter peak California ISO/MID 80 2014-2015 ISO Transmission Plan February 2, 2015 demand forecasts in Central Coast are approximately 709 MW in 2019 and 714 MW in 2024. The area along the coast has a dominant winter peak load profile in certain pockets (such as the Monterey-Carmel sub-area). The winter peak demands in these pockets could be as high as 10 percent more than their corresponding summer peaks. Accordingly, system assessments in these areas included technical studies using load assumptions for summer and winter peak conditions. 2.5.8.2 Area-Specific Assumptions and System Conditions The study of the Central Coast and Los Padres areas was performed consistent with the general study methodology and assumptions that are described in section 2.3. The ISO-secured website lists the contingencies that were studied as part of this assessment. Additionally, specific methodology and assumptions that were applicable to the study of the Central Coast and Los Padres areas are provided below. Generation Generation resources in the Central Coast and Los Padres areas consist of market, qualifying facilities and self-generating units. Table 2.5-19 lists a summary of the generation in the Central Coast and Los Padres area at present with a detailed generation list provided in Appendix A. Table 2.5-19: Central Coast and Los Padres area generation summary Capacity (MW) Generation Solar 800 Thermal 2,916 Nuclear 2,400 Total 6,116 Load Forecast Loads within the Central Coast and Los Padres areas reflect a coincident peak load for 1-in-10year forecast conditions for each peak study scenario. Table 2.5.20 and table 2.5.21 show loads modeled for the Central Coast and Los Padres areas assessment. California ISO/MID 81 2014-2015 ISO Transmission Plan February 2, 2015 Table 2.5-20: Load forecasts modeled in the Central Coast and Los Padres area assessment 1-in-10 Year Non-Simultaneous Load Forecast Summer Peak (MW) PG&E Area 2016 2019 2024 Central Coast 761 778 802 Los Padres 603 623 641 1,364 1,401 1,443 Total Table 2.5-21: Load forecasts modeled in the Central Coast and Los Padres area assessment 1-in-10 Year Non-Simultaneous Load Forecast Winter Peak (MW) PG&E Area 2016 2019 2024 Central Coast 697 709 714 Los Padres 438 450 454 1,135 1,159 1,168 Total 2.5.8.3 Assessment and Recommendations The ISO conducted a detailed planning assessment based on the study methodology identified in section 2.3 to comply with the Reliability Standard requirements of section 2.2. Details of the planning assessment results are presented in Appendix B. The summer and winter peak reliability assessment for the PG&E Central Coast area and the summer reliability assessment for the Los Padres area performed in 2014 confirmed the previously identified reliability concerns and their associated mitigation plans. The concerns are thermal overloads, low voltages and voltage deviations, which are mostly under Category C contingency conditions. Similar to the previous year’s studies, no Category A reliability concerns were identified. The previously approved projects, which include the Estrella Substation, Midway-Andrew 230 kV, Mesa and Santa Maria SPS in the Los Padres division, and Watsonville 115 kV Voltage Conversion, Crazy Horse Substation, Natividad Substation, and Moss Landing 230/115 kV Transformer Replacement in the Central Coast division mitigate a number of thermal overloads and voltage concerns under the identified Category C contingencies. The Watsonville 115 kV California ISO/MID 82 2014-2015 ISO Transmission Plan February 2, 2015 Voltage Conversion Project adds a new 115 kV interconnection source to the Santa Cruz area from Crazy Horse. The Midway-Andrew 230 kV Project adds an additional source from Midway 230 kV Substation to the Mesa and Divide 115 kV system via the Andrew Substation. The Estrella Substation Project provides Paso Robles Substation with more reinforced 70 kV sources from Templeton and Estrella. It addresses the thermal overloads and voltage concerns in the Templeton 230 kV and 70 kV systems following Category B contingency due to loss of either the Templeton 230/70 kV #1 Bank or the Paso Robles-Templeton 70 kV Line as well as Category C3 contingency condition involving loss of Morro Bay-Templeton and TempletonGates 230 kV lines. Consequently, there were no recommendations for new projects to be considered for approval for the PG&E’s Central Coast and Los Padres divisions in this planning cycle. California ISO/MID 83 2014-2015 ISO Transmission Plan February 2, 2015 2.6 Southern California Bulk Transmission System Assessment 2.6.1 Area Description The southern California bulk transmission system primarily includes the 500 kV transmission systems of Southern California Edison (SCE) and San Diego Gas & Electric (SDG&E) and the major interconnections with Pacific Gas and Electric (PG&E), LA Department of Water and Power (LADWP) and Arizona Public Service (APS). Figure 2.6–1 provides an illustration of the Southern California’s bulk transmission system. Figure 2.6–1: Map of ISO Southern California Bulk Transmission System SCE serves over 14 million people in a 50,000 square mile area of central, coastal and southern California, excluding the city of Los Angeles and certain other cities. Most of the SCE load is located within the Los Angeles Basin. The CEC’s load growth forecast for the entire SCE area is about 341 MW per year. The CEC’s 1-in-10 load forecast includes the SCE service area, and the Anaheim Public Utilities, City of Vernon Light & Power Department, Pasadena Water and Power Department, Riverside Public Utilities, California Department of Water Resources and Metropolitan Water District of Southern California loads. The 2024 summer peak forecast load including system losses is 27,805 21 MW. SCE area load is served by generation that includes a diverse mix of renewables, qualifying facilities, hydro and gas-fired power plants. Some demand is served by power transfers into southern California on DC and AC transmission lines from the Pacific Northwest and Desert Southwest. SDG&E provides service to 3.4 million consumers through 1.4 million electric meters and more than 840,000 natural gas meters in San Diego and southern Orange counties. Its service area 21 California Energy Commission’s Final California Demand Forecast, 2014-2024, Mid Demand Baseline, Low Mid AAEE Savings (approved by the CEC on May 14, 2014) California ISO/MID 84 2014-2015 ISO Transmission Plan February 2, 2015 encompasses 4,100 square miles from southern Orange County to the U.S.-Mexico border. The existing points of imports are the South of San Onofre Nuclear Generation Station (SONGS) transmission path, the Otay Mesa-Tijuana 230 kV transmission line and the Imperial Valley Substation. The 2024 summer peak forecast load for the SDG&E area including system losses is 5,561 MW. Most of the SDG&E area load is served by generation that includes a diverse mix of renewables, qualifying facilities, small pumped storage, and gas-fired power plants. The remaining demand is served by power transfers into San Diego via points of imports discussed above. Electric grid reliability in southern California is challenged by the retirement of the San Onofre Nuclear Generating Station and the expected retirement of power plants using ocean or estuarine water for cooling due to OTC regulations. In total, approximately 9,291 MW of generation (7,045 MW gas-fired generation and 2,246 MW San Onofre) in the region is affected. Further, consistent with the CPUC’s assigned commissioner’s ruling addressing assumptions for the 2014 LTPP and 2014-2015 transmission plan 22 (the 2014-2015 LTPP/TPP ACR), the ISO has also taken into account the potential retirement of over 1,100 MW of older non-OTC generation in the area 23. To offset the retirement of SONGS and OTC generation, the CPUC authorized SCE to procure between 1900 and 2500 MW of local capacity in the LA Basin area and up to 290 MW in the Moor Park area and SDG&E to procure between 800 and 1100 MW in the San Diego area in the 2012 LTPP Track 1 and Track 4 decisions. The decisions provides “buckets” of procurement for preferred resources (such as renewable power, demand response and energy efficiency), energy storage and gas-fired generation. The actual location and mix of the authorized local capacity additions will not be known until the utilities have completed their procurement processes at the California Public Utility Commission. In this analysis, the ISO has considering the authorized levels of procurement and then focused on the results thus far in the utility procurement process – which in certain cases is less than the authorized procurement levels. As set out below, preferred resources and storage are expected to play an important role in addressing the area’s needs. As the term “preferred resources” encompasses a range of measures with different characteristics, they have been considered differently. Demand side resources such as energy efficiency programs are accounted for as adjustments to loads, and supply side resources such as demand response are considered as separate mitigations. Further, there is a higher degree of uncertainty as to the quantity, location and characteristics of these preferred resources, given the unprecedented levels being sought and the expectation that increased funding over time will result in somewhat diminishing returns. While the ISO’s analysis focused primarily on the basic assumptions set out below in section 2.6.2, the ISO has 22 Rulemaking 13-12-010 ”Assigned Commissioner's Ruling Technical Updates to Planning Assumptions and Scenarios for Use in the 2014 Long-Term Procurement Plan and 2014-2015 CAISO TPP” on February 27, 2014, with a technical update adopted on May 14, 2014. 23 Includes Etiwanda, Long Beach, and Cabrillo II generating facilities. California ISO/MID 85 2014-2015 ISO Transmission Plan February 2, 2015 conducted and will continue to conduct additional studies as needed on different resources mixes submitted by the utilities in the course of their procurement processes. In summary, the focus in this 2014-2015 transmission plan is to assess the adequacy of previously approved transmission and resource authorizations with updated forecast assumptions, and to explore alternatives in the event forecast preferred resources do not materialize at the currently anticipated levels. Further, the ISO has conducted analysis of the results thus far in the utility procurement process to assess the progress and effectiveness of the procurement in meeting the identified reliability needs in the area. 2.6.2 Area-Specific Assumptions and System Conditions The analysis of the southern California bulk transmission system was performed consistent with the general study methodology and assumptions described in section 2.3. The starting base cases and contingencies that were studied as part of this assessment are available on the ISO-secured website. In addition, specific assumptions and methodology that were applied to the southern California bulk transmission system study area are provided below. Generation The bulk transmission system studies use the same set of generation plants that are modeled in the local area studies. A summary of generation is provided in each of the local planning area sections within the SCE and SDG&E local areas. Load Forecast The summer peak base cases assume the CEC 1-in-10 year load forecast. This forecast load includes system losses. Table 2.6-1 provides a summary of the SCE and SDG&E area load used in the summer peak assessment. The summer light, summer off-peak and fall peak base cases assume approximately 50 percent, 65 percent and 84 percent of the coincident 1-in-2 year load forecast, respectively. Table 2.6-1: Summer Peak load forecasts used in the Southern California bulk system assessment 2016 2019 2024 (MW) (MW) (MW) SCE Area 25,655 26,667 28,300 SDG&E Area 5,285 5,504 5,682 Total 30,940 32,171 33,982 Area Name California ISO/MID 86 2014-2015 ISO Transmission Plan February 2, 2015 2012 LTPP Track 1 and Track 4 Resource Assumptions In the 2012 LTPP Track 1 and Track 4 decisions, the CPUC authorized the respective utilities to procure between 1900 and 2500 MW of local capacity in the LA Basin area, up to 290 MW in the Moor Park area and between 800 and 1100 MW in the San Diego area to offset the retirement of SONGS and OTC generation. The actual amount, mix and location of the local capacity additions will not be finalized until the utilities have completed their procurement process, but the ISO has also relied upon the information made available to this point in those procurement processes. Table 2.6-2 summarizes the assumptions used in the current studies, based on authorized procurement. These assumptions will be revisited in future planning cycles. Table 2.6-2: Summary of 2012 LTPP Track 1 & 4 Authorized Procurement (1) Area Name Total Gas-fired generatio n Preferred Resources and Storage Assumed In Service Date SCE LA Basin Area 2500 1500 1000 2020 SCE Moorpark Area 290 194 96 2020 SDG&E Area 1100 900 200 2017 Total 3890 2594 1296 1. The long-term LCR study presented in this transmission plan used additional assumptions for Track 1 and Track 4 local capacity additions based on utility procurement activities to date. See section 3.2.2 for details. In accordance with the 2012 LTPP Track 1 and Track 4 decisions, SCE announced that they had selected 1891.8 MW of resources in the Western LA Basin Sub-Area and 328.5 24 MW in the Moorpark Sub-Area from the LCR RFO. The ISO notes that the selected resources in the Western LA Basin are substantially less than the 2500 MW assumed by the ISO in its base cases described above. The ISO analyzed the authorized amounts and this reduced amount of selected resources in the long-term LCR analysis described in chapter 3. Energy Efficiency The CEC load forecast includes the impact of committed energy efficiency programs. In addition, incremental energy efficiency (also known as Additional Achievable Energy Efficiency or AAEE) was also assumed and modeled for the studies based on the CEC low-mid projection adjusted to include distribution loss avoidance. Table 2.6-3 summarizes the total AAEE modeled in the study cases. 24 This includes 54 MW of Ellwood GFG enhancement, which does not count toward the local capacity (i.e., LCR) incremental need target. California ISO/MID 87 2014-2015 ISO Transmission Plan February 2, 2015 Table 2.6-3: Summary of AAEE Assumptions Area Name 2016 2019 2024 (MW) (MW) (MW) SCE Area 359 782 1,433 SDG&E Area 81 184 338 Total 440 966 1,771 There have been several positive steps to increase energy efficiency objectives. In Rulemaking 13-11-005 (Order Instituting Rulemaking Concerning Energy Efficiency Rolling Portfolios, Policies, Programs, Evaluation, and Related Issues) the CPUC began to shift utility energy efficiency programs to a rolling three year energy efficiency funding cycle, promoting greater program durability. Further, the CPUC’s decision 25 of October 16, 2014 in that proceeding established funding for 2015 and more importantly also established funding at the same (i.e., 2015) level through 2025, unless subsequently changed through future proceedings. Additionally, annual goals through 2025 will be included in post-processing by the Energy Commission to establish locational benefits going forward. The CPUC rolling portfolio process for energy efficiency lends itself to continual review of each year’s results, and modification to funding levels to ensure overall forecast objectives for energy efficiency are met. However, current measures do not provide the same level of tracking and more definitive forecasting of achieving these goals as other types of projects like transmission lines or generating stations. The high reliance on significant volumes of additional achievable energy efficiency in managing reliability in Southern California (and in the LA Basin in particular) necessitates monitoring the development of this resource to be assured that it is developing and performing according to the forecast assumptions that the ISO is relying upon for long term planning purposes. The ISO looks forward to continued dialog with the CEC and CPUC in this regard. Given the inherent forecast uncertainty absent more definitive tracking and the general concern that increased funding is generally expected to be progressively less effective as higher levels of funding are employed, the ISO is taking prudent and necessary steps to explore transmission alternatives (and their associated timelines) so that feasible options may be considered (together with other conventional or alternative resources, as appropriate) if currently forecast resources fail to meet their planning targets. This is discussed in more detail in subsequent sections of this transmission plan. 25 CPUC Decision 14-10-046: DECISION ESTABLISHING ENERGY EFFICIENCY SAVINGS GOALS AND APPROVING 2015 ENERGY EFFICIENCY PROGRAMS AND BUDGETS (CONCLUDES PHASE I OF R.13-11-005) California ISO/MID 88 2014-2015 ISO Transmission Plan February 2, 2015 Demand Response (DR) The ISO understands the CEC load forecast includes the impact of non-event-based demand response programs such as real-time or time-of-use pricing and event-based programs such as critical peak pricing and peak time rebates. In addition, the ISO modeled a range of impacts of emergency DR programs such as Base Interruptible (BIP), Agricultural Pumping Interruptible (API) and AC Cycling (SDP) programs in the studies. The ISO has assumed in the study base case that approximately 200 MW of these resources will be locally dispatchable and will have the necessary characteristics to be applicable as transmission mitigation resources – in particular, a fast-enough response to dispatch instructions from the ISO (not exceeding 20 minutes). The ISO understands this to entail the repurposing of those existing demand programs which were designed to address system resource issues that lack the required performance attributes. This base study assumption is consistent with the CPUC LTPP Track 4 proceeding, in which modest amounts of repurposing of existing DR programs were assumed as a reasonable study basis. These include funded fast response (30 minutes or less) demand response assumptions for the post first contingency as listed in the Summary Table of the SONGS Study Area Input Assumptions of the CPUC Scoping Ruling for the Long-Term Procurement Plan Track 4 (R.1203-014) process. These are “fast” DR programs located in the most effective locations in the Southwestern LA Basin and San Diego areas and can respond within 30 minutes or less, including notification time. The ISO has also studied as a sensitivity the ceiling amount identified in the CPUC’s 2014-2015 LTPP/TPP ACR, which is the total of all of the existing programs that could be reasonably considered for repurposing. The 2014-2015 LTPP/TPP ACR identified for potential repurposing a total of up to 1086 MW of existing DR in the SCE and SDG&E areas. Excluding resources in SCE’s service area that are outside of the LA Basin, this results in about 862 MW for the combined LA Basin / San Diego area as the ceiling amount studied in the sensitivity analysis. The base amount continues to reflect the reasonable basis for long term planning at this time, as the ISO is not aware of clear direction to the utilities to initiate the repurposing of these resources, or results of utilities’ efforts to repurpose the existing DR programs for transmissionrelated use. Demand response that may be procured by the utilities in response to the 2012 LTPP Track 1 and Track 4 decisions is assumed to be incremental to this base amount. Table 2.6-4 provides the range of Demand Response programs that were modeled in the study cases. The DR amounts were modeled offline in the initial study cases and were considered as mitigation once reliability issues were identified. The ISO understands the amounts reflect average rather than more dependable load impact estimates of the DR programs. Actual location is not available for some of the DR resources in which case the amounts were modeled at assumed locations. California ISO/MID 89 2014-2015 ISO Transmission Plan February 2, 2015 Table 2.6-4: Summary of DR Assumptions Area/DR Program SCE Area BIP-301 2016 2019 2024 (MW) (MW) (MW) Same amount as 2024 1070 242 (modeled at actual locations) BIP-301 235 (modeled at assumed locations) API/SDP/BIP-151 434 (modeled at actual locations) API/SDP/BIP-151 159 (modeled at actual locations) SDG&E Area 16 Total 1086 1. BIP-30 and BIP-15 denote BIP programs with 30-minute and 15-minute contractual advance notification provisions, respectively. Distributed Generation The CEC load forecast accounts for all major programs designed to promote solar and other types of self-generation. The ISO understands the forecast also includes power plants that were explicitly reported to the CEC by the owners as operating under cogeneration or selfgeneration mode. In addition, the ISO has modeled incremental distributed generation (DG) as provided by the CPUC for the Commercial-Interest RPS Portfolio. Table 2.6-5 summarizes the DG that was modeled in the study cases. The DG amounts were modeled offline in the initial study cases and were considered as mitigation once reliability issues were identified. California ISO/MID 90 2014-2015 ISO Transmission Plan February 2, 2015 Table 2.6-5: Summary of DG Assumptions Area Name 2016 2019 2024 (MW) (MW) (MW) 393 412 565 -- 125 143 393 537 708 SCE Area SDG&E Area Total Stressed Path Flow Assumptions Table 2.6-6 lists major paths in southern California that were stressed at least in one study case for the purpose of assessing the transfer capability (TC) or system operating limit (SOL) associated with the path in accordance with NERC Standards FAC-14-2 and FAC-13-2. Table 2.6-6: Stressed Path Flow Assumptions Path SOL/Transf er Capability Case in which path was stressed (MW) Path 26 4000 (N-S) 2016 Summer Peak PDCI 3100 2016 Summer Peak SCIT 17,870 2016 Summer Peak Path 46 (WOR) 11,200 2016 Summer Off Peak Path 49 (EOR) 9,600 2016 Summer Off Peak California ISO/MID 91 2014-2015 ISO Transmission Plan February 2, 2015 2.6.3 Assessment and Recommendations 2.6.3.1 Conclusions and Assessments The ISO conducted a detailed planning assessment based on the study methodology identified in section 2.3 to comply with the Reliability Standard requirements of section 2.2. Details of the planning assessment results are presented in Appendix B. The assessment and recommendations also draw upon the findings of the long term local capacity reliability study found in chapter 3. The ISO has relied on the resource assumptions noted earlier for this assessment. As described above, there is currently substantial uncertainty associated with those assumptions. However, the results will be updated in the next planning cycle based on the latest available information, and alternatives are being explored on a precautionary basis. The ISO assessment of the southern area bulk transmission system yielded the following conclusions: No deficiency in local capacity requirements under base case assumptions The long term local capacity requirements analysis set out in chapter 3 indicates that the currently-authorized resources and previously approved transmission are adequate without driving further local resources at this time provided that energy efficiency materializes as forecast and the baseline forecast amount of existing available DR in the most effective locations (approximately 200 MW) that can be repurposed. Thermal overload and voltage stability concerns associated with overlapping outage of Sunrise Powerlink and Southwest Powerlink For all study years, overlapping outages of the East County–Miguel (TL 50001) or East County– Imperial Valley (TL 50004) and Ocotillo–Suncrest (TL 50003) or Ocotillo–Imperial Valley (TL 50005) 500kV lines without system re-adjustment after the initial contingency resulted in thermal overloads on the SDG&E–CFE tie lines as well as CFE transmission lines within the La Rosita– Tijuana 230 corridor, and potential voltage instability unless mitigated. The voltage instability occurred when the Otay Mesa–Tijuana 230 kV line was tripped by the existing CFE SPS due to the thermal overloads on the La Rosita–Tijuana 230 kV corridor. The existing South of SONGS Safety Net, which is enabled when all of the 500 kV lines are in service, will ensure voltage stability if the overlapping outages occur before system adjustments could be performed (Category D condition). ISO Operating Procedure 7820 provides the system adjustments currently needed to maintain voltage stability following the N-1/N-1 condition without dropping load. For outages occurring with sufficient time to adjust the system after the first contingency and before the second – a Category C condition – other mitigations are relied upon: • In the short term, i.e. until the Imperial Valley phase shifting transformer is service, enabling the existing SDG&E 230kV TL 23040 Otay Mesa–Tijuana SPS is recommended in section 2.9 (San Diego area assessment) to address the thermal overload on the SDG&E–CFE tie lines following the overlapping SDG&E 500 kV line outages since the CFE cross-tripping SPS is not designed to activate for overloads of California ISO/MID 92 2014-2015 ISO Transmission Plan • February 2, 2015 the tie lines and the tie lines can overload even when loading on the La Rosita–Tijuana 230 kV corridor is within limits. The voltage stability issue associated with the crosstripping of the Otay Mesa–Tijuana or Imperial Valley-La Rosita 230 kV lines following the overlapping SDG&E 500 kV line outages is addressed by dispatching available generation in the San Diego and LA Basin areas after the initial contingency in accordance with existing operating procedures. In the longer term, the approved Imperial Valley phase shifting transformer will be utilized in conjunction with available resources in the San Diego and LA Basin areas to mitigate the thermal overloads that trigger the CFE cross tripping scheme following the overlapping SDG&E 500 kV line outages. Mitigating the thermal overloads that trigger the CFE cross tripping scheme addressed the voltage stability concern. In the 2024 summer peak case in which OTC generators were removed from service, available preferred resources and storage were utilized in addition to available conventional generation to address the overloading and voltage stability concern. Lugo–Victorville 500 kV line thermal overload In the 2024 summer peak case, the Lugo–Victorville 500 kV line was overloaded under multiple overlapping 500 kV outages with all conventional generation fully dispatched. Utilizing available preferred resources along with system adjustments after the initial contingency in accordance with existing ISO operating procedures mitigated the loading concern. Path 26, SCIT, Path 46 and Path 49 assessment The current System Operating Limits (SOLs) or Transfer Capabilities for Path 26, SCIT, Path 46 and Path 49 were assessed as part of the Southern California bulk system study. The results did not identify constraints that could limit the capabilities of the paths below their existing operating limits. The Path 46 and Path 49 assessment indicated the following 500 kV overlapping (L-1/L-1) outages could lead to voltage instability and/or cascading during heavy transfers on the paths if the transfers are not adjusted quickly enough (within 30 minutes) after the initial contingency: • • • Overlapping outages of Palo Verde–Colorado River and North Gila–Imperial Valley 500 kV lines Overlapping outages of Palo Verde–Colorado River and Eldorado–Lugo 500 kV lines Overlapping outages of Navajo–Crystal and Perkins–Mead or Perkins–Westwing 500 kV lines The ISO will utilize existing operating procedures along with real-time contingency analysis tools to monitor the impact of the contingencies in real-time and adjust import into Southern California within 30 minutes of the initial contingency, as needed. These results are indicative of Path 46 and Path 49 being Interconnection Reliability Operating Limits (IROLs). The ISO is coordinating with affected Planning Coordinators and Owners of the transmission lines within each of these paths before designating the Paths as IROLs in the planning horizon. California ISO/MID 93 2014-2015 ISO Transmission Plan February 2, 2015 Request Window Proposals The ISO received a number of specific high-voltage transmission solution proposals to the 2014 Request Window for the Southern California area. The following table 2.6-7 provides a summary of these submittals and ISO’s comments as to whether the proposals were found to be needed and recommended in this planning cycle. Comments have also been provided as to potential changes in circumstances that could call for these projects to be needed in future planning cycles. Further ISO comments and descriptions of the Request Window submittals are provided following the summary table. Table 2.6-7 – Summary of Proposed Projects Submitted into the 2014 Request Window Transmission Solutions Type of Project Submitted By Is the Request Window Submittal Found Needed in the 2014-2015 Transmission Planning Cycle? Mead – Adelanto Project (MAP) Upgrade Reliability StarTrans IO, LLC No Lake Elsinore Advanced Pump Storage (LEAPS) Generation Alternative Nevada Hydro Company No Talega-Escondido/Valley-Serrano 500kV Interconnect (TE/VS) Reliability or Policy-driven Nevada Hydro Company No Reliability Edison Transmission, LLC No Reliability SoCal-CETP Holdings, LLC No Generation Alternative / Policy-driven SCE Strategic Transmission Expansion Project or STEP (Hoober-SONGS HVDC Inter-tie) Reliability IID IID Midway-Devers 500 kV Inter-tie (same as Devers – Midway 500kV T/L above but IID submitted it instead of SCE) Reliability IID Alberhill-Talega HVDC Line Southern California Clean Energy Transmission Project (SoCal-CETP) Devers - Midway 500kV Transmission Line California ISO/MID No No No 94 2014-2015 ISO Transmission Plan February 2, 2015 Mead–Adelanto Project (MAP) Upgrade Project Description: The MAP Upgrade was submitted by Startrans IO LLC and involves the conversion of the MAP transmission line from its existing High-Voltage Alternating Current (“HVAC”) operation to HighVoltage Direct Current (“HVDC”) operation, increasing its capacity from 1291 MW AC to 3500 MW DC. The Project requires the construction of two HVDC converter terminals: one near the Marketplace Substation in Southern Nevada and the second near the Adelanto Substation in Southern California. The Project also includes AC system upgrades around the converter terminals to reliability integrate the new transmission capacity into the transmission system. The estimated cost of the project is $1.05 billion. The proposed in-service date is December 2, 2019. ISO’s Assessment: The ISO did not identify a reliability need for the Mead – Adelanto Project (MAP) upgrade in the current planning cycle and therefore this project was found to be not needed in this planning cycle. However, the ISO may consider the concept in future planning cycles if the need for increased transmission capacity across the Eldorado–Lugo corridor is identified. Lake Elsinore Advanced Pump Storage (LEAPS) Project Description: The LEAPS was submitted by Nevada Hydro Company and involves the proposed construction of a 500 MW generation / 600 MW pump storage project. The Nevada Hydro Company proposed to have the TE/VS transmission project (described below) to connect to this pump storage project. ISO’s Assessment: The ISO did not identify a reliability need for the LEAPS in the current planning cycle and therefore this project was found to be not needed. However, the ISO may consider the concept in future planning cycles if the need for additional local capacity in the LA Basin / San Diego beyond the CPUC authorized Tracks 1 and 4 procurement is identified. Talega-Escondido/Valley-Serrano 500kV Interconnect (TE/VS) Project Description: The TE/VS was submitted by the Nevada Hydro Company and involves the proposed construction of a new 500kV Lake switchyard, new 500/230kV Case Springs substation and about 30 miles of new 500kV lines connecting SCE to SDG&E system. This also includes 230kV upgrades in SDG&E system. ISO’s Assessment: The ISO did not identify a reliability need for the TE/VS in the current planning cycle and therefore this project was found to be not needed. However, the ISO may consider the concept in future planning cycles if the need for additional local capacity in the LA Basin / San Diego beyond the CPUC authorized Tracks 1 and 4 procurement is identified. California ISO/MID 95 2014-2015 ISO Transmission Plan February 2, 2015 Alberhill-Talega HVDC Line Project Description: The Alberhill-Talega HVDC Line was submitted by Edison Transmission, LLC, and involves the construction of a 36.3-mile +500kV monopole 1000 MW HVDC line connecting Alberhill (SCE) substation to Talega (SDG&E) substation; construct converter stations at both ends of the line; and re-arrange SONGS-Talega 230kV lines. ISO’s Assessment: The ISO did not identify a reliability need for the Alberhill-Talega HVDC Line in the current planning cycle and therefore this project was found to be not needed. However, the ISO may consider the concept in future planning cycles if the need for additional local capacity in the LA Basin / San Diego beyond the CPUC authorized Tracks 1 and 4 procurement is identified. Southern California Clean Energy Transmission Project (SoCal-CETP) Project Description: The SoCal-CETP was submitted by SoCal-CETP Holdings, LLC, and involves the the construction of a transmission superhighway of 500kV High-Voltage Alternating Current (“HVAC”) overhead, underground and subsea +/- 500kV High-Voltage Direct Current (“HVDC”) transmission lines, and HVDC converter stations that would connect the Miguel substation to the Encina substation and the Huntington Beach substation. Total transmission mileage is about 148 miles. ISO’s Assessment: The ISO did not identify a reliability need for the SoCal-CETP in the current planning cycle and therefore this project was found to be not needed. However, the ISO may consider the concept in future planning cycles if the need for additional local capacity in the LA Basin / San Diego beyond the CPUC authorized Tracks 1 and 4 procurement is identified. Devers - Midway 500kV Transmission Line (by SCE) Project Description: The Devers – Midway 500kV Transmission Line was submitted by SCE and involves the construction of a 90-mile 500kV transmission line connecting IID’s Midway substation to SCE’s Devers substation. ISO’s Assessment: The ISO did not identify a reliability need nor generation deliverability need out of Imperial County for the Devers-Midway 500kV Transmission Line in the current planning cycle and therefore this project was found to be not needed. However, the ISO may consider the concept in future planning cycles if the need for additional local capacity in the LA Basin / San Diego beyond the CPUC authorized Tracks 1 and 4 procurement or additional generation deliverability from the Imperial County beyond the 1,700-1,800 MW incremental to the existing generation is identified. California ISO/MID 96 2014-2015 ISO Transmission Plan February 2, 2015 Strategic Transmission Expansion Project or STEP (Hoober-SONGS HVDC Inter-tie) Project Description: The STEP Hoober-SONGS HVDC was submitted by the Imperial Irrigation District (IID) and involves the construction of 180-mile 1,100 MW 500kV HVDC line connecting IID’s Hoober substation to joint SCE-SDG&E SONGS substation. ISO’s Assessment: The ISO did not identify a reliability need nor generation deliverability need out of Imperial County for the STEP Hoober-SONGS HVDC Intertie in the current planning cycle and therefore this project was found to be not needed. However, the ISO may consider the concept in future planning cycles if the need for additional local capacity in the LA Basin / San Diego beyond the CPUC authorized Tracks 1 and 4 procurement or additional generation deliverability from the Imperial County beyond the 1,700-1,800 MW incremental to the existing generation is identified. Project Description: The STEP Hoober-SONGS HVDC was submitted by the Imperial Irrigation District (IID) and involves the construction of 180-mile 1,100 MW 500kV HVDC line connecting IID’s Hoober substation to joint SCE-SDG&E SONGS substation. Devers – Midway 500kV Transmission Line (by IID) This is the same submittal in scope as submitted by SCE (see #6 above). Please see same comments and project description as provided above. 2.6.3.2 Preferred Resources Assessment Alternative Assessment) (Non-Conventional Transmission As indicated earlier, available preferred resources and storage including additional energy efficiency (AAEE), distributed generation, demand response and the preferred resources assumed to fill the LTPP 2012 local capacity authorization were utilized to mitigate reliability issues in the southern California bulk system. The ISO did not receive proposals for additional preferred resources in the southern California bulk system study area through the 2014-2015 Request Window. As well, the reliability assessment results did not indicate need for additional resources, beyond previously authorized amounts, to meet reliability requirements. 2.6.3.3 Summary of Recommendations The ISO conducted a detailed planning assessment for the Southern California Bulk System to comply with the Reliability Standard requirements of section 2.2, as well as long-term local capacity analyses of section 3.2 and makes the following recommendations: In the short-term, i.e. until the Imperial Valley phase shifting transformer is service, enabling the existing SDG&E 230kV TL 23040 Otay Mesa–Tijuana SPS is recommended in section 2.9 (San Diego area assessment) to address the thermal overload on the Otay Mesa–Tijuana 230 kV line following the overlapping SDG&E 500 kV line outages. The voltage stability issue associated with the cross-tripping of the Otay California ISO/MID 97 2014-2015 ISO Transmission Plan February 2, 2015 Mesa–Tijuana 230 kV line or Imperial Valley-La Rosita 230 kV line following the overlapping outages is addressed by dispatching available resources in the San Diego and LA Basin areas after the initial contingency in accordance with existing operating procedures. In the longer term, the Imperial Valley phase shifting transformer and other transmission projects that were approved as part of the ISO 2013-14 transmission plan are expected to go into service. In addition, resources assumed to fill the CPUC-authorized local capacity additions are expected to go into service. System adjustments utilizing all available resources, after the initial contingency, are needed to mitigate the overloading and voltage stability issue associated with the overlapping outages of SDG&E 500 kV transmission lines. The approved Imperial Valley phase shifting transformer will be incorporated into the area operating procedures when it becomes operational. There are a number of uncertainties that could impact the above results for the long-term planning horizon including uncertainties associated with the amount of authorized local capacity additions, AAEE, distributed generation, and the amount of existing demand response that would be repurposed for use in meeting local reliability needs. The assessment will be revisited in the next planning cycle with the latest available information. The overloading of the Lugo–Victorville 500 kV line following overlapping 500 kV outages will be mitigated by utilizing available preferred resources in conjunction with system adjustments after the initial contingency in accordance with existing operating procedures. The current System Operating Limits or Transfer Capabilities for Path 26, SCIT, Path 46 and Path 49 were assessed as part of this Southern California Bulk system assessment. The results did not identify constraints that could limit the capability of the paths below their existing operating limits. The Path 46 and Path 49 assessment identified a number of 500 kV overlapping (L-1/L1) outages that could lead to voltage instability and/or cascading during heavy transfers on the paths if the transfers are not adjusted quickly enough (within 30 minutes) after the initial contingency. The ISO will utilize existing operating procedures along with real-time contingency analysis tools to monitor the impact of the contingencies in real time and adjust import into Southern California within 30 minutes after the initial contingency, as needed. These results are indicative of the SOLs associated with Path 46 and Path 49 being Interconnection Reliability Operating Limits (IROLs). The ISO is coordinating with affected Planning Coordinators and Owners of the transmission lines within each of these paths before designating the Paths as IROLs in the planning horizon. California ISO/MID 98 2014-2015 ISO Transmission Plan February 2, 2015 2.6.4 Consideration of alternatives for future additional needs for LA Basin / San Diego and Imperial Area 2.6.4.1 Interaction between LA Basin / San Diego Area Local Reliability Needs and Imperial Valley Area Deliverability For the LA Basin / San Diego area, the long-term LCR study results indicated that with the approved transmission and authorized procurement, local reliability would be met. However, as there is potential considerable uncertainty over the ultimate success of procurement of authorized preferred resources (to the full authorized amount for the LA Basin), as well as with other forecast assumptions for the AAEE and higher level of existing DR that can be repurposed for use under contingency conditions, the ISO considers it prudent to consider backup or alternative transmission solutions in the event they become necessary to meet local reliability for the LA Basin / San Diego area. Some potential transmission solutions for the LA Basin / San Diego area could also facilitate additional development of renewable resources in the Imperial area for possible higher renewable energy goals that are currently being considered by the state energy regulatory agencies. For the Imperial area, transmission projects that were already approved and recommended mitigations as part of this planning cycle (2014-2015 TPP) would restore overall forecast deliverability to the ISO Southern area to the pre-SONGS retirement levels (i.e., 1,700 – 1,800 MW incremental above existing renewable generation). However, potential additional renewable generation development in the Imperial area may exceed remaining forecast deliverability given the projects that are already in the ISO and IID interconnection processes. In considering potential transmission options to synergize increased generation deliverability out of Imperial area, as well as enhancing local reliability in Southern California, several options have been explored and found to have the following characteristics: • • • • Some transmission reinforcements that strengthen the LA Basin and San Diego connection provide reliability improvement for the LA Basin / San Diego area, but provide little or no benefits to improving generation deliverability from the Imperial area; Other transmission upgrade options provide Imperial area deliverability benefits but of little or no local capacity benefits (i.e., Midway – Devers 500kV line); Some larger more comprehensive transmission solutions have been proposed (i.e., STEP Hoober – SONGS DC Line); Combination of individual transmission segments that offer either deliverability or reliability benefits must also be considered for a larger integrated solution. In considering potential back-up solutions should additional needs emerge, the ISO considers that emphasis needs to be placed on how solutions addressing future reliability concerns in the LA Basin / San Diego area integrate with potential solutions for increasing generation deliverability benefits for resource development in the Imperial area given the high degree of interaction between the two areas. In addition, other considerations that should be taken into account include: • Timing and emergency of need for additional mitigation for both needs (i.e., reliability and generation deliverability); California ISO/MID 99 2014-2015 ISO Transmission Plan • • • February 2, 2015 Feasibility of various developments, which can be drawn from the Imperial area consultation efforts at the ISO, as well as the CEC/Aspen high-level environmental assessment analysis 26; Potential benefits of a more staged approach, such as some transmission solutions that work well together but have standalone benefits as well. Examples of such options include the Midway – Devers 500kV AC (or DC line) and the Valley – Talega 500kV line, where the former primarily supports exports of renewables from the Imperial area, and the latter primarily supports the LA Basin and San Diego areas; Future analysis that will be required as needs evolve, including consideration of a larger picture that benefits both California and Mexico clean energy objectives, such as the CFE – ISO Bulk 500kV AC or HVDC transmission option. The studies and findings in previous transmission plans provided context for the further analysis conducted in the 2014-2015 planning cycle. 2.6.4.2 Preliminary Evaluation of Potential Back-up Transmission Solutions that Provide Both Reliability Benefits for the LA Basin / San Diego Area and Generation Deliverability Benefits for the Imperial County Area The evaluation of potential back-up solutions for the LA Basin and San Diego area and the interaction with potentially increasing deliverability of renewable generation from the Imperial area was based a number of sources developed through the course of the 2014-2015 transmission planning process. The local capacity benefits of various transmission mitigations beyond currently approved projects were studied as part of the long term local capacity studies undertaken in this planning process as a special study, and the results are documented in more detail in chapter 3.2 and Appendix E. Further, as part of the ISO 2014-2015 transmission planning process, the ISO conducted a stakeholder consultation on various options to address renewable generation deliverability out of Imperial County to the San Diego and LA Basin areas in support of the California ISO’s transmission planning process. This consultation effort, the “Imperial County Transmission Consultation” 27, provided opportunities for stakeholder input on a range of issues that informed the California ISO’s 2014-2015 transmission planning process. Further analyses were performed to evaluate options that would restore overall forecast deliverability to the ISO Southern area to the pre-SONGS retirement levels (i.e., 1,700 – 1,800 MW incremental above existing renewable generation) and also a higher amount (2500 MW incremental above existing renewable generation) that was a sensitivity requested by the CPUC and CEC to the ISO in 26 CEC/Aspen report on “Transmission Options and Potential Corridor Designations in Southern California in Response to Closure of San Onofre Nuclear Generating Station (SONGS)” (http://www.energy.ca.gov/2014publications/CEC-700-2014-002/) 27 More information about the “Imperial County Transmission Consultation” process can be found on the ISO website within the 2014-2015 Transmission Planning Process at http://www.caiso.com/planning/Pages/TransmissionPlanning/2014-2015TransmissionPlanningProcess.aspx California ISO/MID 100 2014-2015 ISO Transmission Plan February 2, 2015 communicating the renewable resource portfolios for the 2014-2015 transmission planning process. These are discussed further in details in chapter 4.3. Table 2.6-8 provides high-level descriptions and preliminary estimates of potential LCR benefits of various potential transmission solutions providing local capacity benefits to the LA Basin/San Diego area. Table 2.6-9 provides further information on each of these transmission options; potential scope of work, high-level cost estimates, preliminary environmental assessments with majority of inputs provided by the Aspen 28 through work undertaken on behalf of the CEC and further inputs on additional considered options at the ISO’s Imperial County Transmission Consultation process. 28 CEC/Aspen report on “Transmission Options and Potential Corridor Designations in Southern California in Response to Closure of San Onofre Nuclear Generating Station (SONGS)” California ISO/MID 101 2014-2015 ISO Transmission Plan February 2, 2015 Table 2.6-8 – Summary of Various Potential Backup Transmission Solutions for the LA Basin / San Diego Area Estimated Potential LCR Benefits (MW) Provides Deliverability of 2500 MW Imperial Zone Sensitivity Renewable Portfolio? 180-mi 1100 MW 500kV DC line from Hoober (IID) to SONGS (SDG&E) 1,062 yes Midway-Inland 500kV* 125-mi 500kV 50% compensated line (if AC line) from Midway (IID) to Devers (SCE) and Valley (SCE) to Inland (SDG&E) 1,022 yes CFE-ISO Tie & MiguelEncina DC Line Combined 102-mi 500kV AC line and 94-mi underground/submarine 1000 MW 500kV bipole DC line to Encina (Upgradeable to 2000 MW in the future with some downsteam 230kV upgrades) 798 yes 3b CFE-ISO Tie & MiguelHB DC Line 29 Combination of a 102-mi 500kV AC line and a 148-mi 1000 MW 500kV bipole DC line to HB; expandable to 2000 MW pending further needs in the future with some downstream 230kV facility upgrades 1,242 yes 3c Staging approach: Phase 1 - CFE-ISO Tie & Laguna Bell Corridor SPS; Phase 2 - MiguelHB DC Line (when further needs arise) Phase 1 - 102-mi second IV Miguel 500kV line with contingencybased SPS 30 for Laguna Bell Corridor; Phase 2 - Miguel-HB DC Line (when further needs arise) 1,242 Phase 1: no Phase 1 and 2: yes 4 TalegaEscondido/ValleySerrano (TE/VS) 500kV Interconnect* About 32-mi of 500kV line connecting SCE’s Alberhill Substation and new Case Springs Substation; Reconductor and install second set of SDG&E’s TalegaEscondido 230kV line; Loop these lines into Case Springs substation 605^ no No Transmission Solutions 1 STEP Hoober-SONGS DC Line 2 3a High-Level Description Notes: * The TE/VS 500kV line concept could provide an alternative route for the Midway-Inland 500kV line concept from Alberhill to Case Springs to Inland provided that a second 500kV line section between Alberhill and Valley Substation is viable. ^ Potentially could be higher if coupled with installation of an SPS for Laguna Bell Corridor (this could be considered for future need beyond the Laguna Bell Corridor Upgrades project) 29 Design to include emergency rating for the second Imperial Valley – Miguel #2 500kV line No loss of load impact since this SPS would only open the breakers of the Mesa 500/230kV transformers to reduce thermal loading impact onto the 230kV system under N-1-1 contingency conditions. 30 California ISO/MID 102 2014-2015 ISO Transmission Plan February 2, 2015 The following figure 2.6-5 provides high-level, not-to-scale, illustrations for the above potential backup transmission options. Figure. 2.6-5 – High-level Illustrations of Potential Backup Transmission Solutions From the preliminary analyses, all of the above potential transmission solutions would provide reliability benefits to the LA Basin / San Diego areas as well potential generation deliverability benefits for the Imperial County. These options help mitigate thermal loading concerns on the Imperial Valley phase shifting transformers, as well as addressing the post-transient voltage instability caused by the overlapping N-1-1 contingencies on the southern San Diego 500kV lines. With any of these transmission upgrades, the next limiting constraint was identified to be the south of Mesa to Laguna Bell 230kV line corridor thermal loading concerns. This has taken into account the Laguna Bell Corridor 230kV upgrades. Although the STEP Hoober-SONGS DC Line alternative provides the reliability and generation deliverability benefits described, it does not provide the flexibility to stage the project depending on when each benefit is needed. It also presents the challenge of siting a new substation near SONGS which appears to be infeasible due to other land uses in the area. The Midway-Inland 500kV alternative provides the reliability and generation deliverability benefits described, and also provides the flexibility to stage the project depending on when each benefit is needed. The TE/VS 500kV line concept could provide an alternative route for the Midway-Inland 500kV line concept from Alberhill to Case Springs to Inland provided that a second 500kV line section between Alberhill and Valley Substation is viable. California ISO/MID 103 2014-2015 ISO Transmission Plan February 2, 2015 The CFE-ISO Tie & Miguel-Encina DC Line and CFE-ISO Tie & Miguel-HB DC Line options provide the reliability and generation deliverability benefits described, and also provide the flexibility to stage the project depending on when each benefit is needed. This staging is described as transmission solution #3c. Based on the preliminary work scope, high-level cost estimates and environmental considerations, the transmission solution #3c (CFE – ISO Tie with Laguna Bell Corridor SPS) appears to provide significant LCR benefits with potential least cost if siting is viable in northern Mexico. This transmission option could be considered a staged transmission approach, with the second phase of installing a new DC submarine cable from Miguel substation to the LA Basin needed to alleviate constraints north of Miguel substation to bring resources from the Imperial area depending on future needs. California ISO/MID 104 2014-2015 ISO Transmission Plan February 2, 2015 Table 2.6-9 – Potential Scope of Works and High-Level Environmental Assessments for the LA Basin / San Diego Area Backup Transmission Solutions No 1 Transmission Solutions High-Level Description Detailed Line Segments STEP HooberSONGS DC Line 180-mi 1100 MW 500kV DC line from Hoober (IID) to SONGS (SDG&E) - Hoober-Devers 500kV DC - Devers-Valley 500kV DC High-Level NonBinding Costs ($ Million) Possible but Challenging Total: $ ~ 2,000 - Valley-Inland 500kV DC - Inland-Talega/SONGS 500kV DC - Midway-Devers 500kV AC or DC (90 mi) 2 Midway-Inland 500kV Line 125-mi 500kV 50% compensated line (if AC line) Challenging Possible but Challenging Challenging $ 386 - 600 (cost for AC line) Possible but Challenging Very Challenging (if overhead line) Possible but Challenging (if underground line) - Valley-Inland 500kV AC or DC (35 mi) - Construct new 230kV line between Escondido - Talega and loop into new Inland substation; reconductor existing Escondido - Talega 230kV line to higher rating CEC/Aspen High-Level Environmental Assessment $1,600 - $1,900 (AC OH line) Challenging Total: $1,986 $2,500 3a CFE-ISO Tie & Miguel-Encina DC Line California ISO/MID Combined 102-mi 500kV AC line and 94mi underground/submarine 1000 MW 500kV bipole DC line to Encina (Upgradeable to 2000 MW in the future) - Second Imperial ValleyMiguel 500kV line traversing CFE service territory (100 mi) $911 - Install third Miguel 500/230kV bank (either at existing substation or at new adjoining substation located adjacent to it (new substation may be required since there is no more real estate for expansion at the existing substation) $150 105 Siting located in Mexico 2014-2015 ISO Transmission Plan No Transmission Solutions High-Level Description February 2, 2015 Detailed Line Segments High-Level NonBinding Costs ($ Million) - New 2-mi double circuit 500kV line connecting Miguel substation to a new southern converter station - New 23-mi of bi-pole 500kV DC line from southern converter station to transition switching station 2-mile from the coast CEC/Aspen High-Level Environmental Assessment Siting located in California but near Mexico $2,645 Possible but Challenging - New 71-mi submarine DC cable connecting southern converter station to Encina substation Total: $3,706 3b CFE-ISO Tie & Miguel-HB DC Line; MAKE SURE TO HAVE EMERGENCY RATING FOR IV-MIGUEL 500kV LINE Combined 102-mi 500kV AC line and 148mi 1000 MW 500kV bipole DC underground/submarine cable to Huntington Beach (Upgradeable to 2000 MW in the future) - Second Imperial ValleyMiguel 500kV line traversing CFE service territory (100 mi) $911 - Install third Miguel 500/230kV bank (either at existing substation or at new adjoining substation located adjacent to it (new substation may be required since there is no more real estate for expansion at the existing substation) $150 - New 2-mi double circuit 500kV line connecting Miguel substation to a new southern converter station Siting located in Mexico Siting located in California but near Mexico $2,850 - New 23-mi of bi-pole 500kV DC line from southern converter station to transition switching station 2-mile from the coast California ISO/MID 106 Possible but Challenging 2014-2015 ISO Transmission Plan No Transmission Solutions High-Level Description February 2, 2015 Detailed Line Segments High-Level NonBinding Costs ($ Million) CEC/Aspen High-Level Environmental Assessment - New 125-mi submarine DC cable connecting southern converter station to Encina substation Total: $3,911 3c CFE-ISO Tie & Miguel-HB DC Line (designed with high emergency rating for the Imperial Valley – Miguel 500kV line) Combined 102-mi 500kV AC line and 148mi 1000 MW 500kV bipole DC underground/submarine cable to Huntington Beach (Upgradeable to 2000 MW in the future) - Second Imperial ValleyMiguel 500kV line traversing CFE service territory (100 mi) $911 - Install third Miguel 500/230kV bank (either at existing substation or at new adjoining substation located adjacent to it (new substation may be required) $150 -Install SPS to open Mesa 500/230kV AA bank(s) under N-1-1 contingencies to avoid overloading on Laguna Bell Corridor 230kV lines (notes: there is no loss of loads associated with this SPS) -Implement Ellis Corridor Upgrades (i.e., terminal equipment upgrades, line clearance mitigation) Under $50 Siting located in Mexico No major siting requirements; works primarily involve installing fiber optics/communi cation lines between substations on existing transmission lines/towers. $30 Total: $1,141 4 TE/VS 500kV Line California ISO/MID Construct 32-mi of 500kV AC line to connect SCE’s Alberhill Substation to new proposed Case Springs Substation (located in the SDG&E service area) - Construct 32-mile of 500kV AC transmission line connecting SCE’s Alberhill Substation to a new proposed Case Springs Substation (vicinity of Camp Pendleton) 107 Total: $850 Serious siting challenges 2014-2015 ISO Transmission Plan Transmission Solutions No High-Level Description February 2, 2015 Detailed Line Segments High-Level NonBinding Costs ($ Million) CEC/Aspen High-Level Environmental Assessment - Upgrade the existing TalegaEscondido 230kV line and loop into Case Springs substation - Construct a new second Talega-Escondido 230kV line and loop into Case Springs substation 2.6.4.3 Findings Based on analysis discussed above, the ISO believes the two best back-up options for addressing a potential resource development shortfall in the LA Basin/San Diego area and providing additional transmission deliverability for potentially higher levels of renewable generation from the Imperial area – the 2500 MW sensitivity scenario - are the following: CFE-ISO Tie-line o If siting is viable in northern Mexico (i.e., CFE service area), the CFE-ISO Tie with Special Protection System concept (with no loss of load impact) under contingency condition provides the lowest cost and high LCR reduction benefits; Midway-Inland For siting in California, the Midway-Inland concept provides the best balance of the options considered for cost, LCR reduction and Imperial renewable delivery benefits, and siting viability. Depending on route selection, undergrounding of transmission line may be required. Further, it provides the most flexibility to stage components (Devers-Inland versus Midway-Devers) to meet the two potential needs, respectively. These alternatives involve challenging rights of way and lengthy permitting and construction timelines. If currently anticipated resources fail to materialize, other short term mitigation plans will need to be considered to provide adequate time for transmission alternatives to be developed. Continued analysis will be required as needs evolve in future planning cycles. California ISO/MID 108 2014-2015 ISO Transmission Plan February 2, 2015 2.7 SCE Local Areas Assessment 2.7.1 Tehachapi and Big Creek Corridor 2.7.1.1 Area Description The Tehachapi and Big Creek Corridor area consists of the SCE transmission system north of Vincent. The area includes the following: • WECC Path 26 — three 500 kV transmission lines between PG&E‘s Midway substation and SCE‘s Vincent substation with Whirlwind 500 kV loop-in to the third line; • Tehachapi area — Windhub – Whirlwind 500 kV, Windhub – Antelope 500 kV, and two Antelope – Vincent 500 kV lines; • 230 kV transmission system between Vincent and Big Creek Hydroelectric project that serves customers in Tulare county; and • Antelope-Bailey 230 kV system which serves the Antelope Valley, Gorman, and Tehachapi Pass areas. There are three major transmission projects that have been approved in prior cycles by the ISO in this area, which are as follows: • San Joaquin Cross Valley Loop Transmission Project (in-service date: 2014); • Tehachapi Renewable Transmission Project (in-service date: 2016); and • East Kern Wind Resource Area 66 kV Reconfiguration Project (completed). 2.7.1.2 Area-Specific Assumptions and System Conditions The Tehachapi and Big Creek area study was performed consistent with the general study methodology and assumptions described section 2.3. The ISO-secured participant portal lists the base cases and contingencies that were studied as part of this assessment. Additionally, specific methodology and assumptions that were applicable to the study area are provided below. Generation Table 2.7-1 lists a summary of the generation in the Tehachapi and Big Creek area, with detailed generation listed in Appendix A. California ISO/MID 109 2014-2015 ISO Transmission Plan February 2, 2015 Table 2.7-1: Tehachapi and Big Creek area generation summary Capacity (MW) Generation Thermal 1,654.1 Hydro 1,201.3 Wind 2,616.1 Solar 1046.0 Total 6,517.5 Load Forecast The ISO summer peak base case assumes the CEC’s 1-in-10 year load forecast and includes system losses. Table 2.7-2 shows the Tehachapi and Big Creek area load in the summer peak assessment cases excluding losses. The ISO summer light load and spring off-peak base cases assume 50 percent and 65 percent of the 1-in-2 year load forecast, respectively. Table 2.7-2: Summer Peak load forecasts modeled in the SCE’s Tehachapi and Big Creek area assessment Tehachapi and Big Creek Area Coincident A-Bank Load Forecast (MW) Substation Load and Large Customer Load (1-in-10 Year) Substation 2016 2019 2024 Antelope-Bailey 220/66 kV 795 809 826 Rector 220/66 kV 848 874 971 Springville 220/66 kV 240 246 257 Vestal 220/66 kV 207 211 217 9 9 9 Big Creek 220/33 kV 2.7.1.3 Assessment and Recommendations The ISO conducted a detailed planning assessment based on the study methodology identified in section 2.3 to comply with the Reliability Standard requirements of section 2.2. Details of the planning assessment results are presented in Appendix B. California ISO/MID 110 2014-2015 ISO Transmission Plan February 2, 2015 2.7.2 North of Lugo Area 2.7.2.1 Area Description The North of Lugo transmission system serves San Bernardino, Kern, Inyo and Mono counties. The figure below depicts the geographic location of the North of Lugo area, which extends more than 270 miles. The North of Lugo electric transmission system comprises 55 kV, 115 kV and 230 kV transmission facilities. In the north, it has inter-ties with Los Angeles Department of Water and Power (LADWP) and Sierra Pacific Power. In the south, it connects to the Eldorado substation through the IvanpahBaker-Cool Water–Dunn Siding-Mountain Pass 115 kV line. It also connects to the Pisgah substation through the LugoPisgah #1 and #2 230 kV lines. Two 500/230 kV transformer banks at the Lugo substation provide access to SCE’s main system. The North of Lugo area can be divided into the following sub-areas: North of Control; South of Control to Inyokern; South of Inyokern to Kramer; South of Kramer; and Victor. 2.7.2.2 Area-Specific Assumptions and System Conditions The North of Lugo area study was performed consistent with the general study methodology and assumptions described in section 2.3. As described in section 2.3, some potentially planned renewable generation projects were modeled. The ISO-secured website lists the base cases and contingencies that were studied as part of this assessment. Additionally, specific methodology and assumptions that were applicable to the study area are provided below. Generation Table 2.7-3 lists a summary of the generation in the North of Lugo area, with detailed generation listed in Appendix A. California ISO/MID 111 2014-2015 ISO Transmission Plan February 2, 2015 Table 2.7-3: North of Lugo area generation summary Capacity (MW) Generation Thermal 1,783 Hydro 100 Solar 700 Geothermal 391 Total 2,974 Load Forecast The ISO summer peak base case assumes the CEC’s 1-in-10 year load forecast. This forecast load includes system losses. Table 2.7-4 shows the North of Lugo area load in the summer peak assessment cases excluding losses. The ISO summer light-load base case assumes 25-30 percent of the 1-in-10 year load forecast. The off-peak base case assumes approximately 60 percent of the 1-in-10 year load forecast. Table 2.7-4: Load forecasts modeled in the North of Lugo area North of Lugo Area Coincident A-Bank Load Forecast (MW) Substation Load and Large Customer Load (1-in-10 Year) Substation 2016 2019 2024 Kramer / Inyokern / Coolwater 220/115 308 328 356 Victor 220/115 899 930 1004 Control 115kV 80 84 95 2.7.2.3 Assessment and Recommendations The ISO conducted a detailed planning assessment based on the study methodology identified in section 2.3 to comply with the Reliability Standard requirements of section 2.2. Details of the planning assessment results are presented in Appendix B. The summer peak and off-peak reliability assessment of the North of Lugo area revealed no reliability concerns. California ISO/MID 112 2014-2015 ISO Transmission Plan February 2, 2015 2.7.3 East of Lugo 2.7.3.1 Area Description The East of Lugo area consists of the transmission system between the Lugo and Eldorado substations. The East of Lugo area is a major transmission corridor connecting California with Nevada and Arizona; a part of Path 46 (West of River), and is heavily integrated with LADWP and other neighboring transmission systems. The SDG&E owned Merchant 230 kV switchyard became part of the ISO controlled grid and now radially connects to the jointly owned Eldorado 230 kV substation. Merchant substation was formerly in the NV Energy balancing authority, but after a system reconfiguration in 2012, it became part of the ISO system. The East of Lugo bulk system consists of the following: • 500 kV transmission lines from Lugo to Eldorado and Mohave; • 230 kV transmission lines from Lugo to Pisgah to Eldorado; • 115 kV transmission line from Cool Water to Ivanpah; and • 500 kV and 230 kV tie lines with neighboring systems. 2.7.3.2 Study Assumptions and System Conditions The East of Lugo area study was performed consistent with the general study methodology and assumptions described in section 2.3. The ISO-secured website lists the base cases and contingencies that were studied as part of this assessment. As described in section 2.3.2.5, some potentially planned renewable generation projects were modeled. In addition, specific assumptions and methodology that applied to the East of Lugo area study are provided below. Transmission Transmission upgrades consisting of the Lugo-Eldorado 500 kV series capacitor and terminal equipment upgrade, Lugo-Mohave 500 kV series capacitor and terminal equipment upgrade and the re-route of Eldorado - Lugo 500 kV line, which were approved as policy-driven upgrades in 2012-2013 ISO Transmission Plan and 2013-2014 ISO Transmission Plan, are modeled in the 2019 and 2024 study cases. In light of the FERC approved Transition Agreement between ISO and Valley Electric Association, the planned interconnection tie between VEA’s newly proposed 230 kV Bob Switchyard and SCE’s new 220 kV Eldorado substation is assumed to be in-service during the year 2017. California ISO/MID 113 2014-2015 ISO Transmission Plan February 2, 2015 Generation There are about 577 MW of existing generation connected to the SDG&E owned Merchant substation and about 400 MW of renewable generation connected to Ivanpah substation. Table 2.7-5 lists the generation in the East of Lugo area with detailed generation listed in Appendix A. Table 2.7-5: Generation in the East of Lugo area Capacity (MW) Generation Thermal 519 Solar (including solar thermal) 451 Total 970 Load Forecast The ISO summer peak base case assumes the CEC’s 1-in-10 year load forecast. This forecast load includes system losses but excludes power plant auxiliary loads in the area. The SCE summer light load base cases assume 50 percent of the 1-in-2 year load forecast. Table 2.7-6 provides a summary of the Eldorado area load in the summer peak assessment. Table 2.7-6: Summer Peak load forecasts modeled in the East of Lugo area assessment Area 2016 2019 2024 East of Lugo and Ivanpah 500/230kV Area (MW) 21.42 34.41 71.26 2.7.3.3 Assessment and Recommendations The ISO conducted a detailed planning assessment based on the study methodology identified in section 2.3 to comply with the Reliability Standard requirements of section 2.2. Details of the planning assessment results are presented in Appendix B. The 2014-2024 reliability assessment of the SCE East of Lugo area resulted in the following reliability concern: In study year 2016, a thermal overload was observed on LADWP’s Lugo-Victorville 500 kV line for the N-1-1 contingency of the loss of Palo Verde—Colorado River 500 kV line followed by the loss of Imperial Valley-North Gila 500kV line. The same overload was also observed in 2024 peak case for the N-1-1 contingency of loss of Lugo-Eldorado 500 kV line followed by the loss of Lugo-Mohave 500 kV line.. The recommended mitigation for this reliability concern is to perform system adjustments after initial contingency that includes bypassing series capacitors per ISO Operating Procedure 6610, dispatching Preferred Resources and Energy Storage (PR&ES). California ISO/MID 114 2014-2015 ISO Transmission Plan February 2, 2015 2.7.4 Eastern Area 2.7.4.1 Area Description The ISO controlled grid in the Eastern Area serves the portion of Riverside County around and to the west of the Devers Substation. The figure below depicts the geographic location of the area. The system is composed of 500 kV, 230 kV and 161 kV transmission facilities from Devers Substation to Palo Verde Substation in Arizona. The area has ties to Salt River Project (SRP), the Imperial Irrigation District (IID), the Metropolitan Water District (MWD), and the Western Area Lower Colorado control area (WALC). The ISO has approved the following major transmission projects in this area in prior planning cycles: • Path 42 Upgrade Project (2015); • West of Devers Upgrade Project (2020); and • Delaney-Colorado River 500 kV line Project (2020). 2.7.4.2 Area-Specific Assumptions and System Conditions The Eastern Area reliability assessment was performed consistent with the general study methodology and assumptions described in section 2.3. The ISO’s secure participant portal lists the base cases and contingencies that were studied. Additionally, specific assumptions and methodology that were applied to the Eastern Area study are provided below. Generation Table 2.7-7 lists a summary of generation in the Eastern area. A detailed list of generation in the area is provided in Appendix A. Table 2.7-7: Eastern area generation summary Capacity (MW) Generation Thermal 1,506 Wind 814 Solar 800* Total 3,120 * The capacity value shown includes generation currently under construction. California ISO/MID 115 2014-2015 ISO Transmission Plan February 2, 2015 Load Forecast The ISO summer peak base cases are based on the CEC 1-in-10 load forecast. The forecast load includes system losses. Table 2.7-8 provides a summary of the Eastern Area coincident substation load used in the summer peak assessment. The summer light load and spring off-peak base cases assume 50 percent and 65 percent of the 1-in-2 peak load forecast, respectively. Table 2.7-8: Summer Peak load forecasts modeled in the Eastern Area assessment Eastern Area Coincident Load Forecast (MW) Substation Load (1-in-10 Year) Substation 2016 2019 2024 71 75 82 Camino 2 2 2 Devers 482 497 521 2 2 2 445 463 495 1002 1039 1101 Blythe Eagle Mountain Mirage Total Base Case Scenarios Table 2.7-9 provides additional details regarding the system conditions modeled in the Eastern Area assessment. Table 2.7-9: Additional Eastern Area Study Assumptions Study Case MWD Pumps Online Blythe Unit Status 2016 Summer Peak 8 pumps/station All units on 2019 Summer Peak 8 pumps/station All units off 2024 Summer Peak 8 pumps/station All units on 2016 Summer Off-Peak 0 pumps/station All units on 2019 Light Load 0 pumps/station All units off California ISO/MID 116 2014-2015 ISO Transmission Plan February 2, 2015 2.7.4.3 Assessment and Recommendations The ISO conducted a detailed planning assessment based on the study methodology identified in section 2.3 to comply with the Reliability Standard requirements of section 2.2. Details of the planning assessment results are presented in Appendix B. The 2015-2024 reliability assessment for the SCE Eastern Area identified the following reliability concern that requires mitigation. Overlapping outages of the Julian Hinds-Mirage 230 kV line and the Julian Hinds 230 kV shunt reactor were found to cause high voltages in the vicinity of the Buck Boulevard Substation when area pumps and generators are offline. Opening the Buck Boulevard gen-tie mitigated the high voltage problem. SCE is developing operating procedures for maintaining voltages in the area within limits under these conditions. The procedures will include opening the Buck Boulevard gen-tie as needed when Blythe is not available. Request Window Proposals The ISO has received the following project proposal in the Eastern area through the 2014 Request Window in connection with the reliability issue identified above. Buck-Colorado River-Julian Hinds Loop-in Project The project was submitted by Blythe Energy Inc. and consists of looping the existing private Buck Boulevard-Julian Hinds 230 kV generation tie line into the Colorado River substation. The project creates a new 230 kV networked facility between Colorado River and Julian Hinds and moves the point of connection of the Blythe generation facility to Colorado River. The project has an estimated cost of $150 million including the cost of the networked portion of the existing line. The proposed in-service date is December 31, 2020. ISO Assessment of Request Window Proposals Buck-Colorado River-Julian Hinds Loop-in Project As explained above, the operating procedure SCE is developing will address the reliability issue identified in the area. As a result, the ISO did not identify a reliability need for the Buck-Colorado River-Julian Hinds Loop-in Project in the current planning cycle. The ISO will revisit the concept in future reliability assessment, generation interconnection or other transmission planning processes. 2.7.4.4 Recommendations The ISO conducted a detailed planning assessment for the SCE Eastern area to comply with the Reliability Standard requirements of section 2.2 and makes the following recommendations to address the reliability concerns identified: An operating solution is recommended to mitigate the Category C (N-1/N-1) high voltage concern identified in the Julian Hinds area when area pumps and generators are off line. SCE is developing an operating procedure that will include opening the Buck Boulevard generation tieline as needed to maintain voltages in the area within acceptable limits when the Blythe generation facility is out-of-service. California ISO/MID 117 2014-2015 ISO Transmission Plan February 2, 2015 2.7.5 Los Angeles Metro Area 2.7.5.1 Area Description The Los Angeles Metro area consists of SCE owned 500 kV and 230 kV facilities that serve major metropolitan areas in the Orange, Riverside, San Bernardino, Los Angeles, Ventura and Santa Barbara counties. The boundary of LA Metro area is marked by the Vincent, Lugo and Devers 500 kV substations. The bulk of SCE load as well as most Southern California coastal generation is located in the LA Metro area. The ISO has approved the following major transmission projects in this area in prior planning cycles: • Mesa 500 kV Loop-In Project (2020); • West of Devers Upgrade Project (2020); • Orange Country Dynamic Reactive Support (2018); • Method of Service for Alberhill 500/115 kV Substation (2018); and • Method of Service for Wildlife 230/66 kV Substation (2020). The San Onofre Nuclear Generating Station (SONGS), which had an installed capacity of 2,246 MW, was retired in 2013. Also, a total of about 6,100 MW of generation in the Metro Area is expected to retire by the end of 2020 to comply with the State Water Resources Control Board (SWRCB) once-through cooling (OTC) regulations. In the 2012 LTPP Track 1 and Track 4 decisions, the CPUC authorized SCE to procure between 1900 and 2500 MW of local capacity in the LA Basin area and up to 290 MW in the Moor Park area to offset the retirements of SONGS and OTC generation. At the time of this study the actual amount, location and type of the authorized local capacity additions was not available, so proxy resources were used to model the local capacity additions. 2.7.5.2 Area-Specific Assumptions and System Conditions The Metro area study was performed consistent with the general study methodology and assumptions described in section 2.3. The ISO-secure participant portal lists the base cases and contingencies that were studied as part of this assessment. In addition, specific assumptions and methodology that were applied to the Metro area study are provided below. Generation Table 2.7-10 lists a summary of the existing generation in the Metro area, with detailed generation listed in appendix A. California ISO/MID 118 2014-2015 ISO Transmission Plan February 2, 2015 Table 2.7-10: LA Metro area existing generation summary Capacity (MW) Generation Thermal 12,046 Hydro 319 Nuclear 0 Biomass 120 Total 12,475 OTC generators were assumed to retire per their respective compliance dates. In the 2024 summer peak case, SONGS and OTC replacement capacity consistent with the amounts authorized in the CPUC LTTP Track 1 and Track 4 decisions was modeled. The modeling assumptions for the authorized local capacity additions are summarized in section 2.6. These assumptions will be revisited in the next planning cycle based on the results of SCE’s procurement process. Load Forecast The summer peak base cases assume the CEC 1-in-10 year load forecast, which includes system losses. Table 2.7-11 provides a summary of the Metro area substation load used in the summer peak assessment. The summer light load and spring off-peak base cases assume 50 percent and 65 percent of the coincident 1-in-2 year load forecast, respectively. California ISO/MID 119 2014-2015 ISO Transmission Plan February 2, 2015 Table 2.7-11: Summer Peak load forecasts modeled in the LA Metro area assessment LA Metro Area Coincident A-Bank Load Forecast (MW) Substation Load (1-in-10 Year) Substation California ISO/MID 2016 2019 2024 Alamitos 220/66 191 196 210 Alberhill 500/115 -- 378 434 Barre C 220/66 727 736 753 Center B 220/66 477 483 493 Chevmain 220/66 167 168 169 Chino S 220/66 757 790 840 Del Amo C 220/66 568 595 628 Eagle Rock 220/66 274 306 335 El Casco 220/115 139 144 154 El Nido 220/66 409 422 436 Ellis C 220/66 659 679 706 Etiwanda Ameron 18 18 18 Etiwanda W 220/66 709 740 851 Goleta 220/66 321 329 345 Goodrich 220/33 338 344 354 Gould 220/66 156 162 174 Hinson C 220/66 383 388 400 Johanna B 220/66 455 481 513 La Cienega 220/66 520 534 567 La Fresa B 220/66 734 775 827 Laguna Bell 287 289 292 Lewis 220/66 654 681 718 Lighthipe DEF 220/66 482 492 509 Mesa 220/66 667 682 714 Mira Loma 220/66 724 750 800 120 2014-2015 ISO Transmission Plan February 2, 2015 LA Metro Area Coincident A-Bank Load Forecast (MW) Substation Load (1-in-10 Year) Substation 2016 2019 2024 Moorpark C 220/66 840 879 933 Olinda 220/66 401 413 428 Padua 220/66 694 712 743 Rio Hondo 220/66 764 787 832 Riverside 708 737 442 San Bernardino 220/66 655 692 735 Santa Clara 220/66 492 540 652 Santiago C 220/66 839 883 938 Saugus C 220/66 839 900 970 Valley AB 500/115 809 860 939 Valley D 500/115 1,036 747 831 Vernon 207 210 212 Vestal 220/66 207 211 217 Viejo 220/66 366 374 379 Villa Park B 220/66 713 721 734 Vista 220/115 246 255 278 Vista A 220/66 265 274 292 Walnut 220/66 663 677 694 Wilderness 220/66 -- -- 344 Preferred Resources Preferred resources were modeled in the base cases consistent with the study plan. These include the following: • • • • Additional Achievable Energy Efficiency (AAEE) based on the CEC Low-Mid AAEE projection Distributed generation based on the CPUC Commercial-Interest RPS Portfolio existing emergency demand response (DR) programs based on the average load impact estimates in the study plan as allocated to substations by SCE proxy CPUC 2012 LTPP Track 1 and Track 4 Energy Storage (ES), Solar PV, DR, and EE resources California ISO/MID 121 2014-2015 ISO Transmission Plan February 2, 2015 With the exception of energy efficiency, which was modeled in the base cases, preferred resources were not used in the initial base cases and were considered as potential mitigation once reliability issues were identified. See section 2.6 for details of preferred resource assumptions. 2.7.5.3 Assessment and Recommendations The ISO conducted a detailed planning assessment based on the study methodology identified in section 2.3 to comply with the Reliability Standard requirements of section 2.2. Details of the planning assessment results are presented in Appendix B. The reliability assessment identified several system performance concerns listed below in the Metro area under Category B and C contingencies as well as potential mitigations. 2016 Summer Off-Peak Case Voltage deviation (rise) in the El Casco 230/115 kV system exceeded 5 percent on outage of the El Casco-San Bernardino 230 kV line. The ISO recommends temporary exception for the contingency from the Category B voltage deviation standard until the West-of-Devers Project is in service. 2016 Summer Peak case The Mira Loma 500/230 kV #4 transformer overloaded on overlapping (L-1/L-1) outage of Lugo Rancho Vista and Mira Loma–Serrano 500 kV lines in the 2016 and 2019 summer peak cases. The overload is mitigated by closing the existing Mira Loma-Rancho Vista 500 kV tie after the second contingency. The transformer has adequate short-term rating to support the post contingency loading until the system re-adjustment can be performed. 2019 Summer Peak case The Ellis-Santiago 230 kV line overloaded on overlapping outage (L-1/L-1) of Ellis-Johanna 230 kV and Imperial Valley-North Gila 500 kV lines. The thermal overload is mitigated by dispatching local capacity resources in the San Diego area after the initial contingency including the resources authorized for the San Diego area under the 2012 LTPP, which are modeled in the 2019 summer peak case. The thermal overload will be a concern if the San Diego area CPUC authorized local capacity resources are not in place prior to the summer peak following the December 31, 2017 retirement date of the Encina generation station. In the 2013-2014 Transmission Plan the ISO proposed to re-evaluate in this planning cycle the need for the Ellis Corridor Upgrade Project, which was submitted by SCE to address the loading concern on the Ellis-Santiago and Ellis-Johanna lines. The current assessment did not indicate the need for the project provided the CPUC authorized local capacity resources for the San Diego area are in place prior to the summer peak following the December 31, 2017 retirement date of the Encina generation station. 2024 Summer Peak case The Mesa-Laguna Bell No. 1 & No. 2 and the Mesa-Lighthipe 230 kV lines overloaded under Category B (L-1, G-1/L-1) and multiple Category C (L-2, N-1/N-1) conditions. The Laguna Bell California ISO/MID 122 2014-2015 ISO Transmission Plan February 2, 2015 Corridor Upgrade Project was submitted by SCE to address the loading concerns. A description of the project and the results of the ISO’s evaluation are presented later in this section. The Vincent 500/230 kV #1 transformer overloaded on overlapping outage (T-1/L-1) of the Vincent 500/230 kV No. 4 transformer and the Vincent-Mesa 500 kV line. The thermal overload is mitigated by closing the Vincent 230 kV bus-tie after the initial or second contingency. The transformer has adequate short-term rating to support the post contingency loading until the system re-adjustment can be performed. The Serrano 500/230 kV transformers overloaded on overlapping outages (T-1/T-1) involving two Serrano 500/230 kV transformers with all available conventional generation fully used. The thermal overload is mitigated by utilizing available preferred resources such as distributed generation, energy storage and demand response after the first contingency. Request Window Proposals The ISO received proposal for the following reliability project in the Metro area through the 2014 Request Window. Laguna Bell Corridor Upgrade Project The project will upgrade Mesa-Laguna Bell No. 1 and No. 2 (future) and Mesa–Lighthipe 230 kV lines to their conductor rating. Table 2.7-12 provides the ratings of the lines before and after the Laguna Bell Corridor Upgrade. The scope of the work includes replacing certain terminal equipment at Laguna Bell and Lighthipe substations and removing clearance limitations on a total of two transmission spans. The project was proposed by SCE to address the thermal overloads identified. The estimated cost of the project is $5 million. The proposed in-service date is December 31, 2020. Table 2.7-12: Pre and post Laguna Bell Corridor Upgrade line ratings Pre-project ratings (MVA) Post-project ratings (MVA) Rating increase (%) Normal 4-hour Normal 4-hour Normal 4-hour Mesa–Laguna Bell #1 230 kV 988 988 988 1335 0% 35% Mesa–Laguna Bell #2 230 kV 988 988 988 1335 0% 35% Mesa–Lighthipe 230 kV 956 1012 988 1335 3% 32% Transmission Line California ISO/MID 123 2014-2015 ISO Transmission Plan February 2, 2015 ISO Assessment of Request Window Proposals Laguna Bell Corridor Upgrade Project Table 2.7-13 provides loading of Mesa–Laguna Bell No. 1 and No. 2 and Mesa–Lighthipe 230 kV lines before and after the Laguna Bell Corridor Upgrade Project. The project, along with the use of available preferred and storage resources in one case, addresses the thermal overloads on all three lines under all conditions. Table 2.7-13: Pre and post Laguna Bell Corridor Upgrade line loadings 2024 summer peak loading (%) Transmission line Contingency type Preproject Postproject Post-project with available preferred resources B(L-1) 102% 76% N/A B(G-1/L-1) 111% 82% N/A C(L-2) 128% 95% N/A C(L-1/L-1) 137% 102% <100% B(G-1/L-1) 101% 75% N/A C(L-2) 106% 79% N/A C(L-1/L-1) 110% 81% N/A C(L-2) 107% 81% N/A Mesa–Laguna Bell #1 230 kV Mesa–Laguna Bell #2 230 kV Mesa–Lighthipe 230 kV Considering the scope and cost of the project, its effectiveness in addressing the constraints identified as well as the impact the bottleneck has on long-term LCR and DG deliverability amounts the ISO is evaluating in the current planning cycle, the Laguna Bell Corridor Upgrade Project is recommended for approval in the current planning cycle. Recommendations The ISO conducted a detailed planning assessment for the LA Metro area to comply with the Reliability Standard requirements of section 2.2 and makes the following recommendations to address the reliability concerns identified: • The Laguna Bell Corridor Upgrade Project is recommended for approval to address Category B and C thermal overloads on Mesa-Laguna Bell No. 1, Mesa–Laguna Bell No. 2 and Mesa–Lighthipe 230 kV lines. The project has an estimated cost of $5 million and will enable the system to get the full value of the approved Mesa Loop-In Project. The California ISO/MID 124 2014-2015 ISO Transmission Plan February 2, 2015 required in service date for the project is December 31, 2020 to coincide with the commissioning of the Mesa 500 kV substation. • As proposed in the 2013-2014 Transmission Plan, the ISO re-evaluated the need for the Ellis Corridor Upgrade Project which was submitted last year to address loading concerns associated with the Ellis-Santiago and Ellis-Johanna 230 kV lines. The assessment did not indicate the need for the project due to the local capacity additions that were authorized for the San Diego area. Thermal loading of the Ellis-Santiago 230 kV line will be a concern if the bulk of the authorized resources for the San Diego area are not in place prior to the summer following the retirement date of the Encina generation facility. • Available preferred resources such as distributed generation, energy storage and demand response were used to mitigate Category C (N-1/N-1) thermal overloads on the Serrano 500/230 kV transformers and the upgraded Mesa-Laguna Bell #1 230 kV line. • Temporary exception from the Category B voltage deviation standard is recommended for voltage deviations in the El Casco 230/115 kV system associated with the San Bernardino-El Casco contingency until the West-of-Devers Project is in service. • Operating solutions are identified to address Category C (N-1/N-1) thermal overloads on 500/230 kV transformers at Vincent and Mira Loma substations. The transformers have adequate short-term rating to support the post-contingency loading until system readjustment can be performed. There are considerable uncertainties that can impact, in particular, the longer-term assessment results including uncertainties associated with the assumed authorized local capacity additions, AAEE, distributed generation and demand response. The assessment will be updated in the next planning cycle based on the latest available information. California ISO/MID 125 2014-2015 ISO Transmission Plan February 2, 2015 2.8 Valley Electric Association Local Area Assessment 2.8.1 Area Description The existing Valley Electric Association (VEA) system consists of a 138 kV system that originates at the Amargosa Substation and extends to the Pahrump Substation and then continues into the VEA service area, the Pahrump-Mead 230 kV line, and a 230 kV transmission line from NVE’s Northwest 230 kV substation to Desert View to Pahrump. This line provides a second 230 kV source into VEA’s major system substation at Pahrump and forms a looped 230 kV supply source. With this new 230 kV line in service, the VEA system now has four transmission tie lines with its neighboring systems, which are as follows: • Amargosa-Sandy 138 kV tie line with WAPA; • Jackass Flats-Lathrop Switch 138 kV tie line with Nevada Energy (NVE); • Mead-Pahrump 230 kV tie with Western Area Power Administration (WAPA); and • Northwest-Desert View 230 kV tie-line with NVE. 2.8.2 Area-Specific Assumptions and System Conditions The VEA area study was performed consistent with the general study methodology and assumptions described in section 2.3. The ISO-secured participant portal lists the base cases and contingencies that were studied as part of this assessment. In addition, specific assumptions and methodology that were applied to the VEA area study are described below. Transmission In light of the FERC approved Transition Agreement between the ISO and VEA, the following major transmission projects were modeled in this planning cycle. • VEA is planning a new 138 kV line from Charleston to Vista. This line will provide a looped supply source to the Charleston and Thousandaire substations, which constitute approximately one third of VEA’s load and are currently radially supplied from Gamebird 138 kV substation. This line is expected to be in service by 2015. • A new transmission interconnection tie between the VEA newly proposed 230 kV Bob Switchyard and the SCE new 220 kV Eldorado substation is planned by VEA and SCE and is assumed to be in service in 2017. • A new Innovation-Mercury 138 kV transmission line and the Innovation 230/138-kV substation (formerly referred to as Sterling Mountain), which has been interconnected with the Desert View-Pahrump 230 kV line. California ISO/MID 126 2014-2015 ISO Transmission Plan February 2, 2015 Generation There is no existing generation in the Valley Electric Association system. Load Forecast The VEA summer peak base case assumes the CEC’s 1-in-10 year load forecast. This forecast load includes system losses in the area. The VEA summer light load and off-peak base cases assume 35 percent and 50 percent of the 1-in-10 year load forecast, respectively. Table 2.8-1 provides a summary of the VEA area loads modeled in the Valley Electric Association area assessment. Table 2.8-1: Summer Peak load forecasts Substation Valley Electric Association area (MW) 2015 2018 2023 147 152 161 2.8.3 Assessment and Recommendations The ISO conducted a detailed planning assessment based on the study methodology identified in section 2.3 to comply with the Reliability Standard requirements of section 2.2. Details of the planning assessment results are presented in Appendix B. The reliability assessments identified various reliability concerns that require mitigation in the current planning cycle. The ISO recommends the following mitigations to ensure secure power transfer and adequate load serving capability of the transmission system: • operate VEA 138 kV system radially after the first N-1 for Category C3 issues; • congestion management or operational action plan for Bob-Mead 230 kV overload; • set the UVLS to monitor the HV side OR lock LTCs of VEA transformer banks after the first N-1 contingency for Category C3 issues; and • voltage deviation exception. California ISO/MID 127 2014-2015 ISO Transmission Plan February 2, 2015 2.9 San Diego Gas & Electric Local Area Assessment 2.9.1 Area Description SDG&E is an investor-owned utility that provides energy service to 3.4 million consumers through 1.4 million electric meters and more than 840,000 natural gas meters in San Diego and southern Orange counties. The utility’s service area encompasses 4,100 square miles from Orange County to the US-Mexico border, 31 covering two counties and 27 cities. The SDG&E system, including its main 500/230 kV system and 138/69 kV sub-transmission system, uses imports and internal generation to serve the area load. The geographical location of the SDG&E system is shown in the adjacent illustration. The existing points of import are the South of San Onofre (SONGS) transmission path, the Imperial Valley 500/230 kV substation, and the Otay Mesa-Tijuana 230 kV transmission line. The SDG&E 500 kV system consists of the 500 kV Southwest Power Link (North Gila-Imperial Valley- Miguel) and the 500 kV Sunrise Power Link (Imperial Valley- Suncrest). Its 230 kV system extends from the Talega substation in Orange County and SONGS substation in the north to the Otay Mesa Substation in the south near the US-Mexico border and to the Suncrest and Imperial Valley substations in the east. 230 kV transmission lines form an outer loop located along the Pacific coast and around downtown San Diego. The SDG&E sub-transmission system consists of 138 kV and 69 kV transmission systems underlies the SDG&E 230 kV system from the San Luis Rey 230/138/69 kV Substation in the north to the South Bay (Bay Blvd) and Miguel substations in the south. There is also a radial 138 kV arrangement with seven substations interconnected to the Talega 230/138/69 kV Substation in southern Orange County. Rural customers in the eastern part of San Diego County are served exclusively by a 69 kV system and often by long lines with low ratings. 2.9.2 Area-Specific Assumptions and System Conditions The SDG&E area study was performed in accordance with the general study assumptions and methodology described in section 2.3. The ISO-secured website lists the study base cases and the contingencies that were evaluated as a part of this assessment. In addition, specific assumptions and methodology that applied to the SDG&E area study are provided below. Generation The studies performed for the heavy summer conditions assumed all available internal generation was being dispatched at full output. Category B contingency studies were also performed for one generation plant being out-of-service. The single generator contingencies 31 These numbers are provided by SDG&E in the 2011 Transmission Reliability Assessment California ISO/MID 128 2014-2015 ISO Transmission Plan February 2, 2015 were assumed to be the whole Otay Mesa Energy Center, TDM Power Plant or Palomar Energy Center. These three power plants are combined-cycle plants; therefore, there is a significant probability of an outage of the whole plant. In addition to these generators, other generator outages were also studied. Existing generation included all five Encina steam units and one gas turbine, which were assumed to be available during peak loads in the 2016 base cases, but retired by the end of 2017 in light of the OTC schedule. A total of 965 MW of Encina generating capacity can be dispatched based on the maximum capacity of each generating unit. Palomar Energy Center is owned by SDG&E and it began commercial operation in April 2006. This plant is modeled at 565 MW for the summer peak load reliability assessment. The combined cycle Otay Mesa power plant started commercial operation in October 2009. It was modeled in the studies with the maximum output of 603 MW. There are several combustion turbines in San Diego. Cabrillo II owns and operates all but two of the small combustion turbines in SDG&E’s territory. QFs were modeled with the total output of 175 MW. Power contract agreements with the QFs do not obligate them to generate reactive power. Therefore, to be conservative, all QF generation explicitly represented in power flow cases was modeled with a unity power factor assumption. Existing peaking generation modeled in the power flow cases included the following: Calpeak Peakers located near Escondido (45 MW), Border (45 MW), and El Cajon (45 MW) substations; two Larkspur peaking units located next to Border Substation with summer capacity of 46 MW each; two peakers owned by MMC located near Otay (35.5 MW) and Escondido (35.5 MW) substations and two SDG&E peakers at Miramar Substation (MEF) (46 MW each). New peaking generation modeled in the studies included Orange Grove peakers and El Cajon Energy Center. The Orange Grove project, composed of two units (100 MW total), is connected to the 69 kV Pala Substation and started commercial operation in 2010. The El Cajon Energy Center, composed of one 48 MW unit, is connected to the 69 kV El Cajon Substation and started commercial operation in 2010. Renewable generation included in the model for all the study years are the 50 MW Kumeyaay Wind Farm that began commercial operation in December 2005, the 26 MW Borego Solar that started commercial operation in January 2013, the 265 MW Ocotillo Express wind farm that became operational in December 2012, and a total of 280 MW PV solar generation that were installed by the end of 2013 with power injected into Imperial Valley 230 kV substation. Lake Hodges pump-storage plant (40 MW) is composed of two 20 MW units. Both units are operational as of summer of 2012. Additional renewable generation was modeled based on CPUC’s Commercial Interest Portfolio maintaining the 33 percent renewables portfolio standard and generation interconnection agreement status. In addition to the generation plants internal to San Diego, 1,127 MW of existing thermal power plants is connected to the 230 kV bus of the Imperial Valley 500/230 kV substation. SONGS has been permanently retired and was not modeled in the base cases. California ISO/MID 129 2014-2015 ISO Transmission Plan February 2, 2015 In the LTPP Track 1 and Track 4 decisions, the CPUC authorized SDG&E to procure 900 MW of gas-fired resources and 200 MW of Preferred Resource Energy storage in the San Diego area to partially the retirement of SONGS and OTC generation. Table 2.9-1 lists a summary of the generation under ISO operational control in the San Diego-IV area covering Imperial Valley, ECO, Ocotillo, Liebert, HDWSH, and Hassayampa areas, with detailed generation listed in Appendix A. Table 2.9-1: SDG&E area generation summary Capacity (MW) Generation 2016 2019 2024 4,278 3913 3913 Hydro 40 40 40 Wind 415 584 584 Solar 923 1183 1183 Biomass 27 27 27 5,806 5870 5870 Thermal Total Load Forecast Loads within the SDG&E system reflect a coincident peak load for 1-in-10-year forecast conditions with Low-Mid AAEE projected. The load for 2016 was assumed at 5,204 MW, and transmission losses were 176 MW. The load for 2019 was assumed at 5,320 MW, and transmission losses were 177 MW. The load for 2024 was assumed at 5,344 MW, and transmission losses were 198 MW. SDG&E substation loads were assumed according to the data provided by SDG&E and scaled to represent assumed load forecast. The total load in the power flow cases was modeled based on the load forecast by the CEC. Table 2.9-2 summarizes load in SDG&E and the neighboring areas and SDG&E import modeled for the study horizon. California ISO/MID 130 2014-2015 ISO Transmission Plan February 2, 2015 Table 2.9-2: Load, losses and import modeled in the SDG&E studies 2016 2019 2024 PTO Load/Import Losses Load/Import Losses Load/Import Losses MW MW MW MW MW MW SDG&E 5,204 176 5,320 177 5,344 198 SCE 25,345 423 25,935 441 26,849 599 IID 1119 64 1,240 77 1344 84 CFE 2,631 47 2,870 35 2640 36 SCE Import 11,177 - 9,939 - 12,221 - SDG&E Import 1,400 - 1,499 - 1,170 - IID Import 545 - 780 - 780 - CFE Import 0 0 0 Power flow cases for the study modeled a load power factor of 0.992 lagging at nearly all load buses in 2019 and 2024. The number was used because Supervisory Control and Data Acquisition (SCADA)-controlled distribution capacitors are installed at each substation with sufficient capacity to compensate for distribution transformer losses. The 0.992 lagging value is based on historical system power factor during peak conditions. The exceptions listed below were modeled using power factors indicative of historical values. • Naval Station Metering (bus 22556): 0.707 lagging (this substation has a 24 MVAr shunt capacitor); and • Descanso (bus 22168): 0.901 leading. This model of the power factors was consistent with the modeling by SDG&E for planning studies. Periodic review of historical load power factor is needed to ensure that planning studies use realistic assumptions. Energy Efficiency Additional Achievable Energy Efficiency (AAEE) was also assumed and modeled for the studies. These assumptions are consistent with the assumptions from the CPUC Long Term Procurement Plan Track 4 studies. Table 2.9-3 summarizes the AAEE assumed for the SDG&E local area. California ISO/MID 131 2014-2015 ISO Transmission Plan February 2, 2015 Table 2.9-3: Projected Additional Achievable Energy Efficiency PTO SDG&E 2016 2019 2024 AAEE AAEE AAEE -81 -184 -338 2.9.3 Assessments and Recommendations The ISO conducted a detailed planning assessment based on the study methodology identified in section 2.3 to comply with the Reliability Standard requirements of section 2.2. Details of the planning assessment results are presented in Appendix B. In response to the ISO study results and proposed alternative mitigations, 9 reliability project submissions were received through the 2014 Request Window. Out of these projects, some were alternatives for solving the SDG&E local transmission system problems or targeting the Southern California Bulk Transmission System. The ISO investigated various transmission upgrade mitigations including alternatives, and recommends or concurs with a total of six transmission network upgrade projects to address identified local reliability concerns in the SDGE transmission system, which are summarized below and described in greater detail in Appendix A. The ISO reliability assessment for the SDG&E area identified various thermal overload concerns on its Southwest Powerlink (SWPL), Sunrise Powerlink (SPL) systems and its neighboring CFE system under various Category B or Category C contingencies before and after the Imperial Valley phase shifting transformers project is in service. The phase shifting transformers project was approved by the ISO in the 2013-2014 transmission planning process with estimated inservice date no later than June 2018. In the short term before the phase shifting transformers project is in service, the ISO recommends to mitigate the thermal overload and post-transient voltage instability concerns by relying on the following operational solutions: • • • modify and enable the existing SDG&E 230kV TL23040 Otay Mesa-Tijuana SPS that is currently disabled in coordination with CFE to address the thermal overloads on Otay Mesa-Tijuana and Imperial Valley-La Rosita 230 kV tie-lines with CFE; normally by-pass series cap banks on North Gila-Imperial Valley 500 kV line to partially ease the power flow stress on the two 230 kV ties with CFE under Category B and C outages Congestion Management Process and Operation Procedure to adjust system in the San Diego-IV and LA Basin areas to prepare for the next contingency after the first outage in SWPL and SPL to prevent the voltage instability concern in the SDG&E and LA Basin areas or Path 44 South SONGS Safety Net taking action to shed load in the SDG&E area. California ISO/MID 132 2014-2015 ISO Transmission Plan February 2, 2015 With the phase shifting transformers in service, thermal overload concerns on the SWPL and SPL systems are primarily attributed to the phase shifting transformers project at Imperial Valley after the San Onofre nuclear power plant retirement and the Encina Power Plant retirement as part of the OTC plan. The overload concerns will be alleviated if SDG&E and SCE receive CPUC approval for their requested local resource procurement plans based on LTPP Track 1 and Track 4 authorizations. The ISO, SDG&E and CFE have agreed in concept on the general operation of the phase shifting transformer project at Imperial Valley 230 kV substation. With the phase shifting transformers in-service, the ISO recommends, the following additional operational solutions: • • • • • • • normally by-pass series cap banks on SWPL and SPL 500 kV lines to eliminate potential overloads on SWPL/SPL 500 kV lines, Miguel 500/230 kV banks, Suncrest 500/230 kV banks, and Suncrest-Sycamore 230 kV lines for Category B and C outages in the SWPL and SPL systems; modify existing Miguel BK80/81 SPS to open Miguel 500/230 kV bank for other bank outage; add Suncrest BK80/81 SPS to open Suncrest 500/230 kV bank for outage of its twin bank; modify newly proposed Suncrest-Sycamore 230 kV SPS to open Suncrest-Sycamore 230 kV line for outage of its twin 230 kV line; modify existing Imperial Valley 500/230 kV SPS or rely on operating procedures to address thermal overload concerns for the various Category C outages including CB8022 circuit breaker failure or internal fault; eliminate or modify the CFE internal SPS that may cross trip the Otay Mesa-Tijuana or Imperial Valley-La Rosita 230 kV lines following the overlapping outages of the SWPL and SPL line segments; and use available generation resources including all Preferred Resources and Energy Storage to be approved by CPUC by relying on congestion management process and operation procedure to adjust system in the San Diego-IV and LA Basin areas in concert with CFE, to prepare for next contingency after the first outage in SWPL and SPL — these actions are needed to prevent voltage instability in the Southern California Bulk System or South of SONGS Safety Net taking action to shed load in the SDG&E area. The ISO will continue work with SDG&E to investigate the load flow concerns in the eastern backcountry 69 kV system and to address voltage concern by adopting higher voltage deviation criteria on a case-by-case basis. Below are the four transmission network upgrade projects to address the local SDG&E reliability concerns that the ISO recommends in the 2014-2015 transmission planning process. In addition, the ISO concurs with two load service interconnection projects requested by SDG&E to accommodate load growth in its distribution system. California ISO/MID 133 2014-2015 ISO Transmission Plan February 2, 2015 TL692, Las Pulgas-Japanese Mesa 69 kV line re-conductor The project will upgrade TL692 to achieve 102 MVA rating as soon as possible to address the TL692 overload for a Category C contingency of a simultaneous loss of TL23052 and TL23007 (L-2). The ISO notes that TL 692 is part of SDG&E’s wood-to-steel fire hardening project with proposed in-service date of 2018, in which SDG&E would otherwise replace the aged wood pole structures with steel poles and re-wire TL692 in utility standard conductor. Existing Talega 138/69 kV Bank SPS has not been adequate to cover the overload since Talega Bank #50 was upgraded to 120 MVA from 25 MVA in early 2014. The estimated cost of the project is $25.9 million~$28.5 million. The projected in-service date is June 1, 2016. 2nd Pomerado–Poway 69kV Circuit The project scope includes building 2nd Pomerado-Poway 69 kV circuit rated at 145/174 MVA for normal and emergency conditions along with expansion of TL6913 right-of-way. Recent Palomar Energy Center outage history (2011-2014) reported a total of 5 forced plant outages, which makes this combined cycle power plant qualified as a credible G-1 event based on the ISO Planning Standards. The project eliminates the TL6913 Poway-Pomerado 69 kV line overload for a Category B event of Palomar Power Plant out of service followed by SycamoreArtesian 230 kV line contingency (G-1/L-1) and various Category C3/C5 overloads, and mitigates a Category C3 overload on TL634 Poway-Escondido 69 kV line associated with the TL6913 outage. The estimated cost of the project is $17 million~$19 million. The proposed inservice date is June 1, 2016. Mission-Penasquitos 230 kV Circuit TL13810 Friars-Doublet Tap 138 kV line is expected to be overloaded for a L-1-1 contingency of losing Old Town-Penasquitos and Sycamore Canyon-Penasquitos 230 kV lines, which violates ISO Planning Standards for high density urban load area. The limiting component for TL13810 is a two-mile section out of the 12.6-mile TL13810 that could be upgraded to achieve 204 MVA with cost less than $5 million. However, the ISO recommends building Mission-Penasquitos 230 kV circuit by using a de-energized portion of TL23001 after Sycamore Canyon-Pensaquito 230 kV project is in-service and building a new 230 kV section to access Penasquitos 230 kV substation from Penasquitos junction. The ISO evaluated both alternatives and considered the Mission-Penasquitos 230 kV project a more cost-effective mitigation in the long run. The project is superior in its capability to improve load flow performance for the SDGE 230 kV transmission system compared to the TL13810 Friars-Doublet Tap 138 kV line upgrade project, and will further postpone a potential overload on TL6916 Sycamore-Scripps 69 kV line. The project is also in line with SDG&E’s long term strategy to eliminate its 138 kV system. The estimated cost of the project is about $22.8 million~$25.5 million. The proposed in-service date is June 1, 2019. TL632 Granite Loop-In and TL6914 reconfiguration The project scope is to remove Granite Tap by loop-in of TL632 to Granite Sub and reconfigure TL6914 to terminate between Miguel and Loveland. One of two 69 kV lines between Granite and Granite Tap needs to be built underground to avoid potential L-2 overload issue on TL631 El Cajon-Los Coches 69 kV line without running the peaking facility at El Cajon. This project California ISO/MID 134 2014-2015 ISO Transmission Plan February 2, 2015 provides superior mitigation compared to TL631 re-conductor project that was previously approved in the 2010-2011 transmission planning process, as it provides a 3rd 69 kV transmission source to supply Granite 69 kV substation with about 104 MW of load and avoids the Granite Tap-Granite 69 kV normal overload without running the peaking facility at El Cajon. The estimated cost of the project is $15.2 million~$19.8 million. The estimated in-service date is June 1, 2017. Salt Creek 69 kV Load Substation This project is needed to provide load service interconnection driven by load demand growth in the Salt Creek area. The project scope is to build a new Salt Creek 69 kV substation, loop in TL6910 Miguel-Border 69 kV line, and add a new 69 kV line from Miguel to Salt Creek. New Miguel-Salt Creek 69 kV line costs additional $16.7 million~$18.5 million but creates economic benefit by eliminating the need to run uneconomic generation for reliability support as demand for electricity increases in the Border area. The proposed in-service date is 2016. Vine 69 kV Load Substation This project is needed to provide load service interconnection driven by distribution load growth. The project scope is to build a new Vine 69 kV substation and loop in TL604 Old Town-Kettner 69 kV line, which provides two transmission sources to serve customers in the Vine area. The proposed in-service date is 2017. California ISO/MID 135 2014-2015 ISO Transmission Plan February 2, 2015 Intentionally left blank California ISO/MID 136 2014-2015 ISO Transmission Plan February 2, 2015 Chapter 3 3 Special Reliability Studies and Results 3.1 Overview The special studies discussed in this chapter have not been addressed elsewhere in the transmission plan. The studies are the Reliability Requirements for Resource Adequacy, both short term and long term, and initial studies to assess frequency response with respect to potential over-generation conditions. 3.2 Reliability Requirement for Resource Adequacy Sections 3.2.1 and 3.2.2 summarize the technical studies conducted by the ISO to comply with the reliability requirements initiative in the resource adequacy provisions under section 40 of the ISO tariff as well as additional analysis supporting long term planning processes. The local capacity technical analysis addressed the minimum local capacity requirements (LCR) on the ISO grid. The Resource Adequacy Import Allocation study established the maximum resource adequacy import capability to be used in 2015. 3.2.1 Local Capacity Requirements The ISO conducted short- and long-term local capacity technical (LCT) analysis studies in 2014. A short-term analysis was conducted for the 2015 system configuration to determine the minimum local capacity requirements for the 2015 resource procurement process. The results were used to assess compliance with the local capacity technical study criteria as required by the ISO tariff section 40.3. This study was conducted January-April through a transparent stakeholder process with a final report published on April 30, 2014. Two long-term analyses were also performed identifying the local capacity needs in the 2019 and 2024 periods; the 2019 report was published on April 30, 2014 and the 2024 results are discussed here. The long-term analyses provide participants in the transmission planning process with future trends in LCR needs for up to five years and ten years, respectively. This section summarizes study results from these studies. As shown in the LCT reports and indicated in the LCT manual, 11 load pockets are located throughout the ISO-controlled grid as shown in and illustrated in table 3.2-1 and figure 3.2-1 below. California ISO/MID 137 2014-2015 ISO Transmission Plan February 2, 2015 Table 3.2-1: List of LCR areas and the corresponding PTO service territories within the ISO BAA area No LCR Area PTO Service Territory 1 Humboldt 2 North Coast/North Bay 3 Sierra 4 Stockton 5 Greater Bay Area 6 Greater Fresno 7 Kern 8 Los Angeles Basin 9 Big Creek/Ventura 10 Greater San Diego/Imperial Valley 11 Valley Electric PG&E SCE California ISO/MID SDG&E VEA 138 2014-2015 ISO Transmission Plan February 2, 2015 Figure 3.2-1: Approximate geographical locations of LCR areas Valley Electric / Imperial Valley California ISO/MID 139 2014-2015 ISO Transmission Plan February 2, 2015 Each load pocket is unique and varies in its capacity requirements because of different system configuration. For example, the Humboldt area is a small pocket with total capacity requirements of approximately 200 MW. In contrast, the requirements of the Los Angeles Basin are approximately 10,000 MW. The short- and long-term LCR needs from this year’s studies are shown in the table below. Table 3.2-2: Local capacity areas and requirements for 2015, 2019 and 2024 LCR Capacity Need (MW) LCR Area 2015 2019 2024 Humboldt 166 173 178 North Coast/North Bay 550 516 505 2,200 1,102 1,478 707 351 347 Greater Bay Area 4,367 4,224 4,133 Greater Fresno 2,439 1,589 2,213 437 193 154 Los Angeles Basin 9,097 9,119 8,350 32 Big Creek/Ventura 2,270 2,619 2,783 33 Greater San Diego/Imperial Valley 4,112 3,290 4,147 34 0 0 0 26,345 23,176 24,288 Sierra Stockton Kern Valley Electric Total For more information about the LCR criteria, methodology and assumptions please refer to the ISO website. (A link is provided here). For more information about the 2015 LCT study results, please refer to the reports posted on the ISO website. (Links are provided here). 32 AAEE and LTPP EE assumptions, plus LTPP approved resource amounts as well as DR in LA Basin area are critical. 33 AAEE and LTPP EE assumptions, plus LTPP approved resource amounts in Santa Clara and Moorpark sub-areas are critical. 34 AAEE assumptions, plus LTPP approved resource amounts as well as DR in San Diego sub-area are critical. California ISO/MID 140 2014-2015 ISO Transmission Plan February 2, 2015 For more information about the 2019 LCT study results, please refer to the report posted on the ISO website. For detailed information about the 2024 long-term LCT study results, please refer to the standalone report in the Appendix E of this Transmission Plan. The ten-year LCR studies are intended to synergize with the CPUC long-term procurement plan (LTPP) process and to provide indication whether there are any potential deficiencies of local capacity requirements that need to trigger a new LTPP proceeding. This is particularly important for the LA Basin / San Diego areas as the majority of the once-through cooled (OTC) generating facilities are scheduled to comply with the State Water Resources Control Board (SWRCB) Policy on the Use of Coastal and Estuarine Waters for Power Plant Cooling by the end of 2020 time frame in addition to the retirement of the San Onofre Nuclear Generating Station (SONGS) that was announced by SCE on June 7, 2013. The following section 3.2.2 provides further discussions on the study results for the 2024 longterm LCR evaluation for the combined LA Basin / San Diego areas as the retirement of SONGS affect the reliability of these two areas, as well as increase the inter-dependencies between these two areas. Furthermore section 2.6.4 provides a summary of the interaction between the LA Basin / San Diego area and the Imperial area generation deliverability. Section 2.6.4.2 provides preliminary evaluation results for potential back-up transmission solutions for meeting the local reliability of the combined LA Basin / San Diego area in the event that the full amount of the existing demand response (about 860 MW) in the LA Basin cannot be repurposed to provide support under contingency conditions, or if the AAEE assumptions for both the LA Basin and San Diego areas do not fully materialize. 3.2.2 Summary of Study Results for the 2024 Long-term LCR Assessment of the combined LA Basin / San Diego LCR areas As mentioned above, the main purpose of performing the 2024 long-term LCR assessment is to determine whether the combined LA Basin / San Diego area will have sufficient resources to meet local reliability standards if SCE and SDG&E procure additional resources authorized in through the 2012 LTPP Track 1 and 4 proceedings and if the transmission projects that were approved by the ISO Board in the previous transmission planning cycles are fully implemented. In assessing the adequacy of the resource procurement authorized thus far, the ISO tested both the ceiling of the authorized amounts, as well as the amounts identified by the utilities through their procurement activities to date. The authorized procurement amount ceilings are set out in table 3.2-3 below: California ISO/MID 141 2014-2015 ISO Transmission Plan February 2, 2015 Table 3.2-3: Summary of 2012 LTPP Track 1 & 4 Authorized Procurement (1) Area Name Total Gas-fired generatio n Preferred Resources and Storage Assumed In Service Date SCE LA Basin Area 2500 1500 1000 2020 SCE Moorpark Area 290 194 96 2020 SDG&E Area 1100 900 200 2017 Total 3890 2594 1296 The ISO also worked closely with SCE and SDG&E to obtain latest procurement considerations to model for the 2024 long-term LCR studies to further inform their procurement activities. The following table 3.2-4 provides a summary of the resource procurement assumptions for both LA Basin and San Diego areas based on procurement activity provided by the utilities. These levels, for the LA Basin in particular, fall short of the authorized procurement set out in table 3.2-3. Table 3.2-4 — LTPP Tracks 1 and 4 procurement assumptions for 2024 long-term LCR studies (based on procurement activities to date) San Diego LTPP Procurement Assumptions SCE LTPP Procurement Assumptions 35 BTM Energy BTM Solar Solar PV Total Energy Total 36 Conventional Storage (MW) EE DR Conventional PV (MW) (MW) Storage portfolio portfolio (MW) (Minimum 4- (MW) (MW) (MW) (Installed (MW) (NQC (MW) (MW) hr product) Capacity) value) 1,382 44 261 130 75 1,892 900 175 25 1,100 The demand assumptions modeled for the studies are summarized in the following table 3.2-5. The CEC provided demand forecast (1-in-10 mid-demand) as part of the California Energy Demand 2014-2024 Final Forecast. The AAEE projection (low-mid for local area assessment) was also provided on a bus-by-bus basis by the CEC. SCE and SDG&E utilized the CEC 35 Behind-the-meter solar distributed generation This is ISO assumptions based on the trend of high penetration of solar DG in San Diego County; future updates on preferred resources to be procured by SDG&E will be included in future studies. 36 California ISO/MID 142 2014-2015 ISO Transmission Plan February 2, 2015 demand forecast for the planning areas and provided projections on individual transmission substation basis. Table 3.2-5 —Summary of demand assumptions for the 2024 long-term LCR studies (based on procurement activities to date) Area Load (MW) AAEE (MW) LTPP EE (MW) Pump Load (MW) San Diego 5,682 -338 0 0 169 5,513 LA Basin 22,721 -1,147 -130 30 550 22,024 Total 28,403 -1,485 -130 30 719 27,537 Transmission Total Net Load Losses (MW) (MW) The chart below, figure 3.2-2, provides a comparison of 2024 net demand forecast using the previous CEC net demand forecast from the California Energy Demand 2012-2022 (posted in August 2012) to compare to the California Energy Demand 2014-2014 Final Forecast (posted in December 2013). The difference between the two demand forecast is almost 1,000 MW lower for the latest forecast for the combined LA Basin / San Diego area. The net demand forecast takes into account the effect of AAEE projections. Figure 3.2-2 – Comparison of the CEC Net Demand Forecast (August 2012 vs. December 2013) California ISO/MID 143 2014-2015 ISO Transmission Plan February 2, 2015 The following table 3.2-6 lists the major transmission upgrades modeled for the studies. These major transmission upgrades were either approved by the ISO Board in the previous ISO Transmission Plans, or are part of the other Balancing Authorities’ Transmission Plan (i.e., Arizona Public Service, Imperial Irrigation District, etc.). Table 3.2-6 — Summary of major transmission upgrades modeled in the 2024 long-term LCR studies No Transmission Projects PTO BAA 1 East County 500 kV Substation SDG&E ISO 2 Mesa Loop-in Project and South of Mesa 230 kV Line Upgrades SCE ISO 3 Imperial Valley Phase Shifting Transformers (2x400 MVA) SDG&E ISO 4 Delany-Colorado River 500 kV Line TBD ISO 5 Hassayampa-North Gila #2 500 kV Line APS ISO 6 Bay Blvd. 230 kV Substation Project SDG&E ISO 7 Sycamore – Penasquitos 230 kV Line SDG&E ISO 8 Talega Synchronous Condensers (2x225 MVAR) SDG&E ISO 9 San Luis Rey Synchronous Condensers (2x225 MVAR) SDG&E ISO 10 SONGS Synchronous Condensers (1x225 MVAR) SDG&E ISO 11 Santiago Synchronous Condensers (1x225 MVAR) SCE ISO 12 Suncrest Dynamic Reactive Support (300 MVAR) TBD ISO 13 Miguel Synchronous Condensers (450 / -242 MVAR) SDG&E ISO 14 Miguel – Otay Mesa – South Bay – Sycamore 230 kV Re-configuration SDG&E ISO 15 Artesian 230/69 kV Substation and Loop-in Project SDG&E ISO 16 Imperial Valley – Dixieland 230 kV Tie N/A IID 17 Bypass series capacitors on the Imperial Valley – N.Gila, ECO – Miguel and Ocotillo – Suncrest 500 kV Lines SDG&E ISO 18 West of Devers 230 kV line upgrades SCE ISO California ISO/MID 144 2014-2015 ISO Transmission Plan February 2, 2015 Similar to the last planning cycle’s assessment (2013-2014 TPP), the most critical contingency that causes the highest local capacity requirements for the combined LA Basin / San Diego area continues to be the overlapping N-1-1 outage of the 500 kV lines in the southern San Diego area (i.e., Ocotillo – Suncrest 500 kV line, system readjusted, followed by the ECO–Miguel 500 kV line). The most limiting constraint is found to be the facility rating of the Imperial Valley 230 kV phase shifting transformers (2x400 MVA). Due to lower demand forecast, the previously identified voltage instability concern is the second most limiting constraint. The voltage instability concern is caused by the N-1-1 contingency of the ECO–Miguel 500 kV line, system readjusted, and followed by the loss of the Ocotillo–Suncrest 500 kV line. With future load growth beyond 2024, the voltage instability may become the primary constraint again. Therefore, for future long-term LCR evaluation for the combined LA Basin / San Diego area, unless there is a major change in the system configuration, these two contingencies and their limiting constraints will always be evaluated to ensure that the local capacity needs are identified. These critical contingencies are the primary cause for the long-term resource procurement need in the Western LA Basin and in San Diego area. Essentially because of SONGS and once-through-cooled generating units retirement, the Western LA Basin is the area that would experience the deficiency of resources to meet the most critical contingencies. Appendix E provides further details for comparison of available resources in 2024 vs. local capacity need and how the long-term procurement selection from SCE for the Western LA Basin, as well as SDG&E procurement, are used to meet local capacity need. The following table 3.2-7 summarizes the total local capacity requirements (LCR) for the combined LA Basin / San Diego for the two critical contingencies studied. The total LCR needs include a combination of conventional as well as renewable (i.e., system-connected distribution generations) resources, demand response and energy efficiency (from both AAEE projection as well as from LTPP procurement). It is noted that for the LCR study results for Case #1 in the table below, that the current levels of procurement activity and other measures result in a deficiency in local capacity. This could be addressed by the procurement of the currentlyanticipated shortfall from authorized levels, or by the repurposing of more existing demand response programs than the current base assumptions. In the latter case, an additional 268 MW of existing DR, in addition to the baseline assumptions of 198 MW of existing DR in the most effective locations in the Western LA Basin and in San Diego area, would need to be repurposed 37 for use in response to contingency conditions to address the gap between current procurement activities and the authorized procurement ceilings. It is noted that the locational effectiveness factors for the two most critical contingencies, Cases #1 and #2, are provided in section 3.3. 37 Repurposing DR means that it can be successfully equipped with adequate operational characteristics to be satisfactorily implemented for use by the ISO to meet contingency conditions (i.e., “fast” product with response time within 20 minutes to allow Operator’s adequate response time). California ISO/MID 145 2014-2015 ISO Transmission Plan February 2, 2015 Table 3.2-7 —Summary of the 2024 long-term LCR study results for the combined LA Basin / San Diego Area Combined LA Basin/San Diego Area Need Demand Assumption Contingency N-1-1: OcotilloSuncrest 500kV, 1 system readjusted, followed by ECOMiguel 500kV Line Limiting Constraint Imperial Valley Phase Shifting Transformers Thermal Loading Capability (2x400 MVA rating) N-1-1: ECO-Miguel 500kV, system 2 readjusted, followed Voltage Instability by Ocotillo-Suncrest 500kV Line 38 39 40 Energy Efficiency (AAEE & LTPP) (MW) LCR Needs Conventio nal/QF/Mu ni/Renewa bles and Energy Storage 1,277 (LA) 6,331 39 (LA) 338 (SD) Demand Subtotal Total Response by area combined (Existing and LTPP procurem ent) 449 40 (LA) 8,057 (LA) 17 (SD) 3,416 (SD) 11,473 3,061 (SD) 1,277 (LA) 338 (SD) 6,331 (LA) 181 (LA) 7,789 (LA) 3,061 (SD) 17 (SD) 3,416 (SD) AAEE is included in the total capacity need for tracking purposes. Based on SCE procurement activities to date. 449 MW existing demand response and 75 MW demand response from SCE’s LTPP procurement California ISO/MID 38 146 11,205 2014-2015 ISO Transmission Plan February 2, 2015 Conclusions The following Table 3.2-8 provides a high-level summary of the long-term LCR study results for the combined LA Basin / San Diego area. Table 3.2-8 — High-level summary assessment of 2024 long-term LCR study results for the combined LA Basin / San Diego Area No 1 2 LTPP Procurement, DR and AAEE Scenarios Results If authorized LTPP Tracks 1 and 4 resources are procured fully (i.e., 2,500 MW for SCE and 1,100 MW for SDG&E) with the use of Track 4 assumptions (i.e., 198 MW) Then there is no resource deficiency If LTPP Tracks 1 and 4 are not fully procured (i.e., 608 MW less than authorized amount for the Western LA Basin), OR Then there would be resource deficiency , If AAEE does not materialize as forecast (i.e., 608 MW less than forecast) (again with the use of Track 4 DR assumptions) If LTPP Tracks 1 and 4 are not fully procured (i.e., 608 MW less than authorized amount for the LA Basin), OR AAEE fails to materialize at forecast levels (i.e., 608 MW less than forecast), but available existing DR (i.e., about 268 MW in the Western LA Basin) can be successfully 41 “repurposed” with adequate operational characteristics to satisfactorily be implemented for use by the ISO to meet contingency conditions 3 Then it is anticipated that there would be no resource deficiency In addition to the above high-level summary assessment of the long-term LCR study results for the combined LA Basin / San Diego area, the following are highlights of other important conclusions: • • • • Demand response needs to reasonably have a response time of within 20 minutes following notification in order to be effective in positioning a system post-contingency to be prepared for the next contingency – NERC standards call for the system to be repositioned within 30 minutes of the initial event, and time must also be allowed for transmission operator decisions and communication; The LCR need for the combined LA Basin / San Diego area continues to be caused by the overlapping N-1-1 contingency of 500 kV lines in southern San Diego area; The LCR need for the combined LA Basin–San Diego–Imperial Valley area is caused by the overlapping outage of Otay Mesa power plant, followed by the Imperial Valley–North Gila 500 kV line; With lower CEC demand forecast for 2024 (due to larger AAEE projection) for the LA Basin and San Diego areas, the primary reliability constraints affecting LCR needs for the combined LA Basin / San Diego area are the thermal constraints on the Imperial Valley phase-shifting transformers under the overlapping N-1-1 contingency; 41 “Repurposing” means that further works may be needed to enable the existing demand response to have operational characteristics such as being made available within 20 minutes for the ISO to use in response to contingency conditions. California ISO/MID 147 2014-2015 ISO Transmission Plan • • • • February 2, 2015 Post-transient voltage instability is the next reliability constraint. This constraint may become the primary constraint with load growth for the LA Basin / San Diego areas beyond the 2024 time frame; The series capacitors on the southern 500 kV lines (i.e., ECO–Miguel, Ocotillo–Suncrest and Imperial Valley–North Gila) are bypassed normally under summer peak load conditions to prepare to mitigate potential loading concerns that occur under contingency conditions; Loading concerns on the Miguel transformers and Sycamore–Suncrest 230 kV lines under overlapping contingency conditions require Special Protection System (SPS) refinements in the next ISO transmission planning process cycle.; Back-up transmission solutions were evaluated to maintain local reliability in the event that the existing demand response (i.e., beyond the 198 MW of “fast” DR assumptions that were used for the LTPP Track 4 studies) cannot be “repurposed” to equip with adequate operational characteristics for the ISO to use under contingency conditions, OR AAEE does not materialize fully as forecast. The back-up transmission solutions are discussed further in section 2.6.4.2. 3.2.3 Resource adequacy import capability The ISO has established the maximum RA import capability to be used in year 2015 in accordance with ISO tariff section 40.4.6.2.1. These data can be found on the ISO website. (A link is provided here). The entire import allocation process is posted on the ISO website. The ISO has established in accordance with Reliability Requirements BPM section 5.1.3.5, the target maximum import capability (MIC) from the Imperial Irrigation District (IID) to be 662 MW in year 2020 to accommodate renewable resources development in this area. The import capability from IID to the ISO is the combined amount from the IID-SCE_BG and the IIDSDGE_BG. The 10-year increase in MIC from current levels out of the IID area is dependent on transmission upgrades in both the ISO and IID areas as well as new resource development within the IID and ISO systems. Previous transmission plans indicated that increases from the existing level to targeted levels were dependent upon previously identified transmission reinforcements. Based on latest available studies and portfolio information “Technical Addendum to the July 2, 2014 Imperial County Transmission Consultation Draft Discussion Paper” dated November 22, 2014, the ISO will maintain the current 462 MW level of MIC from IID until West of Devers upgrades are in place; at that time MIC will be increased by 200 MW in order to reflect generation connecting to IID that have CPUC-approved PPAs with utilities in the ISO grid that include resource adequacy capacity. Beyond that approximately 500 MW to 750 MW of additional deliverability may be available for new generation that does not have a current PPA and may not already be moving forward. This future deliverability is to be shared between future resources connected to the ISO grid and those connected to the IID system in the Imperial zone. California ISO/MID 148 2014-2015 ISO Transmission Plan February 2, 2015 Furthermore, the ISO has assessed options for meeting the renewable “sensitivity” development scenario provided by the CPUC for the 2014-2015 planning cycle — an increase of 2,500 MW in the Imperial zone. This assessment is provided in chapter 4. The ISO also confirms that all other import branch groups or sum of branch groups have enough MIC to achieve deliverability for all external renewable resources in the base portfolio along with existing contracts, transmission ownership rights and pre-RA import commitments under contract in 2024. The future outlook for all remaining branch groups can be accessed at the following link: http://www.caiso.com/Documents/AdvisoryEstimatesFutureResourceAdequacyImportCapability_Years2015-2024.pdf. California ISO/MID 149 2014-2015 ISO Transmission Plan February 2, 2015 3.3 Locational Effectiveness Factors As part of the 2013-2014 transmission planning process, the ISO posted two papers discussing the calculations for the locational effectiveness factors for potential new incremental resource additions in the LA Basin and San Diego to meet local reliability needs in mitigating posttransient voltage instability concerns that are caused by an overlapping N-1-1 contingency of the 500 kV lines in southern San Diego area (i.e., ECO-Miguel 500 kV, system readjusted, followed by Ocotillo-Suncrest 500 kV line). These papers are at posted at http://www.caiso.com/Pages/documentsbygroup.aspx?GroupID=69EF19AF-353C-4110-80A040DC9ECF4E6A. The calculations for the locational effectiveness factors discussed in those papers were related to the local reliability analyses for the LA Basin / San Diego areas in the 2013-2014 Transmission Plan. Recently the ISO presented its general methodology for calculating the locational effectiveness factors at the November 19-20, 2014 stakeholder meeting that is part of the ISO 2014–2015 transmission planning process. The presentation was posted on the ISO website at http://www.caiso.com/Documents/Day1-November19-20_2014StakeholderMeeting.pdf. In addition, a “Background Paper on Methodology for Calculating Locational Effectiveness Factors” is included in Appendix F as part of the ISO 2014–2015 Transmission Plan. In this section, the ISO has provided its calculation results for the analyses of locational effectiveness factors for the long-term 2024 LCR studies for the LA Basin / San Diego areas. As mentioned in chapter 3.2, because of new lower demand forecast provided by the CEC for the 2014–2024 time frame, the primary constraints for the LA Basin / San Diego are due to thermal loading concerns on the Imperial Valley phase-shifting transformers, due to an overlapping N-1-1 contingency of Ocotillo-Suncrest, followed by the ECO-Miguel 500 kV line, instead of the post-transient voltage instability as identified in the last transmission planning cycle. However, with load growth in the future, the post-transient instability could become the primary constraint again for the LA Basin / San Diego areas. Therefore, in this section, the ISO has provided calculations for the locational effectiveness factors for both the thermal loading as well as for the post-transient voltage instability concerns. Locational Effectiveness Factors Based on Thermal Loading Constraints As discussed in Appendix F, to calculate the locational effectiveness factors based on thermal loading constraints, the ISO increased resources at various nodes of interests in the LA Basin / San Diego areas by an incremental amount (10 MW) and calculated the change in the facility loadings (in MW) for the pre and post conditions of adding 10 MW to the resources at specific bus. The study case has the outage modeled, and the changes in MW were recorded after each 10 MW addition to resources at each node to determine its effectiveness in mitigating the thermal loading concerns. The following table 3.3-1 provides the results of the locational effectiveness factors for buses in the LA Basin and San Diego areas that are helpful to lower the loading concerns on the Imperial Valley phase shifting transformers by 1 percent or more. For this outage, it is noted that the resources located in San Diego are more effective than resources in the LA Basin. California ISO/MID 150 2014-2015 ISO Transmission Plan February 2, 2015 Table 3.3-1 — LEFs To Mitigate Thermal Loading Concerns on the IV Phase Shifting Transformer RESOURCE NAME / kV / ID LEFs OTAYMGT1 18.0 #1 -33.84 C574CT1 13.8 #C1 -33.22 GRANITE 69.0 #d1 -31.96 EL CAJON 69.0 #d1 -31.74 MURRAY -31.64 69.0 #d1 SAMPSON 12.5 #d1 -31.42 TELECYN 138.0 #d1 -31.42 EC GEN1 13.8 #1 -31.38 NOISLMTR 69.0 #1 -31.34 B -31.3 69.0 #d1 DIVISION 69.0 #1 -31.26 OTAY 69.0 #1 -31.22 OTAY 69.0 #3 -31.18 CABRILLO 69.0 #1 -31.04 MESAHGTS 69.0 #1 -31 KUMEYAAY 0.7 #1 -30.96 OY GEN -30.96 13.8 #1 CREELMAN 69.0 #DG -30.9 POINTLMA 69.0 #1 -30.88 OLD TOWN 69.0 #d1 -30.7 California ISO/MID 151 2014-2015 ISO Transmission Plan February 2, 2015 RESOURCE NAME / kV / ID LEFs MISSION 69.0 #d1 -30.64 CARLTNHS 138.0 #1 -30.34 CALPK_BD 13.8 #1 -30.08 LRKSPBD1 13.8 #1 -30.06 BULLMOOS 13.8 #1 -29.96 GENESEE 69.0 #d1 -29.94 EASTGATE 69.0 #1 -29.92 MESA RIM 69.0 #d1 -29.92 TOREYPNS 69.0 #d1 -29.82 MEF MR1 13.8 #1 -29.4 CHCARITA 138.0 #1 -29.32 BERNARDO 69.0 #DG -28.82 ARTESN -28.74 69.0 #DG LkHodG1 13.8 #1 -27.82 VALCNTR 69.0 #1 -27.72 GOALLINE 69.0 #1 -27.48 BORREGO 69.0 #DG -27.42 ASH -27.22 69.0 #d1 ESCNDIDO 69.0 #DG -27.2 CANNON 138.0 #d1 -27.04 SANMRCOS 69.0 #d1 -27.04 AVOCADO 69.0 #DG -26.98 California ISO/MID 152 2014-2015 ISO Transmission Plan February 2, 2015 RESOURCE NAME / kV / ID LEFs MONSRATE 69.0 #DG -26.74 ES GEN -26.62 13.8 #1 CALPK_ES 13.8 #1 -26.56 MELROSE 69.0 #DG -26.26 PEN_CT1 18.0 #1 -26.2 COASTAL 13.8 #1 -25.92 PA GEN1 13.8 #1 -25.84 SANLUSRY 69.0 #d1 -25.66 BR GEN1 -25.28 0.2 #1 MARGARTA 138.0 #DG -22.78 LAGNA NL 138.0 #DG -22.72 TRABUCO 138.0 #d1 -22.72 CAPSTRNO 138.0 #DG -22.62 PICO -22.58 138.0 #DG SANTIAGO 66.0 #l8 -18.7 JOHANNA 66.0 #l5 -17.1 ELLIS -14.74 BARRE 66.0 #l7 66.0 #m3 -11.9 HUNT1 G 13.8 #X -11.46 VILLA PK 66.0 #l2 -11.34 BARPKGEN 13.8 #1 -11.32 DowlingC 13.8 #1 -11.18 California ISO/MID 153 2014-2015 ISO Transmission Plan February 2, 2015 RESOURCE NAME / kV / ID LEFs CanyonGT 13.8 #1 -10.72 BARRE G 13.8 #X2 -9.84 SANIGEN 13.8 #D1 -9.52 ALMITOSW 66.0 #l3 -9.48 CIMGEN 13.8 #D1 -9.48 PADUA 66.0 #l8 -9.48 SIMPSON 13.8 #D1 -9.46 VENICE -9.1 WALNUT 13.8 #1 66.0 #l3 -9.04 PALOGEN 13.8 #D1 -8.78 MOBGEN1 13.8 #1 -8.76 CTRPKGEN 13.8 #1 -8.72 OLINDA 66.0 #1 -8.7 SIGGEN 13.8 #D1 -8.68 ALAMT4 G 18.0 #4 -8.58 ICEGEN -8.54 13.8 #D1 MRLPKGEN 13.8 #1 -8.52 CENTER G 18.0 #1 -8.28 BREAPWR2 13.8 #C4 -8.12 CARBGEN1 13.8 #1 -8.12 SERRFGEN 13.8 #D1 -8.12 THUMSGEN 13.8 #1 -8.12 California ISO/MID 154 2014-2015 ISO Transmission Plan February 2, 2015 RESOURCE NAME / kV / ID LEFs RIOHONDO 66.0 #l8 -7.68 ARCO 1G 13.8 #1 -7.5 EAGLROCK 66.0 #l4 -7.44 ELSEG6ST 13.8 #6 -7.42 INLAND -7.32 13.8 #1 ELSEG5GT 16.5 #5 -7.18 ETI MWDG 13.8 #1 -7.18 HARBOR G 13.8 #1 -7.18 ETWPKGEN 13.8 #1 -7.06 BRODWYSC 13.8 #1 -6.82 MALBRG1G 13.8 #C1 -6.72 REFUSE 13.8 #D1 -6.72 PASADNA1 13.8 #1 -6.54 EME WCG1 13.8 #1 -6.12 SPRINGEN 13.8 #1 -6.02 RERC1G -5.96 13.8 #1 CLTNCTRY 13.8 #1 -5.82 CLTNDREW 13.8 #1 -5.82 CLTNAGUA 13.8 #1 -5.66 CHARMIN 13.8 #1 -5.1 WDT273 -5 California ISO/MID 66.0 #EQ 155 2014-2015 ISO Transmission Plan February 2, 2015 Locational Effectiveness Factors Based on Post-Transient Voltage Instability Constraints As discussed in Appendix F, to calculate the locational effectiveness factors based on posttransient voltage instability concerns, there are two methods: nodal or zonal calculations. LEFs are primarily calculated to: determine existing resources’ effectiveness in mitigating posttransient voltage instability; or determine the LEFs of new proposed potential resources to mitigate a reliability concern. The latter was the focus of interest of the load serving entities (LSEs) as well as of the generation developers who would like to propose their projects as part of the LSE’s procurement process. The ISO has provided the discussion and results of the calculation for the LEFs to mitigate post-transient voltage instability for potential new resources being considered for meeting the 2012 LTPP Track 1 and Track 4 requirements. Please note that the LEFs for mitigating post-transient voltage instability are greatly affected by the assumptions of which generation/resources modeled, as well as the level of transmission upgrades. The following is the summary of the key assumptions used for the calculating the LEFs for potential new resources in mitigating post-transient voltage instability concerns: • • • • • Existing resources that are not subject to once-through-cooled generation policy or aging facilities (i.e., 40 or more years) are assumed to be on line in the study case. The CEC-provided AAEE forecast at the bus levels are modeled. Demand response level used for the LTPP Track 4 studies was modeled (i.e., 198 MW). ISO Board-approved transmission upgrades are modeled. Some of the transmission upgrades, such as the Imperial Valley phase-shifting transformers, greatly affect the LEFs of potential new resources. New resources that have obtained the CPUC Power Purchase & Tolling Agreements (PPTA) authorizations are modeled (i.e., Pico Pico). Table 3.3-2 provides the results of the LEF calculations in the LA Basin and San Diego areas to mitigate identified post-transient voltage instability concerns. Please note that for this planning cycle the constraints caused by post-transient voltage instability are secondary to the thermal loading concerns. What this means is that the constraints caused by thermal loading concerns trigger higher local resource needs for the long-term LCR analyses for the combined LA Basin / San Diego area in this planning cycle. In the future, with load growth, resource changes, and transmission changes, the post-transient voltage instability may become the primary constraints again. The following are observations and findings from the LEF calculations for the sub-areas located in the LA Basin and San Diego areas in mitigating post-transient voltage instability concerns: • • • Zonal analyses were performed because the amount of resources needed to mitigate identified reliability concerns were determined to be large and impractical if located at one node only. An effectiveness difference of 10% or more would differentiate two different zones; the amount of resource additions needed would be confined to the buses within a zone; The Load Serving Entities’ procurement considerations, existing facility’s maximum capacity, as well as proposed generation interconnection projects in the ISO generation interconnection queue, are important considerations for modeling the upper range of the California ISO/MID 156 2014-2015 ISO Transmission Plan • 42 February 2, 2015 amount of resources at a bus, as well as the locations, for the studies. For example, if a proposed generation interconnection project has a maximum of 700 MW at one specific location, the ISO would model the amount of resources at that particular bus at 700 MW, unless the ISO knows that its existing facility currently can accommodate more than the proposed interconnection capacity. The findings for the LEFs in the following table indicated that the results are close to the study results posted as part of the 2013-2014 Transmission Plan earlier (i.e., Locational Effectiveness Factor Calculation in the LA Basin Area and Locational Effectiveness Factor Calculation in the San Diego Sub-Area 42). The minor differences from earlier study results can be attributed to a number of factors: lower demand forecast from the CEC (mainly due to AAEE projection), siting of dynamic reactive supports in the Orange County area (i.e., Santiago Substation), and locations of resource addition assumptions for the Southwest LA Basin based on SCE’s procurement considerations. For example, siting of synchronous condenser at Santiago Substation and lower demand forecast help increase the LEF for the Western Central LA Basin sub-area from 67% to 71% and the Northwest LA Basin sub-area from 57% to 59%. For the Southwest LA Basin sub-area, previous assumptions of higher amount as well as type of resources (i.e., conventional resources vs. preferred resources) of potential resource additions at more effective Santiago and Johanna locations resulted in higher LEF in previous calculations (100%) compared to calculations in this planning cycle (94%). Overall, the results for the LEF calculations for the post-transient stability concerns are not fundamentally changed from the results that were posted for the 2013-2014 Transmission Plan. http://www.caiso.com/Pages/documentsbygroup.aspx?GroupID=69EF19AF-353C-4110-80A0-40DC9ECF4E6A California ISO/MID 157 2014-2015 ISO Transmission Plan February 2, 2015 Table 3.3-2 — Summary of LEFs Based on Post-Transient Voltage Instability Concerns Areas Calculated LEFs (in %) South & Southwest* 100 North & Northwest** 100 Northwest+ 59 Western Central++ 71 Southwest+++ 94 San Diego Area LA Basin Area Notes: * South and Southwest San Diego sub-area includes the area having major bulk 230kV substations and subtransmission substations starting from Penasquitos to its southern area, south of Sycamore Canyon Substation, south of San Luis 230kV Substation, Miguel 230kV and its northern area. Due to numerous subtransmission substations located in this sub-area, only major 230kV substations are listed here: Penasquitos, Old Town, Mission, Miguel, Silvergate, and Otay Mesa. ** North and Northwest San Diego sub-area includes the area having major bulk 230kV substations and subtransmission substations (138kV and lower transmission voltage) south of the SCE-SDG&E border, north of Penasquitos and Mission 230kV Substations and north of Sycamore Canyon 230kV Substation. Due to numerous subtransmission substations located in this sub-area, only major 230kV substations are listed here: Talega, San Onofre, San Luis Rey, Encina, Escondido and Palomar Energy. + Northwest LA Basin sub-area includes these substations: El Segundo, Chevmain, El Nido, La Cienega, La Fresa, Redondo, La Fresa, La Cienega, Hinson, Arcogen, Harborgen, Long Beach, Lighthipe, Rio Hondo, Mesa and Laguna Bell. ++ Western Central LA Basin sub-area includes these substations: Center, Del Amo, Walnut, and Olinda. +++ Southwest LA Basin sub-area includes these substations: Alamitos, Barre, Lewis, Villa Park, Ellis, Huntington Beach, Johanna, Santiago, and Viejo. Please note that the above serves as a guide with the understanding that these LEF values are subject to change over time due to load growth (or reduction), additional transmission upgrades from future transmission plans, AAEE assumptions or preferred resource assumptions that are modified based on nodal levels. Summary The following is summary of key observations from the calculations of the LEFs for the combined LA Basin / San Diego area for the long-term LCR analyses in this planning cycle. 1. The primary constraint that would require higher local capacity resources is caused by the thermal loading concerns on the Imperial Valley phase-shifting transformers under an overlapping N-1-1 contingency condition for the 500 kV transmission lines in southern San California ISO/MID 158 2014-2015 ISO Transmission Plan February 2, 2015 Diego area (i.e., Ocotillo–Suncrest, followed by the ECO–Miguel 500 kV line). The reason that this reliability concern now is the primary constraint for the LA Basin / San Diego area is attributed to lower demand forecast from the CEC in which the net peak loads (i.e., loads that include AAEE) for this combined area are projected to be about 1,000 MW lower than previously forecast. With lower future net demand forecast, the thermal loading concerns for the Imperial Valley phase shifting transformers now become the primary constraint before the post-transient voltage instability concerns based on long-term LCR studies. 2. The calculations of the LEFs based on thermal loading constraints were relatively straightforward to perform (see the methodology for calculating the LEFs in Appendix F). The ISO performed nodal analyses for the LEFs that are caused by thermal loading concerns on the Imperial Valley phase-shifting transformers under an overlapping N-1-1 contingency. The results indicated that resources located in the southern San Diego area are more effective in mitigating this contingency loading concern. 3. Because it is possible that with future load growth beyond 2024 time frame, the reliability concerns related to the post-transient voltage instability may become the primary constraint again and so the ISO thinks it is prudent to perform the LEFs calculations based on post transient voltage instability to cover for the scenario of the next limiting constraint for the combined LA Basin / San Diego area. 4. The LEFs associated with the post-transient voltage instability concerns are highly sensitive to load changes, transmission upgrades and additions, and resource assumptions. 5. Based on the number of factors that could affect LEF outcome (i.e., changes in load forecasts, preferred resource implementation, transmission upgrades and additions, new resource additions, etc.), it is recommended to revisit the LEF calculations for the combined LA Basin / San Diego area in future planning cycles. 6. Comparing the results of the calculated LEFs from both thermal and post-transient voltage instability constraints, it is noted that the resources in the southern San Diego area are effective for mitigating the thermal loading constraint on the Imperial Valley phase shifting transformers while the resources in the Orange County and northern San Diego area are considered effective locations for mitigating post-transient voltage instability constraints. This recognizes the fact that resources at one specific location are not going to mitigate both of these reliability issues effectively without the assistance of the other resources in relatively effective locations. The new results do not contradict the ISO findings earlier that resources in San Diego and Orange County were considered effective locations for mitigating identified earlier reliability concerns. California ISO/MID 159 2014-2015 ISO Transmission Plan February 2, 2015 3.4 Over Generation Assessment 3.4.1. Over generation issues and metrics More and more conventional resources are being displaced with renewable resources as renewable penetration increases that do not have the same inherent capability to provide inertia response to frequency changes. Given the current trend, the system may require reserving headroom on governor responsive resources during periods of light load and high renewable production to meet frequency response obligations as proposed under BAL-003-1 (Frequency Response and Frequency Bias Setting). Unlike conventional generation, inverter-based renewable resources must be specifically designed to provide inertia response to arrest frequency decline following the loss of a generating resource. Also, wind and solar resources would have to operate below their maximum capability for a certain wind speed or irradiance level, respectively, to provide frequency response following the loss of a large generator. As more wind and solar resources displace conventional synchronous generation, the mix of the remaining synchronous generators may not be able to adequately meet the ISO’s frequency response obligation (FRO) under BAL-003-1 for all operating conditions. The objectives of this study were to assess the potential risk of overgeneration conditions in the 2020 timeframe under 33 percent RPS, evaluate the ISO’s frequency response during light load conditions and high renewable production, assess factors affecting frequency response, validate the system and equipment models used in the study, and evaluate mitigation measures for operating conditions during which the FRO couldn’t be met. Overgeneration occurs when there is more internal generation and imports into a balancing area than load and exports. The risk of overgeneration is illustrated on the curve in figure 3.4-2. This curve represents net load 43 for multiple years during a spring day with light load and high renewable production. Although load is the true demand that must be served moment by moment, net load is the demand met by dispatchable resources. Before an overgeneration event occurs, the system operator will exhaust all efforts to send dispatchable resources to their minimum operating levels and will have used all the decremental energy (DEC) bids available in the imbalance energy market. If no DEC bids or insufficient DEC bids are received, the system operator may declare an overgeneration condition if high system frequency and associated high Area Control Error (ACE) can no longer be controlled. With a high ACE, the energy management system (EMS) will dispatch regulation resources to the bottom of their operating range. Also, operators will make arrangements to sell excess energy out of the market to the extent bids to balance the system are exhausted. 43 Net-load = Load – renewable production. California ISO/MID 160 2014-2015 ISO Transmission Plan February 2, 2015 Figure 3.4-2: The duck-shaped curve shows steep ramping needs and overgeneration risk 44 The following are some reliability issues that can occur during overgeneration conditions: • system frequency higher than 60 Hz; • real-time energy market prices may be negative — the ISO must pay internal or external entities to consume more or produce less power; • ACE is higher than normal and can result in reliability issues; • grid operators may have difficulties controlling the system due to insufficient flexible capacity; • insufficient frequency responsive generation on line may reduce the system ability to quickly arrest frequency decline following a disturbance; • inability to shut down a resource because it would not have the ability to restart in time to meet system peak; • need to commit more resources on governor control; and • possible curtailment of resources that cannot provide frequency response. Frequency response is the overall response of the power system to large, sudden mismatches between generation and load. The study focused on light spring conditions, because the 44 http://www.caiso.com/Documents/FlexibleResourcesHelpRenewables_FastFacts.pdf California ISO/MID 161 2014-2015 ISO Transmission Plan February 2, 2015 relatively low level of conventional generation may present a challenge in meeting the FRO. NERC developed the frequency response obligation of the Western Interconnection based on the loss of two fully loaded Palo Verde nuclear power station units (2,750 MW). This is a credible Category D outage that results in the most severe frequency excursion postcontingency. The following frequency performance metrics 45 that were developed by the ISO and General Electric Energy were used in the study and are illustrated in figure 3.4-2. Figure 3.4-2: Frequency performance metrics Legend Cf — Frequency Nadir (Hz) Ct — Frequency Nadir Time (sec) Bf — Settling Frequency (Hz) Δ MW/Δfc *0.1 — Nadir-Based Frequency Response (MW/0.1HZ) Δ MW/Δfb*0.1 — Settling-Based Frequency Response Cp — Nadir-based governor response (MW) Bp — Settling frequency-based governor response (MW) The system frequency performance is acceptable when the frequency nadir post-contingency is above the set point for the first block of the under-frequency load shedding relays, which is set at 59.5 Hz. 45 Page 10, California ISO Frequency Response Study https://www.google.com/?gws_rd=ssl#q=caiso+frequency+response+study+final+draft California ISO/MID 162 2014-2015 ISO Transmission Plan February 2, 2015 Another metric is the actual ISO’s frequency response following a contingency. The Western Interconnection Frequency Response Obligation is updated annually, according to the NERC BAL-003-1 standard. The NERC established annual interconnection frequency response obligation for the Western Interconnection is currently set at 949 MW/0.1Hz, which was used for this study. Frequency response of the Interconnection is calculated as Where ΔP is the difference in the generation output before and after the contingency, and ΔF is the difference between the system frequency just prior to the contingency and the settling frequency. For each balancing authority within an Interconnection to meet the BAL-003-1 standard, the actual frequency response should exceed the FRO of the balancing authority. FRO allocated to each balancing authority and is calculated using the formula below. For the ISO, the annual FRO obligation is approximately 30 percent of WECC FRO, which is approximately 285 MW/0.1 Hz. The ratio of generation that provides governor response to all generation running on the system is used to quantify overall system readiness to provide frequency response. This ratio is introduced as the metric Kt; 46 the lower the Kt, the smaller the fraction of generation that will respond. The exact definition of Kt is not standardized. For this study, it is defined as ratio of power generation capability of units with governors to the MW capability of all generation units. For units that don’t respond to frequency changes, power capability is defined as equal to the MW dispatch rather than the nameplate rating because these units will not contribute beyond their initial dispatch. Another metric that was evaluated was the headroom of the units with responsive governors. The headroom is defined as a difference between the maximum capacity of the unit and the unit’s output. For a system to react most effectively to changes in frequency, enough total headroom must be available. Block loaded units have no headroom. 46 https://www.google.com/?gws_rd=ssl#q=caiso+frequency+response+study+final+draft California ISO/MID 163 2014-2015 ISO Transmission Plan February 2, 2015 3.4.2. Study assumptions The power flow base case selected for the study was based on the results of production simulations for the year 2024. Production simulations represent the system performance considering security-constrained unit commitment (SCUC) and security-constrained unit dispatch (SCUD) for each hour of the year. The model for production simulation was obtained from the WECC Transmission Expansion Planning Policy Committee (TEPPC) Study Program. The latest 2024 Common Case was used. The Common Case is the first base case for the 10year timeframe from which additional portfolio cases can be developed. The production simulation case selected for the study modeled 33 percent of renewable resources in California and had the latest updates on the new transmission and generation projects. The model used the CEC load forecast for California for 2024 developed in 2013 and the load forecasts for other areas from the latest WECC Load and Resources Subcommittee (LRS) data developed in 2012. New renewable generation projects were modeled according to the CPUC/CEC RPS portfolios. All other assumptions were consistent with the ISO 2014 Unified Study Assumptions and the latest TEPPC database. The production simulation was run for the year 2024 using ABB Grid View software. The hour of the year selected for the detailed transient stability studies modeled low load and high renewable generation that usually occurs in spring. Based on the production simulation results, the hour of 11 am April 7, 2024 was selected because it represents a low load high renewable production scenario. Power flow case was created for the 11 am, April 7, 2024 with the generation dispatch and load distribution from the results of the production simulation study. The power flow case was created by exporting the results of the Grid View production simulation for the selected hour and solving the case in GE PSLF. Due to high voltages because of low load in the selected hour, reactive support was adjusted by turning off shunt capacitors and turning on all available shunt reactors. Dynamic stability data file was created to match the power flow case. The latest WECC Master Dynamic File was used as a starting dataset. Missing dynamic stability models for the new renewable projects were added to the dynamic file by using typical models according to the type and capacity of the projects. The latest models for inverter-based generation recently approved by WECC were utilized. For the new wind projects, the models for type 3 (double-fed induction generator) or type 4 (full converter) were used depending on the type and size of the project. For the solar PV projects, three types of models were used: large PV plant, small PV plant and distributed PV generation. More detailed description of the dynamic stability models for renewable generation is provided in the section 4.1.4.1.2 of this report. The power flow case was adjusted to better match the case from production simulation and to ensure that all generation is dispatched within the units’ capability. As a result, load, generation and flows in the power flow case closely matched those from the production simulation study. The power flow base case assumptions are summarized in table 3.4-1. California ISO/MID 164 2014-2015 ISO Transmission Plan February 2, 2015 Table 3.4-1: Over Generation Base Case Assumptions for the hour of 11 a.m. April 7, 2024. Base Case Assumptions WECC CAISO Load, MW 100,410 24,117 Losses, MW 3,162 510 Generation, MW 103,580 22,650 Wind and solar output, dispatch percent of total 25.8 percent 48.6 percent Base Case Assumptions COI PDCI Flow, MW 1170, north-to-south 620, north-to-south Base Case Assumptions Path 15 Path 26 Flow, MW 2800, south-to-north 760, south-to-north Import to the ISO, MW 1977 Table 3.4-2 shows the capacity and dispatch levels of different types of generation technology modeled in the study case. California ISO/MID 165 2014-2015 ISO Transmission Plan February 2, 2015 Table 3.4-2: Generation by Type, April 7, 2024 11 a.m. (in MW) Nuclear Geothermal Biomass Coal Hydro Natural Gas Storage Solar Wind Capacity 2,300 1,676 930 223 5,556 16,449 2,719 5,492 2,402 Dispatch 1,150 695 391 0 589 2,637 -368 2,855 1,525 Capacity 0 329 380 181 1,563 13,916 834 10,790 4,279 Dispatch 0 253 193 0 580 3,538 -271 5,766 1,421 Capacity 0 0 40 0 6 4,849 165 1,861 319 Dispatch 0 0 21 0 0 739 -147 0 0 Capacity 0 22 8 0 2,653 2,648 0 413 0 Dispatch 0 15 1 0 761 328 0 235 0 Capacity 0 0 0 0 161 587 0 0 0 Dispatch 0 0 0 0 140 0 0 0 0 Capacity 0 0 20 1,64 0 294 4,601 1,370 606 437 Dispatch 0 0 11 328 98 37 392 600 245 Capacity 0 773 130 0 85 990 0 792 0 Dispatch 0 612 65 0 39 84 0 664 0 Capacity 5,380 1,431 1,563 30,8 14 56,827 68,281 985 5,523 20,165 Dispatch 3,976 1,131 1,053 22,4 90 23,459 12,360 -451 4,710 8,713 Area PG&E SCE SDG&E SMUD TIDC LDWP IID Rest of WECC The simultaneous loss of two Palo Verde generation units was studied because it results in the lowest post contingency frequency nadir. The transient stability simulation was run for 60 seconds. In addition to evaluating the system frequency performance and the WECC and ISO governor response, the study evaluated the impact of unit commitment and the impact of generator output level on governor response. For this evaluation, such metrics as headroom or unloaded synchronized capacity, speed of governor response and number of generators with governors were estimated. California ISO/MID 166 2014-2015 ISO Transmission Plan February 2, 2015 3.4.3 Study results The dynamic simulation results for an outage of two Palo Verde generation units shows the frequency nadir of 59.708 Hz at 6.5 seconds and the settling frequency after 60 seconds at 59.882 Hz. The frequency plot for the six 500 kV buses (three buses in the north and three in the south) with the largest frequency deviations is shown in figure 3.4-3. Figure 3.4-3: Frequency on 500 kV buses with an outage of two Palo Verde units As can be seen from the plot, the frequency nadir was above the first block of under-frequency relay settings of 59.5 Hz. Figure 3.4-4 illustrates voltage at the same buses that was within the limits California ISO/MID 167 2014-2015 ISO Transmission Plan February 2, 2015 Figure 3.4-4: Voltage on 500 kV buses with an outage of two Palo Verde units The study evaluated governor response of the units that had responsive governors. The power output of the six units in WECC that had the highest governor response (in MW) is shown in figure 3.4-5. The highest response of 45 MW was from the Grand Coulee # 23 hydro unit in Washington State. It represents 6 percent of the unit’s 805 MW of capacity. Other Grand Coulee units also showed high governor response: unit #21 with 42 MW of governor response, which constitutes 7 percent of its 600 MW capacity, and unit #19 with 34 MW of response, which is 6 percent of its 600 MW capacity. Other generation units that showed high governor response are Dry Fork, which is a coal plant in Wyoming with 28 MW or 6 percent of its 440 MW capacity; and unit #4 of the San Juan coal plant in New Mexico with 28 MW of governor response, which is 5 percent of the unit’s 553 MW capacity. California ISO/MID 168 2014-2015 ISO Transmission Plan February 2, 2015 Figure 3.4-5: Generator’s output for an outage of two Palo Verde units with the highest response (WECC) California ISO/MID 169 2014-2015 ISO Transmission Plan February 2, 2015 Figure 3.4-6: Generator’s output for an outage of two Palo Verde units with the highest response (ISO) California ISO/MID 170 2014-2015 ISO Transmission Plan February 2, 2015 The calculated metrics of the frequency response and headroom for the WECC and the ISO are summarized in table 3.4-3 Table 3.4-3: Frequency Response and Headroom, April 7, 2024 11 a.m. Response Response Headroom Load MW MW/0.1 HZ % of Pmax, all % of Pmax, responsive governors MW MW All, MW Responsive MW WECC 2,705 2,292 1.6% 4.0% 30,152 100,410 103,580 65,597 PG&E 217 184 1.0% 3.9% 3,585 12,470 10,770 5,575 SCE 83 70 0.6% 3.3% 732 9,500 11,280 2,240 SDG&E 18 15 1.7% 5.1% 103 2,150 600 344 Total ISO 318 269 0.9% 3.8% 4,420 24,120 22,650 8,159 ISO/WECC 11.7% 11.7% 53.0% 93.1% 14.7% 24.0% 21.9% 12.4% Area Response Generation As can be seen from the table, the total WECC frequency response was within the BAL-003-1 standard and well above the FRO: 2292 MW/0.1 Hz compared with the WECC FRO of 949 MW/0.1 Hz. However, the ISO frequency response was below its FRO: 269 MW/0.1 Hz when the ISO FRO is 285 MW/0.1 Hz. Thus, this study showed that although the total system performance was stable with no criteria violations and the WECC frequency response was within the standard, the ISO may not meet the BAL-003-1 standard because its frequency response was below the frequency response obligation. The metric Kt (percentage of responsive generation capacity versus total generation capacity) for this case was 49.1 percent for WECC and 28.8 percent for the ISO. Due to the large amount of inverter-based generation within the ISO BAA, which is not responsive to changes in frequency, the Kt metrics for the ISO was significantly lower than for the WECC as a whole. The headroom of the frequency responsive generation at the ISO was relatively large (4420 MW), but it still wasn’t sufficient to meet the frequency response obligation. A sensitivity study was performed to evaluate the system performance in case of reduced headroom in the ISO. The original April 7, 2024 11 a.m. case had relatively high headroom at the ISO frequency-responsive generation due to low dispatch of the generators that were modeled on line. The sensitivity case was created by turning off some units that had low dispatch and re-dispatching their output to other on line units. The ISO generation headroom was reduced in this case from 4420 MW to 1430 MW. No changes were made to the generation dispatch in the rest of WECC. The same contingency of an outage of two Palo Verde units was studied. Frequency on 500 kV buses in the sensitivity case is shown in figure 3.4-7. California ISO/MID 171 2014-2015 ISO Transmission Plan February 2, 2015 Figure 3.4-7: Frequency on 500 kV buses with an outage of two Palo Verde units in the case with the reduced headroom in the ISO The study results showed the frequency performance that still was acceptable (nadir at 59.694 Hz and settling frequency at 59.875 Hz), but it was closer to the margin. 27 MW of load in British Columbia that had under-frequency relay settings at 59.7 Hz was tripped. WECC frequency response was 2137 MW/0.1 Hz, which is within the BAL-003-1 standard. However, the ISO frequency response was only 141 MW/0.1 Hz, which is significantly below its frequency response obligation. Another sensitivity case had the headroom of responsive governors reduced not only in the ISO, but in the rest of WECC. The purpose of this sensitivity study was to determine the minimum amount of headroom that is needed for WECC to have the frequency response within the BAL003-1 standard. The headroom in the ISO remained at 1430 MW as in the first sensitivity case, and the headroom in WECC was reduced in steps to find out the minimum headroom to meet the criteria. Reduction in the headroom was achieved by turning off some frequency responsive California ISO/MID 172 2014-2015 ISO Transmission Plan February 2, 2015 units that had low output and high headroom and re-dispatching their generation to adjacent units. The case that was at the limit (frequency nadir slightly below 59.6 Hz) had total WECC headroom of 11,160 MW. Frequency at 500 kV buses after an outage of two Palo Verde units in this case is shown in figure 3.4-8. Figure 3.4-8: Frequency on 500 kV buses with an outage of two Palo Verde units in the case with the reduced headroom in WECC (total headroom 11,160 MW) Frequency response from all WECC units was 1244 MW/0.1 Hz, which is above the WECC frequency response obligation of 949 MW/0.1 Hz. Frequency response from the ISO was 145 MW/0.1 Hz, which is significantly below ISO frequency response obligation. California ISO/MID 173 2014-2015 ISO Transmission Plan February 2, 2015 3.4.4. Study Conclusions The initial study results indicated acceptable frequency performance within WECC. However, the ISO’s frequency response was below the ISO frequency response obligation specified in BAL-003-1. Compared to the ISO’s actual system performance during disturbances, the study results seem optimistic because actual frequency responses for some contingencies were lower than the dynamic model indicated. Optimistic results were partly due to large headroom of responsive generation modeled in the study case. For future studies, production simulation unit commitment and dispatch levels would have to incorporate operational requirements and available headroom on governor responsive resources would have to be aligned with actual operating conditions. Amount of headroom on responsive governors is a good indicator of the Frequency Response Metric, but it is not the only indicator. Higher available headroom on a smaller number of governor responsive resources can result in less frequency response than lower available headroom on a larger number of governor responsive resources for the same contingency. Further model validation is needed to ensure that governor response in the simulations matches their response in the real life. Exploration of other sources of governor response is needed. Further work will investigate measures to improve the ISO frequency response post contingency. These measures may include the following: load response, response from storage and frequency response from inverter-based generation. Other contingencies may also need to be studied, as well as other cases with reduced headroom. Future work will also include validation of models based on real-time contingencies and studies with modeling of behind the meter generation. California ISO/MID 174 2014-2015 ISO Transmission Plan February 2, 2015 Chapter 4 4 Policy-Driven Need Assessment 4.1 Study Assumptions and Methodology 4.1.1 33% RPS Portfolios The California Energy Commission and the California Public Utilities Commission recommended on February 27, 2014 renewable resource portfolios for the ISO 2014-2015 transmission planning process 47. These portfolios demonstrated the continued progress made towards meeting California’s Renewable Portfolio Standard (RPS) mandate as well as a dedication to using preferred resources to achieve the state’s climate goals. The renewable net short energy calculation dropped from 32,000 GWh to 30,551 GWh, reflecting the progress achieved through new renewable generation coming on line and reductions in load growth. Thousands of megawatts of clean, renewable generation from both small and large-scale generators interconnected to California’s grid in recent years, with an increasing amount of renewable generation expected to come online over the next several years. As with the 2013-2014 Transmission Plan, the “commercial interest (base)” portfolio was identified as the appropriate base case for the ISO to study in its 2014-2015 transmission planning process because it represents the most likely path of renewable development in the future. The commercial interest portfolio heavily weights projects with an executed or approved power purchase agreement and, at least, a “data adequacy” status as it pertains to all a major siting applications that are necessary for construction. The CPUC and CEC also highly recommended that the ISO study the two sensitivity scenario portfolios in its 2014-2015 transmission planning process: (1) a “High Distributed Generation (HDG)” portfolio and (2) a “Commercial Interest Sensitivity (CS)” portfolio, which compared to the commercial interest portfolio considers an additional 1500 MW capacity in the Imperial competitive renewable energy zone (CREZ). The base and CS portfolio scenarios were used by the ISO to perform a least regrets transmission need analysis as described in tariff section 24.4.6.6. The ISO and CPUC worked together to model the proposed renewable portfolios into the transmission planning base cases. The installed capacity and energy per year of each portfolio by location and technology are shown in the following tables. 47 http://www.caiso.com/Documents/2014-2015RenewablePortfoliosTransmittalLetter.pdf California ISO/MID 175 2014-2015 ISO Transmission Plan February 2, 2015 Table 4.1-1: Commercial Interest (base) portfolio — base portfolio (MW) Zone Biogas Biomass Geothermal Hydro Large Scale Solar PV Riverside East - - - - 3,038 20 742 - 3,800 10 - - - 1,007 98 - 538 1,653 Imperial - - 30 - 791 10 - 169 1,000 Distributed Solar - PG&E - - - - - 984 - - 984 Carrizo South - - - - 900 - - - 900 Kramer - - 64 - 230 20 250 78 642 Nevada C - - 116 - 400 - - - 516 Mountain Pass - - - - 300 - 358 - 658 Distributed Solar - SCE - - - - - 565 - - 565 NonCREZ 5 103 25 - - 52 - - 185 Westlands 1 - - - 300 183 - - 484 Arizona - - - - 400 - - - 400 Alberta - - - - - - - 300 300 Distributed Solar - SDGE - - - - - 143 - - 143 Baja - - - - - - - 100 100 San Bernardino - Lucerne - - - - 45 - - 42 87 Merced 5 - - - - - - - 5 20 103 235 - 7,411 2,074 1,350 1,227 12,420 Tehachapi Grand Total California ISO/MID 176 Small Solar PV Solar Thermal Wind Grand Total 2014-2015 ISO Transmission Plan February 2, 2015 Table 4.1-2: Commercial Interest Sensitivity (CS) portfolio (MW) Biogas Biomass Geothermal Hydro Large Scale Solar PV - - 572 - 1,638 25 - 265 2,500 10 - - - 1,007 98 - 368 1,483 - - - - 800 - 600 - 1,400 - - - - - 984 - - 984 - - - - 900 - - - 900 - - 64 - 230 20 250 78 642 - - 116 - 400 - - - 516 - - - - 300 - 358 - 658 Distributed Solar - SCE - - - - - 565 - - 565 NonCREZ 5 103 25 - - 49 - - 182 Zone Imperial Tehachapi Riverside East Distributed Solar PG&E Carrizo South Kramer Nevada C Mountain Pass Small Solar PV Solar Thermal Wind Grand Total Westlands 1 - - - 294 174 - - 469 Arizona - - - - 400 - - - 400 Alberta Distributed Solar SDGE Baja San Bernardino Lucerne Merced - - - - - - - 300 300 - - - - - 143 - - 143 - - - - - - - 100 100 - - - - - - - 42 42 5 - - - - - - - 5 Grand Total 20 103 777 - 5,969 2,057 1,208 1,153 11,286 California ISO/MID 177 2014-2015 ISO Transmission Plan February 2, 2015 Table 4.1-3: High Distributed Generation (HDG) portfolio (MW) Biogas Biomass Geothermal Hydro Large Scale Solar PV Distributed Solar - PG&E - - - - - 3,449 - - 3,449 Distributed Solar - SCE - - - - - 1,988 - - 1,988 Riverside East - - - - 800 - 600 - 1,400 10 - - - 887 20 - 368 1,285 Imperial - - 30 - 791 10 - 169 1,000 Nevada C - - 116 - 150 - - - 266 NonCREZ 5 103 25 - - - - - 133 Arizona - - - - 400 - - - 400 Westlands 1 - - - 267 121 - - 389 Alberta - - - - - - - 300 300 Carrizo South - - - - 300 - - - 300 Mountain Pass - - - - - - 165 - 165 Distributed Solar - SDGE - - - - - 157 - - 157 Baja - - - - - - - 100 100 Kramer - - - - - - 62 - 62 San Bernardino - Lucerne - - - - - - - 42 42 Merced 5 - - - - - - - 5 20 103 171 - 3,595 5,745 827 979 11,440 Zone Tehachapi Grand Total Small Solar PV Solar Thermal Wind Grand Total 4.1.2 Assessment Methods for Policy-Driven Transmission Planning NERC and WECC reliability standards and ISO planning standards were followed in the policydriven transmission planning study, which are described in chapter 2 of this plan. Power flow contingency analysis, post transient voltage stability analysis, and transient stability analysis were performed as needed to update the policy driven transmission need analysis performed in the previous three ISO transmission plans. The contingencies that were used in the ISO annual reliability assessment for NERC compliance were revised as needed to reflect the network topology changes and were simulated in the policy-driven transmission planning assessments. Generally, Category C3 overlapping contingencies (e.g., N-1 followed by system adjustments and then another N-1) were not assessed in this assessment. In all cases, curtailing renewable generation following the first contingency can mitigate the impact of renewable generation flow prior to the second contingency. Given high transmission equipment availability, the amount of renewable energy expected to be curtailed following transmission outages is anticipated to be minimal. California ISO/MID 178 2014-2015 ISO Transmission Plan February 2, 2015 Overlapping contingencies that could reasonably be expected to result in excessive renewable generation curtailments were assessed. Outages that potentially impact system-wide stability were extensively simulated and investigated. The existing SPS were evaluated using the base cases. The assessments that have been performed include, but were not limited to, post transient voltage stability and reactive margin analyses and time-domain transient simulations. Power flow studies following the generator deliverability assessment methodology were also performed. Mitigation plans have been developed for the system performance deficiencies identified in the studies and the plans were investigated to verify their effectiveness. Multiple alternatives were compared to identify the preferred mitigations. If a concern was identified in the ISO Annual Reliability Assessment for NERC Compliance but was aggravated by renewable generation, then the preliminary reliability mitigation was tested to determine if it mitigated the more severe problem created by the renewable generation. Other alternatives were also considered. The final mitigation plan recommendation, which may have been the original one or an alternative, was then included as part of the comprehensive plan. 4.1.2.1 Production Cost Simulation The production cost simulation results were used to identify generation dispatch and path flow patterns in the 2024 study year after the renewable portfolios were modeled in the system. Generation exports from renewable generation study areas as well as major transfer path flows from current and previously developed production models with various 33 percent renewable portfolios were reviewed. The ISO production cost simulation models were built from the WECC Transmission Expansion Planning Policy Committee (TEPPC) production simulation models. This information was used to identify high transmission system usage patterns during peak and off-peak load conditions. Selected high transmission usage patterns were used as reference in the power flow and stability base case development. 4.1.3 Base Case Assumptions 4.1.3.1 Starting Base Cases Comparison of All Portfolios The consolidated peak and off-peak base cases used in the ISO Annual Reliability Assessment for NERC Compliance for 2024 were used as the starting points for developing the base cases used in the policy-driven transmission planning study. 4.1.3.2 Load Assumptions For studies that address regional transmission facilities, such as the design of major interties, a 1-in-5 year extreme weather load level was assumed pursuant to the ISO planning standards. An analysis of the RPS portfolios to identify policy-driven transmission needs is a regional transmission analysis. Therefore, the 1-in-5 coincident peak load was used for the policy-driven transmission planning study. A typical off-peak load level on the ISO system is approximately 50 percent of peak load. Therefore, the load level that is 50 percent of the 1-in-5 peak load was selected as the reference for the off-peak load condition as show in table 4.1-4. California ISO/MID 179 2014-2015 ISO Transmission Plan February 2, 2015 Table 4.1-4: Load condition by areas Area in Base Cases 1-in-5 coincident peak load (MW) Area 30 (PG&E) 28,347 Area 24 (SCE) 25,815 Area 22 (SDG&E) 5,209 VEA 152 4.1.3.3 Conventional Resource Assumptions Conventional resource assumptions were the same as those in the reliability assessment. Details can be found in chapter 2. 4.1.3.4 Transmission Assumptions Similar to the ISO Annual Reliability Assessments for NERC Compliance, the policy-driven assessment modeled all transmission projects approved by the ISO. Details can be found in chapter 2. 4.1.4 Power Flow and Stability Base Case Development 4.1.4.1 Modeling Renewable Portfolio 4.1.4.1.1 Power Flow Model and Reactive Power Capability As discussed in section 4.1.1, CPUC and CEC renewable portfolios were used to represent RPS portfolios in the policy-driven transmission planning study. The commissions have assigned renewable resources geographically by technology to CREZ and non-CREZ areas, and to specific substations for some distributed generation resources. Using the provided locations, the ISO represented renewable resources in the power flow model based on information from generator interconnection studies performed by the ISO and utilities. The objective of modeling generation projects this way is not to endorse any particular generation project, but to streamline and focus the transmission analysis on least regrets transmission needs. In other words, transmission project needed for a specific generation project development scenario within a renewable resource area, but not for an alternative generation project development scenario within the same area would be a localized transmission need to be addressed in the interconnection study process. It would not be a least regret transmission need to be addressed in the transmission planning process. If modeling data from ISO or PTO generation interconnection studies were used, they included the reactive power capability (the minimum and the maximum reactive power output). If modeling data came from other sources, an equivalent model was used that matched the California ISO/MID 180 2014-2015 ISO Transmission Plan February 2, 2015 capacity as listed in the portfolios. When an equivalent model was used for large scale wind turbine or solar PV generation, it was assumed that the generation could regulate bus voltage at the point of interconnection utilizing a power factor range of 0.95 lagging to leading. Unity power factor was assumed for solar PV distributed generation. For all other new generation modeled, typical data was used in the equivalent model with a power factor range of 0.90 lagging and 0.95 leading. 4.1.4.1.2 Dynamic Modeling of Renewable Generators Similar to the power flow model, if the modeling data came from the ISO or PTO generation interconnection studies, then the dynamic models from the generation interconnection study, if available, were used. If dynamic models were not available, then the WECC approved models from the GE PSLF library were used. For geothermal, biomass, biogas and solar thermal projects, dynamic models of similar existing units in the system were used, which included generator, exciter, power system stabilizer and governor models. For wind turbine and PV solar generators, GE Positive Sequence Load Flow Software models from the GE PSLF library were used. In this study, a Type 3 wind turbine generator model for doubly fed induction generators was used for wind generators if the generator type was not specified. For any future wind projects that were specified by interconnection customers as units with full converters, Type 4 inverter models were used. The models for the wind Type 3 projects (doubly fed induction generator) included models for the generator/converter (regc_a), inverter electrical control models applicable to wind plants (reec_a), wind generator torque controller models (wtgq_a), drive train models (wtgt_a), simplified aerodynamic models (wtga_a), and pitch controller models (wtgp_a). In addition to these models, large plants (capacity 20 MW and higher) were assumed to have centralized plant control, which was modeled with a separate model (repc_a). The wind plants’ models also included low and high voltage and low and high frequency protection models (lhvrt, lhfrt). The models for the wind Type 4 projects (full converter) included generator/converter models, electrical controls for inverters and centralized plant control model for the large wind farms. In addition, the same protection that was modeled for the Type 3 projects was modeled for the Type 4. Depending on the design of the turbines, drive train models were also included in some Type 4 wind plants. For both Type 3 and Type 4 dynamic models, the control parameters were set such that the generators have adequate low voltage ride through and low frequency ride through capability. The dynamic data set used for transient stability simulations had also models for Type 1 (induction generator) and Type 2 (induction generator with variable rotor resistance) wind power plants, but these were existing projects built rather significant time ago. These generators are not used in new installations. Dynamic stability models for the solar PV plants distinguished between large solar plants, small plants and distributed solar PV generation. If no data from the interconnection customers was available, it was assumed that the solar PV plants 20 MW and higher connected to the transmission or sub-transmission systems will operate under centralized plant control. For these California ISO/MID 181 2014-2015 ISO Transmission Plan February 2, 2015 projects, dynamic stability models included models for the generator/converter (regc_a), inverter electrical control models applicable to solar PV plants (reec_b) and centralized plant control model (repc_a). The solar PV plants models also included low and high voltage and low and high frequency protection models (lhvrt, lhfrt). For the large plants, it was assumed that the centralized plant controller can regulate voltage at the point of interconnection and the power factor can be maintained between 0.95 leading and 0.95 lagging. Smaller solar PV projects (less than 20 MW) were assumed as not having centralized plant control; therefore datasets for these projects did not include the centralized plant control model. Both large and small solar PV plants were assumed to have adequate low voltage ride through and low frequency ride through capability. Distributed solar PV generation was modeled with the simplified model (pvd1). It was assumed that these units have unity power factor and don’t have voltage regulation. 4.1.4.2 Generation Dispatch and Path Flow in Base Cases Production cost simulation software was used to predict unit commitment and economic dispatch on an hourly basis for the study year with the results used as reference data to predict future dispatch and flow patterns. Certain hours that represent stressed patterns of path flows in the 2024 study year were selected from the production cost simulation results with the objective of studying a reasonable upper bound on stressed system conditions. The following three critical factors were considered in selecting the stressed patterns: • renewable generation output system wide and within renewable study areas; • power flow on the major transfer paths in California; and • load level. For example, hours that were selected for reference purposes were during times of near maximum renewable generation output within key study areas (Tehachapi, Riverside, Imperial, Fresno, etc.) and near maximum transfers across major ISO transmission paths during peak hours or off-peak hours. It was recognized that modeling network constraints had significant impacts on the production cost simulation results. The simplest constraints are the thermal branch ratings under normal and contingency conditions. It was not practical to model all contingencies and branches in the simulation because of computational limitations. Given this gap between the production cost simulation and the power flow and stability assessments, as well as the fact that the production cost simulation is based on the DC power flow model, the dispatch of conventional thermal units in power flow and stability assessments generally followed variable cost to determine the order of dispatch, but out of order dispatch may have been used to mitigate local constraints. California ISO/MID 182 2014-2015 ISO Transmission Plan February 2, 2015 4.1.5 Testing Deliverability for RPS To supplement the limited number of generation dispatch scenarios that can be practically studied using traditional power flow modeling techniques, and to verify the deliverability of the renewable resources modeled in the base portfolio, an assessment was performed based on the ISO deliverability study methodology. The objectives of the deliverability assessment are as follows: • test the target expanded maximum import capability (MIC) for each intertie to support deliverability for the MW amount of resources behind each intertie in the base portfolio; • test the deliverability of the new renewable resources in the base portfolio located within the ISO balancing authority; and • identify network upgrades needed to support full deliverability of the new renewable resources and renewable resources in the portfolio utilizing the expanded MIC. 4.1.5.1 Deliverability Assessment Methodology The assessment was performed following the on-peak Deliverability Assessment Methodology. The main steps are described below. 4.1.5.2 Deliverability Assessment Assumptions and Base Case A master base case was developed for the on-peak deliverability assessment that modeled all the generating resources in the base portfolio. Key assumptions of the deliverability assessment are described below. Transmission The same transmission system as in the base portfolio power flow peak case was modeled. Load modeling A coincident 1-in-5 year heat wave for the ISO balancing authority area load was modeled in the base case. Non-pump load was the 1-in-5 peak load level. Pump load was dispatched within expected range for summer peak load hours. Generation capacity (Pmax) in the base case The most recent summer peak NQC was used as Pmax for existing thermal generating units. For new thermal generating units, Pmax was the installed capacity. Wind and solar generation Pmax data were set to 20 percent or 50 percent exceedance production level during summer peak load hours. If the study identified 20 or more non-wind generation units contributing to a deliverability constraint, both wind and solar generations were assessed for maximum output of 50 percent exceedance production level for the deliverability constraint, otherwise up to a 20 percent exceedance production level was assessed. California ISO/MID 183 2014-2015 ISO Transmission Plan February 2, 2015 Table 4.1-5: Wind and solar generation exceedance production levels (percentage of installed capacity) in deliverability assessment 20% Exceedance Level 50% Exceedance Level SCE Northern & NOL 61% 38% SCE Eastern 73% 47% SDGE 51% 37% PG&E NorCal 58% 37% PG&E Bay Area (Solano) 71% 47% PG&E Bay Area (Altamont) 63% 32% SCE Northern 99% 92% SCE/VEA others 100% 93% SDGE 96% 87% PG&E 99% 92% Type Wind Solar Area Initial Generation Dispatch All generators except for the OTC units were dispatched at 80 percent to 92 percent of the capacity. The OTC generators were dispatched up to 80 percent of the capacity to balance load and maintain expected imports. Import Levels Imports are modeled at the maximum summer peak simultaneous historical level by branch group. The historically unused existing transmission contracts (ETCs) crossing control area boundaries were modeled as zero MW injections at the tie point, but available to be turned on at remaining contract amounts. For any intertie that requires expanded MIC, the import is the target expanded MIC value. Table 4.1-6 shows the import megawatt amount modeled on the given branch groups. California ISO/MID 184 2014-2015 ISO Transmission Plan February 2, 2015 Table 4.1-6: Base Portfolio deliverability assessment import target Direction Net Import MW Import Unused ETC & TOR MW Lugo-Victorville_BG N-S 1237 3 COI_BG N-S 3770 548 BLYTHE_BG E-W 68 0 CASCADE_BG N-S 80 0 CFE_BG S-N -169 0 ELDORADO_MSL E-W 838 0 IID-SCE_BG E-W Branch Group Name 0 800 IID-SDGE_BG E-W LAUGHLIN_BG E-W -44 0 MCCULLGH_MSL E-W 0 316 MEAD_MSL E-W 952 428 NGILABK4_BG E-W -114 168 NOB_BG N-S 1544 0 PALOVRDE_MSL E-W 2514 185 PARKER_BG E-W 113 19 SILVERPK_BG E-W 6 0 SUMMIT_BG E-W 25 0 SYLMAR-AC_MSL E-W 225 342 11845 2009 Total California ISO/MID 185 0 2014-2015 ISO Transmission Plan February 2, 2015 4.1.5.3 Screening for Potential Deliverability Problems Using DC Power Flow Tool A DC transfer capability/contingency analysis tool was used to identify potential deliverability problems. For each analyzed facility, an electrical circle was drawn which includes all generating units including unused Existing Transmission Contract (ETC) injections that have a 5 percent or greater of the following: • Distribution factor (DFAX) = (Δ flow on the analyzed facility / Δ output of the generating unit) *100% or • Flow impact = (DFAX * capacity / Applicable rating of the analyzed facility) *100%. Load flow simulations were performed, which studied the worst-case combination of generator output within each 5 percent circle. 4.1.5.4 Verifying and refining the analysis using AC power flow tool The outputs of capacity units in the 5 percent circle were increased starting with units with the largest impact on the transmission facility. No more than 20 units were increased to their maximum output. In addition, generation increases were limited to 1,500 MW or less. All remaining generation within the ISO balancing authority area was proportionally displaced to maintain a load and resource balance. When the 20 units with the highest impact on the facility can be increased by more than 1,500 MW, the impact of the remaining amount of generation to be increased was considered using a Facility Loading Adder. This adder was calculated by taking the remaining MW amount available from the 20 units with the highest impact multiplied by the DFAX for each unit. An equivalent MW amount of generation with negative DFAXs was also included in the adder, up to 20 units. If the net impact from the contributions to adder was negative, the impact was set to zero and the flow on the analyzed facility without applying the adder was reported. California ISO/MID 186 2014-2015 ISO Transmission Plan February 2, 2015 4.2 Policy-Driven Assessment in Northern CA (PG&E Area) The renewable generation scenarios assessment included two renewable portfolios evaluations described earlier: Commercial Interest and High Distributed Generation (DG). Power flow studies were performed for all credible contingencies in the same areas of the PG&E transmission system as in the reliability studies. Category C3 contingencies, which is an outage of one transmission facility after another non-common-mode facility is already out, were not studied because it was assumed that the negative impacts can be mitigated by limiting generation following the first contingency. The assessment results were summarized for Northern California without detailed descriptions of each zone. Post transient and transient stability studies that evaluated all major 500 kV single and double contingencies and two-unit outages of nuclear generators were performed for the northern bulk system. The area studies and the bulk system studies included both portfolios for 2024 summer peak load conditions. The area planning divisions in the PG&E area are shown in the figure below. Figure 4.2-1: Planning area divisions of the PG&E system California ISO/MID 187 2014-2015 ISO Transmission Plan 4.2.1 PG&E Policy-Driven and Mitigations February 2, 2015 Powerflow and Stability Assessment Results The PG&E area studies included assumptions on the renewable resources summarized in Table 4.2-1 and table 4.2-2 shows how these resources were distributed among the CREZs. Table 4.2-1: Renewable resources in PG&E area modeled to meet the 33 percent RPS net short Renewable Capacity, MW Portfolio Commercial Interest 2510 MW High DG 4275 MW Table 4.2-2: PG&E Area Renewable Generation by zones modeled to meet 33 percent RPS net short Commercial Interest High DG 900 MW 406 MW 5 MW 5 MW NonCREZ 137 MW 133 MW Westlands 484 MW 389 MW Distributed Generation PG&E 984 MW 3402 MW Total 2510 MW 4335 MW Zones Carrizo South Merced California ISO/MID 188 2014-2015 ISO Transmission Plan February 2, 2015 PG&E areas include the following divisions: Humboldt, North Coast, North Bay, San Francisco, Peninsula, South Bay, East Bay, North Valley, Sacramento, Sierra, Stockton and Stanislaus, Yosemite, Fresno, Kern, Central Coast and Los Padres areas. These areas were described in detail in chapter 2, and as such, the following sections include only the study results and mitigations. 4.2.1.1 PG&E Bulk System The PG&E area bulk system assessment for two renewable generation portfolios was performed with the same methodology that was used for the reliability studies described in chapter 2. All single and common mode 500 kV system outages were studied, as were outages of large generators and contingencies involving stuck circuit breakers and delayed clearing of single-phase-to ground faults for all three portfolios. The studies also included extreme events such as a northeast/southeast separation, outage of all three lines of Path 26 and outages of major substations, such as Los Banos, Tesla and Midway (500 and 230 kV busses). The following two generation portfolios were studied under the 2024 summer peak load conditions: Commercial Interest and High Distributed Generation portfolios. For the peak load conditions studied, it was assumed that the Helms Pump Storage Power Plant was operating in the generation mode with three units generating at total of 854 MW in both portfolios. Diablo Canyon Nuclear Power Plant was assumed to generate with both units at full output. Flow on the California-Oregon Intertie was modeled around 4200 MW and Pacific DC Intertie at 3100 MW in both portfolios. Path 26 (Midway-Vincent 500 kV) flow was modeled at 4000 MW. Post transient and transient stability studies were conducted for all the cases and scenarios. Transient stability studies did not identify any additional criteria violations or un-damped oscillations compared with the reliability studies. On the contrary, transient voltage dip at the irrigational pumps connected to the Midway 230 kV substation with three-phase faults at the Midway 230 kV bus was not as large as in the reliability studies, and the oscillations were not as large. The better system performance can be explained by the dynamic reactive support from the new generation projects located in the Midway area. There were no transient voltage stability violations in the Policy-Driven scenarios with these contingencies. In the 2024 Reliability summer peak case, the transient voltage dip on the Windgap irrigational pumps was outside of the criteria. In all the cases, Reliability and both Policy-Driven portfolios slightly delayed frequency recovery at the Midway irrigational pumps and at several buses on the subtransmission system around the Midway Substation was observed after a three-phase fault at the Midway 230 kV bus. The following plots illustrate voltage and frequency at the Wind Gap #2 pump with a three-phase six-cycle fault at the Midway 230 kV bus cleared by opening of the Midway-Gates 230 kV transmission line. California ISO/MID 189 2014-2015 ISO Transmission Plan February 2, 2015 Figure 4.2.1-1: Frequency and voltage at the Wind Gap # 2 pump with the Midway-Gates 230 kV contingency in the 2024 Summer Peak Reliability case Figure 4.2.1-2: Frequency and voltage at the Wind Gap # 2 pump with the Midway-Gates 230 kV contingency in the 2024 Summer Peak Commercial Interest case California ISO/MID 190 2014-2015 ISO Transmission Plan February 2, 2015 Figure 4.2.1-3: Frequency and voltage at the Wind Gap # 2 pump with the Midway-Gates 230 kV contingency in the 2024 Summer Peak High DG case As can be seen from figures 4.2.1-1 – 4.2.1-3, Policy-Driven scenarios show better transient stability performance than the Reliability case. For the post-transient (governor power flow) studies, only transmission facilities 115 kV and higher were monitored because lower voltage facilities were studied with other outages in the detailed assessments of the PG&E areas that are described in these area studies. The governor power flow studies did not identify any thermal or voltage concerns in addition to those that were identified in the Reliability studies. Some of the overloads that were identified in the Reliability studies were lower in the Policy-Driven scenarios, and the other facilities overloaded in the Reliability studies were not identified as overloaded. The main reason for that is lower COI flow compared with the Reliability studies. 4.2.1.1.1 Study Results and Discussion Thermal Overloads No thermal overloads in addition to those identified in the Reliability studies were identified in the Policy-Driven portfolios. Voltage Issues Voltage and Voltage Deviation Concerns No voltage or voltage deviation concerns were identified on the PG&E bulk system in the studies in any renewable portfolios under the conditions studied. California ISO/MID 191 2014-2015 ISO Transmission Plan February 2, 2015 Transient Stability Concerns Compared with the results of the reliability studies described in chapter 2, no additional concerns were identified in the transient stability studies in any of the renewable portfolios both under peak and off-peak load conditions. San Luis Transmission Project As set out in section 2.4.3, Duke-America Transmission Company, Path 15, LLC (DATCP) submitted as a stakeholder comment that the ISO should approve participation in WAPA’s San Luis Transmission project. The reliability benefits were explored in section 2.4.3, and no benefits were found at that initial stage of analysis. This discussion describes the ISO’s review of the potential policy benefits. DATCP suggested that the additional capacity between Tracey and Los Banos would support the state’s greenhouse gas objectives by enabling additional renewable generation development, beyond the current 33 percent RPS portfolio framework, which the ISO notes were developed by the CPUC specifically to support the transmission planning process. The ISO has conducted its review in this context on the basis of the renewable generation portfolios, and has found that the current portfolios do not support the need for additional capacity on this transmission path. The ISO recognizes that increased renewable generation is likely in the future, but that there is no basis to conclude that there will be a need for future capacity at this time. The ISO understands that WAPA’s decision to proceed with a 230 kV or 500 kV alternative can align with the results of the 2015-2016 transmission planning cycle being available in March 2016, and therefore intends to review the situation, as well as any developments in renewable generation policy in that plan. DATCP has further suggested that participation in the project is supported by federal and state policies supporting efficient use of rights of way. The ISO supports these policies in selecting and scoping transmission solutions to identified ISO needs, which have yet to be established for this project. Accordingly, no established policy benefits were found in this review, and the ISO intends to conduct additional review in the 2015-2016 planning cycle. The potential for economic benefits are discussed in section 5.7. 4.2.1.2 Humboldt Area The Humboldt area is located in the most northern part of the PG&E system along the Pacific Coast. The studies for renewable portfolios assumed 0 MW of renewable generation in Humboldt in the Commercial Interest portfolio and the High DG scenario had 43 MW of renewables modeled in the Humboldt area. California ISO/MID 192 2014-2015 ISO Transmission Plan February 2, 2015 4.2.1.2.1 Study Results and Discussion Thermal Overloads Rio Dell Junction-Bridgeville 60 kV transmission line The Carlotta to Rio Dell section of the Rio Dell Junction-Bridgeville 60 kV transmission line may overload under Category C contingency of the loss of the Humboldt 60 kV bus in the peak Commercial Interest and High DG portfolio cases. Under these scenarios the line is seen to be loaded to just above a 100 percent of its emergency rating. The loading on this line is primarily been driven by the high levels of generation dispatch in the Humboldt Bay power plant in the starting base case. The overload can be mitigated by reducing the Humboldt Bay generation. The observed thermal overload problems and their solutions are illustrated in figure 4.2–2. Figure 4.2–2: Humboldt area overloads Voltage Issues Voltage and Voltage Deviation Concerns No voltage concerns were identified in the Humboldt area for any of the renewable portfolios under peak or off-peak load conditions. California ISO/MID 193 2014-2015 ISO Transmission Plan February 2, 2015 4.2.1.3 North Coast and North Bay Area The North Coast and North Bay areas are located between the Humboldt area and San Francisco and include Mendocino, Lake, Sonoma and Marin counties and parts of Napa and Solano counties. The RPS studies have modeled one new 15 MW geothermal generator and one existing 10 MW geothermal unit in the North Coast and North Bay area with a total of 25 MW of renewable generation modeled in the Commercial Interest portfolio. The High DG portfolio has a total of 374 MW of renewable generation modeled in the North Coast and North Bay area. 4.2.1.3.1 Study Results and Discussion The scope of this analysis is limited to reporting the transmission issues caused exclusively by the renewable portfolio. Results of the North Coast and North Bay reliability analysis have already been presented in chapter 2. The study provided details of the facilities in the North Coast and North Bay areas that were identified as not meeting thermal loading and voltage performance requirements under normal and various system contingency conditions. This analysis with the renewable portfolio modeled found only one constraint that was not identified in the reliability assessment. Additionally, it was also seen that the mitigations that were identified in the reliability assessment would effectively solve the thermal and voltage constraints that were seen in the renewable portfolio analysis. Thermal Overloads No thermal issues incremental to what have already been identified in the reliability were seen in this analysis. Voltage Issues Voltage and Voltage Deviation Concerns No voltage or voltage deviation issues in addition to what have already been identified in the reliability analysis discussed in chapter 2 were identified in this analysis. Voltage violation issues that are local in nature may arise depending on where the renewable generators will actually connect to the grid. Such issues can be sufficiently mitigated by requiring all renewable generators, including distributed generation, to provide 0.95 lead/lag power factor capability and by adjusting transformer taps on the 115/60 kV transformers in the area. California ISO/MID 194 2014-2015 ISO Transmission Plan February 2, 2015 4.2.1.4 North Valley Area This area includes the Northern end of the Sacramento Valley and parts of the Siskiyou and Sierra mountain ranges and foothills. The RPS studies have 58 MW of renewable generation modeled in the Commercial Interest portfolio and the High DG portfolio has a total of 372 MW of renewable generation modeled in the North Valley area. 4.2.1.4.1 Study Results and Discussion Thermal Overloads No thermal overloads in addition to those identified in the Reliability studies were identified in the Policy-Driven portfolios. Voltage Issues No voltage or voltage deviation concerns were identified in the studies in any renewable portfolios under the conditions studied. 4.2.1.5 Central Valley Area The Central Valley area includes the central part of the Sacramento Valley, and it is composed of the Sacramento, Sierra, Stockton and Stanislaus divisions. The reliability studies described in chapter 2 modeled several existing and new renewable projects. This included the Wadham and Woodland biomass projects in Sacramento; the wind generation projects Enxco, Solano, Shiloh and High Winds in Solano County; and existing small hydro projects in the Sierra and Stanislaus divisions. In the renewable portfolios, additional renewable generation was modeled in the Central Valley area. The RPS studies have 49 MW of renewable generation modeled in the Commercial Interest portfolio and the High DG portfolio has a total of 766 MW of renewable generation modeled in the Central Valley area. 4.2.1.5.1 Study Results and Discussion Thermal Overloads No thermal overloads in addition to those identified in the Reliability studies were identified in the Policy-Driven portfolios. Voltage Issues Voltage and Voltage Deviation Concerns No voltage or voltage deviation concerns were identified in the studies in any renewable portfolios under the conditions studied. 4.2.1.6 Greater Bay Area This area includes Alameda, Contra Costa, Santa Clara, San Mateo and San Francisco counties. California ISO/MID 195 2014-2015 ISO Transmission Plan February 2, 2015 The Commercial Interest portfolio had 5 MW of new renewable generation in the Alameda County, 1 MW in the San Mateo County and 144 MW of new renewable generation in the Santa Clara County. The High DG portfolio had 295 MW of new renewable generation in the Alameda County, 177 MW in Contra Costa County, 59 MW in Marin County, 11 MW in San Francisco County, 89 MW in the San Mateo County and 171 MW of new renewable generation in the Santa Clara County. The majority of the renewable projects modeled in the Bay area were small distributed photovoltaic generators. 4.2.1.6.1 Study Results and Discussion Thermal Overloads No thermal overloads in addition to those identified in the Reliability studies were identified in the Policy-Driven portfolios. Voltage Issues No voltage violations in addition to those identified in the Reliability studies were identified in the Policy-Driven portfolios. 4.2.1.7 Fresno The Fresno area is located in the central to southern PG&E service territory. This area includes Madera, Mariposa, Merced and Kings Counties, which are located within the San Joaquin Valley Region. The RPS studies have 849 MW of renewable generation modeled in the Commercial Interest Portfolio and the High DG portfolio has a total of 1079 MW of renewable generation modeled in the Fresno area. 4.2.1.7.1 Study Results and Discussion Thermal Overloads No thermal overloads in addition to those identified in the Reliability studies were identified in the Policy-Driven portfolios. Voltage Issues No voltage violations in addition to those identified in the Reliability studies were identified in the Policy-Driven portfolios. 4.2.1.8 Kern Area The Kern area is located south of the Yosemite-Fresno area and north of the Southern California Edison (SCE) service territory. The RPS studies have 326 MW of renewable generation modeled in the Commercial Interest Portfolio and the High DG portfolio has a total of 372 MW of renewable generation modeled in the North Valley area. California ISO/MID 196 2014-2015 ISO Transmission Plan February 2, 2015 4.2.1.8.1 Study Results and Discussion Thermal Overloads No thermal overloads in addition to those identified in the Reliability studies were identified in the Policy-Driven portfolios. Voltage Issues No voltage violations in addition to those identified in the Reliability studies were identified in the Policy-Driven portfolios. 4.2.1.9 Central Coast and Los Padres Areas 4.2.1.9.1 Study Results and Discussion The Central Coast area is located south of the Greater Bay Area and extends along the Central Coast from Santa Cruz to King City with the transmission system serving Santa Cruz, Monterey and San Benito counties. The Los Padres area is located in the southwest portion of PG&E’s service territory south of the Central Coast area with the transmission system serving San Luis Obispo and Santa Barbara counties. The RPS studies have 1052 MW of renewable generation modeled in the Commercial Interest Portfolio and the High DG portfolio has a total of 512 MW of renewable generation modeled in the Central Coast and Los Padres area. 4.2.1.9.2 Study Results and Discussion Thermal Overloads No thermal overloads in addition to those identified in the Reliability studies were identified in the Policy-Driven portfolios. Voltage Issues No voltage violations in addition to those identified in the Reliability studies were identified in the Policy-Driven portfolios. California ISO/MID 197 2014-2015 ISO Transmission Plan February 2, 2015 4.2.2 Northern PG&E System Policy-Driven Deliverability Assessment Results and Mitigations Base Portfolio Deliverability Assessment Results Deliverability assessment results for PG&E North area are shown in the table below. Table 4.2–3: Base portfolio deliverability assessment results for PG&E North area Overloaded Facility Delevan-Cortina 230 kV Line Contingency Delevan-Vaca Dixon #2 230 kV Line and Delevan-Vaca Dixon #3 230 kV Line Flow 107% Undeliverable Zone Mitigation Cottonwood Area Rerate the line Deliverability of the new renewable resources in the Cottonwood area is limited by overloads on the Delevan-Cortina 230 kV lines. The potential overload mitigation on the Delevan-Cortina 230 kV line is to rerate the transmission line. Analysis of Other Portfolios The need for transmission upgrades identified above is analyzed for other renewable portfolios by comparing the generation behind the deliverability constraint. The results are shown in Table 4.2–4. The generation capacity listed for each renewable zone represents only the generators contributing to the deliverability constraint and may be lower than the total capacity in the renewable zone. Table 4.2–4: Portfolios requiring transmission upgrades Transmission Upgrade Delevan-Cortina 230 kV line California ISO/MID Renewable Zones Cottonwood Area(115kV) Com. Interest (MW) 40 High DG (MW) 40 Needed for portfolios Commercial Interest High DG 198 2014-2015 ISO Transmission Plan February 2, 2015 Recommendation The following transmission upgrade is needed for the base portfolio, plus at least one other portfolio: • re-rate or reconductor the Delevan-Cortina 230 kV line. This transmission upgrade is recommended as policy-driven upgrade. Transmission Plan Deliverability with Recommended Transmission Upgrades No area deliverability constraint was identified in PG&E North area. California ISO/MID 199 2014-2015 ISO Transmission Plan February 2, 2015 4.2.3 Southern PG&E System Policy-Driven Deliverability Assessment Results and Mitigations PGE south area consists of the following renewable zones: Carrizo south, Merced, Westland, Non CREZ Central Coast/Los Padres and PG&E distributed generation. All the overloads seen in the deliverability analysis for PG&E south were local constraints which will be addressed when the resource gets studied in generation interconnection process. Deliverability assessment results for PG&E south area are shown in the table below. Table 4.2–5: Deliverability assessment results for PG&E South Area Overloaded Facility Mendota-San JoaquinHelm 70 kV Line Contingency Normal Coburn 230/60 kV Transformer #2 Coburn 230/60 kV Transformer #1 Arco-Carneras 70 kV Line Carneras-Taft 70 kV Line Fellows-Taft 115 kV Line Midway-Taft 115 kV Line Flow Undeliverable Zone Mitigation Westlands Local constraint to be addressed in generation interconnection PG&E DG Local constraint to be addressed in generation interconnection 107% Westlands & PG&E DG Local constraint to be addressed in generation interconnection 105% PG&E DG & Kern Area Non-CREZ Local constraint to be addressed in generation interconnection 110% 137% Recommendation No transmission upgrades are recommended based on the policy-driven deliverability analysis for PG&E south. All the overloads seen in the deliverability analysis for PG&E south were local constraints which will be addressed when the resource gets studied in generation interconnection process. California ISO/MID 200 2014-2015 ISO Transmission Plan February 2, 2015 4.2.4 PG&E Area Policy-Driven Conclusions The power flow studies for the PG&E local areas and bulk system showed that the existing transmission system is adequate to accommodate additional renewable generation assumed to be developed in the four portfolios. As discussed earlier in the report, the PG&E local area include the planning areas of Humboldt, North Coast, North Bay, North Valley, Central Valley Greater Bay, Fresno, Kern, and Central Coast and Los Padre. No additional thermal and voltage issues have been identified in the RPS study of these local areas beyond those that were observed in the reliability analysis as discussed in chapter 2 of this report. Mitigations developed in the reliability analysis have been used for common issues between the reliability analysis and RPS analysis. Transient stability studies also did not identify any additional concerns beyond those identified in the reliability studies. The deliverability analysis for the PG&E North area found that the Delevan-Cortina 230 kV line was overloaded under the Category C contingency condition. Rerating the line will mitigate the overload. The deliverability analysis for the PG&E South area found that renewable generation in the three portfolios is constrained by emergency overloads on four 70 kV and 115 kV transmission lines. All the overloads seen in the deliverability analysis for PG&E south were local constraints which will be addressed when the resource gets studied in generation interconnection process. California ISO/MID 201 2014-2015 ISO Transmission Plan February 2, 2015 4.3 Policy-Driven Assessment in Southern California This section presents the policy-driven assessment performed for the southern part of the ISO controlled grid including VEA, SCE, and SDG&E systems. Tables 4.3-1, 4.3–2, and 4.3–3 summarize the renewable generation capacity modeled to meet the RPS net short in the studied areas in each portfolio. Table 4.3-1: Renewable generation installed capacity in the Southern part of the ISO controlled grid modeled to meet the 33% RPS net short — Commercial Interest (base) portfolio Biogas Biomass Geothermal Hydro Large Scale Solar PV Small Solar PV Solar Thermal Wind Grand Total Riverside East 0 0 0 0 3,038 20 742 0 3,800 Tehachapi 10 0 0 0 1,007 98 0 538 1,653 Imperial 0 0 30 0 791 10 0 169 1,000 Mountain Pass 0 0 0 0 300 0 358 0 658 0 0 64 0 230 20 250 78 642 0 0 0 0 0 565 0 0 565 0 0 116 0 400 0 0 0 516 Zone Kramer Distributed Solar SCE Nevada C Arizona 0 0 0 0 400 0 0 0 400 NonCREZ Distributed Solar SDGE Baja 5 103 25 0 0 52 0 0 185 0 0 0 0 0 143 0 0 143 0 0 0 0 0 0 0 100 100 San Bernardino - Lucerne 0 0 0 0 45 0 0 42 87 Grand Total 15 103 235 0 6,211 907 1,350 927 9,747 California ISO/MID 202 2014-2015 ISO Transmission Plan February 2, 2015 Table 4.3-2: Renewable generation installed capacity in the southern part of the ISO controlled grid modeled to meet the 33% RPS net short — Commercial Interest Sensitivity (CS) portfolio Biogas Biomass Geothermal Hydro Large Scale Solar PV Imperial 0 0 572 0 1,638 25 0 265 2,500 Tehachapi 10 0 0 0 1,007 98 0 368 1,483 Riverside East 0 0 0 0 800 0 600 0 1,400 Mountain Pass 0 0 0 0 300 0 358 0 658 Zone Small Solar PV Solar Thermal Wind Grand Total Kramer Distributed Solar SCE Nevada C 0 0 64 0 230 20 250 78 642 0 0 0 0 0 565 0 0 565 0 0 116 0 400 0 0 0 516 Arizona 0 0 0 0 400 0 0 0 400 NonCREZ Distributed Solar SDGE Baja 5 103 25 0 0 49 0 0 182 0 0 0 0 0 143 0 0 143 0 0 0 0 0 0 0 100 100 San Bernardino - Lucerne 0 0 0 0 0 0 0 42 42 Grand Total 15 103 777 0 4,775 899 1,208 853 8,629 California ISO/MID 203 2014-2015 ISO Transmission Plan February 2, 2015 Table 4.3-3: Renewable generation installed capacity in the Southern part of the ISO controlled grid modeled to meet the 33% RPS net short — High Distributed Generation (HDG) portfolio Zone Biogas Biomass Geothermal Hydro Large Scale Solar PV Distributed Solar SCE 0 0 0 0 0 1,988 0 0 1,988 Riverside East 0 0 0 0 800 0 600 0 1,400 Tehachapi 10 0 0 0 887 20 0 368 1,285 Imperial 0 0 30 0 791 10 0 169 1,000 Arizona 0 0 0 0 400 0 0 0 400 Nevada C 0 0 116 0 150 0 0 0 266 Mountain Pass 0 0 0 0 0 0 165 0 165 Small Solar PV Solar Thermal Wind Grand Total Distributed Solar SDGE NonCREZ 0 0 0 0 0 157 0 0 157 5 103 25 0 0 0 0 0 133 Baja 0 0 0 0 0 0 0 100 100 Kramer 0 0 0 0 0 0 62 0 62 San Bernardino - Lucerne 0 0 0 0 0 0 0 42 42 Grand Total 15 103 171 0 3,028 2,175 827 679 6,998 Previously Identified Renewable Energy-Driven Transmission Projects Several transmission projects that were identified in the Southern California area during previous transmission planning processes to interconnect and deliver renewable generation have been included in the base cases for all portfolios. The following is a list of the projects in the Southern California area along with a brief description. West of Devers Project The project involves rebuilding the four existing 220 kV transmission lines west of Devers with high capacity conductors. The completion date for this upgrade is estimated to be in 2020. Tehachapi Renewable Transmission Project The multi-phase project includes the new Whirlwind 500 kV Substation, new 500 kV and 220 kV transmission lines and upgrading existing 220 kV lines. Segments 6, 7, 8, 9 and 11 are still under construction. The expected completion date for all segments is 2016. Devers-Mirage 230 kV Lines Upgrade California ISO/MID 204 2014-2015 ISO Transmission Plan February 2, 2015 The project consists of SCE’s portion of the Path 42 project, which includes reconductoring the Devers-Mirage 230 kV transmission line. The project engineering work is currently underway with an expected in-service date of 2015. The Path 42 project also consists of IID’s portion, which includes upgrading the Coachella Valley-Mirage 230 kV transmission line and upgrading the Coachella Valley-Ramon-Mirage 230 kV transmission line. El Dorado–Lugo Series Caps Upgrade This project includes upgrading El Dorado–Lugo series capacitor and terminal equipment at both ends of the 500 kV line. The expected in-service date is 2016. Lugo-Eldorado 500 kV line reroute This project includes rerouting a short segment of the Lugo-Eldorado 500 kV line so that it is not adjacent to the Lugo-Mohave 500 kV line. The expected in-service date is 2016. Lugo-Mojave Series Caps Upgrade This project includes upgrading Lugo-Mojave series capacitor and terminal equipment at both ends of the 500 kV line. The expected in-service date is 2016. Coolwater-Lugo 230 kV Transmission Line Project This project consists of a new 230 kV transmission line between Coolwater and Lugo substations. A Certification of Public Necessity and Convenience (CPCN) application for this project was filed by SCE on August 28, 2013. Suncrest 300 MVAR SVC This project includes installation of 300 MVAR of dynamic reactive support at Suncrest 230 kV bus. The expected in-service date is 2016. Sycamore – Penasquitos 230 kV Line This project consists of a new 230 kV transmission line between Sycamore and Penasquitos 230 kV substations. The expected in-service date is 2017. California ISO/MID 205 2014-2015 ISO Transmission Plan February 2, 2015 4.3.1 Southern California Policy-Driven Powerflow and Stability Assessment Results and Mitigations Following is a summary of the study results identifying facilities in the SCE, SDG&E and VEA areas that did not meet system performance requirements. System performance concerns that were identified and mitigated in the reliability assessment are not presented in this section unless the degree of the system performance concern was found to materially increase. The discussion includes proposed mitigation plans for the system performance concerns identified. Commercial Interest (base) Portfolio Assessment Results Table 4.3-4 summarizes the powerflow and stability assessment results for the base portfolio. Table 4.3-4: Summary of study results for base portfolio Overloaded Facility Contingency Flow Miguel 500/230 kV Bank 80 Miguel 500/230 kV Bank 81 123% Miguel 500/230 kV Bank 81 Miguel 500/230 kV Bank 80 121% RUM-HRA 230 kV line (CFE) Otay Mesa-Miguel 230 kV #1 and #2 141% IV 500/230 kV Bank 80 IV Breaker 8022 (N. Gila – IV 500kV + IV 500/230 Bank 81) 118% IV 500/230 kV Bank 82 IV Breaker 8022 (N. Gila – IV 500kV + IV 500/230 Bank 81) 105% IV – ECO 500 kV line Suncrest-Sycamore 230 kV #1 and #2 107% ECO-Miguel 500 kV line Suncrest-Sycamore 230 kV #1 and #2 111% Bay Blvd-Miguel 500 kV line Miguel-Mission 230kV line #1 and #2 102% Overvoltage Issue Contingency Voltage (pu) Borrego 69kV 1.07 Narrows 69kV 1.06 Base case Crestwood 69kV 1.06 North Gila 500kV 1.07 California ISO/MID 206 2014-2015 ISO Transmission Plan February 2, 2015 Thermal Overloads Miguel 500/230 kV Transformer Banks Overload One Miguel 500/230 kV transformer bank was overloaded for the T-1 contingency of the other Miguel 500/230 kV transformer bank. The overloads can be mitigated by relying on short term ratings of the transformers and bringing the flow back within the normal rating. RUM – HRA 230 kV (CFE) The assessment identified a Category C overload on CFE’s RUM - HRA 230 kV line. The overload can be mitigated by modifying the existing Otay Mesa SPS as part of the Miguel Tap Reconfiguration Project. Since this is a local issue, modifying the existing SPS will be handled through generation interconnection studies. Imperial Valley 500/230 kV Transformer Banks The assessment identified Category C overloads on Imperial Valley transformer banks 80 and 81 for the contingency of Imperial Valley circuit breaker 8022. Relying on the 30-minute emergency rating for both the banks and redispatching generation would mitigate this overload concern. Imperial Valley – ECO – Miguel 500 kV The assessment identified Category C overloads on Imperial Valley – ECO 500 kV and ECO – Miguel 500 kV lines for Category C contingency of Suncrest – Sycamore 230 kV lines no. 1 and no. 2. Bypassing series capacitors on ECO – Miguel and Ocotillo – Suncrest 500 kV lines can mitigate this overload. Miguel – Bay Boulevard 230 kV The assessment identified a Category C overload on Bay Boulevard - Miguel 230 kV line for the contingency of Miguel – Mission No. 1 and No. 2 230 kV lines. The overloads can be mitigated by relying on congestion management and an SPS to trip Pio Pico generation. Voltage Concerns High voltages at Borrego, Narrows and Crestwood 69kV and North Gila 500 kV Voltage at the aforementioned buses exceeded the applicable high voltage limit of 1.05 p.u. under normal conditions. Since this is a local issue, modifying the existing SPS will be handled through generation interconnection studies. High Distributed Generation Portfolio Assessment Results High Distributed Generation portfolio assessment resulted in less severe area-wide issues than the base portfolio. All these issues are already captured in the base portfolio results and potential mitigations. California ISO/MID 207 2014-2015 ISO Transmission Plan February 2, 2015 Commercial Interest Sensitivity (CS) Portfolio Assessment Results The CS portfolio has 2,500 MW of additional generation in the Imperial zone instead of the 1,000 MW modeled in the base portfolio. Table 4.3-5 summarizes the powerflow and stability assessment results for the CS portfolio. Table 4.3-5: Summary of study results for CS portfolio Overloaded Facility Contingency Flow Miguel 500/230 kV Bank 80 Miguel 500/230 kV Bank 81 137% Miguel 500/230 kV Bank 81 Miguel 500/230 kV Bank 80 134% IV 500/230 kV Bank 81 129% IV 500/230 kV Bank 82 122% IV Breaker 8022 (N. Gila – IV 500kV + IV 500/230 Bank 81) 145% IV 500/230 kV Bank 81 101% IV 500/230 kV Bank 82 120% IV Breaker 11T (IV 500/230 Bank 81 + IVCFE PST) 102% IV 500/230 kV Bank 81 102% IV 500/230 kV Bank 82 116% IV Breaker 8022 (N. Gila – IV 500kV + IV 500/230 Bank 81) 130% Suncrest – Ocotillo 500 kV 106% Suncrest – Sycamore 230 kV #1 and #2 117% Suncrest – Ocotillo 500 kV 110% Suncrest – Sycamore 230 kV #1 and #2 116% Suncrest-Sycamore 230 kV #2 111% Miguel-ECO 500 kV 106% IV CB 8032 (ECO-IV + IV Bank 82) 102% Suncrest-Sycamore 230 kV #1 111% Miguel-ECO 500 kV 106% IV 500/230 kV Bank 80 IV 500/230 kV Bank 81 IV 500/230 kV Bank 82 IV – ECO 500 kV line ECO-Miguel 500 kV line Suncrest-Sycamore 230 kV #1 Suncrest-Sycamore 230 kV #2 California ISO/MID 208 2014-2015 ISO Transmission Plan February 2, 2015 IV CB 8032 (ECO-IV + IV Bank 82) 102% Suncrest 500/230 kV Bank 80 Suncrest 500/230 kV Bank 81 112% Suncrest 500/230 kV Bank 81 Suncrest 500/230 kV Bank 80 112% Miguel – Mission 230kV line No. 1 and No. 2 111% Sycamore – Artesian 230 kV + Sycamore – Penasquitos 230 kV 109% Miguel – Bay Blvd 230 kV Thermal Overloads Miguel 500/230 kV Transformer Banks Overload Miguel 500/230 kV transformer bank 80 was overloaded for the contingency of Miguel 500/230 kV transformer bank 81 and vice-versa. The short term ratings of the transformers are not sufficient for the loading levels observed in the CS portfolio. In section B6.2.1 of Appendix B, the same overload was identified as part of reliability assessment. As a conceptual mitigation for this issue, the reliability assessment recommendation is to open the remaining Miguel 500/230 kV for the loss of the other Miguel bank. This is equivalent to opening ECO – Miguel 500 kV line. Due to additional renewable generation dispatched in the Imperial zone, such an action would require tripping generation. Hence, an SPS to trip generation in IV area for this contingency is needed to mitigate this overload. Imperial Valley 500/230 kV Transformer Banks The assessment identified Category B and C overloads on Imperial Valley transformer banks 80, 81 and 82. Category B contingency of any of the banks and Category C contingency of Imperial Valley circuit breaker 8022 or 11T result in overloads on these transformer banks. The 30-minute emergency rating is sufficient except in the case of bank 80 for the contingency of Imperial Valley breaker 8022. Bypassing series capacitors on ECO – Miguel and Ocotillo – Suncrest 500 kV lines can mitigate this bank 80 overload. Imperial Valley – ECO – Miguel 500 kV The assessment identified Category B and C overloads on Imperial Valley – ECO 500 kV and ECO – Miguel 500 kV lines. Category B contingency of Suncrest – Ocotillo 500 kV line with generation tripping resulted in overloads. Category C contingency of Suncrest – Sycamore 230 kV lines no. 1 and no. 2 also resulted in overloads. Bypassing series capacitors on ECO – Miguel and Ocotillo – Suncrest 500 kV lines can mitigate these overload conditions. Suncrest – Sycamore 230 kV The assessment identified Category B overload on Suncrest – Sycamore 230 kV line no. 1 for Category B contingency of one of the Suncrest – Sycamore 230 kV line no. 2 and vice-versa. Another Category B contingency of ECO – Miguel 500 kV line also resulted in overloads on Suncrest – Sycamore 230 kV lines. Category C overloads were observed for the contingency of California ISO/MID 209 2014-2015 ISO Transmission Plan February 2, 2015 Imperial Valley circuit breaker 8032. Implementing a generation trip SPS for the N-1 contingency of Suncrest – Sycamore 230 kV line outage and bypassing series capacitors on ECO – Miguel and Ocotillo – Suncrest 500 kV lines can mitigate these overloads. Suncrest 500/230 kV Transformer Banks Overload Suncrest 500/230 kV transformer bank 80 was overloaded for the T-1 contingency of Suncrest 500/230 kV transformer bank 81 and vice-versa. The short term ratings of the transformers are not sufficient for the loading levels observed in the CS portfolio. In B6.2.1 of Appendix B, the same overload was identified as part of reliability assessment. As a conceptual mitigation for this issue, the reliability assessment recommendation is to open the remaining Suncrest 500/230 kV for the loss of the other Suncrest bank. This is equivalent to opening Suncrest – Ocotillo 500 kV. Due to additional renewable generation dispatched in the Imperial zone, such an action would require tripping generation. Even with the generation trip, the N-1 of Suncrest – Ocotillo 500 kV line resulted in overloads in the CS portfolio. Alternatively, relying on 30-minute emergency rating of Suncrest transformers, bypassing series capacitors on ECO – Miguel and Ocotillo – Suncrest 500 kV lines and limiting Imperial zone portfolio generation to ~1,800 MW can mitigate this issue. Miguel – Bay Boulevard 230 kV The assessment identified a Category C overload on Bay Boulevard – Miguel 230 kV line for the contingency of Miguel – Mission No. 1 and No. 2 230 kV lines. The overloads can be mitigated by relying on congestion management and an SPS to trip Pio Pico generation. Since this is a local issue, it will be handled through generation interconnection studies. Voltage Concerns Voltage deviation issues for Suncrest – Ocotillo 500 kV outage Bypassing the series capacitors on Suncrest – Ocotillo 500 kV line and on the Miguel – ECO 500 kV line can partially mitigate various overloads reported above. But the series capacitor bypass also results in certain voltage deviation issues. Miguel 500 kV, ECO 500 kV, ECO 138 kV, Boulevard 138 kV and Boulevard 69 kV buses experienced voltage deviations greater than 5 percent for Category B contingency Suncrest – Ocotillo 500 kV line. Limiting Imperial zone portfolio generation to ~1800 MW can mitigate this issue. Several Category B and C issues were identified in the Imperial Valley area in the CS portfolio. Using an SPS to trip generation is not sufficient to eliminate all of the identified overloads but they can be partially mitigated with by-passing the series capacitors on the ECO– Miguel and Ocotillo – Suncrest 500 kV lines under normal conditions in conjunction with the mitigations discussed for the base portfolio. These mitigation measures together are sufficient to accommodate ~1,800 MW of renewable generation in the Imperial zone (~1,900 MW in Imperial and Baja zones). Significant transmission enhancements may be needed to accommodate the entire 2,500 MW of portfolio generation in the Imperial zone. California ISO/MID 210 2014-2015 ISO Transmission Plan February 2, 2015 Considering the results of all the portfolios assessed during the 2014-2015 transmission planning cycle, the ISO recommends the following mitigations to ensure that ~1800 MW of generation, incremental to existing generation, can be accommodated in the Imperial zone: - by-pass series capacitors on ECO – Miguel 500 kV and Ocotillo – Suncrest 500 kV lines; - modify Imperial Valley SPS to include generation tripping following Miguel 500/230 kV transformer outage (T-1) and following Suncrest 500/230 kV transformer outage; and - rely on 30-minute emergency rating of 500/230 kV transformer banks at Imperial Valley and Suncrest. California ISO/MID 211 2014-2015 ISO Transmission Plan February 2, 2015 4.3.2 SCE and VEA Area Policy-Driven Deliverability Assessment Results and Mitigations Base portfolio Deliverability Assessment Results Deliverability assessment results for SCE and VEA area are discussed below. North of Inyokern Constraint Deliverability of the new renewable resources north of Inyokern is limited by the overloads on Inyo phase shifting transformer. Upgrading the Inyo phase shifting transformer to +/-60 degree angle regulation could control the normal condition flow from Control to Inyo below 20 MW and thus mitigate the overloads. The constraint is localized in nature and should be addressed through the generator interconnection process. Table 4.3-6: Base portfolio deliverability assessment results — North of Inyokern Constraint Overloaded Facility Contingency Flow Inyo 115kV phase shifting transformer Base Case 102.66% Table 4.3-7: North of Inyokern Deliverability Constraint Constrained Renewable Zones Kramer (north of Randsburg); Nevada C (Control) Total Renewable MW Affected 64 MW Deliverable MW w/o Mitigation < 60 MW Upgrade Inyo phase shifting transformer Mitigation Local constraint to be addressed in generation interconnection process Coolwater 115 kV Constraint Deliverability of the new renewable resources interconnecting in the Coolwater 115 kV system is limited by the voltage instability and the contingency overloads on 115 kV transmission lines between Ivanpah and Kramer. The voltage instability and overloads can be mitigated by building a 2nd 115kV transmission line from Coolwater to the switching yard (RPSC0015) on the existing Coolwater – Dunnside – Baker – Mountain Pass 115 kV line where the renewable generator is interconnecting and installing an SPS to trip generation. The constraint is localized in nature and should be addressed through the generator interconnection process. California ISO/MID 212 2014-2015 ISO Transmission Plan February 2, 2015 Table 4.3-8: Base portfolio deliverability assessment results — Coolwater 115 kV Constraint Overloaded Facility Contingency Flow Base Case 226.28% RPSC0015 – Dunnside 115 kV 220.76% Dunnside – Baker – Mountain Pass 115 kV 220.10% Mountain Pass – Ivanpah 115 kV 203.99% Coolwater - Tortilla - Segs2 115kV (Tortilla leg) Kramer – Coolwater 115kV #1 107.94% Voltage Instability Coolwater – RPSC0015 115kV #1 Coolwater – RPSC0015 115kV No. 1 Table 4.3-9: Coolwater 115 kV Deliverability Constraint Constrained Renewable Zones Kramer (Coolwater 115 kV) Total Renewable MW Affected 230 MW Deliverable MW w/o Mitigation < 80 MW Mitigation New Coolwater – RPSC0015 115 kV #2 transmission line and SPS tripping generation Local constraint to be addressed in generation interconnection process Devers – Red Bluff Constraint Deliverability of the new renewable resources in Riverside East is limited by the contingency overloads on Devers – Red Bluff 500 kV line. The overloads can be mitigated by an SPS bypassing the series capacitor on the overloaded line following the contingency to reduce the flow below the 30-minute emergency rating. Within 30 minutes of the transmission line outage, the system is re-dispatched to bring the flow below the 4-hour emergency rating. California ISO/MID 213 2014-2015 ISO Transmission Plan February 2, 2015 Table 4.3-10: Base portfolio deliverability assessment results — Devers – Red Bluff Constraint Overloaded Facility Contingency Flow Devers – Red Bluff 500 kV #1 Devers – Red Bluff 500 kV #2 123.70% Devers – Red Bluff 500 kV #2 Devers – Red Bluff 500 kV #1 120.28% Table 4.3-11: Devers – Red Bluff Deliverability Constraint Constrained Renewable Zones Riverside East Total Renewable MW Affected 3800 MW Deliverable MW w/o Mitigation < 2900 MW Mitigation SPS bypassing the series capacitor on the overloaded line following the contingency to reduce the flow below the 30-minute emergency rating and system re-dispatch to bring the flow below the 4-hour emergency rating Recommendation With the proposed SPS, the overall deliverability of the base portfolio is sufficiently supported by the existing system and previously approved transmission upgrades. No additional policy-driven upgrades are recommended for approval in this study cycle. Transmission Plan Deliverability with Approved Transmission Upgrades An estimate of the generation deliverability supported by the existing system and approved transmission upgrades is listed in table 4.3-12. Transmission plan deliverability is estimated based on the area deliverability constraints identified in recent generation interconnection studies without considering local deliverability constraints. For study areas not listed in table 4.312, the transmission plan deliverability is greater than the MW amount of generation in the ISO interconnection queue up to and including queue cluster 7. California ISO/MID 214 2014-2015 ISO Transmission Plan February 2, 2015 Table 4.3-12: Deliverability for Area Deliverability Constraints in SCE area Area Deliverability Constraint Renewable Zones Deliverability (MW) Mountain Pass Riverside East Tehachapi (Big Creek and Ventura) Desert Area Lugo – Victorville flow limit Distributed Solar – SCE (Big Creek and Ventura) 2,830 ~ 6,980 Imperial San Bernardino Lucerne Nevada C Lugo AA Bank capacity limit Kramer San Bernardino Lucerne California ISO/MID 215 ~1000 2014-2015 ISO Transmission Plan 4.3.3 SDG&E Area and Mitigations February 2, 2015 Policy-Driven Deliverability Assessment Results Base Portfolio Deliverability Assessment Results Deliverability assessments in previous transmission planning cycles have demonstrated that the dispatch of generation at Encina was a pivotal assumption associated with certain deliverability constraints in the San Diego area. This deliverability assessment was performed with the assumption that existing Encina units 1, 2, 3, 4 and 5 would be retired and replaced with 300 MW at Encina 230 kV and 300 MW at Encina 138 kV. Due to the retirement of SONGS, new generation was modeled in the deliverability assessment consisting of 308 MW at Otay Mesa 230 kV. Along with this generation, the following network upgrades were modeled: • Miguel Tap Reconfiguration Project—Reconfigure TL23041 and TL23042 at Miguel Substation to create two Otay Mesa-Miguel 230 kV lines; and • current limiting series reactor (3.1 ohm) on the Otay Mesa-Tijuana 230 kV line. The results of the assessment are discussed below. Miguel 500/230 kV Transformers Constraint Deliverability of new renewable resources in the Baja and Imperial zones is limited by Category B overloads on the Miguel 500/230 kV transformers. The overloads can be mitigated by an SPS to trip IV generation and by relying on short term ratings of the transformers. Table 4.3-13: Base portfolio deliverability assessment results — Miguel 500/230 kV Transformers Deliverability Constraint Overloaded Facility Contingency Flow Miguel 500/230 kV #1 Miguel 500/230 kV #2 104% Miguel 500/230 kV #2 Miguel 500/230 kV #1 103% Otay Mesa-Miguel 230 kV Deliverability Constraint The assessment identified Category C overloads on Otay Mesa-Tijuana 230 kV line and CFE facilities. The overloads can be mitigated by modifying the existing Otay Mesa SPS due to Miguel Tap Reconfiguration Project. The need for the modifications to the existing SPS was identified in the GIP studies. California ISO/MID 216 2014-2015 ISO Transmission Plan February 2, 2015 Table 4.3-14: Base portfolio deliverability assessment results — Otay Mesa-Miguel 230 kV Deliverability Constraint Overloaded Facility Contingency Flow 114% Otay Mesa-Tijuana 230 kV Otay Mesa-Miguel 230 kV #1 and #2 CFE lines (RUM-ROA, ROA-HRA, RUMHRA, MEP-TOY 230 kV) 103% 143% Commercial Sensitivity Portfolio Deliverability Assessment Results A deliverability assessment was performed for the Commercial Sensitivity portfolio in the Baja and Imperial zones. The assessment identified constraints and mitigation in addition to those identified for the base portfolio. The results are discussed below. Imperial Valley Deliverability Constraint Deliverability of new renewable resources in the Baja and Imperial zones is limited by Category B and C overloads in the Imperial Valley area. Using an SPS to trip generation is not sufficient to eliminate all of the identified overloads. The overloads can be partially mitigated by bypassing the series capacitors on the ECO-Miguel and Ocotillo-Suncrest 500 kV lines under normal conditions. This mitigation is sufficient to make 1,900 to 2,100 MW of the Baja and Imperial zones deliverable. To make the entire 2,600 MW of the portfolio deliverable would require a transmission project such as a new Midway-Devers 500 kV line or the STEP project. California ISO/MID 217 2014-2015 ISO Transmission Plan February 2, 2015 Table 4.3-15: Base portfolio deliverability assessment results — Imperial Valley Deliverability Constraint Overloaded Facility Contingency Flow Miguel 500/230 kV #1 Miguel 500/230 kV #2 110% Miguel 500/230 kV #2 Miguel 500/230 kV #1 109% Sycamore-Suncrest 230 kV #2 Sycamore-Suncrest 230 kV #1 104% Sycamore-Suncrest 230 kV #1 Sycamore-Suncrest 230 kV #2 104% Suncrest 500/230 kV #2 Suncrest 500/230 kV #1 105% Suncrest 500/230 kV #1 Suncrest 500/230 kV #2 105% Miguel-Bay Boulevard 230 kV #1 Miguel-Mission 230 kV #1 and #2 102% Suncrest-Ocotillo 500 kV 116% Suncrest-Sycamore 230 kV #1 and #2 116% Imperial Valley-Ocotillo 500 kV 111% Suncrest-Ocotillo 500 kV 118% Suncrest-Sycamore 230 kV #1 and #2 117% Imperial Valley-Ocotillo 500 kV 112% ECO-Miguel 500 kV 111% IV-ECO 500 kV 110% ECO-Miguel 500 kV 111% IV-ECO 500 kV 110% Base Case 102% IV-ECO 500 kV ECO-Miguel 500 kV Sycamore-Suncrest 230 kV #1 Sycamore-Suncrest 230 kV #2 Path 46 (West of River) California ISO/MID 218 2014-2015 ISO Transmission Plan February 2, 2015 Transmission Plan Deliverability with Recommended Transmission Upgrades With the above recommended transmission upgrades, an estimate of the generation deliverability supported by the existing system and approved transmission upgrades is listed in table 4.3-16. Transmission plan deliverability is estimated based on the area deliverability constraints identified in recent generation interconnection studies without considering local deliverability constraints. For study areas not listed in table 4.3-16, the transmission plan deliverability is greater than the MW amount of generation in the ISO interconnection queue up to and including queue cluster 7. Table 4.3-16: Deliverability for Area Deliverability Constraints in SDG&E area Area Deliverability Constraint Renewable Zones Imperial East of Miguel Constraint Baja California ISO/MID 219 Deliverability (MW) See “Imperial Valley Deliverability Constraint” section above 2014-2015 ISO Transmission Plan February 2, 2015 4.3.4 Southern California Policy-Driven Conclusions The policy-driven assessment of Commercial Interest (base), Commercial Interest (CS) Sensitivity and High Distributed Generation (HDG) portfolios in Southern California zones has identified several Category B and C issues in the Imperial Valley area. To ensure that ~1800 MW of generation can be accommodated in the Imperial zone, the recommended mitigation measures include the following: - by-passing series capacitors on ECO – Miguel 500 kV and Ocotillo – Suncrest 500 kV lines; - modifying Imperial Valley SPS to include generation tripping following Miguel 500/230 kV transformer outage (T-1) and following Suncrest 500/230 kV transformer outage; and - relying on 30-minute emergency rating of 500/230 kV transformer banks at Imperial Valley and Suncrest. ISO examined the status of generation development in the Imperial zone to gauge the amount of incremental generation that can be accommodated. Approximately 850 to 1,000 MW of generation connected to ISO system that is counted as part of the CS portfolio is either operational or under construction. Approximately 200 MW of generation in IID that is counted as part of the CS portfolio is either operational or under construction. While the ISO queue contains several thousand MW of generation in the Imperial zone, subject to specific siting of new generation, 500 MW to 750 MW of additional generation may be accommodated. As an information only assessment, the ISO studied the CS portfolio with two projects that were received through the 2014 request window, the Midway – Devers 500 kV AC line project and the Strategic Transmission Expansion Plan (STEP). Based on the powerflow and stability studies, the ISO believes that these upgrades in conjunction with the recommended mitigations would accommodate 2,500 MW of renewable generation in the Imperial zone. The recommended mitigations and the approved projects in Southern California area largely restore overall deliverability for the Imperial zone to pre-SONGS retirement levels. Having said that, generation connecting directly to the ISO grid (operational or under construction) will use some of this deliverability, hence approximately 500 MW to 750 MW of future generation can be accommodated in this zone. Significant transmission enhancements will be needed to accommodate the entire 2,500 MW of portfolio generation modeled in the Imperial zone as part of the CS portfolio. California ISO/MID 220 2014-2015 ISO Transmission Plan February 2, 2015 Chapter 5 5 Economic Planning Study 5.1 Introduction The economic planning study simulates WECC system operations over an extended period in the planning horizon and identifies potential congestion in the ISO controlled grid. The study objective is to find economic-driven network upgrades to increase production efficiency and reduce ratepayer costs. The study uses the unified planning assumptions and was performed after completing the reliability-driven and policy-driven transmission studies. Network upgrades identified as needed for grid reliability and renewable integration were taken as inputs and modeled in the economic planning database. In this way, the economic planning study started from a “feasible” system that meets reliability standards and policy needs. Then, the economic planning study sought to identify additional network upgrades that are cost-effective to mitigate grid congestion and increase production efficiency. The studies used a production cost simulation as the primary tool to identify grid congestion and assess economic benefits created by congestion mitigation measures. The production simulation is a computationally intensive application based on security-constrained unit commitment (SCUC) and security-constrained economic dispatch (SCED) algorithms. The simulation is conducted for 8,760 hours for each study year, which are total number of hours in a year. The potential economic benefits are quantified as reduction of ratepayer costs based on the ISO Transmission Economic Analysis Methodology (TEAM). 48 48 Transmission Economic Assessment Methodology (TEAM), California Independent System Operator, June 2004, http://www.caiso.com/docs/2004/06/03/2004060313241622985.pdf California ISO/MID 221 2014-2015 ISO Transmission Plan February 2, 2015 5.2 Study Steps The economic planning study is conducted in two consecutive steps as shown in Figure 5.2-1. In the first study step (i.e., congestion identification), a production cost simulation is conducted for each hour of the study year. Identified congestion is tabulated and ranked by severity, which is expressed as congestion costs in U.S. dollars and congestion duration in hours. Based on the simulation results and after considering stakeholder requests for economic studies as described in tariff section 24.3.4.1 and the Transmission Planning BPM section 3.2.3, five high-priority studies were determined. In the second study step (i.e., congestion mitigation), congestion mitigation plans are evaluated for each of the high-priority studies. Using the production cost simulation and other means, the ISO quantified economic benefits for each identified network upgrade alternative. Last, a costbenefit analysis is conducted to determine if the identified network upgrades are economic.Net benefits are compared with each other where the net benefits are calculated as the gross benefits minus the costs to compare multiple alternatives that would address identified congestion issues. The most economical solution is the alternative that has the largest net benefit. Figure 5.2-1: Economic planning study – two steps California ISO/MID 222 2014-2015 ISO Transmission Plan February 2, 2015 5.3 Technical Approach The production cost simulation plays a major role in quantifying the production cost reductions that are often associated with congestion relief. Traditional power flow analysis is also used in quantifying other economic benefits such as system and local capacity savings. Different components of benefits are assessed and quantified under the economic planning study. First, production benefits are quantified by the production cost simulation that computes unit commitment, generator dispatch, locational marginal prices and transmission line flows over 8,760 hours in a study year. With the objective to minimize production costs, the computation balances supply and demand by dispatching economic generation while accommodating transmission constraints. The study identifies transmission congestion over the entire study period. In comparison of the “pre-project” and “post-project” study results, production benefits can be calculated from savings of production costs or ratepayer payments. The production benefit includes three components of ratepayer benefits: consumer energy cost decreases; increased load serving entity owned generation revenues; and increased transmission congestion revenues. Such an approach is consistent with the requirements of tariff section 24.4.6.7 and TEAM principles. The production benefit is also called an energy benefit. As the production cost simulation models both energy and reserve dispatch, we prefer to call the calculated benefit a “production benefit”. Second, capacity benefits are also assessed. Capacity benefits types include system resource adequacy (RA) savings and local RA savings. The system RA benefit corresponds to a situation where a network upgrade for an importing transmission facility leads to a reduction of ISO system resource requirements, provided that out-of-state resources are less expensive to procure than in-state resources. The local capacity benefit corresponds to a situation where an upgraded transmission facility that leads to a reduction of local capacity requirement in a load area. In addition to the production and capacity benefits, any other benefits — where applicable and quantifiable — can also be included. However, it is not always viable to quantify social benefits into dollars. Once the total economic benefit is calculated, the benefit is weighed against the cost. To justify a proposed network upgrade, the required criterion is that the ISO ratepayer benefit needs to be greater than the cost of the network upgrade. If the justification is successful, the proposed network upgrade may qualify as an economic-driven project. The technical approach of economic planning study is depicted in figure 5.3-1. The economic planning study starts from an engineering analysis with power system simulations (using production cost simulation and snapshot power flow analysis). The engineering analysis phase is the most time consuming part of the study. Based on results of the engineering analysis, the study enters the economic evaluation phase with a cost-benefit analysis, which is a financial calculation that is generally conducted in spreadsheets. California ISO/MID 223 2014-2015 ISO Transmission Plan February 2, 2015 Figure 5.3-1: Technical approach of economic planning study California ISO/MID 224 2014-2015 ISO Transmission Plan February 2, 2015 5.4 Tools and Database The ISO used the software tools listed in table 5.4-1 for this economic planning study. Table 5.4-1: Economic planning study tools Program name ABB GridView™ GE PSLF™ Version Functionality 9.1 The software program is a production cost simulation tool with DC power flow to simulate system operations in a continuous time period, e.g., 8,760 hours in a study year. 18.0_01 The software program is an AC power flow tool to compute line loadings and bus voltages for selected snapshots of system conditions, e.g., summer peak or spring off-peak. This study used the WECC production cost simulation model as a starting database. The database is often called the Transmission Expansion Planning Policy Committee (TEPPC) dataset. For this study, the ISO used the “TEPPC 2024 V1.0” dataset released on August 1, 2014. Based on the TEPPC dataset, the ISO developed the 2019 and 2024 base cases for the ISO production cost simulation. In creating the base cases, the ISO applied numerous updates and additions to model the California power system in more detail. Those modeling updates and additions are described in section 5.5 (Study Assumptions). California ISO/MID 225 2014-2015 ISO Transmission Plan February 2, 2015 Figure 5.4-1: Database setup Platform for economic planning ISO-B2019 10-year planning case 5-year planning case DB release ISO-B2024 ISO-published database DB development ISO-B2019 ISO-B2024 ISO-further-modified database ISO-T2024 ISO-modified TEPPC database T2024 “TEPPC 2024 v1.0” dataset The original TEPPC database California ISO/MID 226 2014-2015 ISO Transmission Plan February 2, 2015 5.5 Study Assumptions This section summarizes major assumptions used in the economic planning study. The section also highlights the ISO enhancements and modifications to the TEPPC database. 5.5.1 System modeling TEPPC database modeled 31 balancing authority areas (BAAs), i.e., control areas in the WECC system. Figure 5.5-1 shows the TEPPC modeling control areas. The ISO made topology changes in system modeling to the TEPPC database. They are described in the following sections. Figure 5.5-1: Modeling BAAs in TEPPC database 5.5.2 Load demand As a norm for economic planning studies, the production cost simulation models 1-in-2 heat wave load in the system to represent typical or average load conditions. The ISO developed base cases used load modeling data from the following sources. • In modeling California load, the study used the CEC demand forecast. In the TEPPC database, the California load model was based on the CEC 2013 Integrated Energy California ISO/MID 227 2014-2015 ISO Transmission Plan February 2, 2015 Policy Report (IEPR) preliminary demand forecast dated February 2012. The ISO replaced that load model with the CEC 2013 IEPR final demand forecast data published in September 2012. • In modeling load for other areas in the WECC system, the study used the 2012 final forecast data from the WECC Load and Resource Subcommittee (LRS), which comes from different utilities in the WECC. In the TEPPC database, the load model was based on preliminary LRS 2012 data. The ISO replaced that load model with the final LRS 2012 data. Forty load areas were represented in the WECC production cost simulation model. Figure 5.5-2 shows the 40 WECC load areas represented in the ISO-modified database. While the load area diagram is presented below, it must be noted that this does not imply that the production cost simulation is conducted as a “bubble” model. Rather, the production cost simulation is a complete nodal model and the full WECC database models all transmission lines in the system. Figure 5.5-2 Load areas represented in the WECC production cost simulation model California ISO/MID 228 2014-2015 ISO Transmission Plan February 2, 2015 Each load area has an hourly load profile for the 8,760 hours in the production cost simulation model. Individual bus load is calculated from the area load using a load distribution pattern that was imported from a power flow base case. In the original TEPPC database only one summer load distribution pattern was modeled. The ISO enhanced the load distribution model by adding three more load distribution patterns of spring, autumn and winter. Thus, the developed ISO base cases have four load distribution patterns for different seasons. 5.5.3 Generation resources The ISO replaced the TEPPC RPS modeling in California with the new 2013-2014 CPUC/CEC Commercial Interest portfolio. In addition, the study modeled two additional RPS portfolios as sensitivity cases. The modeled renewable net-short portfolios are listed in table 5.5-1. For more details about the renewable portfolios, please see descriptions in chapter 4. Table 5.5-1: Renewable net-short portfolios Acronym Renewable Portfolios Study Case CI Commercial Interest portfolio Base case CS Commercial Sensitivity portfolio Sensitivity case HD High distributed generation portfolio Sensitivity case There are no major discrepancies between the TEPPC database and the ISO model for thermal generation. In other words, the TEPPC database has covered all the known and credible thermal resources in the planning horizon. The ISO replaced Once-Through Cooling (OTC) generation retirement and replacement assumptions in the TEPPC database with the latest ISO assumptions. 5.5.4 Transmission assumptions and modeling The entire WECC system was represented in a nodal network in the production cost simulation database. Transmission limits were enforced on individual transmission lines, paths (i.e., flowgates) and nomograms. The original TEPPC database did not enforce transmission limits for 500 kV transformers and 230 kV lines. The ISO enforced those transformer limits for this study throughout the system and enforced the 230 kV line limits in California. Such modifications were made to make sure that transmission line flows stayed within their rated limits. An important enhancement is the transmission contingency constraints, which the original TEPPC database did not model. In the updated database, the ISO modeled contingencies on California ISO/MID 229 2014-2015 ISO Transmission Plan February 2, 2015 the 500 kV and 230 kV voltage levels in the California transmission grid to make sure that in the event of losing one (and sometimes multiple) transmission facility, the remaining transmission facilities would stay within their emergency limits. Economic planning studies start from a feasible system that meets reliability standards and policy requirements. To establish a feasible system, needed reliability-driven and policy-driven network upgrades are modeled in the base case. The ISO selected some major network upgrades and modeled them into the base case. Those selected network upgrades were usually above the 115 kV level and were deemed to have impacts on the power flows in the bulk transmission system. Network upgrades on 115 kV and lower voltage levels were assumed to be related local problems with no significant impact on the bulk transmission system. Some of approved network upgrades were not included in the TEPPC database. The ISO rectified the database by adding those missing network upgrades. The added network upgrades are listed in the tables below. California ISO/MID 230 2014-2015 ISO Transmission Plan February 2, 2015 Table 5.5-2: Reliability-driven network upgrades added to the database model 49 # Project approved or conceptual Utility ISO-approval Operation year 1 Morro Bay – Mesa 230kV Line PG&E TP2010-2011 2017 2 Contra Costa Substation Switch Replacement PG&E TP2012-2013 2015 3 Kearney 230-70 kV Transformer Addition PG&E TP2012-2013 2015 4 Series reactor on Warnerville – Wilson 230 kV line PG&E TP2012-2013 2017 5 Reconductor Kearney – Herndon 230 kV line PG&E TP2012-2013 2017 6 Gates 500-230 kV transformer #2 PG&E TP2012-2013 2017 7 Lockeford-Lodi Area 230 kV Development Project PG&E TP2012-2013 2017 8 Northern Fresno 115 kV Area Reinforcement PG&E TP2012-2013 2018 9 Estrella Substation Project PG&E TP2013-2014 2019 10 Midway-Kern PP No2 230 kV Line Project PG&E TP2013-2014 2019 11 Morgan Hill Reinforcement Project PG&E TP2013-2014 2021 12 Wheeler Ridge Junction Project PG&E TP2013-2014 2021 13 Gates-Gregg 230 kV Line Project PG&E TP2013-2014 2022 14 Barre – Ellis 230kV Reconfiguration SCE TP2012-2013 2013 15 Mesa Loop-in SCE TP2013-2014 2020 49 The “reliability-driven network upgrade” table lists major network upgrades of 230 kV and above. In addition, the ISO modeling additions included network upgrades of lower voltage levels. For brevity, minor and lower voltage upgrades are not listed here. For details of the listed network upgrades, please refer to relevant ISO Transmission Plan reports. California ISO/MID 231 2014-2015 ISO Transmission Plan February 2, 2015 16 Victor Loop-in SCE TP2013-2014 2015 17 Artesian 230 kV Sub and loop-in SDG&E TP2013-2014 2016 18 Imperial Valley Flow Controller SDG&E TP2013-2014 2016 19 Bob Tap 230 kV switchyard and Bob Tap – Eldorado 230 kV line VEA N/A 2015 Table 5.5-3: Policy-driven network upgrades added to the database model # Project approved or conceptual Location ISO approval Operation year 1 IID-SCE Path 42 upgrade IID, SCE TP2010-2011 2013 2 Warnerville – Belotta 230 kV line reconductoring PG&E TP2012-2013 2017 3 Lugo – Eldorado series capacitors and terminal equipment upgrade SCE TP2012-2013 2016 4 Sycamore – Penasquitos 230 kV line SDG&E TP2012-2013 2017 5 Lugo-Mohave series capacitor upgrade SCE TP2013-2014 2016 Table 5.5-4: Economic-driven network upgrades added to the database model # Project approved or conceptual Location ISO approval Operation year 1 Delany-Colorado River 500 kV project APS, SCE TP2013-2014 2020 2 Harry Allen – El Dorado 500 kV project NVE, SCE TP2013-2014 2020 California ISO/MID 232 2014-2015 ISO Transmission Plan February 2, 2015 Table 5.5-5: GIP-related network upgrades added to the database model Operation year # Project approved or conceptual Utility Note 1 South of Contra Costa reconductoring PG&E ISO LGIA 2012 2 West of Devers 230 kV series reactors SCE ISO LGIA 2013 (Till 2019) 3 West of Devers 230 kV reconductoring SCE ISO LGIA 2019 Cool Water – Lugo 230 kV line SCE Renewable delivery 2019 4 Table 5.5-6: Other network upgrades added to the database model Operation year # Project approved or conceptual Utility Note 1 PDCI Upgrade Project BPA Under construction 2015 2 Barren Ridge Renewable Transmission Project LADWP LADWPapproved 2017 3 Scattergood – Olympic transmission line LADWP LADWPapproved 2015 4 Cottle 230 kV ring bus, load relocation and removal of tie to Bellota – Warnerville PG&E PG&E maintenance project 2012 5 Merchant 230 kV reconfiguration project SCE ISO approved 2012 6 Bob Tap 230 kV switchyard and Bob Tap – Eldorado 230 kV line VEA ISO approved 2015 California ISO/MID 233 2014-2015 ISO Transmission Plan February 2, 2015 Energy Imbalance Market (EIM) modeling Representations for the Energy Imbalance Markets between NV Energy and the ISO and between Pacific Corp and ISO were added to the TEPPC database in the ISO study. 5.5.5 Financial Parameters Used in Cost-Benefit Analysis A cost-benefit analysis was made for each economic planning study where the total costs were weighed against the total benefits of the proposed network upgrades. All costs and benefits are expressed in U.S. dollars in 2014 values. The costs and benefits are in net present values, which are discounted to the assumed operation year of the studied network upgrade. By default, the proposed operation year is 2019 unless specially indicated. 5.5.5.1 Cost analysis Total cost is the total revenue requirement in net present value in the proposed operation year. The total revenue requirement includes impacts of capital cost, tax expenses, O&M expenses and other relevant costs. In calculating the total cost, the following financial parameters were used: • asset depreciation horizon = 50 years; • return on equity = 11 percent; • O&M = 2 percent; • property tax = 2 percent; • inflation rate = 2 percent; and • cost discount rate = ranging from 7 percent (real) to 5 percent (real) In the initial planning stage, however, most proposed study subjects do not provide detailed cash flow information. Instead, they have lump sum capital cost estimates and the ISO uses typical financial information to convert them into annual revenue requirements, and from there calculate the present value of the annual revenue requirements stream. As an approximation, the present value of the utility’s revenue requirement is calculated as the capital cost multiplied by a “CC-to-RR multiplier”. Currently, the multiplier for screening purposes is 1.45 and is based on prior experiences of the utilities in the California ISO. 5.5.5.2 Benefit analysis Total benefit refers to the present value of the accumulated yearly benefits over the economic life of the proposed network upgrade. The yearly benefits are discounted to the present value in the proposed operation year before the dollar value is accumulated towards the total economic benefit. Because of the discount, the present worth of yearly benefits diminishes very quickly in future years. 50 50 i Discount of yearly benefit into the present worth is calculated by bi = Bi / (1 + d) , where bi and Bi are the present and future worth respectively; d is the discount rate; and i is the number of years into the future. For example, given a California ISO/MID 234 2014-2015 ISO Transmission Plan February 2, 2015 In this economic planning study, engineering analysis determined the yearly benefits through production cost simulation and power flow analysis. Production cost simulation was conducted for the 5th planning year and 10th planning year. Therefore, year 2019 and 2024 benefits were calculated. For the intermediate years between 2019 and 2024 the benefits were estimated by linear interpolation. For years beyond 2024 the benefits were estimated by extending the 2024 year benefit with an assumed escalation rate. The following financial parameters were used in calculating yearly benefits for use in the total benefit: • economic life of new transmission facilities = 50 years; • economic life of upgraded transmission facilities = 40 years; • benefits escalation rate beyond year 2024 = 0 percent (real); and • benefits discount rate = ranging from 7 percent (real) to 5 percent (real) 5.5.5.3 Cost-benefit analysis Once the total cost and benefit are determined a cost-benefit comparison is made. For a proposed upgrade to qualify as an economic project, the benefit has to be greater than the cost. In other words, the net benefit (calculated as cost minus gross benefit) has to be positive. If there are multiple alternatives, the one that has the largest net benefit is considered the most economical solution. th yearly economic benefit of $10 million, if the benefit is in the 30 year, its present worth is $1.3 million based a th th discount rate of 7 percent. Likewise, if the benefit is in the 40 or 50 years, its present worth is $0.7 million or $0.3 million, respectively. In essence, going into future years the yearly economic benefit worth becomes very small. California ISO/MID 235 2014-2015 ISO Transmission Plan February 2, 2015 5.6 Congestion Identification and Scope of High Priority Studies This section describes the congestion simulation results and scope of high priority studies. 5.6.1 Congestion identification Table 5.6-1 lists congested transmission facilities identified from the production cost simulation. Table 5.6-1: Congested facilities in the ISO-controlled grid No Constraints Name Costs (K$) 2019 Duration (Hrs) Costs (K$) 2,594 2024 Duration (Hrs) 1 P26 Northern-Southern California 1,586 197 177 2 BARRE-LEWIS 230 kV line, subject to SCE VillaPark-Barre L-1 2,890 163 - - 3 LEWIS-VILLA PK 230 kV line, subject to SCE Serrano-Lewis L-2 1,637 82 - - 4 CC SUB-C.COSTA 230 kV line #1 679 470 743 377 5 GATES-MIDWAY 230 kV line, subject to PG&E Gates-Midway L-1 141 9 704 24 6 MIDWAY-VINCENT 500 kV line #2, subject to SCE Midway-Vincent#1 L-1 313 33 370 27 73 26 345 49 8 WESTLEY-LOSBANOS 230 kV line, subject to PG&E LosBanos-Tesla L-1 MIDWAY-VINCENT 500 kV line #2, subject to PG&E Midway-Whirlwind L-1 231 33 176 21 9 P24 PG&E-Sierra 190 437 179 365 10 J.HINDS-MIRAGE 230 kV line #1 3 6 290 31 11 LODI-EIGHT MI 230 kV line #1 51 67 191 184 12 MIDWAY-VINCENT 500 kV line #1, subject to PG&E Midway-Whirlwind L-1 115 31 74 12 13 MARBLE 60.0/69.0 kV transformer #1 1 34 163 1,156 14 OTAYMESA-TJI-230 230 kV line #1 111 388 20 115 15 P15 Midway-LosBanos 59 15 8 1 16 25 23 40 42 17 INYO 115/115 kV transformer #1 P25 PacifiCorp/PG&E 115 kV Interconnection - - 65 280 18 GATES-MIDWAY 500 kV line #1 - - 58 6 19 P45 SDG&E-CFE 0 31 29 828 7 California ISO/MID 236 2014-2015 ISO Transmission Plan 20 USWP-JRW-CAYETANO 230 kV line, subject to PG&E C.Costa-LasPositas L-1 21 LOSBANOS-MIDWAY 500 kV line #1 22 MIDWAY-VINCENT 500 kV line #2 23 February 2, 2015 12 3 18 2 - - 18 2 14 3 - - MAGUNDEN-PASTORIA 230 kV line #2 6 2 - - 24 COI 3 2 - - 25 VACA-DIX-TESLA 500 kV line #1 2 1 - - Table 5.6-2 summarizes the potential congestion from the previous table by aggregating congestion costs and hours to branch or branch group regardless under normal or contingency conditions, and ranks its severity, based on average congestion costs. Table 5.6-2: Simulated congestion in the ISO-controlled grid No Constraints Name 2019 Costs Duration (K$) (Hrs) 2024 Costs Duration (K$) (Hrs) Average cost 1 Path 26 2,259 297 3,214 237 2,737 2 Serrano-Lewis/Villa PK-Barre corridor 4,526 245 - - 2,263 3 CC SUB-C.COSTA 230 kV line #1 691 473 761 379 726 4 Path 15 Corridor (Path 15, Midway Gates 500 kV and 230 kV lines) 200 24 846 39 523 5 WESTLEY-LOSBANOS 230 kV line 73 26 345 49 209 6 P24 PG&E-Sierra 190 437 179 365 184 7 J.HINDS-MIRAGE 230 kV line #1 3 6 290 31 146 8 LODI-EIGHT MI 230 kV line #1 51 67 191 184 121 9 MARBLE 60.0/69.0 kV transformer #1 1 34 163 1,156 82 10 Path 45 112 419 49 943 80 11 23 40 42 33 12 INYO 115/115 kV transformer #1 P25 PacifiCorp/PG&E 115 kV Interconnection 13 25 - - 65 280 32 MAGUNDEN-PASTORIA 230 kV line #2 6 2 - - 3 14 COI 3 2 - - 1 15 VACA-DIX-TESLA 500 kV line #1 2 1 - - 1 California ISO/MID 237 2014-2015 ISO Transmission Plan February 2, 2015 5.6.2 Scope of high-priority studies After evaluating identified congestion (listed in Table 5.6-2) and reviewing stakeholders’ study requests, consistent with tariff section 24.3.4.2, the ISO selected five congestions for further assessment, which are listed table 5.6-3. Table 5.6-3: High-priority studies Constraints Name Area Costs (K$) 2019 Duration (Hrs) Costs (K$) 2024 Duration (Hrs) Average cost Path 26 CC SUB-C.COSTA 230 kV line #1 Path 15 Corridor (Path 15, Midway - Gates 500 kV and 230 kV lines) WESTLEY-LOSBANOS 230 kV line PG&E, SCE 2,259 297 3,214 237 2,737 Greater Bay Area East 691 473 761 379 726 Central California 200 24 846 39 523 North of Los Banos 73 26 345 49 209 PG&E 51 67 191 184 121 LODI-EIGHT MI 230 kV line #1 It was noticed that the congestion on Serrano–Lewis/Villa PK-Barre corridor in the SCE’s LA Basin area has relatively large congestion cost, but was not selected into the top five congestions. It is also seen that this congestion was identified in the 2019 study but not in the 2024 study. The reason is that the Mesa Loop-in project, which was a reliability project approved by the ISO in 2013-2014 planning cycle, is modeled in 2024 dataset but not in 2019 dataset, and this project helps to mitigate the flow on the Serrano-Lewis/Villa PK/Barre corridor. The Mesa Loop-in project has an estimated in-service date after 2019 and before 2024. California ISO/MID 238 2014-2015 ISO Transmission Plan February 2, 2015 5.7 Congestion Mitigation and Economic Assessment Congestion mitigation is the second step in the economic planning study. With a focus on highranking congestion, this study step produced proposed network upgrades, evaluated their economic benefits and weighed the benefits against the costs to determine if the network upgrades were economical. The economic planning study results in the previous planning cycles were reviewed first and compared with the top five congestions identified in 2014-2015 planning cycle. Table 5.7-1 shows the top five congestions identified in the last three planning cycles. 51 Table 5.7-1: Top five congestions in the last three planning cycles No 2011-2012 2012-2013 2013-2014 Path 26 Path 26 Path 26 Greater Fresno Area (GFA) Los Banos North (LBN) Greater Bay Area (GBA) Path 61 (Lugo-Victorville) North of Lugo (Kramer – Lugo 230 kV) North of Lugo (Inyo 115 kV) Los Banos North (LBN) Central California Area (CCA) SCIT limits 1 2 3 4 Path 60 (Inyo-Control 115 kV Kramer area 5 tie) LA metro area It was observed that four out of the top five congestions identified in 2014-2015 planning cycle were also included in the top five congestions in at least one of the last three planning cycles. These four congestions are highlighted in table 5.7-1. Upon further review of the economic planning study results, no economic justifications were seen for network upgrades identified for these four congestions in the previous planning cycles. Considering there were no significant changes in the system models in these congestion areas, no detailed production cost simulation and economic assessment were conducted for these four congestions. The ISO will continuously and closely monitor and assess these congestions in the future planning cycles. In 2014-2015 planning cycle, a detailed economic assessment for the congestion on Lodi-Eight Mile 230 kV Line was conducted. San Luis Transmission Project As set out in section 2.4.3 and further discussed in section 4.2.1.1.1, Duke-America Transmission Company, Path 15, LLC (DATCP) submitted as a stakeholder comment that the ISO should approve participation in WAPA’s San Luis Transmission project. Further, PG&E requested an economic study request of the Central California area, including the transmission north of Los Banos. No reliability or policy needs were identified as set out in those sections, 51 The economic study results in 2011-2012, 2012-2013, and 2013-2014 planning cycles can be found on ISO’s website: http://www.caiso.com/planning/Pages/TransmissionPlanning/Default.aspx California ISO/MID 239 2014-2015 ISO Transmission Plan February 2, 2015 respectively, supporting the proposed project. This discussion describes the ISO’s review of the potential economic benefits. The ISO notes that some small amounts of congestion on this path has been found in the production simulation analysis conducted in the 2014-2015 planning cycle, and have similarly been observed in past analyses. This congestion has developed due to the thermal capacity of an underlying 230 kV system, and resulted in congestion too small, e.g. not generating any material financial savings, to warrant any action to address. While the ISO will continue to examine this corridor in the 2015-2016 planning cycle, there is no basis to establish an economic-driven need for reinforcement at this time. California ISO/MID 240 2014-2015 ISO Transmission Plan February 2, 2015 5.7.1 Lodi – Eight Mile 230 kV line congestion This section describes the economic planning study of reconductoring the new Lodi–Eight Mile 230 kV line. Figure 5.7-1 shows the system in the area around Lodi–Eight Mile 230 kV line, and the summary of the congestion and the upgrade to be studied. Figure 5.7-1: One-line diagram of the area around Lodi–Eight Mile 230 kV line Limiting constraints: Normal Condition Rio Oso Legend: generation 230 kV Atlantic Limiting elements: Gold Hill Lodi – Eight Mile 230 kV line conductor Brighton Lockeford Lodi STIG Eight Mile Rd Stagg Reconductor Cost: $7M Bellota Tesla 5.7.2 Simulation results and economic assessment Production cost simulations were conducted with and without reconductoring the congested Lodi–Eight Mile 230 kV line on both 2019 and 2024 databases. 5.7.2.1 Hourly power flows The simulation results show that the congestion can be completely mitigated with reconductoring the existing Lodi–Eight Mile 230 kV line. Figures 5.7-2 and 5.7-3 show the hourly power flow on the line in 2024 for pre and post reconductoring, respectively. California ISO/MID 241 2014-2015 ISO Transmission Plan February 2, 2015 Figure 5.7-2: Pre project hourly flow of Lodi–Eight Mile line in 2024 Figure 5.7-3: Post project hourly flow of Lodi–Eight Mi line in 2024 5.7.2.2 Load payment reduction With reconductoring, the overall load payment in the ISO controlled grid reduces, as shown in figure 5.7-4. California ISO/MID 242 2014-2015 ISO Transmission Plan February 2, 2015 Figure 5.7-4: LMP and load payment changes with reconductoring Lodi–Eight MI 230 kV line 5.7.2.3 Energy benefit Based on production cost simulations for the study years, yearly benefits are calculated as $4 million in 2019 and $3 million in 2024, respectively. It is also attempted to estimate the losses reduction benefit outside the production cost simulation model using a traditional power flow calculation. In this case, the losses reduction benefit is considered negligible. Table 5.7-2 lists quantified yearly production benefits. Table 5.7-2: Yearly production benefits of reconductoring Lodi – Eight Mile 230 kV line Yearly production benefit Year Production benefit calculated by production cost simulation 2019 $4M 2024 $3M Losses reduction benefit estimated outside the production cost simulation model Sum $4M -Negligible $3M 5.7.2.4 Capacity benefit This upgrade does not have capacity benefit. California ISO/MID 243 2014-2015 ISO Transmission Plan February 2, 2015 5.7.2.5 Cost estimate For the proposed reconductoring of the Lodi–Eight Mile 230 kV line, the capital cost is estimated as $7 million; and the total cost (i.e., revenue requirement) is estimated at $10 million using a “CC-to-RR multiplier” of 1.45. The cost estimates are listed in table 5.7-3. Table 5.7-3: Cost estimates for reconductoring Lodi–Eight Mile 230 kV line Capital cost Total cost (i.e. revenue requirement) $7M $10M Based on yearly benefits determined in section 5.7.2.3, the total benefit is calculated as the present value of the benefits over the life of the project, assuming that it would go into operation in the year 2019. A cost-benefit analysis is provided in table 5.7-4. Table 5.7-4: Reconductoring Lodi–Eight Mile 230 kV line cost-benefit analysis Total benefit ($M) Total cost ($M) Net benefit ($M) Benefit-cost ratio 42 10 32 4.2 5.7.2.6 Recommendation Based on the cost-benefit analysis in section 5.7.2.5, reconductoring Lodi–Eight Mile 230 kV line appears to be economic. It is recommended to approve the reconductoring of the Lodi– Eight Mile 230 kV line as an economic-driven network upgrade. California ISO/MID 244 2014-2015 ISO Transmission Plan February 2, 2015 5.8 Summary The production cost simulation was conducted in each study year for 2019 and 2024 in this economic planning study and grid congestion was identified and evaluated. According to the identified areas of congestion concerns, five high-priority congestions were selected for further evaluation: 1. Path 26 2. C.Costa Sub–C. Costa 230 kV line 3. Path 15 corridor 4. Wesley–Los Banos. 230 kV line 5. Lodi–Eight MI 230 kV line. The first four congestions were assessed by comparing with the studies in the previous planning cycles. No detailed studies were conducted for these four congestions in this planning cycle because of the following. 1. They were studied in previous planning cycles and no economic justifications for network upgrades were identified. 2. The system conditions around these congestions do not change significantly. 3. The ISO will continuously monitor and analyze these congestions in the future planning cycles. Detail economic assessment was conducted for Lodi–Eight MI 230 kV line congestion. It is recommended to approve the reconductoring of the Lodi–Eight MI 230 kV line as an economicdriven network upgrade. California ISO/MID 245 2014-2015 ISO Transmission Plan February 2, 2015 Intentionally left blank California ISO/MID 246 2014-2015 ISO Transmission Plan February 2, 2015 Chapter 6 6 Other Studies and Results 6.1 Long-Term Congestion Revenue Rights Simultaneous Feasibility Test Studies The Long-term Congestion Revenue Rights (LT CRR) Simultaneous Feasibility Test studies evaluate the feasibility of the fixed LT CRRs previously released through the CRR annual allocation process under seasonal, on-peak and off-peak conditions, consistent with section 4.2.2 of the Business Practice Manual for Transmission Planning Process and tariff sections 24.1 and 24.4.6.4 6.1.1 Objective The primary objective of the LT CRR feasibility study is to ensure that fixed LT CRRs released as part of the annual allocation process remain feasible over their entire 10-year term, even as new and approved transmission infrastructure is added to the ISO-controlled grid. 6.1.2 Data Preparation and Assumptions The 2014 LT CRR study leveraged the base case network topology used for the annual 2013 CRR allocation and auction process. Regional transmission engineers responsible for long-term grid planning incorporated all the new and ISO approved transmission projects into the base case and a full alternating current (AC) power flow analysis to validate acceptable system performance. These projects and system additions were then added to the base case network model for CRR applications. The modified base case was then used to perform the market run, CRR simultaneous feasibility test (SFT), to ascertain feasibility of the fixed CRRs. A list of the approved projects can be found in the 2013-2014 Transmission Plan. In the SFT-based market run, all CRR sources and sinks from the released CRR nominations were applied to the full network model (FNM). This forms the core network model for the locational marginal pricing (LMP) markets. All applicable constraints were considered to determine flows as well as to identify the existence of any constraint violations. In the long-term CRR market run setup, the network was limited to 60 percent of available transmission capacity. The fixed CRR representing the transmission ownership rights and merchant transmission were also set to 60 percent. All earlier LT CRR market awards were set to 100 percent. For the study year, the market run was set up for four seasons (with season 1 being January through March) and two time-of-use periods (reflecting on-peak and off-peak system conditions). The study setup and market run are conducted in the CRR study system. This system provides a reliable and convenient user interface for data setup and results display. It also provides the capability to archive results as save cases for further review and record-keeping. California ISO/MID 247 2014-2015 ISO Transmission Plan February 2, 2015 The ISO regional transmission engineering group and CRR team must closely collaborate to ensure that all data used were validated and formatted correctly. The following criteria were used to verify that the long-term planning study results maintain the feasibility of the fixed LT CRRs: • SFT is completed successfully; • the worst case base loading in each market run does not exceed 60 percent of enforced branch rating; • there are overall improvements on the flow of the monitored transmission elements. 6.1.3 Study Process, Data and Results Maintenance A brief outline of the current process is as follows: • The base case network model data for long-term grid planning is prepared by the regional transmission engineering (RTE) group. The data preparation may involve using one or more of these applications: PTI PSS/E, GE PSLF and MS Excel; • RTE models new and approved projects and perform the AC power flow analysis to ensure power flow convergence; • RTE reviews all new and approved projects for the transmission planning cycle; • applicable projects are modeled into the base case network model for the CRR allocation and auction in collaboration with the CRR team, consistent with the BPM for Transmission Planning Process section 4.2.2; • CRR team sets up and performs market runs in the CRR study system environment in consultation with the RTE group; • CRR team reviews the results using user interfaces and displays, in close collaboration with the RTE group; and • The input data and results are archived to a secured location as saved cases. 6.1.4 Conclusions The SFT studies involved six market runs that reflected four three-month seasonal periods (January through December) and two time-of-use (on-peak and off-peak) conditions. The results indicated that all existing fixed LT CRRs remained feasible over their entire 10-year term as the planned. In compliance with section 24.4.6.4 of the ISO tariff, ISO followed the LTCRR SFT study steps outlined in section 4.2.2 of the BPM for the Transmission Planning Process to determine whether there are any existing released LT CRRs that could be at risk and for which mitigation measures should be developed. Based on the results of this analysis, the ISO determined in May 2014 that there are no existing released LT CRRs at-risk” that require further analysis. Thus, the transmission projects and elements approved in the 2013-2014 Transmission Plan did not adversely impact feasibility of the existing released LT CRRs. Hence, the ISO did not evaluate the need for additional mitigation solutions. California ISO/MID 248 2014-2015 ISO Transmission Plan February 2, 2015 Chapter 7 7 Transmission Project List 7.1 Transmission Project Updates Tables 7.1-1 and 7.1-2 provide updates on expected in-service dates of previously approved transmission projects. In previous transmission plans, the ISO determined these projects were needed to mitigate identified reliability concerns, interconnect new renewable generation via a location constrained resource interconnection facility project or enhance economic efficiencies. Table 7.1-1: Status of previously approved projects costing less than $50M No Project PTO Expected InService Date 1 2nd Escondido-San Marcos 69 kV T/L SDG&E Jun-17 2 Bernardo-Ranche Carmel-Poway 69 kV lines upgrade (replacing previously approved New Sycamore - Bernardo 69 kV line) SDG&E Jun-16 3 Miguel 500 kV Voltage Support SDG&E Jun-17 4 Miramar-Mesa Rim 69 kV System Reconfiguration SDG&E Jun-18 5 Mission Bank #51 and #52 replacement SDG&E Jun-18 6 Poway-Pomerado 69 kV #2 SDG&E Jun-16 7 Reconductor TL663, Mission-Kearny SDG&E Jun-16 8 Reconductor TL676, Mission-Mesa Heights SDG&E Jun-16 9 Rose Canyon-La Jolia 69 kV T/L SDG&E Jun-18 10 Sweetwater Reliability Enhancement SDG&E Jun-17 11 TL626 Santa Ysabel – Descanso mitigation (TL625B loop-in, Loveland - Barrett Tap loop-in) SDG&E Jun-16 California ISO/MID 249 2014-2015 ISO Transmission Plan No February 2, 2015 Project PTO Expected InService Date 12 TL631 El Cajon-Los Coches Reconductor SDG&E Cancelled 13 TL633 Bernardo-Rancho Carmel Reconductor SDG&E Jun-17 14 TL644, South Bay-Sweetwater: Reconductor SDG&E TBD 15 TL674A Loop-in (Del Mar-North City West) & Removal of TL666D (Del Mar-Del Mar Tap) SDG&E Jun-18 16 TL690A/TL690E, San Luis Rey-Oceanside Tap and Stuart Tap-Las Pulgas 69 kV sections re-conducto SDG&E Jun-16 17 TL694A San Luis Rey-Morro Hills Tap: Reliability (Loop-in TL694A into Melrose) SDG&E Jan-15 18 TL695B Japanese Mesa-Talega Tap Reconductor SDG&E Jun-18 19 TL 13820, Sycamore-Chicarita Reconductor SDG&E Jun-17 20 TL13834 Trabuco-Capistrano 138 kV Line Upgrade SDG&E Jun-18 21 Upgrade Los Coches 138/69 kV Bank 50 SDG&E Jun-15 22 Upgrade Los Coches 138/69 kV bank 51 SDG&E Jun-15 23 Eldorado-Mohave and Eldorado-Moenkopi 500 kV Line Swap SCE Jun-2016 24 Lugo Substation Install new 500 kV CBs for AA Banks SCE Dec-16 25 Method of Service for Wildlife 230/66 kV Substation SCE Jan-20 California ISO/MID 250 2014-2015 ISO Transmission Plan No February 2, 2015 Project PTO Expected InService Date 26 Path 42 and Devers – Mirage 230 kV Upgrades SCE Jun-15 27 Victor Loop-in SCE Jun-16 28 CT Upgrade at Mead-Pahrump 230 kV Terminal VEA Dec-15 29 Almaden 60 kV Shunt Capacitor PG&E May-16 30 Ashlan-Gregg and Ashlan-Herndon 230 kV Line Reconductor PG&E May-18 31 Atlantic-Placer 115 kV Line PG&E May-19 32 Bay Meadows 115 kV Reconductoring PG&E Apr-19 33 Borden 230 kV Voltage Support PG&E May-19 34 Caruthers – Kingsburg 70 kV Line Reconductor PG&E May-17 35 Cascade 115/60 kV No.2 Transformer Project and Cascade – Benton 60 kV Line Project PG&E May-19 36 Cayucos 70 kV Shunt Capacitor PG&E May-18 37 Christie 115/60 kV Transformer No. 2 PG&E Dec-16 38 Clear Lake 60 kV System Reinforcement PG&E May-20 39 Contra Costa – Moraga 230 kV Line Reconductoring PG&E Jun-16 40 Contra Costa Sub 230 kV Switch Replacement PG&E Dec-16 41 Cooley Landing – Los Altos 60 kV Line Reconductor PG&E May-17 California ISO/MID 251 2014-2015 ISO Transmission Plan No February 2, 2015 Project PTO Expected InService Date 42 Cooley Landing 115/60 kV Transformer Capacity Upgrade PG&E Dec-17 43 Cortina No.3 60 kV Line Reconductoring Project PG&E May-17 44 Crazy Horse Switching Station PG&E Feb-15 45 Cressey-Gallo 115 kV Line PG&E Jul-15 46 Cressey – North Merced 115 kV Line Addition PG&E May-18 47 Del Monte – Fort Ord 60 kV Reinforcement Project PG&E 48 Diablo Canyon Voltage Support Project PG&E May-17 49 East Nicolaus 115 kV Area Reinforcement PG&E Apr-15 50 East Shore-Oakland J 115 kV Reconductoring Project (name changed from East Shore-Oakland J 115 kV Reconductoring Project & Pittsburg-San Mateo 230 kV Looping Project since only the 115 kV part was approved) PG&E Jul-18 51 Estrella Substation Project Undergoing Solicitation Process May-19 52 Evergreen-Mabury Conversion to 115 kV PG&E Dec-17 53 Fulton 230/115 kV Transformer PG&E May-21 54 Fulton-Fitch Mountain 60 kV Line Reconductor PG&E Aug-17 55 Glenn #1 60 kV Reconductoring PG&E Apr-18 California ISO/MID 252 Phase 1 – In-Service Phase 2 – May-22 2014-2015 ISO Transmission Plan No February 2, 2015 Project PTO Expected InService Date 56 Glenn 230/60 kV Transformer No. 1 Replacement PG&E May-18 57 Gregg-Herndon #2 230 kV Line Circuit Breaker Upgrade PG&E May-17 58 Helm-Kerman 70 kV Line Reconductor PG&E May-17 59 Humboldt – Eureka 60 kV Line Capacity Increase PG&E May-17 60 Ignacio – Alto 60 kV Line Voltage Conversion PG&E May-21 61 Jefferson-Stanford #2 60 kV Line PG&E On hold 62 Kern – Old River 70 kV Line Reconductor Project PG&E Apr-16 63 Kern PP 230 kV Area Reinforcement PG&E Dec-19 64 Kearney-Caruthers 70 kV Line Reconductor PG&E May-17 65 Kearney – Hearndon 230 kV Line Reconductoring PG&E Dec-17 66 Kearney-Kerman 70 kV Line Reconductor PG&E May-18 67 Kerchhoff PH #2 – Oakhurst 115 kV Line PG&E May-20 68 Laytonville 60 kV Circuit Breaker Installation Project PG&E Dec-15 69 Lemoore 70 kV Disconnect Switches Replacement PG&E May-16 70 Lockheed No.1 115 kV Tap Reconductor PG&E May-21 71 Los Banos-Livingston Jct-Canal 70 kV Switch Replacement PG&E May-17 California ISO/MID 253 2014-2015 ISO Transmission Plan No February 2, 2015 Project PTO Expected InService Date 72 Los Esteros-Montague 115 kV Substation Equipment Upgrade PG&E Dec-16 73 Maple Creek Reactive Support PG&E May-17 74 Mare Island – Ignacio 115 kV Reconductoring Project PG&E Feb-20 75 McCall-Reedley #2 115 kV Line PG&E May-18 76 Mendocino Coast Reactive Support PG&E Dec-15 77 Menlo Area 60 kV System Upgrade PG&E May-15 78 Mesa-Sisquoc 115 kV Line Reconductoring PG&E May-17 79 Metcalf-Evergreen 115 kV Line Reconductoring PG&E May-19 80 Metcalf-Piercy & Swift and Newark-Dixon Landing 115 kV Upgrade PG&E May-19 81 Midway-Kern PP Nos. 1,3 and 4 230 kV Lines Capacity Increase PG&E May-17 82 Midway-Temblor 115 kV Line Reconductor and Voltage Support PG&E May-18 83 Missouri Flat – Gold Hill 115 kV Line PG&E Jun-17 84 Monta Vista – Los Altos 60 kV Reconductoring PG&E May-18 85 Monta Vista – Los Gatos – Evergreen 60 kV Project PG&E May-17 86 Monte Vista 230 kV Bus Upgrade PG&E May-18 87 Monta Vista-Wolfe 115 kV Substation Equipment Upgrade PG&E May-16 88 Moraga Transformers Capacity Increase PG&E Oct-16 California ISO/MID 254 2014-2015 ISO Transmission Plan February 2, 2015 No Project PTO Expected InService Date 89 Moraga-Castro Valley 230 kV Line Capacity Increase Project PG&E Apr-18 90 Moraga-Oakland “J” SPS Project PG&E May-15 91 Morgan Hill Area Reinforcement PG&E May-21 92 Morro Bay 230/115 kV Transformer Addition Project PG&E May-18 93 Mosher Transmission Project PG&E May-17 94 Mountain View/Whisman-Monta Vista 115 kV Reconductoring PG&E May-22 95 Napa – Tulucay No. 1 60 kV Line Upgrades PG&E Oct-17 96 Navidad Substation Interconnection PG&E May-20 97 Newark – Ravenswood 230 kV Line PG&E Oct-16 98 Newark-Applied Materials 115 kV Substation Equipment Upgrade Project PG&E May-18 99 North Tower 115 kV Looping Project PG&E Dec-18 100 NRS-Scott No. 1 115 kV Line Reconductor PG&E May-16 101 Oakhurst/Coarsegold UVLS PG&E May-16 102 Oro Loma – Mendota 115 kV Conversion Project PG&E May-18 103 Oro Loma 70 kV Area Reinforcement PG&E May-20 104 Pease 115/60 kV Transformer Addition and Bus Upgrade PG&E Aug-18 105 Pease-Marysville #2 60 kV Line PG&E Dec-18 106 Pittsburg 230/115 kV Transformer Capacity Increase PG&E Dec-17 California ISO/MID 255 2014-2015 ISO Transmission Plan No February 2, 2015 Project PTO Expected InService Date 107 Pittsburg-Lakewood SPS Project PG&E Aug-15 108 Potrero 115 kV Bus Upgrade PG&E May-19 109 Ravenswood – Cooley Landing 115 kV Line Reconductor PG&E May-19 110 Reedley 70 kV Reinforcement PG&E May-18 111 Reedley 115/70 kV Transformer Capacity Increase PG&E May-18 112 Reedley-Dinuba 70 kV Line Reconductor PG&E May-17 113 Reedley-Orosi 70 kV Line Reconductor PG&E May-17 114 Rio Oso – Atlantic 230 kV Line Project PG&E Dec-19 115 Rio Oso 230/115 kV Transformer Upgrades PG&E Dec- 19 116 Rio Oso Area 230 kV Voltage Support PG&E Dec- 19 117 Ripon 115 kV Line PG&E Dec-16 118 San Bernard – Tejon 70 kV Line Reconductor PG&E Apr-17 119 San Mateo – Bair 60 kV Line Reconductor PG&E Dec-20 120 Santa Cruz 115 kV Reinforcement PG&E Cancelled 121 Semitropic – Midway 115 kV Line Reconductor PG&E May-18 122 Series Reactor on Warnerville-Wilson 230 kV Line PG&E Dec-17 123 Shepherd Substation PG&E Nov-15 124 Soledad 115/60 kV Transformer Capacity PG&E May-19 125 South of San Mateo Capacity Increase PG&E May-19 California ISO/MID 256 2014-2015 ISO Transmission Plan February 2, 2015 No Project PTO Expected InService Date 126 Spring 230/115 kV substation near Morgan Hill Undergoing Solicitation Process May-21 127 Stagg – Hammer 60 kV Line PG&E May-19 128 Stockton ‘A’ –Weber 60 kV Line Nos. 1 and 2 Reconductor PG&E May-17 129 Stone 115 kV Back-tie Reconductor PG&E Oct-17 130 Table Mountain – Sycamore 115 kV Line PG&E May-18 131 Taft 115/70 kV Transformer #2 Replacement PG&E May-18 132 Taft-Maricopa 70 kV Line Reconductor PG&E May-18 133 Tesla 115 kV Capacity Increase PG&E Nov-15 134 Tesla-Newark 230 kV Path Upgrade PG&E Dec-17 135 Tulucay 230/60 kV Transformer No. 1 Capacity Increase PG&E Oct-17 136 Vaca Dixon – Lakeville 230 kV Reconductoring PG&E Jul-17 137 Vierra 115 kV Looping Project PG&E May-19 138 Warnerville-Bellota 230 kV line reconductoring PG&E May-17 139 Watsonville Voltage Conversion PG&E Dec-18 140 Weber 230/60 kV Transformer Nos. 2 and 2A Replacement PG&E Apr-16 141 Weber-French Camp 60 kV Line Reconfiguration PG&E Jun-16 142 West Point – Valley Springs 60 kV Line PG&E May-19 California ISO/MID 257 2014-2015 ISO Transmission Plan No February 2, 2015 Project PTO Expected InService Date 143 West Point – Valley Springs 60 kV Line Project (Second Line) PG&E May-19 144 Wheeler Ridge Voltage Support PG&E May-20 145 Wheeler Ridge-Weedpatch 70 kV Line Reconductor PG&E May-18 146 Wilson 115 kV Area Reinforcement PG&E May-19 147 Wilson-Le Grand 115 kV line reconductoring PG&E Dec-20 148 Woodward 115 kV Reinforcement PG&E Dec-17 149 Imperial Valley Transmission Line Collector Station Project IID May-15 150 Trans Bay Cable Dead Bus Energization Project TransBay Cable May-15 California ISO/MID 258 2014-2015 ISO Transmission Plan February 2, 2015 Table 7.1-2: Status of previously approved projects costing $50M or more No Project PTO Expected In-Service Date 1 Additional 450 MVAR of dynamic reactive support at San Luis Rey (i.e., two 225 MVAR synchronous condensers) SDG&E Jun-16 2 Artesian 230 kV Sub & loop-in TL23051 SDG&E Jun-19 3 Bay Boulevard 230/69 kV Substation Project SDG&E Jun-17 4 Imperial Valley Flow Controller (IV B2BDC or Phase Shifting Transformer) SDG&E May-17 5 South Orange County Dynamic Reactive Support SDG&E Dec-17 6 Southern Orange County Reliability Upgrade Project – Alternative 3 (Rebuild Capistrano Substation, construct a new SONGS-Capistrano 230 kV line and a new 230 kV tap line to Capistrano) SDG&E Jun-17 NextEra Energy Transmission West, LLC Jun-17 7 Suncrest 300 MVAR dynamic reactive device 8 Sycamore-Penasquitos 230 kV Line SDG&E May-17 9 Talega Area Dynamic Reactive Support SDG&E Jun-15 10 Alberhill 500 kV Method of Service SCE Jun-18 11 Harry Allen-Eldorado 500 kV transmission project Undergoing solicitation process 2020 12 Lugo – Eldorado series cap and terminal equipment upgrade SCE Dec-16 13 Lugo-Mohave series capacitor upgrade SCE Dec-17 California ISO/MID 259 2014-2015 ISO Transmission Plan No February 2, 2015 Project PTO Expected In-Service Date SCE Dec-20 Undergoing solicitation process 2020 SCE Oct-16 14 Mesa 500 kV Substation 15 New Delaney-Colorado River 500 kV line 16 Tehachapi Transmission Project 17 Atlantic-Placer 115 kV Line PG&E May-19 18 Cottonwood-Red Bluff No. 2 60 kV Line Project and Red Bluff Area 230/60 kV Substation Project PG&E May-18 19 Embarcadero-Potrero 230 kV Transmission Project PG&E Apr-16 20 Fresno Reliability Transmission Projects PG&E Dec-15 21 Gates #2 500/230 kV Transformer Addition PG&E Dec-17 22 Gates-Gregg 230 kV Line 52 PG&E/MAT Dec-22 23 Kern PP 115 kV Area Reinforcement PG&E May-20 24 Lockeford-Lodi Area 230 kV Development PG&E May-20 25 Midway-Andrew 230 kV Project PG&E Dec-19 26 Midway-Kern PP #2 230 kV Line PG&E May-19 27 New Bridgeville - Garberville No.2 115 kV Line PG&E May-22 28 Northern Fresno 115 kV Reinforcement PG&E May-19 29 South of Palermo 115 kV Reinforcement Project PG&E May-19 52 During its 2012-13 transmission planning cycle, the ISO approved the Gates-Gregg 230 kV project as a doublecircuit tower line with a single conductor to be strung initially. Through the solicitation process the project has been awarded to PG&E, MidAmerican Transmission, and Citizens Energy (the “Gates-Gregg project sponsors”). At this time the ISO has not approved the need for the second circuit; however the ISO noted in the 2013-2014Transmission Plan that it would be prudent for the Gates-Gregg project sponsors to seek permits for the second circuit in parallel with or as a part of their permitting for the currently-approved Gates-Gregg project. California ISO/MID 260 2014-2015 ISO Transmission Plan No 30 31 February 2, 2015 Project Vaca – Davis Voltage Conversion Project Wheeler Ridge Junction Station California ISO/MID 261 PTO Expected In-Service Date PG&E May-21 Undergoing solicitation process May-20 2014-2015 ISO Transmission Plan February 2, 2015 7.2 Transmission Projects found to be needed in the 2014-2015 Planning Cycle In the 2014-2015 transmission planning process, the ISO determined that 6 transmission projects were needed to mitigate identified reliability concerns, no policy-driven projects were needed to meet the 33 percent RPS and 1 economic-driven project was found to be needed. The summary of these transmission projects are in the tables below. A list of projects that came through the 2014 Request Window can be found in Appendix G Table 7.2-1: New reliability projects found to be needed No. Project Name Service Area Expected In-Service Date Project Cost 1 2nd Pomerado - Poway 69kV Circuit SDG&E Jun-15 $17-19M 2 Mission-Penasquitos 230 kV Circuit SDG&E Jun-19 $22-25M 3 Reconductor TL692: Japanese Mesa - Las Pulgas SDG&E Jun-15 $25-29M 4 TL632 Granite Loop-In and TL6914 Reconfiguration SDG&E Jun-15 $15-20M 5 Laguna Bell Corridor Upgrade SCE Dec-20 $5M 6 North East Kern 70 to 115 kV Voltage Conversion PG&E May-22 $85-125M 7 Martin 230 kV Bus Extension PG&E 2021 $85-129M Table 7.2-2: New policy-driven transmission project found to be needed No. Project Name No policy-driven projects identified in the 2014-2015 Transmission Plan California ISO/MID 262 Service Area Expected In-Service Date Project Cost __ __ __ 2014-2015 ISO Transmission Plan February 2, 2015 Table 7.2-3: New economic-driven transmission project found to be needed No. 1 Project Name Lodi-Eight Mile 230 kV Line California ISO/MID 263 Service Area Expected In-Service Date Project Cost PG&E 2019 $7M 2014-2015 ISO Transmission Plan February 2, 2015 7.3 Competitive Solicitation for New Transmission Elements Phase 3 of the ISO’s transmission planning process includes a competitive solicitation process for reliability-driven, policy-driven and economic-driven regional transmission facilities. Where the ISO selects a regional transmission solution to meet an identified need in one of the three aforementioned categories that constitutes an upgrade to or addition on an existing participating transmission owner facility, the construction or ownership of facilities on a participating transmission owner’s right-of-way, or the construction or ownership of facilities within an existing participating transmission owner’s substation, construction and ownership responsibility for the applicable upgrade or addition lies with the applicable participating transmission owner. No regional transmission solutions recommended for approval in this 2014-2015 transmission plan are eligible for competitive solicitation. California ISO/MID 264 2014-2015 ISO Transmission Plan February 2, 2015 7.4 Capital Program Impacts on Transmission High Voltage Access Charge 7.4.1 Background The ISO is continuing to update and enhance its internal tool used to estimate future trends in the High Voltage Transmission Access Charge (HV TAC) to provide an estimation of the impact of the capital projects identified in the 10 Year Transmission Plan on the access charge. This tool was first used in developing results documented in the 2012-2013 transmission plan, and the model itself was released to stakeholders for review and comment in October 2013. Additional upgrades to the model have been made reflecting certain of the comments received from stakeholders. The final and actual determination of the High Voltage Transmission Access Charge is the result of numerous and extremely complex revenue requirement and cost allocation exercises conducted by the ISO’s participating transmission owners, with the costs being subject to FERC regulatory approval before being factored in the determination of a specific HV TAC rate recovered by the ISO from ISO customers. In seeking to provide estimates of the impacts on future access rates, we recognized it was neither helpful nor efficient to attempt to duplicate that modeling in all its detail. Rather, an excessive layer of complexity in the model would make a high level understanding of the relative impacts of different cost drivers more difficult to review and understand. However, the cost components need to be considered in sufficient detail that the relative impacts of different decisions can be reasonably estimated. The tool is based on the fundamental cost-of-service models employed by the participating transmission owners, with a level of detail necessary to adequately estimate the impacts of changes in capital spending, operating costs, and so forth. Cost calculations included costs associated with existing rate base and operating expenses, and, for new capital costs, tax, return, depreciation, and an operations and maintenance (O&M) component. The model is not a detailed calculation of any individual participating transmission owner’s revenue requirement – parties interested in that information should contact the specific participating transmission owner directly. For example, certain PTOs’ existing rate bases were slightly adjusted to “true up” with a single rate of return and tax treatment to the actual initial revenue requirement incorporated into the TAC rate, recognizing that individual capital facilities are not subject to the identical return and tax treatment. This “true up” also accounts for construction funds already spent which the utility has received FERC approval to earn return and interest expense upon prior to the subject facilities being completed. The tool does not attempt to break out rate impacts by category, e.g. reliability-driven, policydriven and economic-driven categories used by the ISO to develop the comprehensive plan in its structured analysis, or by utility. The ISO is concerned that a breakout by ISO tariff category can create industry confusion, as, for example, a “policy-driven” project may have also addressed the need met by a previously identified reliability-driven project that was subsequently replaced by the broader policy-driven project. While the categorization is appropriately as a “policy-driven” project for transmission planning tariff purposes, it can lead to California ISO/MID 265 2014-2015 ISO Transmission Plan February 2, 2015 misunderstandings of the cost implications of achieving certain policies – as the entire replacement project is attributed to “policy”. Further, certain high level cost assumptions are appropriate on an ISO-wide basis, but not necessarily appropriate to apply to any one specific utility. 7.4.2 Input Assumptions and Analysis The ISO’s rate impact model is based on publicly available information or ISO assumptions as set out below, with clarifications provided by several utilities. Each PTO’s most recent FERC revenue requirement approvals are relied upon for revenue requirement consisting of capital related costs and operating expense requirements, as well as plant and depreciation balances. Single tax and financing structures for each PTO are utilized, which necessitates some adjustments to rate base. These adjustments are “back-calculated” such that each PTO’s total revenue requirement aligned with the filing. Total existing costs are then adjusted on a going forward basis through escalation of O&M costs, adjustments for capital maintenance costs, and depreciation impacts. Draft Transmission Plan Editorial Note: An estimate of future HV TAC rates is not available at this time The ISO is currently in the process of updating the “starting point” for the HV TAC estimating tool to January 1, 2015. As well, the cost and timing of previously approved transmission is being reviewed. This is especially important as certain large projects can be capitalized in stages and also expenditures on projects that are receiving “CWIP-in-rate base” incentive treatment can impact rates before capitalization. Correct treatment of these issues is necessary to avoid double counting forecast impacts on rates. Recognizing the interest stakeholders have in this analysis, the ISO will seek to complete the analysis such that draft results can be presented at the February 2015 stakeholder meeting. California ISO/MID 266
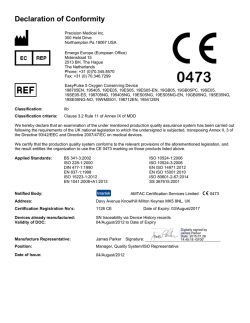


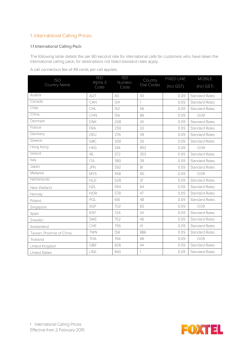

© Copyright 2026