
Quality evaluation and in vitro interaction studies
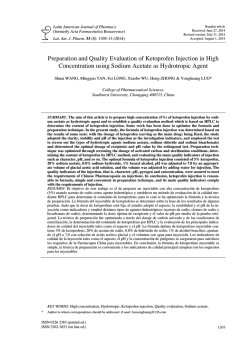
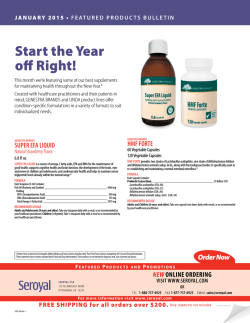
Quality evaluation and in vitro interaction studies between levofloxacin 250mg and diclofenac sodium 50mg tablets Muhammad Fayyaz, Rabia Ismail Yousuf*, Muhammad Harris Shoaib, Tariq Ali, Iqbal Nasiri and Nida Ashraf Department of Pharmaceutics, Faculty of Pharmacy, University of Karachi, Karachi, Pakistan Abstract: Fluoroquinolones are broad-spectrum antibiotics, work against Gram-positive and Gram-negative bacteria and are a clinically proven option for many resistant infections. Among fluoroquinolones Levofloxacin works best against acute sinusitis, inflammation of the lower airways, acute exacerbation of chronic bronchitis, community acquired pneumonia, complicated urinary tract infection including Pyelonephritis, chronic bacterial prostatitis and skin and soft tissue infection. Levofloxacin is a frequently prescribed antibacterial agent with Diclofenac Sodium for pain management in infectious conditions. The objective of the present work is to evaluate the level of interaction between Levofloxacin and Diclofenac Sodium. In this work market available brands of both drugs were also evaluated for quality. The physiochemical parameters like weight variation, thickness variation, and mechanical strength were determined. Similarly the percentage drug release and content uniformity test were also analyzed; the tested quality attributes were found within the recommended pharmacopeia ranges except brand L6 that had high drug content 124.629±3.614 while brand L4 and L5 were not found similar in pH 1.2. When subjected to model dependent analysis Levofloxacin showed compliance with (first order, Higuchi, Hixson Crowell and Weibull) at pH (1.2, 4.5 and 6.8). However Diclofenac Sodium showed adherence with (first order, Hixson Crowell and Weibull) at pH (1.2, 4.5 and 6.8) but following Higuchi at pH 1.2 and 4.5 only. The interaction studies were also performed spectrophotometrically and simultaneous equation was used to estimate the percentage availability of both the drugs at pH 4.5, 6.8, FaSSGF and FaSSIF. The studies showed that the percent availability of Levofloxacin was increased significantly in FaSSIF i.e. 129.173±0.323 at 45 minutes in the presence of Diclofenac Sodium. Keywords: In vitro interaction, Levofloxacin, Diclofenac sodium. INTRODUCTION Chemically Levofloxacin is (S)-9-fluoro-2,3-dihydro-3methyl-10-(4-methylpiperazin-1-yl)-7-oxo-7H -pyrido [1,2,3-de ]-1,4 benzoxazine-6-carboxylic acid (fig. 1). It is the optical S-(-) isomer of Ofloxacin. The efficacy of Levofloxacin has been increased to 32-128 folds due to isomerization (Davis and Bryson, 1994; Miyashita et al., 1995; Tanaka et al., 1992, Fujimoto et al., 1988). It inhibits the super coiling activity of bacterial DNA gyrase, halting DNA replication (Furuhama et al., 1992, Sato et al., 1989). Levofloxacin is rapidly and completely absorbed after oral administration. Therapeutically, it is used for the treatment of urinary tract infection, pyelonephritis, sinusitis, chronic bronchitis, and bacterial prostatitis and, other skin and soft tissue infections. Chemically, Diclofenac Sodium is 2-[2-(2,6dichloroanilino) phenyl] acetate sodium (fig. 2). It is a potent non-steroidal anti-inflammatory agents specifically indicated for rheumatoid arthritis, degenerative joint disease, ankylosing spondylitis and allied conditions, and in the treatment of pain resulting from minor surgery, trauma and dysmenorrheal (Brogden et al., 1980). Diclofenac Sodium is completely absorbed after oral *Corresponding author: e-mail: [email protected] Pak. J. Pharm. Sci., Vol.28, No.1, January 2015, pp.119-128 administration and achieves peak plasma levels within 2.5 hours. Antibiotics and analgesics are the most commonly prescribed agents in different clinical conditions and are available in a great number of generic products. The use of these agents has become a challenge with increasing number of available brands. In order to avoid drug resistance and effective bactericidal response with effective analgesia, quality of formulation is prerequisite. Several researchers have suggested evaluating pharmaceutical quality in order to ensure effectiveness (Adegoke et al., 2003). Therefore in vitro dissolution testing can be a valuable predictor of in vivo bioavailability and bioequivalence of oral solid dosage forms (Prajapati et al., 2005). Some studies have been reported, reflecting interaction of fluoroquinolones with NSAIDs. It has been reported that the concomitant administration of some fluoroquinolones with NSAIDs produces severe convulsions in human beings and animals (Ohtani et al., 2009). Similarly one researcher has also reported a significant decrease in total body clearance of another frequently prescribed fluoroquinolone Ciprofloxacin, with concurrent administration of Diclofenac Sodium (Khan et al., 2009). On the basis of these evidences, the prime objective of current study is to evaluate and compare the physicochemical equivalence 119 Quality evaluation and in vitro interaction studies of different brands of Levofloxacin and Diclofenac Sodium that are available in local market and to determine in vitro interaction between two drugs. The study will provide mechanistic basis for proper design of clinical studies using a modeling and simulation approach. The in vitro interaction of Levofloxacin from film-coated tablets was analyzed at different pH values i.e. phosphate buffer (pH 4.5 and 6.8), fasted state simulated gastric fluid (FaSSGF) and fasted state simulated intestinal fluid (FaSSIF) simulating certain parts of gastrointestinal tract (Sultana et al., 2010). MATERIALS AND METHODS Materials Levofloxacin and Diclofenac Sodium were kindly gifted by Sanofi-Aventis Pakistan Limited and Abbot Laboratories Pakistan. Different local and multinational brands of Levofloxacin 250 mg tablets and Diclofenac Sodium 50mg tablets were purchased from local market. All the glass ware used were of Pyrex origin, sodium hydroxide, sodium chloride, Triton X, hydrochloric acid, sodium taurocholate, lecithin, tri sodium phosphate anhydrous, potassium dihydrogen phosphate and monobasic sodium phosphate, acetonitrile, methanol and phosphoric acid (HPLC grade) all chemicals were purchased from (Merck, Millipore, Germany). Instrumentation Rheodyne Syringe (Gastight Hamilton USA), Filtration assembly (Sartorious, Gorringen, Germany), Vacuum Pump (Merck, Millipore Germany), pH meter (Jenway Portable 370 England), Ultrasonic bath (Clifton, Nickel Electro Ltd, Somerset, England), HPLC column (Waters Spherisorb 5µm ODSI 4.6x250 mm Analytical column, Ireland), Distillation assembly (Hamitton Laboratories, Kent, England), Dissolution apparatus USP I and II, (Erweka DT, Heusenstamm, Germany) and Spectrophotometer UV 1800 (Shimadzu, Japan) were used for the current studies. Assay was performed using HPLC (LC 10 AT, SPD 10AVP, Shimadzu, Japan). Method Six different market brands of Levofloxacin (250 mg tablets) and Diclofenac Sodium (50mg tablets) were selected for quality evaluation. Physical evaluation of tablets Tablets were evaluated for various physical parameters including weight variation, hardness, thickness, disintegration and dissolution. Weight variation was carried out by using analytical balance (Mettler Toledo B204-SSwitzerland), hardness was tested with Hardness Tester (OSK Fujiwara, OgawaSeiki Co Ltd, Tokyo, Japan), and thickness was measured using Digital Vernier Calliper (Seikobrand, China). Disintegration time was evaluated by disintegration tester (Erweka ZT2, 120 Heusenstamm, Germany). Single point dissolution test was carried out in Erweka DT 700, Heusenstamm, Germany dissolution tester by using (USP Apparatus I Rotating Basket, for Levofloxacin and USP Apparatus II paddles for Diclofenac Sodium). Dissolution studies were performed using dissolution media, specified in table 1 as mentioned in USP and BP (BP, 2013, USP37NF32, 2014). Mean and standard deviation were calculated using Microsoft excel. Content uniformity test for levofloxacin and diclofenac sodium (a) Levofloxacin Preparation of mobile phase For Levofloxacin 0.05 M KH2PO4: Acetonitrile (82:18) pH 2.6, adjusted with Ortho-phosphoric acid (Pea et al., 2001). Chromatographic condition for levofloxacin Injection volume was 20µl samples were analyzed at 280 nm, with a flow rate of 1ml/min. Levofloxacin reference standard and sample preparation 0.025% of test and reference standard solutions of Levofloxacin were prepared in mobile phase, filtered by using 0.45µm millex syringe filter (Merck Millipore, Germany) before injecting. Twenty tablets were weighed individually, crushed into powder, dissolved, diluted and filtered through 0.45µm millex syringe filter (Merck Millipore, Germany). Samples were injected and peak area was measured with the same concentration of Levofloxacin reference standard solution. (b) Diclofenac Sodium Preparation of mobile phase for Diclofenac Sodium Equal volumes of phosphoric acid (0.01 M) and monobasic sodium phosphate (0.01M) were mixed, to obtain the desirable pH of 2.5±0.2 (USP36-NF31, 2013). Chromatographic condition for Diclofenac Sodium Injection volume was 10µL, detected at 254 nm with a flow rate of 1 mL/min. Diluent Methanol and water in the ratio of 7:3 was used as diluent. Diclofenac sodium reference standard and sample preparation 0.075% of test and reference standard solution of diclofenac sodium was prepared in the diluent, filter through (0.45µm) millex syringe filter (Merck, Millipore, Germany) and injected. Pak. J. Pharm. Sci., Vol.28, No.1, January 2015, pp.119-128 Muhammad Fayyaz et al Similarly twenty tablets were weighed individually, crushed into powder, and diluted with the mentioned diluent to make the desirable strength. Filtered samples were injected and peak areas were measured. Tablets should contain not less than 90.0% and not more than 110.0% of the labeled amount of Levofloxacin and Diclofenac Sodium (USP37NF32). Dissolution profile comparison Dissolution studies of Levofloxacin 250mg and Diclofenac Sodium 50mg tablet were carried out at 100 and 50 rpm, using 900 ml of hydrochloric acid buffer pH 1.2, phosphate buffer pH 4.5 and pH 6.8 (see table 1) at a temperature of 37±0.5°C. A sample of 10ml was drawn at different time interval i.e., 5, 10, 15, 20, 30, 45, 60, 90 120, 150, 180 min and replaced with 10ml of the similar medium maintained at 37±0.5°C. Percentage drug release was determined by UV spectrophotometer UV-Vis 1800 spectrophotometer (Shimadzu Corporation Kyoto, Japan) at a wavelength of 294 nm for Levofloxacin and 276nm for Diclofenac Sodium. DATA STATISTICAL ANALYSIS First-order kinetic model According to first order kinetic rate of release is concentration dependent (Eq.1) at Higuchi Square Root Law (Eq.2) Where k is the Higuchi release rate constant and t is the time in hours. Hixson Crowell cube root law Hixson Crowell in 1931 recognized that the particles regular area is proportional to the cube root of its volume (Hixson and Crowell, 1931). (Eq.3) Where is the initial concentration of drug in the tablets is the remaining concentration of drug in the and Pak. J. Pharm. Sci., Vol.28, No.1, January 2015, pp.119-128 is the Hixson–Crowell Weibull model An equation described by Weibull was used to explain release procedure (Lin and Cham, 1996). This equation can be used to all types of drug release curves (Romero, Costa et al., 1991, Vudathala and Rogers, 1992). (Eq.4) is the accumulated fraction of the drug in the Where solution at time , defines the time scale of the process, represent the lag time before the onset dissolution characterize the curve as exponent release process (Costa and Sousa Lobo, 2001). Model independent approach FDA has approved following equation (Eq.5) for the pairwise comparison of dissolution profiles of test and reference formulations. The test is said as similarity factor (f2). (Eq.5) Model dependent approach The dissolution data was subjected to analysis using different dissolution models like; first order (Eq.1) that is log cumulative percentage drug remaining vs. time, Higuchi model (Eq.2) as cumulative percentage drug release vs. square root of time, Hixson – Crowell cube root law (Eq.3) as cube root percentage drug remaining vs. time and Weibull model (Eq. 4) as log dissolved amount of drug vs. log of time, using DD-solver that is an add-in program to Microsoft excel® for windows (Huo et al., 2010). The drug release at time t is Q; initial drug release is time and and the first order rate constant. dosage form at time t. constant. (Higuchi, 1963) Where Rt is the amount of drug release from the reference (L1 and D1 for Levofloxacin and Diclofenac Sodium respectively) at each time point, Tt is the amount of drug release from the test brands of each, and n is the number of dissolution sample time. The profiles would be considered similar when, similarity factor (f2) is >50 (Kannan et al., 2012). In vitro interaction study The interaction studies between Levofloxacin 250mg and Diclofenac Sodium 50mg tablets were carried out spectrophotometrically in different dissolution media i.e., phosphate buffer pH 4.5 and 6.8, fasted state simulated intestinal fluid (FaSSIF) and fasted state simulated gastric fluid (FaSSGF), as specified in table 1 using dissolution test apparatus II. Quantitation of interacting drug Levofloxacin and Diclofenac Sodium were observed to follow Beer’s law at their respective wave lengths of detections i.e. 294nm and 276nm. The linearity was observed in the range of 0.001-0.0018mM for Levofloxacin and 0.01-0.180mM for Diclofenac Sodium. For the quantitation of both the drugs, molar absorptivities were calculated at their respective wavelength of detection and that of interacting drug i.e. diclofenac sodium (table 7). In the first phase of the study the percentage availability of both the drugs were determined in the mentioned dissolution media at 37±0.5°C. The samples were drawn at different time intervals. In order to observe interaction 121 Quality evaluation and in vitro interaction studies Table 1: Dissolution Media S. No. 1 2 4 5 6 7 8 Methodology For Preparation of Buffer Hydrochloric Acid Buffer pH 1.2 Place 50 mL of the potassium chloride solution in a 200-mL volumetric flask, add the 85 ml of 0.2 M hydrochloric acid solution, and then add water to volume. Potassium Dihydrogen Phosphate Buffer pH 4.5 Dissolve 6.80 g of potassium dihydrogen phosphate in 1000 ml of water Potassium Dihydrogen Phosphate Buffer pH 6.8 Place 50 mL of the monobasic potassium phosphate solution in a 200-mL volumetric flask, add 22.4 ml of 0.2 M sodium hydroxide solution, and then add water to volume. Tribasic Sodium Phosphate Buffer pH 6.8 Solution A: 76mg/ml tribasic sodium phosphate Solution A and 0.1 N hydrochloric acid (1:3), adjusted with 2 N hydrochloric acid or 2 N sodium hydroxide to a pH of 6.8 ± 0.05, if necessary Fasted State of Gastric Juice FaSSGF S. No. Chemicals Quantity 1 Sodium Chloride 2 gm 2 Hydrochloric Acid 3 gm 3 Triton X 1 gm 4 Deionized Water q.s 1000 ml Blank Fasted State Of Intestinal Fluid (FaSSIF) 1 Sodium Dihydrogen Phosphate 3.438 gm 2 Sodium Chloride 3 gm 3 Sodium Hydroxide 0.348 gm 4 Deionized water q.s 1000 ml Fasted State of Intestinal Fluid (FaSSIF) 1 Sodium Taurocholate 1.65 gm 2 Lecithin 0.591 gm 3 Blank FaSSIF q.s 1000 ml Reference (USP37NF32. 2014) (BP, 2013) (USP37NF32. 2014) (USP37NF32. 2014) (Dressman, 2005) (Dressman, 2005) (Dressman, 2005) Table 2: Physical Parameters of market available brands of Levofloxacin 250mg tablets Brand Code L1 L2 L3 L4 L5 L6 Average Weight mg±SD n= 20 319.628±2.190 408.375±2.409 319.204±2.350 322.725±4.084 326.310±3.842 405.391±2.595 Average Hardness kg/cm2 ± SD n=20 10.845±1.321 11.115±1.447 8.491±0.616 12.078±1.196 8.132±0.958 8.122±1.294 Levofloxacin Average Disintegration Thickness mm Test ± SD n=6 ± SD n=20 4.16±0.072 4.83±1.29 3.85±0.034 5.83±1.50 4.99±0.070 6.25±1.44 4.07±0.063 5.5±1.18 4.66±0.041 7.25±1.63 4.53±0.0311 7.5±1.37 Single Point Dissolution Test n= 6 100.97±1.19 100.22±1.43 100.11±0.77 100.22±0.98 100.20±0.92 100.02±0.93 Assay ± SD n=3 103.461±3.346 104.793±3.534 102.867±3.020 101.930±0.996 106.133±4.320 124.629±3.614 Limits: ± 5%for tablet weighing and thickness. Hardness is > 5 kg/cm2. Disintegration less than 30 min for uncoated and film coated tablets. Single point dissolution not less than 80% (Q) of the labeled amount of levofloxacin is dissolved. Content uniformity tablets contain not less than 90.0% and not more than 110.0% of the labeled amount of levofloxacin (USP37NF32, 2014, www.usp.org/sites/default/.../usp.../USPNF/pendingStandards/m5751.pdf). Levofloxacin 250mg tablet and Diclofenac Sodium 50mg tablet were added simultaneously. The samples were analyzed on UV spectrophotometer. As the difference between the absorption maxima of Levofloxacin (294nm) and Diclofenac Sodium (276nm) was observed greater, simultaneous equation was used for the quantitation of drug concentration (Sultana et al., 2010). (Eq.6) 122 (Eq.7) Ca is the concentration of Levofloxacin and Cb is the concentration of interacting drug Diclofenac Sodium, a1 and a2 sequentially were the molar absorptivities of Levofloxacin at λmax (Levofloxacin) i.e.294 and at λmax (interacting drug) i.e.276nm, while b1 and b2 were the molar absorptivities of Diclofenac Sodium at λmax (interacting drug Pak. J. Pharm. Sci., Vol.28, No.1, January 2015, pp.119-128 Muhammad Fayyaz et al Diclofenac Sodium) respectively. i.e.276 nm and at λmax i.e.294, (levofloxacin) RESULTS To minimize the health related risks and to enhance the drug related safety, it is mandatory to evaluate pharmaceutical quality. In this study, different physicochemical parameters of the selected brands of Levofloxacin 250mg and Diclofenac Sodium 50mg tablets were analyzed and their results were found within acceptable limits (USP37NF32, 2014). Fig. 1: Levofloxacin (D1-D6) tablets were in the range of 319.628±2.190 mg to 408.375±2.409mg and 145.503±3.158mg to 221.927± 4.085mg, respectively. Whereas thickness variation was observed in the range of 3.85±0.034 mm to 4.99±0.07 mm for Levofloxacin and 3.44±0.024 to 4.74±0.024 mm for Diclofenac Sodium tablets. The results are given in table 2 and 3 and showing that they are within the pharmacopeial limits. Hardness of the selected brands was also evaluated in order to assess tablet resistance against breakage during tablet handling, and was found to be 8.122±1.294 kg/cm2 to 12.078±1.196 kg/cm2 for Levofloxacin, and 13.30± 1.85 to 17.21±2.02 kg/cm2 for Diclofenac Sodium tablets. With the good physical strength, tablets of both the brands also showed compliance with the disintegration test limits, i.e. 4.83±1.29 min to 7.5±1.37 min for L1-L6. However, in case of enteric coated Diclofenac sodium tablets, no tablet showed disintegration in simulated gastric fluid but disintegrated in simulated intestinal fluid at 20.5±3.83 min to 22.00± 3.40 min (tables 2-3). It was observed that the mean weights of the selected brands of Levofloxacin (L1-L6) and Diclofenac Sodium Dissolution testing is a well-established technique widely used to evaluate percentage drug release from solid Table 3: Physical Parameters of market available brands of Diclofenac Sodium (enteric coated) 50mg tablets Brand Code Average Weight mg ± SD n= 20 Average Hardness kg/cm2 ± SD n=20 Average Thickness mm ± SD n=20 D1 221.927±4.085 17.21±2.02 3.63±0.031 D2 184.980±4.212 13.31±2.23 4.74±0.024 D3 156.944±3.112 11.92±2.15 3.44±0.024 D4 145.503±3.158 13.77±1.99 3.44±0.032 D5 205.163±2.671 13.30±1.85 4.04±0.033 D6 204.413±2.43 13.23±2.48 3.6185±0.05 Diclofenac Sodium Disintegration Disintegration Test ± SD n = 6 Test ± SD n = 6 in simulated in simulated gastric fluid intestinal fluid No Disintegration 21.41±2.04 after 60 mints No Disintegration 20.50±3.83 after 60 mints No Disintegration 21.16±3.81 after 60 mints No Disintegration 22.00±3.40 after 60 mints No Disintegration 21.66±4.16 after 60 mints No Disintegration 20.66±4.71 after 60 mints Single Point Dissolution Test n = 6 Assay ± SD n=3 100.36±1.003 98.461±1.308 100.14±0.197 99.319±1.767 100.07±1.066 98.013±2.057 100.09±0.666 99.378±1.239 99.95±0.897 98.160±1.497 99.85±0.911 99.268±3.404 Limits: ±7.5%for weight variation and ±5% for thickness variation. Hardness is > 5 kg/cm2. Disintegration no evidence of softening or cracking after 60 minutes, Single point dissolution test not less than 75% (Q) of the labeled amount of diclofenac sodium is dissolved. Content uniformity tablets contain not less than 90.0% and not more than 110.0% of the labeled amount of diclofenac sodium (USP37NF32, 2014) Table 4: Similarity factors (f2) at different pH with L1and D1 as reference brand Brand Codes L2 L3 L4 L5 L6 1.2 57.220 81.256 35.190 37.215 70.503 Levofloxacin pH 4.5 62.462 51.921 59.610 62.322 64.204 Brand Codes 6.8 56.945 68.552 51.325 56.235 57.494 Pak. J. Pharm. Sci., Vol.28, No.1, January 2015, pp.119-128 D2 D3 D4 D5 D6 1.2 86.324 86.037 79.190 76.796 81.625 Diclofenac Sodium pH 4.5 6.8 85.912 64.408 65.883 58.471 62.606 58.356 55.060 53.414 56.192 54.906 123 Quality evaluation and in vitro interaction studies dosage forms. All the selected brands of Levofloxacin (L1-L6) showed 100.02 ± 0.93% to 100.97±1.19% drug releases at 30 minutes while Diclofenac Sodium tablet exhibited percentage drug release in the range of 99.85± 0.911% to 100.36±1.003 % at 45min. of Diclofenac Sodium i.e. 129.173±5.80% at 45 minutes, and decrease in the availability of Diclofenac Sodium was observed i.e., 94.018±1.741 to 80.703±2.092 at 180 minutes in fasted state simulated intestinal fluid (FaSSIF). DISCUSSION The percentage drug content was estimated to evaluate the label claim of drug strength. For Levofloxacin brands the content assay results were, 101.930±0.996% to 124.629 ±3.614% while that of Diclofenac Sodium tablet brands were 98.013±2.057% to 99.378±1.239%. The results of content uniformity revealed that the percentage drug content were within the USP limits (tables 2-3). The similarity factor (f2) values for Levofloxacin and Diclofenac Sodium tablet brands are shown in table 4, and found to be highest 81.256% at pH 1.2 for Levofloxacin (L3) and 86.324% at pH 1.2 for Diclofenac Sodium (D2). The graphical presentations of drug release are presented by figs. 3 and 4, using Origin Pro 9.0. First order kinetic model has extensively been used for studying drug release profile. The highest value of coefficient of correlation (r2) was observed to be 0.9971 for L1 at pH 1.2 and 0.9985 for D1 at pH 1.2. Higuchi developed numerous models to explain the release of water soluble compounds from solid and /or semisolid matrixes (Higuchi, 1963). In present work the Higuchi model showed highest value of coefficient of correlation of 0.9973 for L1 at pH 4.5 and 0.9944 at pH 1.2 for D2. Hixson-Crowell model elaborates that the rate of release is restricted by the release of the particle and is independent of diffusion (Costa and Sousa Lobo, 2001). The coefficient of correlation (r2) for Hixson-Crowell was observed to be highest for L1 i.e. 0.9998 (pH 1.2), 0.9909 (pH 4.5) and 0.9785 (pH 6.8). Weibull demonstrates S-shaped release of drug. The parameter of shape (β) was found to be < 1 for L2, L4, and L5 at pH 6.8and D2, DandD5 at pH 1.2 and 4.5 indicating parabolic curve (tables 5-6). In present work simultaneous equation was used to estimate the percentage drug release of these drugs from tablets and their availability was calculated in the presence of each other at phosphate buffer pH 4.5, 6.8, fasted state simulated gastric fluid (FaSSGF) and fasted state simulated intestinal fluid (FaSSIF) for 180 minutes. The results are presented by figs. 3 and 4, generated by Origin Pro 9.0. It was observed that percentage release of Levofloxacin increased to 105.625±0.213% at pH 4.5, in the presence of Diclofenac Sodium and the release amount of Diclofenac Sodium was also increase 95.420±2.764 (see fig. 5-6). At pH 6.8 it was found that the release of Levofloxacin in the presence of Diclofenac Sodium, got earlier i.e. 29.25±1.891% at 5 min to 90.307±2.895% and similar pattern was observed for Diclofenac Sodium i.e. 42.79±2.419% at 5 min to 47.661±2.295% (fig. 5-6). A tremendous rise in the availability of Levofloxacin was observed in the presence 124 The main objective of current study was to evaluate the pharmaceutical quality of Levofloxacin (250mg) and Diclofenac Sodium (50 mg) tablets, and to assess the degree of in vitro interaction between them. Many regulatory guidelines do not address specific study designs for in vitro and in vivo drug-drug interaction studies. There is a common desire by regulatory authorities and by industry sponsors to harmonize approaches, in order to allow better assessment of the significance of findings across different studies and drugs (Callaghan et al., 2003). This study will provide a mechanistic basis to design clinical methodology using a modeling and simulation approach. There are many researchers who had evaluated pharmaceutical quality of different brands of Levofloxacin and Diclofenac Sodium tablets. Bano et al., 2010 also observed the similar results of weight and thickness variation when evaluated the quality of different Levofloxacin brands (Gauhar et al., 2010). Similarly many researchers have evaluated pharmaceutical quality of different enteric coated brands of Diclofenac Sodium (Badwaik and Hosny, 1996). Fig. 2: Diclofenac Sodium Fig. 3: % Drug release of different brands of Diclofenac sodium in pH 1.2, 4.5 and 6.8 (n=12) Pak. J. Pharm. Sci., Vol.28, No.1, January 2015, pp.119-128 Muhammad Fayyaz et al approaches (similarity factor f2) and different models like, first-order, Higuchi, Hixson–Crowell and Weibull, to the drug dissolution profiles to understand the similarity and drug release mechanisms (Nainar, Rajiah et al., 2012, Siepmann and Peppas, 2001). There are several methods reported by researchers to quantitate Levofloxacin and Diclofenac Sodium using spectrophotometer (Savaşer, Özkan et al., 2005, Thakkar, Shah et al., 2009). Fig. 4: % Drug release of different brands of Levofloxacin in pH 1.2, 4.5 and 6.8 (n=12) When Levofloxacin tablet release profile was taken in Fasted state simulated gastric fluid (FaSSGF) in the presence of Diclofenac Sodium tablet, no significant change was observed in percentage availability of Levofloxacin and Diclofenac sodium. Whereas when availability of Levofloxacin was determined in fasted state simulated intestinal fluid (FaSSIF) in the presence of Diclofenac Sodium, a tremendous rise in availability was observed however, the availability of Diclofenac Sodium was observed low in the presence of Levofloxacin. The changed availability of Levofloxacin in the presence of Diclofenac Sodium at FaSSIF may be associated with the formation of charge-transfer complex, due to rearrangement of electrons (Sultana et al., 2010). Fig. 5: % Drug release of Levofloxacin before and after interaction with diclofenac sodium at pH 4.5, 6.8, FaSSGF and FaSSIF (n=6) Hosnyet et al., worked on enteric coated beads of Diclofenac Sodium and evaluated for their particle size distribution, drug loading efficiency, in vitro drug release at pH 1.2 and pH 6.8, in comparison with commercially available enteric-coated tablets (El-Mahrouk et al., 1998). The in vitro drug release characteristics are best quantitated by dissolution profile studies, which not only remain helpful in evaluating quality of product but also in formulation development and optimization, as well as for regulatory surveillance. Ylenia and Giacomo studied in vitro release behavior of Diclofenac Sodium from matrices based on chitosan (Zambito and Di Colo, 2003). Yeole et al., reported release kinetics of Diclofenac Sodium through model dependent approach, from matrix tablets (Yeole, Galgatte et al., 2006). Similarly, efforts have been put by Thakkar et al., to study the release mechanisms and kinetics of Levofloxacin. Many researchers have applied both, model independent Pak. J. Pharm. Sci., Vol.28, No.1, January 2015, pp.119-128 Fig. 6: % Drug release of Diclofenac sodium before and after interaction with Levofloxacin at pH 4.5, 6.8, FaSSGF and FaSSIF (n=6) CONCLUSION The current study reveals that physiochemical parameters evaluation of drug products is pre-requisite to obtain efficient drug product. It was also observed that availability of Levofloxacin increased in the presence of Diclofenac Sodium in FaSSIF however availability of Diclofenac observed to be decreased in the same medium in the presence of Levofloxacin. The study will be helpful for in vivo pharmacokinetic interaction studies between Levofloxacin and Diclofenac Sodium. 125 126 KHC (h-1/3) 0.080 0.053 0.028 0.741 0.046 0.039 0.9998 0.9873 0.9132 0.9996 0.9902 0.9260 r 2 pH 1.2 pH 1.2 K1 (h-1) 0.351 0.207 0.561 0.108 0.122 0.263 KHC (h-1/3) 0.023 0.006 0.007 0.006 0.006 0.007 KHC (h-1/3) 0.019 0.008 0.008 0.008 0.008 0.010 pH 4.5 0.9909 0.8049 0.8126 0.7818 0.7748 0.7941 r 2 Hixon Crowell r2 0.9971 0.9637 0.8828 0.9560 0.9590 0.9629 First Order pH 4.5 K1 (h-1) r2 0.108 0.9494 0.116 0.9588 0.078 0.9394 0.135 0.9762 0.121 0.9433 0.050 0.9912 0.9785 0.9340 0.8982 0.9521 0.9253 0.9673 r 2 pH 6.8 12.290 66.779 35.44 66.729 71.855 52.015 α D2 D3 D4 D5 D6 Brand Code D2 D3 D4 D5 D6 Brand Code KHC (h-1/3) 0.000 0.000 0.000 0.000 0.000 0.000 r 2 0.9985 0.9775 0.9685 0.9889 0.9315 0.9129 pH 1.2 KHC (h-1/3) 0.007 0.007 0.007 0.007 0.007 0.007 r 2 71.157 208.230 144.915 204.488 168.374 117.747 α 0.337 0.508 0.419 0.437 0.366 0.337 β pH 1.2 pH 6.8 K1 (h-1) r2 0.081 0.9822 0.086 0.9968 0.078 0.9959 0.061 0.9961 0.059 0.9786 0.059 0.9966 0.9456 0.8719 0.8871 0.9364 0.9223 0.9369 pH 6.8 First Order pH 4.5 K1 (h-1) r2 0.031 0.9801 0.031 0.9748 0.024 0.9467 0.000 0.6422 0.021 0.9432 0.021 0.8958 Hixon Crowell pH 4.5 KHC r2 (h-1/3) 0.007 0.9609 0.007 0.9510 0.006 0.9337 0.006 0.9232 0.006 0.9391 0.004 0.8266 pH 1.2 K1 (h-1) r2 0.000 0.9985 0.000 0.9779 0.000 0.9689 0.000 0.9890 0.000 0.9319 0.000 0.9133 1.886 1.851 1.274 1.851 1.938 2.552 β 0.9987 0.9944 0.9953 0.9944 0.9921 0.9999 r 2 0.9667 0.9944 0.9924 0.9826 0.9812 0.9790 r 2 19.645 15.784 13.368 12.628 18.114 10.951 α 0.9850 0.9934 0.9959 0.9938 0.9957 0.9951 r 0.840 0.777 0.686 0.663 0.741 0.618 β 0.9713 0.9618 0.9403 0.9350 0.9396 0.9057 r 2 Higuchi pH 4.5 KH (h-1/2) r2 7.670 0.8537 7.447 0.8314 7.157 0.8292 7.072 0.8250 7.307 0.8602 6.795 0.7848 1.543 1.386 1.454 1.348 1.625 1.312 β Weibull Model pH 4.5 79.918 63.994 55.479 64.394 134.372 51.227 α 2 α 7.003 15.007 20.935 15.265 18.483 14.701 α 0.9486 0.9502 0.9472 0.9776 0.9193 0.9730 r2 0.794 1.071 1.141 0.989 1.042 0.958 β pH 6.8 0.9922 0.9965 0.9962 0.9958 0.9789 0.9966 r2 pH 6.8 KH (h-1/2) r2 7.158 0.7837 6.932 0.6735 7.292 0.7023 7.596 0.7711 7.633 0.7566 7.588 0.7822 1.160 0.877 1.207 0.925 0.916 1.112 β pH 6.8 pH 6.8 KH (h-1/2) r2 15.733 0.9429 8.461 0.7884 13.254 0.8743 8.625 0.8231 13.101 0.9135 9.655 0.8368 14.002 6.372 22.587 6.209 6.721 13.390 Higuchi pH 4.5 KH (h-1/2) r2 21.0.92 0.9973 12.321 0.8028 11.331 0.7438 5.373 0.5607 18.326 0.9461 6.137 0.5836 Weibull Model pH 4.5 pH 1.2 KH (h-1/2) r2 19.436 0.9080 18.868 0.8188 7.246 0.6354 5.659 0.4529 23.952 0.9466 13.345 0.6797 pH 1.2 KH (h-1/2) r2 0.564 0.9926 0.486 0.9944 0.443 0.9903 0.343 0.9888 0.292 0.9675 0.098 0.6554 pH 1.2 pH 6.8 K1 (h-1) r2 0.061 0.9780 0.049 0.9864 0.065 0.9933 0.045 0.9878 0.048 0.9876 0.05 0.9913 Table 6: Release Kinetics of different brands of Diclofenac Sodium in different pH L1 L2 L3 L4 L5 L6 Brand Code L1 L2 L3 L4 L5 L6 Brand Code Table 5: Release Kinetics of different brands of Levofloxacin in different pH Quality evaluation and in vitro interaction studies Pak. J. Pharm. Sci., Vol.28, No.1, January 2015, pp.119-128 Muhammad Fayyaz et al Table 7: Molar absorptivities of levofloxacin and diclofenac sodium S. No. 1 2 Dissolution medium Fasted state of gastric juice (FaSSGF) Fasted state of Intestinal fluid (FaSSIF) 3 Hydrochloric acid buffer pH 1.2 4 Phosphate buffer pH 4.5 5 Phosphate buffer pH 6.8 ←Levofloxacin→ ( moles-1 Lcm-1) λ 294 nm* 20400 280 nm 16300 288 nm* 28549 276 nm 9999 294 nm* 31500 276 nm 15200 294 nm* 62700 276 nm 30229 288 nm* 26500 276 nm 16055 ←Diclofenac Sodium→ ( moles-1 Lcm-1) λ 294 nm 5500 280 nm* 9077 288 nm 5781 276 nm* 9899 294 nm 276 nm* 294 nm 7721 276 nm* 23584 288 nm 6833 276 nm* 9933 *= λ max of drug REFERENCES Arayne MS, Sultana N, Rizvi SBS and Haroon U (2010). In vitro drug interaction studies of atorvastatin with ciprofloxacin, gatifloxacin and ofloxacin. Med Chem Res., 19(8): 717-731. Badwaik H and Tripathi DK (2012) In vitro evaluation of commercially available enteric coated tablet containing diclofenac sodium. IJRPBS, 3(2): 875-881. Bano R, Gauhar S, Naqvi SBS and Mahmood S (2010). Pharmaceutical evaluation of different brands of levofloxacin tablets (250mg) available in local market of Karachi (Pakistan). Int J Curr Pharm Res., 3: 15-22. Bjornsson TD, Callaghan JT, Einolf HJ, Fischer V, Gan L, Grimm S, Kao J, King SP, Miwa G and Ni L (2003). The conduct of in vitro and in vivo drug-drug interaction studies: A pharmaceutical research and manufacturers of america (PhRMA) perspective. Drug Metab Dispos., 31(7): 815-832. British Pharmacopeia (2013) British Pharmacopeia Commision Appendix ID A155. Brogden RN, Heel RC, Pakes GE, Speight TM and Avery GS (1980). Diclofenac sodium: A review of its pharmacological properties and therapeutic use in rheumatic diseases and pain of varying origin. Drugs, 20(1): 24-48. Costa P and Sousa Lobo JM (2001). Modeling and comparison of dissolution profiles. Eur J Pharm Sci., 13(2): 123-133. Davis R and Bryson HM (1994). Levofloxacin. A review of its antibacterial activity, pharmacokinetics and therapeutic efficacy. Drugs, 47(4): 677-700. Dressman JB and Kramer J (2005). Development of dissolution tests on the basis of gastrointestinal physiology. In: Dressman JB and Kramer J editors. Pharmaceutical dissolution testing., Taylor & Francis Group .,Boca Raton New york, 206-207. Hayakawa I, Furuhama K, Takayama S and Osada Y (1992). Levofloxacin, a new quinolone antibacterial agent. An introductory overview. Arzneimittelforschung, 43(3A): 363-364. Pak. J. Pharm. Sci., Vol.28, No.1, January 2015, pp.119-128 Higuchi T (1963). Mechanism of sustained-action medication. Theoretical analysis of rate of release of solid drugs dispersed in solid matrices. J Pharm Sci., 52(12): 1145-1149. Hixson A and Crowell J (1931). Dependence of reaction velocity upon surface and agitation. Industr Engin Chem., 23(8): 923-931. Hoshino K, Sato K, Une T and Osada Y (1989). Inhibitory effects of quinolones on DNA gyrase of escherichia coli and topoisomerase II of fetal calf thymus. Antimicrob Agents Chemother., 33(10): 18161818. Hosny E, El-Mahrouk G and Gouda M (1998). Formulation and in vitro and in vivo availability of diclofenac sodium enteric-coated beads. Drug Develop Industr Pharm., 24(7): 661-666. Hosny EA (1996). Formulation and comparative evaluation of bioadhesive containing diclofenac sodium and commercial enteric coated tablets in vitro and in dogs. Int J Pharmaceut., 133(1): 149-153. Iqbal Z, Khan A, Naz A, Khan JA and Khan GS (2009). Pharmacokinetic interaction of ciprofloxacin with diclofenac. Clin Drug Invest, 29(4): 275-281. Kim J, Ohtani H, Tsujimoto M and Sawada Y (2009). Quantitative comparison of the convulsive activity of combinations of twelve fluoroquinolones with five nonsteroidal antiinflammatory agents. Drug Metab Pharmacokin., 24(2): 167-174. Lin CW and Cham TM (1996). Effect of particle size on the available surface area of nifedipine from nifedipine-polyethylene glycol 6000 solid dispersions. Int J Ppharmaceut., 127(2): 261-272. Manikandan M, Kannan K, Selvamuthukumar S and Manavalan R (2012). Formulation development and evaluation of emtricitabine and tenofovir disproxil fumarate tablets. Int J Drug Dev Res., 4(1): 247-256. Nainar S, Rajiah K, Angamuthu S, Prabakaran D and Kasibhatta R (2012). Biopharmaceutical classification system in in vitro/in vivo correlation: Concept and development strategies in drug delivery. Trop J Pharm Res., 11(2): 319-329. 127 Quality evaluation and in vitro interaction studies Nakamori Y, Miyashita Y, Nakatani I and Nakata K (1995). Levofloxacin: Penetration into sputum and once-daily treatment of respiratory tract infections. Drugs, 49(Suppl 2): 418-419. Odeniyi MA, Adegoke OA, Adereti RB, Odeku OA and Itiola OA (2003). Comparative analysis of eight brands of sulfadoxine-pyrimethamine tablets. Trop J Pharm Res., 2(1): 161-167. Patel AK, Prajapati BG, Moria RS and Patel CN (2005). In vitro evaluation of marketed antimalarial chloroquine phosphate tablets. J Vector Borne Dis., 42(4): 147-150. Romero P, Costa J, Chulia D, Wells J, Rubinstein M and Horwood E (1991). Statistical optimization of a controlled release formulation obtained by a double compression process: Application of a Hadamard matrix and a factorial design. Pharm Technol Contr Drug Release, 2: 44-58. Savaşer A, Özkan Y and Işımer A (2005). Preparation and in vitro evaluation of sustained release tablet formulations of diclofenac sodium. Il Farmaco., 60(2): 171-177. Scotton P, Pea F, Giobbia M, Baraldo M, Vaglia A and Furlanut M (2001). Cerebrospinal fluid penetration of levofloxacin in patients with spontaneous acute bacterial meningitis. Clin Infect Dis., 33(9): 109-111. Siepmann J and Peppas N (2001). Modeling of drug release from delivery systems based on hydroxypropyl methylcellulose (HPMC). Adv Drug Deliv Rev., 48(2): 139-157. Tanaka K, Iwamoto M, Maesaki S, Koga H, Kohno S, Hara K, Sugawara K, Kaku M, Kusano S and Sakito O 128 (1992). Laboratory and clinical studies on levofloxacin]. Jpn J Antibiot., 45(5): 548-556. Thakkar V, Shah P, Soni T, Parmar M, Gohel M and Gandhi T (2009). Fabrication and evaluation of levofloxacin hemihydrate floating tablet. Res Pharm Sci., 3(2): 1-8. Une T, Fujimoto T, Sato K and Osada Y (1988). In vitro activity of DR-3355, an optically active ofloxacin. Antimicrob Agents Cchemother., 32(9): 1336-1340. USP36-NF31. (2013). United state Pharmacopeia convention [online]. Available at: http://www.uspnf.com/uspnf/pub/index?usp=36&nf=3 1&s=1&officialOn=August 1, 2013 [Accessed 9 November 2013. USP37NF32 (2014). United states pharmacopeial covention, Inc., Rockville, pp. 3221-3222, 1209-1210. Vudathala GK and Rogers JA (1992). Dissolution of fludrocortisone from phospholipid coprecipitates. J Pharm Sci., 81(3): 282-286. Yeole P, Galgatte U, Babla I and Nakhat P (2006). Design and evaluation of xanthan gum-based sustained release matrix tablets of diclofenac sodium. Indian J Pharm Sci., 68(2): 185-189. Zambito Y and Di Colo G (2003). Preparation and in vitro evaluation of chitosan matrices for colonic controlled drug delivery. J Pharm Pharm Sci., 6(2): 274-281. Zhang Y, Huo M, Zhou J, Zou A, Li W, Yao C and Xie S (2010). DDSolver: An add-in program for modeling and comparison of drug dissolution profiles. AAPS journal, 12(3): 263-271. Pak. J. Pharm. Sci., Vol.28, No.1, January 2015, pp.119-128

© Copyright 2026