
Glycated Serum Protein Assay on the Siemens Advia 1800 Publication
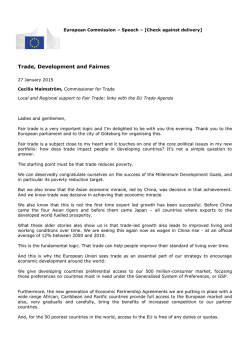
567894 research-article2015 DSTXXX10.1177/1932296814567894Journal of Diabetes Science and TechnologyRodriguez-Capote et al Original Article Analytical Evaluation of the Diazyme Glycated Serum Protein Assay on the Siemens ADVIA 1800: Comparison of Results Against HbA1c for Diagnosis and Management of Diabetes Journal of Diabetes Science and Technology 1–8 © 2015 Diabetes Technology Society Reprints and permissions: sagepub.com/journalsPermissions.nav DOI: 10.1177/1932296814567894 dst.sagepub.com Karina Rodriguez-Capote, MD, PhD, FCACB1,2, Kayla Tovell, BSC, MLT1, Deborah Holmes, MLT1, Janice Dayton, MLT1, and Trefor N. Higgins, BSC, MSC, FCACB1,2 Abstract Hemoglobin A1c (HbA1c) is considered the gold standard for assessment of glycemic control in diabetic patients. HbA1c is inadequate in individuals homozygous or compound heterozygous for hemoglobin variants or in conditions with an altered red blood cell turnover. In these cases glycated albumin (GA) is proposed as an alternative assay. We aimed to evaluate the analytical performance of the Diazyme glycated serum protein (GSP) assay on an automated analyzer, to establish a reference interval (RI), and to compare from a clinical perspective, GSP/GA with glycated Hb (glyHb) results. Validation studies followed the CLSI guidelines and included precision, linearity, interferences, concordance of results with glyHb, and RI calculation. GSP was analyzed on representative samples with previously ordered HbA1c and albumin from the DynaLIFEDX laboratory. Samples from patients with bisalbuminemia, hemoglobinopathies, and multiple myeloma were also included. Within-run and total imprecision was <3.0% at both levels of control, analytical sensitivity was 5.31 μmol/L, and linearity was verified from 10 to 1150 μmol/L (total allowable error of 5%). Clinical concordance between %GA and glyHb was substantial (n = 175, R2 = .91, kappa = .78, P = .167). GSP RI was 160 to 340 μmol/L or if expressed as %GA 10.5 to 17.5%. Analytical performance of the Diazyme GSP assay on the Siemens ADVIA 1800 is acceptable for clinical use. The RI obtained was higher than that suggested by the manufacturer. Keywords diabetes mellitus, glycated albumin, glycated hemoglobin, glycated protein, glycemic markers, hemoglobin A1c Hemoglobin A1c (HbA1c) is considered the gold standard for monitoring long-term glycemic control in patients with diabetes mellitus (DM). Circulating glucose nonenzymatically attaches to hemoglobin A in red blood cells (RBC) and remains attached for the RBC lifespan (~120 days). High levels of glycated Hb (glyHb) are associated with cardiovascular disease, nephropathy, retinopathy.1 HbA1c, however, is not suitable in conditions with altered red cell turnover, such as some hemoglobinopathies and thalassemias,2 chronic kidney disease (CKD),3 hemolytic anemia,4 and it is not appropriate for evaluating short-term variations in glycemic control due to the long lifespan of erythrocytes. Furthermore, the presence of some hemoglobin variants interfere either positively or negatively with the HbA1c measurement and consequently adversely affect the interpretation of HbA1c results.5,6 Serum proteins also undergo irreversible glycation. Albumin is the most abundant serum protein and it contains multiple lysine residues susceptible to glycation. It is estimated that glycated albumin (GA) concentrations account for ~90% of glycated serum proteins (GSP).7 Albumin reacts with glucose 10 times more rapidly than hemoglobin, it is not influenced by hematologic disorders and because it has a shorter half-life (~14 days), thus reflecting patient short-term glycemic status (2 to 3 weeks).7,8 Consequently, GA or GSP will most accurately reflect glycemic control in the above mentioned conditions or when monitoring the effects of 1 DynaLIFEDX Diagnostic Laboratory Services, Edmonton, AB, Canada Department of Laboratory Medicine and Pathology, University of Alberta, Edmonton, AB, Canada 2 Corresponding Author: Karina Rodriguez-Capote, MD, PhD, FCACB, DynaLIFEDx, #200, 10150102 St, Edmonton, AB, T5J 5E2, Canada. Email: [email protected] Downloaded from dst.sagepub.com at SAGE Publications on January 30, 2015 2 Journal of Diabetes Science and Technology changes in therapy in patients with diabetes or gestational diabetes.8 GA proved to have similar associations with longterm diabetes complications such as retinopathy and nephropathy as HbA1c in a case-cohort subpopulation of the Diabetes Control and Complications Trial.9 It is recommended that clinical laboratories offer alternative testing, such as GSP or GA, to assist physicians with the monitoring of glycemic control in those conditions where glycated hemoglobin measurements are inaccurate.2 In the present study, we aimed to evaluate the analytical performance of the Diazyme GSP assay on an automated analyzer (Siemens ADVIA 1800 Siemens Healthcare Diagnostics Inc., Japan/Canada), to establish a reference interval (RI) for our population and to compare from a clinical perspective, GSP/GA with HbA1c results. Material and Methods Reagents, quality control material, and calibrators from Diazyme GSP kit (Diazyme Laboratories, Poway, CA). The Diazyme GSP assay was programmed onto a Siemens Advia1800 Automated Chemistry Analyzer according to the manufacturer’s instructions. Intralipid Stock Solution was obtained from Pharmacia Cat. NDC 0338-0491-48 and Bilirubin (mixed isomers, from Sigma Cat.B-4126). Glycated hemoglobin was measured in fresh whole blood samples either on the Bio-Rad Variant II HPLC Hemoglobin Testing System (imprecision expressed as coefficient of variation, CV < 2%) for HbA1c or immunochemically using the Bayer DCA 2000+ system (CV < 2.5%) in the absence of HbA. Both methods are standardized according to the National Glycohemoglobin Standardization (NGSP). Serum protein electrophoresis (SPE) and immunofixation electrophoresis (IFE), for identifying bisalbumin variants and monoclonal proteins, was completed using the Sebia Hydrasys electrophoresis system. Total protein, albumin and glucose as well as Hemolysis, Icterus, and Lipemia/Turbidity indices were measured on the Siemens Advia 2400 automated chemistry analyzer. Samples with a representative patient distribution of HbA1c values (n = 200) were obtained from the clinical laboratory after the physician-ordered testing was completed. Samples were selected on the principle that they must have had HbA1c, total protein and albumin requested, as well as sufficient volume to complete GSP analysis. Other specimens relevant to the GSP assay validation that were found during routine testing at some stage of the evaluation period were included. These samples were from patients with bisalbuminemia (n = 32), hemoglobinopathies (n = 15), and multiple myeloma (n = 3), for a grand total of 250 samples. All samples were serum except for 5 specimens, in which plasma was used. A comparison of GSP results obtained on 5 paired serum and plasma specimens yielded no significant difference (data not show). All specimens were frozen at −70°C until tested, all the specimens were analyzed within a period of 8 months. Long-term stability at −70°C has been previously reported.10 Samples were analyzed in batches using the GSP assay procedure and 2 levels of quality control were tested at the beginning and end of each run. Since early studies, GA was expressed as a percentage of total albumin (%GA) and since glycated hemoglobin results are expressed as a percentage (HbA1c %), it is believed that %GA is more understandable than expressing GSP in μmol/L. Percentage of GA was determined using the following equation recommended by the manufacturer to convert GSP values (μmol/L) into % of GA.11 µ mol GSP * 0.182 + 1.97 L %GA = + 2.9 g total albumin ( ) dL The Diazyme GSP is an enzymatic 3-step assay. First GSP is digested into low molecular weight glycated protein fragments. Second, a fructosaminase catalyzes the oxidative reaction of the Amadori products yielding protein fragments, amino acids, glucosone, and H2O2. In the third step the H2O2 released is coupled to a colorimetric end-point reaction. The absorbance at 546-600 nm is proportional to the concentration of GSP in the sample.11 Research design and protocols were reviewed and approved by the DynaLIFEDX Institutional Review Board. To comply with DynaLIFEDX ethics protocols all patient samples were deidentified by removing protected health information from the data set. Validation Studies Within-run and total imprecision were evaluated using the Diazyme control set following the Clinical Laboratory Standards Institute (CLSI) guidelines EP15-A2.12 Limit of blank (LOB), limit of detection (LOD), and limit of quantitation (LOQ) were determined according to the CLSI EP17-A guideline.13 Evaluation of interference by hemolysis, bilirubin, and lipids was performed following the CLSI guidelines EP7A2.14 The effect of lipemia was further investigated on 14 patient samples with triglyceride (TG) values ranging from 11.0 mmol/L to greater than 32.5 mmol/L (upper limit of our TG assay). Correction of the interference was investigated by repeat testing after ultracentrifugation of the sample. In addition, we investigated 3 samples that showed interference with other chemistry tests due to the presence of M-protein. GSP was measured at room temperature and after incubating the samples at 37°C. Method Comparison The Diazyme assay was compared with the Lucica GA-L assay (Dr Little, Columbus, OH). Because that assay is specific to GA, GSP results were converted to %GA. Downloaded from dst.sagepub.com at SAGE Publications on January 30, 2015 3 Rodriguez-Capote et al Reference Interval A total of 44 samples meeting the inclusion criteria of HbA1c, glucose (either a fasting or random) and albumin within the normal range were selected. Normal distribution was determined using the Kolmogorov-Smirnov test. RI was calculated using the robust method recommended by CLSI C28-A3c guidelines for small sample size.15 Clinical Concordance Between GSP and glyHb GSP and %GA results were compared to the corresponding HbA1c or glyHb (in the absence of HbA) using ordinary least squares (OLR) and Deming regression. Clinical concordance was evaluated by creating a 2 by 2 contingency table accordingly to whether the patient would be classified as diabetic according to the 2010 American Diabetes Association position statement16 by using a level of HbA1c or glyHb ≥ 6.5% whereas for GSP and %GA we used the RIs calculated for our population. The degree of agreement was assessed by the McNemar’s test and Cohen’s kappa statistics. Statistical Analysis Data was collected and tabulated into Excel, Microsoft 2010. Statistical analysis was performed using MedCalc Statistical Software program MedCalc v14.12.0 (MedCalc Software, Mariakerke, Belgium). Results Validation Studies LOB was 5.29 μmol/L, the LOD was 7.03 μmol/L and the LOQ was 10.78 μmol/L (total allowable error <5%). Withinrun imprecision was 1.2% and 0.4% at glycated protein concentrations of 181.2 μmol/L and 684.2 μmol/L respectively. At the same concentrations the total imprecision was 2.3% and 1.2% respectively. Linearity was demonstrated from 10.78 –1149.75 μmol/L with a TEa of 5%. Patient Demographics A grand total of 250 patient samples were analyzed using the Diazyme GSP assay on the Siemens ADVIA 1800. The patient ages ranged from 13 months to 88 years with a mean of 52 years and 52% were males. For the 44 samples used for calculating the RI, 52% were males and the age extended from 15 to 80 years old, mean 45 years. The distribution of results obtained for HbA1c (glyHb) and %GA are presented in Figure 1. Reference Interval Forty-four patient samples with HbA1c, albumin and glucose within the appropriate reference ranges were used for the calculation of GSP and %GA RIs. RI for GSP was 160 Figure 1. Frequency histograms summarizing the distribution of HbA1c (glyHb) and %GA results in the study population. Normal distribution plot (mean and standard deviation of the data represented in the histogram) is superimposed over the histogram. In the absence of HbA, glyHb was obtained immunochemically. (90% CI 142.36 to 180.09) to 340 (90% CI 318.06 to 362.48) μmol/L and if expressed relative to the albumin, %GA, was 10.5% (90% CI 9.8 to 11.4) to 17.5% (90% CI 16.69 to 18.20). Figure 2 displays a statistical summary of the %GA results in the total population and the “normal” population from where the RI was derived. Interference Studies Evaluation of interference by hemolysis, bilirubin, and lipids was performed following the CLSI guidelines EP7-A2;14 results are summarized in Table 1. Effect of Lipemia Effect of high TG in patient serum was further investigated by testing 14 patient samples with TG values ranging from Downloaded from dst.sagepub.com at SAGE Publications on January 30, 2015 4 Journal of Diabetes Science and Technology and again after incubation at 37°C. Results repeated within the method CV. Correlation and Clinical Concordance With Glycated Hb Figure 2. Box and whisker plots of the %GA distribution. The central box represents the values from the 25 to 75 percentile. The middle line represents the median; the horizontal line represents the minimum and the maximum values, excluding outside and far-out values, which are displayed as separate points. Table 1. Evaluation of Interference by Hemolysis, Bilirubin, and Lipids. GSP (μmol/L) Clear Intralipid 1 (3 mmol/L) Intralipid 2 (7 mmol/L) Intralipid 3 (24 mmol/L) Clear Hemolysis 1 (Hb 2.3 g/L) Hemolysis 2 (Hb 3.3 g/L) Hemolysis 3 (Hb 14.3 g/L) Clear Icteric 1 (bilirubin 35 μmol/L) Icteric 2 (bilirubin 137 μmol/L) Icteric 3 (bilirubin 294 μmol/L) 270.73 234.49 143.31 −215.63 270.36 269.67 276.22 309.52 267.55 261.57 223.38 207.17 % diff −13.39 −47.06 −179.65 −0.25 +2.17 +14.48 −2.23 −16.51 −22.57 11.00 mmol/L to above 32.50 mmol/L. Spuriously low or absurd GSP results were noticed with values of TG around 16 mmol/L. Four samples contained enough volume to repeat testing after airfugation, and the GSP obtained matched the expected results according to HbA1c. Results are summarized in Table 2. Effect of M-protein Potential interference due to the presence of M-protein was investigated in 3 samples that showed interferences in other chemistry tests (Table 3). These specimens showed high viscosity and were identified by SPE and IFE as having M-protein, IgG kappa 22 g/L, IgG kappa 17 g/L, and IgM kappa 41 g/L. GSP was measured first at room temperature To evaluate the relationship of GSP and %GA with HbA1c (glyHb in the absence of HbA), results from all patient samples including diabetic, nondiabetic, and those with bisalbuminemia and hemoglobinopathies were plotted and analyzed by least-squares and Deming regression (Figure 3). The OLR equation for GSP versus glyHb was y(GSP) = 67.40 × (glyHb) – 102.03 (R2 = .69) and for %GA it was y(%GA) = 2.98 × (glyHb) – 1.43 (R2 = .72). Clinical concordance was evaluated by creating a 2 by 2 contingency table accordingly to whether the patient would be classified as diabetic by using these tests, glyHb >6.5% or %GA>17.5%. Negative percentage agreement was 93%, positive percentage agreement was 16%, and the overall agreement was 89%. The level of agreement between %GA and glyHb was further evaluated by using Cohen’s kappa statistics. There was substantial agreement with a κ = .78 (90% CI .68 to .87). McNemar’s test determined that there was not statistically significant difference in the proportion of patients diagnosed with DM by glyHb and % GA, P = .167. Patient characteristics of samples with discordant results between glyHb and GSP/%GA are presented in Table 4. The results are organized accordingly to the most likely clinical reason for the discrepancy, first is a patient homozygous to HbE, the next patients have decreased albumin concentrations secondary to CKD in 4 cases and to CLD in the other 3. No clinical information was available for the rest of the patients. Effect of Low Albumin Concentration and Bisalbuminemia Seventeen samples had low albumin concentrations, 7 showed discordant results between HbA1c and %GA, however only 4 of these samples were incongruent when the GA was presented as GSP. Thirty-two bisalbuminemia samples identified incidentally during serum protein electrophoresis analysis in our laboratory were included in this study. Twenty-three specimens had enough volume to perform correlation with the Lucica GA-L assay (Dr Little, Columbus, OH). The OLR equation y(Diazyme) = 0.78 × (Lucica GA-L) + 1.3 (R2 = .88, 2-tailed t test P = .14). Discussion The analytical performance of the Diazyme GSP assay is acceptable for clinical use and compares well with the performance described for this assay on the Hitachi 917 automatic clinical analyzer.11 The assay is precise, as demonstrated by Downloaded from dst.sagepub.com at SAGE Publications on January 30, 2015 5 Rodriguez-Capote et al Table 2. Effect of High Triglyceride Concentration on GSP/ %GA Measurements. ID Albumin (RI 35-50 g/L) HbA1c (RI 4.3-6.1%) 122 125 123 134 126 133 14 139 142 75 127 143 199 200 40 43 40 44 36 46 37 43 40 43 42 44 44 44 15.8 12.1 13.4 7.8 15.7 13.7 11.8 6.3 5.7 5.5 13.2 13.4 8.6 13.3 GSP GA% GSP %GA (RI 160- 340 µmol/L) (RI 10.5 to 17.5%) aerofuged aerofuged 962.75 371.03 467.48 240.52 551.12 367.84 −26.11 75.88 −33.21 164.78 −140.05 0.00 −407.19 290.11 47.2 19.1 24.7 13.3 31.3 17.9 2.1 7.4 1.9 10.3 −2.7 3.3 −13.49 15.35 428.30 683.73 398.09 478.39 21.9 31.6 19.8 23.14 TG mmol/L 11.63 (1029 mg/dL) 16.62 (1470 mg/dL) 17.14 (1517 mg/dL) 19.70 (1743 mg/dl) 22.23 (1967 mg/dL) 29.18 (2582 mg/dL) 19.72 (1745 mg/dL) 16.38 (1490 mg/dL) 22.50 (1991 mg/dL) 3.81 (337.17 mg/dL) 28.10 (2486 mg/dL) >32.50 (28.76 mg/dL) >32.5 (28.76 mg/dL) 27.20 (2407 mg/dL) Table 3. Effect of the Presence of M-protein on GSP Measurements. ID M-protein Albumin (g/L) GSP µmol/L RT 25°C GSP µmol/L 37°C Comments 121 IgM kappa 41g/L a 29 122.21 125.04 140 IgG kappa 17g/L 141 IgG kappa 22g/L 42 37 204.86 163.47 206.92 166.93 High viscosity, spurious albumin and immunoglobulin quantitation results at 25°C Spurious iron result Spurious phosphate result a Albumin was obtained after incubation at 37°C. Figure 3. Scatter diagram with results from all patient samples including diabetic, nondiabetic, and those with bisalbuminemia and hemoglobinopathies. Deming regression line (solid line), identity line (x = y, dotted line), upper limit of HbA1c RI (vertical dashdotted line), upper limit of %GA RI (horizontal dash-dotted line). the low CV% obtained at both levels of control evaluated. The assay linearity covers a broad dynamic range of normal and disease conditions. The results obtained in this study showed that the calculated GA and %GA obtained with the Diazyme method had an excellent correlation (R2 = .88) with the Lucica GA-L assay (a specific GA assay kit) with a small bias of −0.6% (Figure 4). This finding further supports the equivalence between GSP and GA. Among all interfering substances tested, lipemia was found to have the greatest effect. Hemolysis produced spuriously higher results at Hb concentrations around 14 g/L (Hem 3 index) whereas bilirubin at 135 μmol/L (Ict 2 index) led to ~16% reduction in GSP values. The manufacturer states that lipemia interferes at a TG concentration of 20 mmol/L (2000 mg/dL), however a 13% reduction was observed at TG concentration of 3 mmol/L) and GSP was apparently decreased in patient samples with TG values of 16 mmol/L (1490 mg/dL) and gave absurd values at 19 mmol/L (1745 mg/dL). Ultracentrifuging lipemic samples and assaying the supernatant effectively corrected for the interference. In our laboratory the frequency of samples with indices Hem3, Ict2 or Lip2/3 is less than 1%. In addition, 3 samples that showed interference with other chemistry tests due to the presence of M-protein were investigated. GSP results obtained at room temperature and after incubating the samples at 37°C repeated within the method imprecision. These results are not unexpected since proteins Downloaded from dst.sagepub.com at SAGE Publications on January 30, 2015 6 Journal of Diabetes Science and Technology Table 4. Patients With Discordant Results Between glyHb and GA. Patient characteristics Albumin (RI 35-50 g/L) HbA1c or glyHb (RI 4.3-6.1%) GSP (RI 160340 µmol/L) GA% (RI 10.5 to 17.5%) 42 3.4 365.31 19.2 28 8.8 159.15 13.9 29 5.8 342.72 25.1 32 8.9 224.49 16.3 34 6.6 207.63 14.6 22 4.5 242.87 23.9 24 4.5 254.28 23 31 4.2 276.28 19.8 40 7.8 266.4 15.5 43 8.6 292.81 15.8 43 41 6.6 6.4 272.65 347.79 14.9 18.8 46 7.1 321.84 16.1 43 6.8 300.11 16.1 42 7.2 295.45 16.2 42 6.6 314.96 17 Sample ID 150. M, 54 years old, HbE disease, Hb = 120 g/L, MCV = 58, fasting glucose = 8.7 mmol/L (156.8 mg/dL) Sample ID 50. M, 78 years old, CKD, IgG kappa 12 g/L, random glucose = 10.1 mmol/L (181.98 mg/dL) Sample ID 66. M, 64 years old, CKD stage 4, GFR = 32, random glucose = 5.0 mmol/L (90.09 mg/dL) Sample ID 88. M, 81 years old, CKD stage 3, random glucose = 11.7 mmol/L (210.81 mg/dL) Sample ID 118. M, 85 years old, CKD stage 3, random glucose 4.9 mmol/L (88.28 mg/dL) Sample ID 60. M, 55 years old, random glucose 9.3 mmol/L (167.56 mg/dL) CLD, bilirubin 182 µmol/L, sample icteric index 2+ Sample ID 48. M, 55 years old, random glucose 9.2 mmol/L (165.67 mg/dL), CLD, bilirubin 232 µmol/L, sample icteric index 2+ Sample ID 73. F, 67 years old, CLD, bilirubin 42 μmol/L, sample icteric index 1+ Sample ID 58. F, 70 years old, fasting glucose 6.8 mmol/L (122.52 mg/dL) Sample ID 62. F, 57 years old, random glucose 5.9 mmol/L (106.31 mg/dL) Sample ID 76. F, 55 years old, history not available Sample ID 84. F, 74 years old, fasting glucose 5.9 mmol/L (106.31 mg/dL) Sample ID 90. F, 63 years old, random glucose 7.3 mmol/L (131.53 mg/dL) Sample ID 94. F, 64 years old, random glucose 7.8 mmol/L (140.54 mg/dL) Sample ID 97. F, 68 years old, random glucose 11.1 mmol/L (200 mg/dL) Sample ID 100. F, 57 years old, random glucose 7.5 mmol/L (135.14 mg/dL) CKD, chronic kidney disease; CLD, chronic liver disease; F, female; M, male; RI, reference interval. are digested into low molecular weight glycated protein fragments during the first step of the Diazyme assay. As expected, the distribution of results obtained for HbA1c (glyHb) and %GA are very similar, since both of them are a reflection of glycemic control. The RI derived from 44 apparently normal samples (160 to 340µmol/L or 10.5% to 17.5%) is higher than the RI reported by Abidin et al for the Diazyme GSP assay (GSP,151 to 300 µmol/L and % GA,10.4 to15.7%).11 Furusyo et al reported values of %GA around 16.5% as the 90th percentile;17 what is more in concordance with our calculated RI. Discrepancies on RIs can be explained by dissimilar demographics, population age and/or ethnicity, seasonal variation.18 Our samples were collected in January, and since GA reflects short-term glycemic control, this may also be a reflection of a post-Christmas feast. In the study by Abidin et al,11 the patient population was largely of African American descent, whereas the population in the study by Furusyo et al was Japanese.17,19 We did not gather information regarding race or ethnicity. The overall agreement between the Diazyme GSP and the glyHb methods was 89% with a κ = .78 (90% CI .68 to .87). The discordant results found in 16 samples illustrate the limitations and strengths of each method for evaluating glycemic control on special populations. The first contradictory results corresponded to a sample from a patient with HbE disease. The laboratory results (glyHb by immunoassay = 3.4%, GSP = 365.31 µmol/L, %GA = 19.2%, fasting glucose = 8.7 mmol/L, Hb 120 g/L, MCV 58) are evidence for reduced erythrocyte life span and thus rendering inaccurate glyHb results. This case is a perfect candidate to be monitored by GSP or GA%. From the 17 samples with albumin concentration lower than 34 g/L, only Downloaded from dst.sagepub.com at SAGE Publications on January 30, 2015 7 Rodriguez-Capote et al Figure 4. Method comparison between the Diazyme assay (%GA calculated) and Lucica GA-L assay. (A) Least squares regression (solid line), identity line (x = y, dotted line), 95% prediction interval for the regression line (dashed line). (B) Bland–Altman plot, scatter diagram of the differences plotted against the Lucica GA-L method (reference method). 7 showed discordant results between HbA1c and %GA. Further investigation of these discordant results revealed decreased albumin secondary to CKD in 4 cases and to CLD in the other 3. These last 3 samples, however, were found in agreement with HbA1c when the comparison was made between the HbA1c and the GA result presented as GSP. This last finding could be explained since the Diazyme GSP assay measure total glycated protein and it is not specific for albumin. Nevertheless is been reported that in CLD, neither glyHb nor GA accurately reflects glycemic control.20 HbA1c also has been reported to be inaccurate in diabetic patients with advanced CKD whereas the GA assay was not impacted by stage 3 or stage 4 CKD.21 Samples ID 66 and ID 84 were classified as nondiabetics by HbA1c and as diabetics by both the GA% and GSP. These 2 patients, however, would be considered prediabetics by the American Diabetes Association guidelines16 since their HbA1c values were 5.8% and 6.4%, respectively. Regarding the other 8 incongruent results, no clinical information was available for these patients to explain the lack of agreement. It is been documented that there are discrepancies between levels of HbA1c and GA in pathologic states such as anemia, CLD, and CKD.19 Koga et al found that the levels of thyroid hormones are inversely associated with serum GA.22 Thus, patients with thyroid dysfunction may present higher or lower GA relative to HbA1c due to an increased or decreased albumin metabolism. This study was not designed for comparing the performance of glyHb and GA on special populations. We had 3 major objectives: first was to evaluate the analytical performance of the Diazyme GSP assay in the Siemens ADVIA 1800, and it was found suitable for clinical use. The second goal was to establish an RI for our population. This was accomplished by using 44 samples with “normal” HbA1c, albumin, and glucose, and the RI was calculated according CLSI guidelines C28-A3c.15 Our third objective was to compare from a clinical perspective GSP and/or %GA with glyHb results in our population. GA is recommended as an alternative testing in those conditions where HbA1c measurements are inaccurate.2 Its measurement offers the advantage that GA can be measured from serum or plasma at the same time as blood glucose, whereas a separate sample of whole blood is required for glyHb. It has the great disadvantage, however, that the testing is not standardized, whereas that for HbA1c is. The main limiting factor for routine implementation of GA in North America is the establishment of trust in the validity of the method. Earlier experiences with fructosamine have produced a negative feeling toward GA or fructosamine among ordering physicians. Abbreviations CI, confidence interval; CKD, chronic kidney disease; CLD, chronic liver disease; CLSI, Clinical Laboratory Standard Institute; CV, coefficient of variance; DGSPA, Diazyme glycated serum protein assay; DM, diabetes mellitus; GA, glycated albumin; glyHb, glycated hemoglobin; GSP, glycated serum protein; Hb, hemoglobin; IFE, immunofixation electrophoresis; NGSP, National Glycohemoglobin Standardization; OLR, ordinary least squares; RBC, red blood cells; RI, reference interval; SPE, serum protein electrophoresis; TEa, total allowable error. Acknowledgments We thank DynaLIFEDx medical technologists Pierre Bordelaeau, Janette Peralta, Daniel Fung, Pamela Rowe, Cathie-Lou Christensen, and Sheila Hladunewich for all their help and technical support. We extend our gratitude to the Dr R. Little Laboratory staff for their work on the correlation studies. Downloaded from dst.sagepub.com at SAGE Publications on January 30, 2015 8 Journal of Diabetes Science and Technology Declaration of Conflicting Interests The author(s) declared no potential conflicts of interest with respect to the research, authorship, and/or publication of this article. Funding The author(s) received no financial support for the research, authorship, and/or publication of this article. References 1.Whaley-Connell A, Sowers JR. Implications for glucose measures in the diabetes control and complications trial/epidemiology of diabetes interventions and complications study. Diabetes. 2014;63:45-47. 2. Bry L, Chen PC, Sacks DB. Effects of hemoglobin variants and chemically modified derivatives on assays for glycohemoglobin. Clin Chem. 2001;47:153-163. 3. Little RR, Rohlfing CL, Tennill AL, et al. Measurement of HBA(1c) in patients with chronic renal failure. Clin Chim Acta. 2013;418:73-76. 4. Koga M, Hashimoto K, Murai J, et al. Usefulness of glycated albumin as an indicator of glycemic control status in patients with hemolytic anemia. Clin Chim Acta. 2011;412:253-257. 5. Little RR, Rohlfing CL, Hanson S, et al. Effects of hemoglobin (hb) e and hbd traits on measurements of glycated hb (HbA1c) by 23 methods. Clin Chem. 2008;54:1277-1282. 6.Little RR, Roberts WL. A review of variant hemoglobins interfering with hemoglobin a1c measurement. J Diabetes Sci Technol. 2009;3:446-451. 7.Arasteh A, Farahi S, Habibi-Rezaei M, Moosavi-Movahedi AA. Glycated albumin: an overview of the in vitro models of an in vivo potential disease marker. J Diabetes Metab Disord. 2014;13:49. 8.Koga M. Glycated albumin; clinical usefulness. Clin Chim Acta. 2014;433:96-104. 9. Nathan DM, McGee P, Steffes MW, Lachin JM. Relationship of glycated albumin to blood glucose and HbA1c values and to retinopathy, nephropathy, and cardiovascular outcomes in the DCCT/EDIC study. Diabetes. 2014;63:282-290. 10. Nathan DM, Steffes MW, Sun W, Rynders GP, Lachin JM. Determining stability of stored samples retrospectively: the validation of glycated albumin. Clin Chem. 2011;57:286-290. 11. Abidin D, Liu L, Dou C, Datta A, Yuan C. An improved enzymatic assay for glycated serum protein. Analytical Methods. 2013;5:9. 12. CLSI. User Verification of Performance for Precision and Trueness; Approved Guideline. CLSI document ep15-a2. 2nd ed. Wayne, PA: CLSI; 2005. 13. CLSI. Protocols for Determination of Limits of Detection and Limits of Quantitation, Approved Guideline. CLSI document ep17-a. Wayne, PA: CLSI; 2004. 14. CLSI. Interference Testing in Clinical Chemistry; Approved Guideline. CLSI document ep7-a2. 2nd ed. Wayne, PA: CLSI; 2005. 15. CLSI. Defining, Establishing, and Verifying Reference Intervals in the Clinical Laboratory; Approved Guideline. CLSI document ep28-a3c. 3rd ed. Wayne, PA: CLSI; 2008. 16. American Diabetes Association. Diagnosis and classification of diabetes mellitus. Diabetes Care. 2010;33(suppl 1):S62-S69. 17. Furusyo N, Koga T, Ai M, et al. Utility of glycated albumin for the diagnosis of diabetes mellitus in a Japanese population study: results from the Kyushu and Okinawa Population Study (KOPS). Diabetologia. 2011;54:3028-3036. 18. Higgins T, Saw S, Sikaris K, et al. Seasonal variation in hemoglobin A1c: Is it the same in both hemispheres? J Diabetes Sci Technol. 2009;3:668-671. 19. Furusyo N, Hayashi J. Glycated albumin and diabetes mellitus. Biochimica et Biophysica Acta. 2013;1830:5509-5514. 20. Bando Y, Kanehara H, Toya D, Tanaka N, Kasayama S, Koga M. Association of serum glycated albumin to haemoglobin A1c ratio with hepatic function tests in patients with chronic liver disease. Ann Clin Biochem. 2009;46:368-372. 21.Freedman BI, Shihabi ZK, Andries L, et al. Relationship between assays of glycemia in diabetic subjects with advanced chronic kidney disease. Am J Nephrol. 2010;31:375-379. 22. Koga M, Murai J, Saito H, Matsumoto S, Kasayama S. Effects of thyroid hormone on serum glycated albumin levels: study on non-diabetic subjects. Diabetes Res Clin Pract. 2009;84: 163-167. Downloaded from dst.sagepub.com at SAGE Publications on January 30, 2015

© Copyright 2026