
In Multiple Myeloma, Clonotypic B Lymphocytes Are
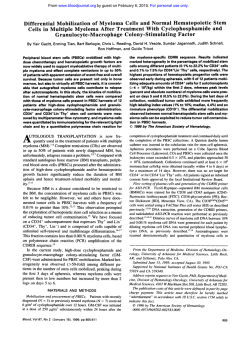
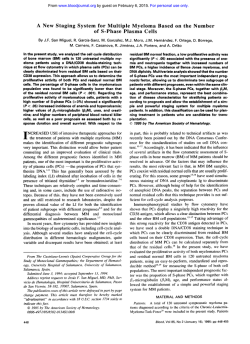
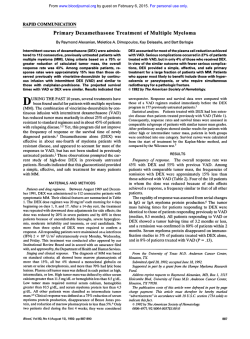
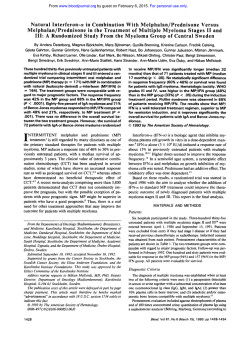
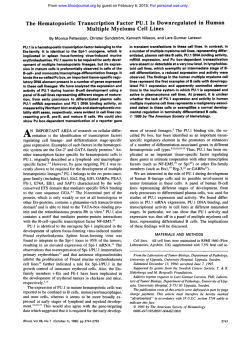
From www.bloodjournal.org by guest on February 6, 2015. For personal use only.
In Multiple Myeloma, Clonotypic B Lymphocytes Are Detectable
Among CD19+ Peripheral Blood Cells Expressing CD38, CD56,
and Monotypic Ig Light Chain
By P. Leif Bergsagel, Anna Masellis Smith, Agnieszka Szczepek, Michael J. Mant,
Andrew R. Belch, and Linda M. Pilarski
Multiple myeloma (MM) is characterized by a plasma cell
infiltrate of the bone marrow (BM). However, late-stage
monotypic B cells have been detected in the blood. This
work analyzes the effects of clinicaltreatment on late
stage
CD19+ B cells present in 752 blood samples from 152 MM
patients. MM patients have 2 t o 8 times as many circulating
CD19’ cells as do normal donors. Analysis of the Ig heavy
chain (IgH) gene rearrangements using polymerase chain
reaction indicates that the CD19+ population includes cells
sharing the same clonotypic CDR3 region as is detected in
the BM plasma cells, for patients analyzed during chemotherapy or in relapse. They are also monotypic as defined
by their cytoplasmic or surface expression of lgK or A light
chain. The light chain restriction is thesame as that of the
BM plasma cells. Individual patients observed over 1- t o 2year periods exhibit considerable variation in the number of
B cells present in blood; this number does not correlate with
the concentration of serum monoclonal Ig. The monoclonal
blood CD19+ cells are not eliminated byany of the chemotherapy regimensanalyzed and remain at high
levels during
transient remissions. Patients in the progressive phase of
disease or in relapse have significantly higher numbers of B
cells than do patients in transient remission or untreated
patients. During periods when the quantityof blood B cells
approaches normal, phenotypically their qualityis highly abnormal, with physical and phenotypic heterogeneity. Most
B cells express CD45RO. a high density of CD38, and CD56
characteristic of late-stage B or pre-plasma cells. CD38h’
blood B cells had a cyclical presence. We conclude that
monoclonal B cells in the bloodof myeloma patient populations include drug-resistant reservoirs of clonotypic cells
that may underlie relapse.
0 7995 by The American Society of Hematology.
M
s i o n ~ . ’It~has
~ been suggested that the malignant stem cells
in myeloma may
be immature
that colonize hernatopoietic microenvironments, including the
Accumulating evidence implicates a circulating late-stage CD 19+
B cell in myeloma 10~’2-’1 and clonotypic rearrangements as
defined by the BM plasma cells in myeloma have been reported among blood lympho~ytes.”~’~
A preliminary report
indicates clonotypic sequences among purified CD19+ peripheral blood mononuclear cells (PBMCs).” Analysis of
CD45 isoform expression on CD19+ cells in the blood and
BM of myeloma patients indicates a heterogeneous continuously differentiating B lineage,’0,’2in contrast to other Bcell malignancies such as B-cell chronic lymphocytic leukemia (B-CLL), lymphoma, or hairy cell l e ~ k e m i a . ’ ~ ~ ’ ~ ~ ’ ~
Monoclonal rearrangements of the Ig heavy chain locus are
detectable in blood from a proportion of patients 12.18,27 and
mRNA encoding either K or A butnotboth
light chains
was detectable in myeloma PBMCS.’~A large proportion
ofCD19’ cells in myeloma PBMCs have extensive DNA
aneuploidy.I5,l6Unlike plasma cells or BM-localized B cells,
and consistent with expectations for an invasive cell type, the
monoclonal blood CD19+ cells express adhesion molecules,
including CD1 lb,I3 a2p1, and a6pl integrin receptors for
extracellular matrix,I4 selectins, and CD44.I’
For nearly all patients with myeloma, circulating CD19’
cells express functional multidrug transporter, p-glycoprotein 170.’5.21.28
The numberand phenotypic properties of
CD19’ cells intheblood of myeloma patients, andtheir
relationship to malignant plasma cells, were analyzed as a
function of chemotherapeutic treatment and course of disease. We find clonotypic IgH rearrangements among CD19’
cells expressing cytoplasmic Ig at diagnosis, during therapy and off treatment. Thus, CD19+ B cells persist despite
chemotherapy and, for those patients with apparently normal numbers, CD19+cellsin blood are phenotypically
abnormal.
ULTIPLE MYELOMA (MM) is a malignancy of the
immune system characterized by accumulations of
plasma cells in the bone marrow (BM), usually by a high
concentration of monoclonal Ig in serum or urine and lytic
bone lesions arising from osteolytic activity of plasma cellactivated osteoclasts.’ Although many patients respond to
chemotherapy, nearly all eventually relapse and become refractory to further treatment.’ The measure of response to
chemotherapy is a reduction in BM plasma cells, loss of the
monoclonal Ig peak, and relief from bone pain and other
symptoms. However, even though plasma cells are apparently eradicated from the BM by therapy and
monoclonal
Ig becomes undetectable by conventional assays, for nearly
all patients the disease persists in an apparently cryptic com~ a r t r n e n t . ~The
’ ~ mean survival postdiagnosis is approximately 3 year^.'.^.^
Although MM is a cancer of the BM, the therapy-induced
loss of BM plasma cells does not lead to long-term remis-
From the Departments of Immunology and Oncology, University
of Alberta, Edmonton, Alberta, Canada; and the Navy Medical Oncology Branch, National Cancer Institute, Bethesda, MD.
Submitted February 28, 1994; accepted September 27, 1994.
Supported by the National Cancer Institute of Canada with funds
from the Canadian CancerSociety, and by The AlbertaCancer
Board Research Initiatives Program. A.M.S. is the recipient of a
fellowship from the Leukemia ResearchSociety and the Alberta
Heritage Foundation for Medical Research.
Address reprint requests to Linda M. Pilarski, PhD, Department
of Immunology, University of Alberta, Edmonton, AB T6G2H7, Canada.
The publication costsof this article were defrayedin part by page
chargepayment. This article must therefore be hereby marked
“advertisement” in accordance with 18 U.S.C. section 1734 solely to
indicate this fact.
0 1995 by The American Society of Hematology.
Oa)6-4971/95/8502-a)28$3.00/0
436
Blood, Vol 85, No 2 (January 15). 1995: pp 436-447
From www.bloodjournal.org by guest on February 6, 2015. For personal use only.
CLONOTYPICBCELLS
431
IN MYELOMA
100
80
S
0
0
.-P
60
U)
U)
g
:*
;*.
a.
40
5a
U-
0
20
c
t
E
1
a
28*2
31*1'
397
n = 98
31*1
257
I
Untreated
Treated
Off Treatment
Treatment Status of Myeloma Patients
Fig 1. CD19' B cells in blood persist despite chemotherapy. Each
symbol represents a single patient sample. The percentage
of C D W
cells actually detectedin PBMCs is presented here, in preference to
absolute valuesin blood, becausethe percentage isa direct, unmanipulated data point.* P = .07 as compared with untreated patients.
MATERIALS AND METHODS
Patients. Patients with MM were observed for periods of up to
2 years, at monthly intervals, after informed consent was obtained.
A total of 752 blood samples from 152 patients were analyzed for
some or all of the parameters described in the Results. The majority
of patients in all groups received a complete phenotypic analysis. A
total of 14 patients were analyzed by CDR3 polymerase chain reaction (PCR). Of these, only 8 showed a single major IgH rearrangement among the purified BM plasma cells, consistent with
other reports?3 which allowed identification ofa clonotypic rearrangement for comparison with IgH rearrangements in purified
blood B cells. Phenotypic information was maintained in a set of
linked databases for clinical and research data using dBASEIV (Borland, Scotts Valley, CA). The patients included 50 untreated (at
diagnosis), 43 on melphaladprednisone (MiP), 42 on vincristine/
adriamyciddexamethasone (VAD), 9 on biologic response modifiers
or IFN plus interleukin-2 (IL-2), and 68 off chemointerferon (IFN)
therapy. Because most patients were observed for prolonged periods
of time, a single patient usually appears in several of these groups.
Patients on intermittent chemotherapy were studied at least 4 weeks
after their latest treatment. The definition of clinical parameters was
as described by Durie and Salmon.' Seventeen normal, healthy volunteers were analyzed at single time points as controls. Patients
were designated as off treatment 2 months after their last cycle of
chemotherapy. However, most patients in this category had been off
treatment for longer periods of time.
Purijication ofPBMCs. Venous blood samples were drawn into
heparinized vacutainer tubes and the PBMCs were isolated on a
Ficoll-Paque (Pharmacia, Dorval, Quebec, Canada) density gradient.
Cells harvested from the interface were washed twice inRPM1
(GIBCO, Grand Island, NY) and resuspended in phosphate-buffered
saline, including 2% fetal calf serum (HyClone Labs, Logan, UT).
Methods for depletion of adherent cells were carefully avoided, because the abnormal CD19+ cells in myeloma have adherent properties and are depleted by such procedures.'*
Antibodies. IgGlFITC,IgGlPE, IgGZFITC, and IgG2PE were
from Southern Biotech (Birmingham, AL). LeulSPE (CDllb),
Leul7PE (CD38), J5FITC (CDlO), and HNK-l (CD56) were purchased from Becton Dickinson (San Jose., CA). From Coulter (Hialeah, FL), we purchased B4-FITC (CD19) and B1-RD1 (CD20).
Monoclonal antibody (MoAb) FMC63 (CD19) was from H. Z ~ l a ? ~
UCHLl (CD45RO) from P. Beverley,Mand PCA-1 from K. Anderson." For detection of circulating CD19' B cells in the blood of
myeloma patients, either FMC63 or the commercially available B4
MoAb (Coulter) gave comparable results, but these cells were not
reliably detected with Leu-l2 (Becton Dickinson) in our hands.
However, others have reported large numbers of CD19+ cells in
PBMCs from myeloma patients using Le11-12.~'They were not reliably detected with phycoerythnn (PE) conjugates of CD19 MoAbs,
probably reflecting steric hindrance from these bulky phycobiliproteins. MoAbs to Ig light chain used in immunohistochemistry were
from the American Type Culture Collection (Rockville, MD); those
used for immunofluorescence (IF) were F(ab), fragments conjugated
to fluorescein isothiocyanate (Southern Biotech). Goat antihuman
10-PE and goat antimouse Ig-PE were from Southern Biotech.
Two-color ana' three-colorimmunojluorescence. A two-color
fluorescence staining procedure was used for the study of surface
marker expression as previously
PBMCs were incubated with antibodies to be detected by indirect IF (isotype controls,
Table 1. Circulating B Cells in Blood Do Not Decrease in Number After Chemotherapy
Treatment
Percentage of
CD19' in PBMCs
Percentage of
CD19'
XlO-'/L
of Blood
28 2 2.8
300.30
2 1.9
36 2 1.5t
33 2 3.3
28 2 1.6
6 2 1
0.44 2 0.06
2 0.02*
0.43 2 0.03
0.33 -C 0.03*
0.32 -t0.15
0.03'
0.06-0.24
Small B
Cells xlO-'R of Blood
Cells
Large B
xlO-'/L of Blood
mlg
(glLI
0.26 42
t 0.04
t
280.02
0.34 24
t 0.04
0.19 2 0.01
0.23 t 0.02
1.82
2 4.9
2 1.9t
t 3t
29 2 0.38*
29 t 2.3t
Lymphocytes
x lo-% of Blood
~~~
Untreated
MIP
VAD
IFNIIL-2
Off Tr
Normal
0.20
0.12
0.07
0.14
0.04
2
0.20.01'
2 0.02$
2 0.03
2 0.02
-C
2 0.17
0.98 -t 0.06t
1.38 -t 0.11
0.81 2 O.06t
1.19 -t 0.08t
1.0-4.0
Values are the mean 2 SE. Unmarked values are not significantlydifferent from the untreated values.The number ofCD19+ cells in blood was
calculated as the (white blood count IWBCI x % lymphocytes x %CD19+ in PBMCs). The number of lymphocytes was(WBC x % lymphocytes).
Abbreviation: Off Tr, chemotherapy discontinued.
* P S .07 as compared with untreated patients.
t P S .03 as compared with untreated values.
P = ,003 as compared with untreated values.
*
From www.bloodjournal.org by guest on February 6, 2015. For personal use only.
BERGSAGEL
438
A
l
1
1
AL
.Id
-MR1
I n t e n s i t y of fluorescence
B
"
B Cells
lg Expression: Log Fluorescence
600bp
500bp
400bp
300bp
200bp
1 OObp
Fig 2. Expression of CD19 on myelomaPBMCs and expression of
CD20 on theCD19' subset of PBMCs. (A) PBMCs were stained with
CDl9-FITC and CD2O-RD1 (-1
or an isotype-matched lgG2 MoAB
(-4. Row 1 is the staining by CD19-FITC and the marker bar (R11
indicates the cells considered t o be positive for CD19 and the electronic gate definingCD19' cells. Row 2 is the staining byCD2O-RDl
on PBMCs gated for CD19(R1). Ungated (CD19) and gated (CD201
histograms are from 3 representative patients. Staining by FMC63FlTC and by BCFITC was nearly identical. (B) RT-PCR analysis using
CD19 primers t o amplify mRNA from freshly isolated and sorted B
or T cells from the same patient. PCR was performed on RNA from
10' cells. (C) CD19+ PBMCs express lg. Files were gated for CD19'
cells as indicated in the top panel and the expression of lg plotted
as histogram. (...l Staining with goat antimouse Ig-PE (control).
(-)
Staining of CD19' PBMCs with goat antihuman Ig-PE. (- .. -1
Staining of plasma cells with goat antihuman lg. The values within
each peak indicate the proportionof gated CDl9+ PBMCs or plasma
cells with that intensity of staining. Similar results were obtained
with PBMCs from 10 other patients; in all 10, the proportion of B
cells expressing detectable l g was 80% or higher.
From www.bloodjournal.org by guest on February 6, 2015. For personal use only.
439
CLONOTYPIC B CELLS IN MYELOMA
50
T
40
U
g
30
a
+
2
:: 20
K
10
0
Unt
Prog
Relapse
> l Remission
Relapse
Fig 3. Patients who have relapsed one
or more times have the
highest proportion ofCD19* B cells in blood. Prog, progressing. As
compared with untreated values, all relapsed patients hadP = .W1,
tho- relapad more than l time had P = .ooo5, andthoseprogressing hadP = .03. Patients in transient remission were not significantly different from untreated patients.
UCHLl, or PCA-l), washed, blocked with mouse Ig, and stained
with a direct conjugate of B4-FITC or FMC63FITC. A double-direct
IF procedure was used for staining of cells with PE-conjugated
isotype controls, BlRDl, LeulSPE, or Leul7PE and FMC63FITC.
Stained cells were washed twice and fixed in 1% formalin for flow
cytometric analysis.
Analysis of IF. Samples were analyzed using a FACScan (Becton Dickinson). Red blood cells and dead cells were excluded by
electronic gating on forward angle light scatter and files of 10,000
to 20,000 cells were collected. Files were electronically gated for
CD19+ cells and the expression of the second MoAb was plotted as
a histogram. In all cases, staining with a specific MoAb was compared with its appropriate isotype-specific control, with identical
electronic gates for B-cell subsets. To maintain a consistent evaluation of the intensity of staining among different patients, a precise
definition was used. In all cases, on a log scale, the intensity of
staining was categorized as moderate (between 10' and 10') or high
(staining greater than 10').
CD19' cells were also evaluated for their physical properties as
measured by forward (FALS) and side angle scatter (SSc), as previously des~ribed.'~.'~,'~
Cells designated as small were those with
SSc less than channel 400, whereas those designated as large had
SSc greater than channel 400 on a linear scale. For most patients,
FALS was also increased among the large cells.
Som'ng. SOmng was on an ELITE flow cytometer (coulter). PBMCs
were stained with FMC63-FI'K or CDllb-PE, followed by sorting for
staining greater than the isotype-matched control. Sorted B cells were
r
e
p lysates for DNA analysis or
concentmted, counted,and used to p
cells
cytospinsforimmunohistochemistry. PCA-I+ cIgh'BMplasma
were sorted for PCR analysis of CDR3 clonotypicm g e m e n t s .
Ig heavy chain gene analysis. PCRwasused to amplify VDJ
rearrangements from blood B cells sorted for expression of CD19
and, in some cases, sorted into a CD19 small subset and a CD19
large subset. For those patients tested, the majority (80% to 100%)
of CD19+ B cells expressed detectable cytoplasmic Ig. BM plasma
cells were purified by sorting for cells which coexpressed the plasma
cell marker PCA-l and a high density of cytoplasmic Ig (cIg).
IgH$ngerprinting. Whole cell lysates of the sorted cell populations were prepared22and resuspended at a concentration of 1,OOO
cells/pL. One microliter of the cell lysate was used in a 25-pL PCR
reaction in 10 mmoVL Tris, pH8.3, 50 mmoVLKCI, 2 mmoVL
MgC12, 200 pmoVL dNTP, 0.025 U/pL Taq polymerase (Amplitaq;
Perkin Elmer, Branchburg, NJ), 0.2pmoVL FR2a (codons 42-47
TATGAATTCGGAAAGGGCCTGGAGTGG),and 0.2 pmoVL JH1
(codons 114-109 ACGGGATCCACCTGAGGAGACGGTGACC),
with cycling 25 times between 94°C for 30 minutes, 52°C for 30
minutes, and 72°C for 30 minutes. From this reaction, 0.5 pL was
placed into a second-stage PCR in a 5-pL reaction performed as
above, with the oligonucleotides being 1 pmoVL FR2a and 0.1 pmoV
L 32PATP end-labeled JH2 (codons 110-103 ACGGGATCCGTGACCAGGGTNCC'ITGGCCCCAG), with cycling for 20 times. Two
microliters of this reaction was electrophoresed on a 6% denaturing
polyacrylamide urea gel and the gel was exposed to XAR film(Eastman Kodak, Rochester, NY).
Sequencing. The CDR3 PCR products were amplified as above
and purified from an agarose gel using Promega Magic PCR Preps
(Promega, Madison, WI). The nucleotide sequence was determined
using end-labeled oligonucleotides FR2 and JH2 with Promega's
fmol PCR sequencing kit (Promega). Allele-specific oligonucleotides AS0 were designed based on the nucleotide sequence and
synthesized by Genosys Biotechnologies Inc. (The Woodlands, TX).
CDR3 PCR and AS0 Southern blot. Using the same conditions
as above, 1 pL of the cell lysate was amplified with oligos FR2a and
JH1 for 30 cycles. From this reaction, 0.1 pL was placed ina secondstage PCR under the same conditions, with oligos FR2b [codons 6469 ATGGAATTCAGGGC(C/A)G(A/G)(T/G)TCACCAT]and JH2
for 30 cycles. Ten microliters of this reaction was electrophoresedon
a 4% Nusieve GTG agarose gel containing ethidium bromide. The
DNAwastransferred to a Nylon filter by Southern blotting. The
Nylon filters were hybridized tothe patient specific end-labeledAS0
in 5X SSC, 1% sodium dodecyl sulfate (SDS), and 20% formarnide
at 42°C for 4 hours, and then washed three times in 5X SSC, 1%
SDS at 22°C for 5 minutes and once at 42°C for 5 minutes. The filter
was exposed to XAR film for 2 hours at -70°C.
Immunohistochemistry. Cytospins were air-dried, fixedin acetone, and stained with Wright's stain for morphologic evaluation,
followed by staining with anti-^ or anti-A to determine light chain
expression. Cells were incubated with primary antibody for 60
minutes at room temperature followed by two washes in phosphatebuffered saline (PBS). Horseradish peroxidase conjugated to goat
antimouse Ig was added for a further 15 minutes of incubation at
room temperature. Freshly prepared DAB (3-3'diaminobenzidinetetrachloride; Sigma, St Louis, MO) in PBS containing 0.008% hydrogen peroxide was added to cells for 4 to 5 minutes and the
degree of staining was determined by comparison to isotype-matched
controls.
Reverse
transcriptase-PCR
(RT-PCR)
for
CD19
mRNA.
Based on the sequence of the CD19 gene,33.34primers for RTPCR were designed by and obtained from Dr Tom Tedder (Duke
University, Durham, NC). Using Trizol according to the manufacturer'sdirections(GIBCO,Burlington,Ontario,Canada),
RNA
was prepared from populations of sorted B cells and from sorted
T cells of the same patient, collected at the same time in a double
immunofluorescence sort, to serve as a negativecontrol. After
purification, 1 pg of RNA was reverse transcribed using SuperScript reverse transcriptase (GIBCO BRL) and universal primer
oligodT,, (BoehringerMannheim,Laval,
Quebec, Canada)ac-
From www.bloodjournal.org by guest on February 6, 2015. For personal use only.
BERGSAGELET AL
440
BM
BL
BM
BL
BM
BL
PCA1+
CD19+
PCA1+
CD19+
PCA1+
CD19+
large
small
large
small
-p
J
Fig 4. Clonotypic IgH rearrangements defined by BM plasma cells characterize blood B cells in myeloma: IgH fingerprint analysis. CDR3
VDJ rearrangements were analyzed by PCR on 3patients. Hemi-nested PCR was performedas described using a radiolabeled JH2 primer and
run on denaturing6% acrylamide gel. The samples of BM and blood
(BL) were sorted for the indicated
populations. (Left panel) Patient no. 1,
off treatment (tr) relapse. This patient was diagnosed in early 1992 and responded to M/P followed by IFN maintenance therapy. Massive
relapse occurred in late 1993, at which time the
BL and BMsamples in the figure weretaken. Sixty-five percent of total BM were
PCA-l' cells
and 24% of PBMCs were CD19'. ASO-PCR confirmed the clonotypic band for this patient. (Middle
panel) Patient no. 2, t r after relapse. This
patient was diagnosed in early 1992, responded t o MIP, and relapsed in late 1993. M/P hadbeen reinitiated for 1 month with noresponse at
the time this
sample was taken. Sixty-three percent of BM werePCA-l' and 20% of PBMCs were CD19'. The single band detectedamong the
large B cells for this patient was confirmed t o be clonotypic with ASO-PCR. (Right panel) Patient no. 3,Tr, after relapse. The patient was
diagnosed in late 1988, responded t o M/P, and remained on M/P plus IFN in a stable condition until late 1993, at which time the disease
escaped plateau phase. M/P hadbeen reinitiated for 3 months
with symptomatic improvement at the
time these samples were taken. Ninetythree percent of BM werePCA-1' and 10% of PBMCs were CD19'. The clonotypic band was included among the
ladder of bands detected for
this patient as confirmed by probingwith the AS0 (Fig 5).
cording to the manufacturer's instructions. Briefly, RNA was incubated with the primer for 10 hours at 70°C and chilled on ice
and the buffer, DTT, and enzyme were added. The reaction tube
was placed at 40°C for 1 hour followed by heating for 3 hours at
100°C. PCR was performed under standard conditions. Briefly, 2
pL of cDNA from the reverse transcriptase reaction was added
to 48pL of PCR buffer (GIBCO BRL; 1.5 mmol/L MgCL2)mixed
with primers for CD19 crossing two introns (a gift of Dr Tom
Tedder) and 1 Ulreaction tube of TAQ polymerase (GIBCO BRL):
35 cycles of 30 seconds at94°C. 30 seconds at55°C. and 45
seconds at 72°C wasperformed on the PCR Thermal Cycler Perkin
Elmer 9600. PCR product was analyzed on a 2% agarose gel in
Tris/boric acid/EDTA buffer, soaked in ethidium bromide, and
visualized under UV light.
Sfaristical evaluation. Values from patients on chemotherapy
or off treatment were compared with those from untreated patients
using a two-tailed t-test.
RESULTS
CD19+ B cells persist in blood despite chemotherapy.
Figure 1 shows the distribution of CD19' cells in individual
PBMCs as a function of treatment status. There is a broad
range of values in all treatment categories andthemean
values are comparable for all groups (Table l). Although for
any given patient an increased percentage of CD19' cells is
always found at some time points throughout the disease
progression, the numerical value is not always abnormal, as
indicated by the values below 15%, the normal range'' (Fig
From www.bloodjournal.org by guest on February 6, 2015. For personal use only.
CLONONPIC B CELLS IN MYELOMA
441
Table 2. Nucleotide Sequence of IgH VDJ Rearrangements
Amplified From BM
FR3
COR3
JH
1 TGTACG ..GGGGGCAACTT .............. CTGGGGC
2 TGTGTGAGA.TGGGTCAGAGGGGTCAATCCTCCCTTCAT.TGAAGACTTCCAGAA
CTGGGGC
3 TGTACGAGA.GATCAAGATGACTACGGTGACTACGGGAC ...CTTTAACTC CTGGGGC
CODONS 92
104
The sequence is given for the patients referred to in Figs 4 and 5. The ASOs
were synthesized based on the complement of the regions underscored.
l). However, as will be detailed later, these quantitatively
normal B cells are phenotypically abnormal. In all treatment
categories, the majority of samples included an abnormally
high proportion of CD19' B cells. Figure 2 (top panel, row
1) shows the CD19 MoAb staining of myeloma PBMCs and
the marker bar indicates those cells recorded in Fig 1. These
CD19' PBMCs expressed CD19 mRNA, as detected by RTPCR analysis of sorted CD19' B cells, the absence of CD19
mRNA from T cells sorted from the same PBMCs patient
samples (Fig 2, bottom left), and the expression of Ig by the
CD19' population (Fig 2, bottom right). PBMCs gated for
CD19 expression coexpress CD20, including CD19'
CD20hi andCD19' CD20'"'md subpopulations (Fig 2, top
panel, row 2).
Table 1 gives the absolute number of CD 19' cells in blood
and the mean percentage of lymphocytes. The values of
CD19' B cells in PBMCs range from 0.33 to 0.63 X 10⁹/L
of blood. These values are above the normal range for B
cells, even though many patients are lymphopenic. Untreated
patients at diagnosis have 0.44 X lo9 B cells/L of blood,
with 24% of lymphocytes in blood being CD19' cells (Table
1, line 1). Patients treated with M P , on second-line therapy
with biologic response modifiersIFN andor L-2, or off
therapy have the lowest absolute number of blood B cells
(0.3 to 0.33 X 10⁹/L) (line 6).
1
CD19+
CD19+
3
2
Unrelated
Unsorted
Previous workhas indicated that monoclonal B cells in
the blood of nearly all myeloma patients can be subdivided
into a set with low SSc (designated "small") and a set with
high SSc (designated "large") that is not found in normal
donors. The subset of small B cells is phenotypically heterogeneous.'n.'2.'3)The large PBMC B cells are a relatively
homogeneous
In untreated patients, approximately half of the circulating B cells are small B cells
and half are large late-stage B cells (Table l , columns 4 and
5 ) . For patients treated with MiP or with VAD, the number
of small B cells was significantly decreased as compared
with untreated patients ( P c .07). The number of large B
cells did not change with treatment. The B cells in patients
treated with biologic response modifiers ( I F N or IFNAL-2)
or patients off treatment were not significantly different from
those in untreated patients.
The number of circulating B cells was compared among
patient groups defined by their disease status (Fig 3). A
significant difference in the percentage of CD19' B cells in
PRMCs was detectable, with the lowest values among those
patients in transient remission and the highest in patients
with progressive disease or those who have had one or more
relapses.
CD19' cells in blood of myeloma patients express clonotypic IgH VDJ rearrangements. Hemi-nestedPCRwas
used to compare IgH rearrangements in sorted populations
of blood CD19+ cells with sorted PCA-l' plasma cells from
the BM. PCR using consensus oligonucleotides to the IgH
variable region framework 2 (FR2) and the IgH J segment
(JH) genes amplifies rearranged heavy chain genes, but not
germline heavy chain genes (because germline FR2 and JH
are too distant to be amplified). Because of different D gene
lengths, and N region diversity, the length of the VDJ rearrangements amplified varies within a range of about 48
nucleotides, changing in increments of three nucleotides (be-
BM Unrelated
PCA1+
CD19+
CD19+
CD19+
BM
Unrelated
Unsorted CD19+
CD19+
- 232 bp
- 192bp
- 118 bp
_.
. .
- 232 bp
- 192 bp
- 118 bp
Fig 5. Clonotypic IgH rearrangements defined by BM plasma cells characterize blood B cells in myeloma: nested CDR3-PCR probed with
an ASO. Forthe same 3 patients as in Fig 4, although with samples obtained at a later date, the VDJ rearrangementswere amplified by nested
CDR3-PCR and electrophoresed on an ethidium bromide stained agarose gel (top panels). These rearrangementswere transferred to a nylon
filter by Southern blotting, probed under stringent conditions with an end-labeled ASO, unique for each patient, and exposed to XAR film
(bottom panels). For patient no. 2, CD19+ B cells were purified from blood at two time points after the sample analyzed in Fig 4. For all 3
patients, samples were collected and subjected to flow cytometric sorting at approximately 2- to 3-month intervals.
From www.bloodjournal.org by guest on February 6, 2015. For personal use only.
442
Fig 6. Circulating CDl9+ B cells express lg light chain. Cytospins
were made from PBMC B cells of a patient with IgGK myeloma. Slides
were stained with either anti-K or anti-AF(ab), fragments conjugated
to FITC and examined usingconfocalmicroscopy.
B cells were
scanned at 1,400~power at 512 x 512 resolution. The left image is
of small B cells with predominantly surface staining and low cytoplasmic staining with anti-K. The right image is of a large B cell with
strong cytoplasmic staining forK light chain. A variety of gradations
of staining patterns between these two extremes were always detected among the CD19' blood B cells. No staining was detectable
for cells from this patient stained with anti-A.
cause the majority of rearrangements preserve an intact open
reading frame). When electrophoresed on a high resolution
sequencing gel, the rearrangements present in a polyclonal
B-cell population thus appear as a ladder of approximately
16 bands, spanning 48 nucleotides. For a monoclonal B-cell
population, such as purified BM plasma cells from a patient
with myeloma, only a single rearrangement should be ampli-
BERGSAGEL ET AL
fied. In 8 patients, we amplified a unique rearrangement from
their BM plasma cells, and we examined their blood CD19'
cells by Ig fingerprinting.
Figure 4 shows the result of hemi-nested IgH fingerprinting analysis in blood B cells and BM plasma cells for 3 of
the 8 patients, chosen to reflect the heterogeneity in the
amplification patterns observed. From the blood CD19' cells
of the patient in the left panel, a single rearrangement of
exactly the same size (222 bp) as that in the BM was amplified. The rearrangement amplified from the peripheral blood
was sequenced and was identical to that in the BM, without
evidence of somatic mutation. This is evidence of both clonotypic B cells in the CD19+ population, and a relative
absence of other B cells (although all the cells in this population expressed Ig; Fig 2). This does not necessarily mean a
complete absence of nonclonotypic B cells, because the
hemi-nested PCR may greatly amplify small differences. We
have not determined at what level a clonal rearrangement,
in the presence of polyclonal rearrangements, will be amplified as a single band without evidence of a polyclonal ladder.
For the patient in the middle panel, blood B cells were sorted
into the small and large subsets: from the large B cells, only
the clonotypic rearrangement (258 bp) was amplified; from
the small B cells, a polyclonal ladder of rearrangements was
amplified. For the patient on the right panel, many rearrangements were amplified from both the small and large
B-cell subsets. Although a rearrangement(s) of the same size
as the clonotypic one (252 bp) is evident in both populations,
in the presence of so many other rearrangements, one cannot
conclude that there are clonotypic cells in these populations.
Therefore, the rearrangements amplified from the BM were
sequenced and ASOs were synthesized (Table 2).
To confirm the presence of patient-specific clonal rearrangements in the blood CD19' cells, all of therearrangements in a sample were amplified using nested CDR3
PCR (Fig 5). The top panel shows an ethidium bromidestained agarose gel of the nested PCRs from the same patients as in Fig 4, from samples collected at a later time
point. This demonstrates that there are IgH rearrangements
in all samples. To confirm thatthe amplified product includes
clonotypic sequences, these rearrangements were hybridized
to an end-labeled patient-specific A S 0 under stringent conditions so that only identical rearrangements should hybridize.
The lower panel shows that clonotypic rearrangements are
detected among the rearrangements in unsorted blood, and
in CD19' cells, but not in the CD19' cells of an unrelated
individual. Because this method analyzes DNA, as opposed
to RNA, one need not beconcerned that a rare contaminating
plasma cell will inordinately influence the result, there being
only a single DNA rearrangement per diploid cell. The same
results were obtained using ASO-PCR (ie, using the A S 0
in the PCR reaction with FR2); however, the sensitivity of
ASO-PCR is theoretically much greater, andcoulddetect
even a very rare cell. By amplifying all of the rearrangements
in a sample there is no (or a least very little) selection imposed by the PCR. One can then ask what fraction of the
amplified rearrangements are clonal. Although not quantitative, in relative terms a much greater proportion of amplified
From www.bloodjournal.org by guest on February 6, 2015. For personal use only.
CLONOTYPIC
IN MYELOMA
443
Table 3. Small and b r a e CD19+ B Cells Are PhenotMicallv Abnormal in N 4 v Diaanosed Patiants and Thore on or off ChernotheraDv
CD19 Small
CD19 Large
Phenotype
Unt
Tr
off
CD20
CDlO
CD45RO
CD1 bh'
1
PCA-l
CD38h'
CD56
61 t 7
33 2 17
61 t 7
3 2 1
45 t 13
16 2 3
24 2 14
52 2 6
47 2 12
53 t 4
17 2 7
50 2 14
12 2
21 -+ 12
57 t 5
37 i 11
4924
12 2 9
53 2 10
20 2
21 -+ 8
*
*
Unt
81
98
82
78
76
46
76
27
i2
t7
2 10
i 14
2 7
t 10
Off
Tr
76 2 6
92 i 3
88 -c 3
85 2 8
76 2 9
46 -t 5
66 i 13
80
91
85
70
77
42
47
-t
4
i3
2 2
2 3
i8
i3
t 11
PBMC samples were stained with CD19 together with MoAb to the indicated marker in two-color immunofluorescence. Files were gated for
CD19' cells and the expression of the marker was plotted as a histogram. Cells were considered to be positive only if the staining exceeded
that of an identically gated isotype control MoAb. For CD1l b and CD38, only the highest density of expression is enumerated here (staining as
indicated in the Materials and Methods). For the majority of cells, staining with CDlO and PCA-1 was generally at moderate intensity: staining
with CD20,CD45RO. and CD56 was moderate to high as defined in the Materials and Methods. Values in the indicated treatment group or
between different types of therapy were notsignificantly different from each other or from untreated values.
rearrangements are clonal for patients no. 1 and 2 than, by
comparison, for patient no. 3, for whom only a minority of
the products in the band hybridize to the patient-specific
AS0 probe. Patient no. 3 has had a prolonged plateau phase
perhaps related to the relative paucity of clonotypic B cells
(Fig 5) and the apparent presence of polyclonal B cells (Fig
4). Although clearly heterogeneous and including variable
proportions of apparently polyclonal B cells in some patients
and some subsets of B cells, clonotypic CDR3 sequences
were nevertheless consistently detected at multiple time
points during and after treatment in all patients tested and,
for some patients, were detected in all subsets of B cells
analyzed.
In a total of 5 of the 8 patients, a single clonotypic rearrangement was amplified from the blood B cells or large/
small B-cell subsets on IgH fingerprinting, indicating clonotypic involvement. In all 8 patients clonotypic rearrangements were detected in the blood B cells or B-cell
subsets using one or more technique of IgH fingerprinting,
nested CDR3-PCR probed with an ASO, and ASO-PCR. B
cells taken from the same patient over a 2- to 4-month period
consistently exhibited the same clonotypic band. Purified T
cells from the patient taken at the same time and B cells
from an unrelated individual did not contain the clonotypic
rearrangement.
CD19+ cells in blood of myeloma patients have restricted
light chain expression. To confirm Ig gene expression, cytoplasmic Ig light chain was evaluated in either sorted B
cells or in total PBMCs. Cytospins were stained with either
anti-K or anti-A, followed by microscopic examination. Samples were also evaluated using confocal microscopy of sorted
B cells stained with fluorescent anti-light chain. Figure 6
shows representative examples of the small B cells with
predominantly surface staining (Fig 6A) and large B cells
with strong cytoplasmic staining (Fig 6B). Parallel staining
with the opposite anti-light chain reagent gave no fluorescent
staining. In 13 of 13 patients analyzed, sorted CD19+ B cells
were positive for either K or A but not both, and the light
chain expressed was the same as that for the monoclonal
serum Ig or urine protein. The light chain type was the same
for blood and BM B cells. Three patients were analyzed at
two to three time points with consistent light chain restriction. For sorted B cells from all patients analyzed, the majority of B cells expressed cIg, and the intensity of staining
with anti-light chain was heterogeneous, ranging from barely
detectable to relatively intense (comparable to the fluorescent
staining shown in Fig 6) but less than that of BM plasma
cells, consistent with our phenotypic characterization of this
population as heterogeneous and comprising a range of Blineage differentiation stages.1°,12Finally, the patient PBMCs
analyzed in other studies for monoclonal Ig rearrangements,
expression of light chain mRNA, or expression of Ig were
also part of this s t ~ d y , " - ~ ~providing
. ' ~ * ~ ~confirmation of Ig
monoclonality for a total of approximately 60 patients.
CD19+ PBMCs are phenotypically abnormal, expressing
CD38, CD.56, and other antigens not detected on n o m 1 B
cells. A significant proportion of CD19' PBMCs expressed
both CD38 and CD56 (Table 3). Figure 7 shows representative histograms for the staining of CD38 during and after
chemotherapy (Fig 7A), and of CD56 (Fig 7B), on CD19'
PBMCs in myeloma. Among subsets of CD19+ cells gated
for granularity (SSC; Table 3), for the majority of patients,
the small B-cell subset expressed CD45RO and PCA-1, unlike normal B cells, but had only minor expression of CD56
(moderate intensity) or expression of ahigh intensity of
CD38. The large B cells coexpressed CD19 and CD20, as
expected for B cells. As previously shown with a smaller
cohort, the majority of large B cells were CDlO+ CD45RO+
CD1 lbhiPCA-l', and are here shown to express a moderate
intensity of CD56 and nearly half express a high intensity
of CD38 (Fig 7 and Table 3). Overall, although clearly heterogeneous and including multiple B-cell differentiation
stages, no significant differences in phenotype of MM blood
B cells were found between different treatment groups. Because normal PBMC B cells do not express CDlOPCA-l,
CD38hi,C D l l b ~ CD56,
,
or CD45R0,25Table 3 shows that
numerically normal CD19' populations in blood in all cases
include phenotypically abnormal cells. The majority of small
B cells, the subset most comparable to normal B cells in its
physical properties (FALSISSC), are qualitatively different
From www.bloodjournal.org by guest on February 6, 2015. For personal use only.
444
BERGSAGEL E T AL
from and considerably more heterogeneous than normal B
cells.
Temporal changes in CD1 9+PBMCs occur during chemotherapy and over the course of disease but do not correlate
with mZg levels. Individual patients were observed over
time to evaluate the number of blood B cells together with
clinical parameters. The patterns for 2 representative patients
are shown in Fig 8. In all patients the number of B cells
varied over time, as measured by the percentage of PBMCs
or by the number in blood. For most patients, the number
of B cells was relatively high at diagnosis and tended to
increase or remain stable throughout chemotherapy, with
periods when the level increased substantially (as shown
in Fig 8). These increases did not correlate with increased
monoclonal Ig, but would not be expected to do so. mIg is
a measure of plasma cell tumor burden, and would not be
expected to correlate with the numbers of PBMC B cells
that have not yet acquired the capacity for a high rate of Ig
secretion. For patient no. 1, the number of B cells decreased
transiently after cytoreductive therapy and transplantation,
but recurred within a few months posttransplant. The analysis of patient no. 2 began 2 years postdiagnosis after relapse
and treatment with W. For this patient, the number of B
cells appeared to increase with the cessation of therapy and
with relapse, but decreased with therapy. The B cells from
both patients were shown to be monotypic by analysis of
light chain mRNAI3 andor of cytoplasmic Ig. A cyclical
pattern of CD19+ B-cell levels was seen in 30 of 40 patients
analyzed at multiple time points, including the period when
chemotherapy terminated. Six of 40 patients maintained a
high expression of CD19+ B cells throughout, and 4 of 40
had decreased CD19' levels after initiation of therapy that
have not yet recurred to high levels.
Cyclical presence of CD38"' B cells in blood is consistently
detectable for most patients. A high density of CD38 (intensity of staining greater than lo2, Fig 7A) appears only
late in the differentiation towards plasma cells and isnot
seen on normal B cells in a d ~ l t s . The
~ ' percentage of CD38h'
B cells was plotted over time for individual patients at the
indicated month postdiagnosis (Fig 9). The percent of
CD19+38hiB cells increased with the initiation of chemotherapy (month 1) and continued to increase for several months.
Levels became depressed for a brief interval posttreatment
(months 5 and 6) and then increased again (months 8 and
I
I
I
i
l
101
102
103
Month I - 2
104 loo
lo1
lo2
lo3
lo4
Month 5 - 7
C D 3 8 lmmunofluoresence
CD56 l m m u n o f l u o r e s e n c e
Fig 7. CD19*PBMCsexpress
CD38andCD56.
PBMCs were
stained with CDl9-FITC and either CD38-PE or IgG1-PE in doubledirectimmunoffuorucence
(A), or with CD66 or lgG1 M o b s
followed by goat sntimouse IgPE in double direct/indirect immunofluorescence (B). (A) Expression
of
CD38
on
CDl9'
PBMCs from3representative
myelomapatientsearlyduring
chemotherapy
and
at
a
later
point duringor after chemotherapy. (B) Expression of CD56on
CDl9+ PBMCa from 3 representative patients. Files were gated
for CD19+ cells and the expression of CD38 or CD58 plotted as
a hintogram I-) in comparison
to an identically gated isotypematched controleliquot ( - 4 For
(A), the dashed vertical line indicaten mining at intensity of W .
Cells with an intensity of staining above this point are d d g
nated as CD38"'.
From www.bloodjournal.org by guest on February 6, 2015. For personal use only.
445
CLONOTYPIC B CELLS IN MYELOMA
CD19+ x lO*/L Blood
70
IA
X
I
o'8
c
0.6
50
40
0.4
30
20
0.2
10
n
n
v
9/91 11/91 12/91 1/92 2/92 3/92 5/92 6/92 9/9210/9211/92 2193
Date: Patient l
%
CDl9r x 10e/L Blood
or MIg W L )
B
0.6
0.5
80
0.4
40
0.3
0.2
20
0.1
,.
U-
specific oligomer PCR, and sequence analysis. As expected,
and providing a negative control for the PCR reaction, clonotypic IgH rearrangements cannot be amplified from purified
T cells derived from the same PBMCs as the CD19+ B cells.
The rearranged Ig genes are functionally expressed in CD19'
B cells as evidenced by the presence of low to moderate
amounts of monotypic cytoplasmic Ig light chain. As defined
by physical parameters, CD19+ PBMCs include a small and
a large subset, both of which are predominantly late-stage
CD19+20+B cells, previously shown to coexpress CD24."."
Many of the large B cells coexpress CD56 and a high density
of CD38. Although distinguished from plasma cells by the
extent of Ig expression, by phenotype, and by morphology,L0~L3~L5~L9~20~28
these circulating CD19+ populations include
cells within the malignant lineage as defined by the presence
of clonotypic VDJ rearrangements with a sequence identical
to that of the BM plasma cells, although there is as yet no
direct evidence to indicate that they are themselves malignant.
Clonotypic rearrangements were detected among the VDJ
rearrangements amplified from the purified B cells, or Bcell subsets in all 8 informative patients, confirming the presence of clonotypic cells and, in some samples, a relative
absence of nonclonotypic B cells. The best way of quantitating the frequency of clonotypic B cells relative to all B
cells is by probing a nested CDR3 PCR, which amplifies all
rearrangements, with an ASO. These data suggest that in
some patients the clonotypic cells represent a majority of all
B cells, and in others a minority. Further study is required
to determine which B-cell subsets are predominantly clonal
and how this correlates with a patient's clinical course.
9/90 10/90 7/91
6/91
12/91
1/92
4/92 9/92 12/92 2/93
n-
Date: Patient 3
Fig 8. The number of CD19+ cells in blood varies with treatment
and as the disease progresses,but remains high when mlg levels are
reduced. Eachplot represents the results for 1individual patient over
the indicated time period. Patient no. 1 was diagnosed as MGUS in
1989 and was diagnosed as stage 2A myeloma in November 1991at
age 45; VAD treatment was initiated. VAD was completed in May
1992. The patlent was clinically asymptomaticand BM was harvasted
for an autologoustransplant in November 1992.He remains clinically
disease free. Patient no. 2 was diagnosed in November 1988 with
symptomatic stage 2A myeloma at age 82. M/P was initiated in April
1989 for 6 uycles. He relapsed in May 1990 and again in December
1992, and responded to reinstitution of M/P at both relapses. 11.
Percentage of CD19+ PBMCs; (W) mlg in serum (g/L); l*)CD19+ cells/
L of blood.
9). This cyclical pattern, with a trough occurring at the end
of chemotherapy, was seen for 14 of 19 patients who were
analyzed at multiple time points for more than 8 months. For
3 of 19 patients, the percentage of CD38hiB cells remained at
a high level throughout the period of analysis, and 2 of
19 showed reduced proportions of CD38hiB cells with the
initiation of chemotherapy, which at the time of writing had
not yet shown an upswing.
DISCUSSION
For all patients having a monoclonal band among their
BM plasma cells, this study demonstrates the persistent presence of monoclonal CD19' B cells in the blood that share
clonotypic VDJ Ig heavy chain rearrangements with the BM
plasma cells, as measured by hemi-nested IgH fingerprint
analysis, nested CDR3-PCR probedwithanASO,
allele-
% of CD19+ PBMC
I""
expressins CD38 hi
I
0'
0
I
1
2
3
4
5
6
7
8
9
1
I
0
Time in months
Fig 9. Cyclical expression of high-density CD38 over
the course
of disease. The expression of CD38"' on large B cells was plotted as
a funchon of time postdiagnosis (patients no. 1and 41 or postautolo1: initial time point,
gous transplant (patient no.3).Patientno.
MGUS; month 6, end of VAD; month 11, pre-autologous BM transplant sample (ABMT). The
times are as for Fig 8. Patient no.3: initial
time point, post-ABMT; month 6, post-allogeneicBMtransplant;
month 14, death. Patient no. 4 initial timepoint, unt; month 6, end
of VAD; month 8, Ieukapheresis sample and autologous transplantation. The kinetics of disease for this patient have been presented
elsewhere."' Breaks inserted in lines indicate periods longer than l
month. Patient no. 1: break, 2 years including a transition from a
2: break,10
diagnosisofMGUS to that of myeloma. Patient no.
(B);patient
months. Patient no.1is also shown in Fig 8. Patient no.l,
no. 2, (+l; patient no. 4 l*).
From www.bloodjournal.org by guest on February 6, 2015. For personal use only.
446
Although mean values indicated little change in the circulating B-cell component of myeloma, the values inindividual
patients exhibited a wide spread, with normal numbers in
some patients. To determine if quantitative normality indicated qualitative normality, physical and phenotypic properties of the B cells were compared. By both measures, the B
cells in myeloma blood from untreated and treated patients
were highly abnormal, expressing a variety of markers not
found on normal resting B cells, including CD38 and CD56.
Large CD19+20+38+56+B cells are not found in normal
blood. Treatment had no detectable effect on the large Bcell subset. Significant decreases in the number of small €?
cells were detectable in patients treated with M/P or VAD.
Because small B cells frequently have heterogeneous VDJ
Ig rearrangements, this is being evaluated more closely to
determine the effects of chemotherapy on the clonotypic
subset of small B cells. Extensive DNA aneuploidy comparable to that of BM plasma cells (Pilarski et al, manuscript in
preparation) among the small B cells suggests that a large
proportion are likely to be within the malignant lineage after
~hemotherapy.'~.'~
The number of small B cells returned to
the untreated values once therapy was discontinued. The
extensive phenotypic abnormality confirms that, if any normal polyclonal B cells remain in myeloma b l ~ o d , ~they
~.'~
have been altered by the disease process.
The CD19+ subsets described here can plausibly be interpreted to represent sequential stages in the malignant B lineage leading to end-stage plasma cells.'o.'6.28The temporal
analysis of CD19+ PBMCs in myeloma suggests that chemotherapy does impinge on the circulating CD19+ population,
although it does not eradicate clonotypic B cells. Evenin
patients with normal numbers, the CD19' PBMCs were phenotypically abnormal, expressing a high density of CD38
and a moderate to high density of CD56. Bothof these
markers have been used tocharacterize BM-localized plasma
cell^,"^^^ and their appearance on B cells before the acquisition of plasma cell morphology appears to be a late event
in B-cell development.i",25,35
Among the blood B cells, the
majority of blood B cells withDNA hyperdiploidy were
CD38h' (Pilarski et a l l 6 and manuscript in preparation).
The lineage relationship betweenBM plasma cells and
the clonotypic B cells detected among the CD19+ PBMCs
is unknown. Because myeloma is likely to originate from
malignant transformation within a chronically stimulated antigen responsive B-cell clone(s), perhaps exemplifiedin
monoclonal gammopathies of undetermined significance
(MGUS), they could include activated members of the original antigen-responsive clone coexisting with its malignant
relatives. Secondly, they could be migratory progeny of a
BM-localized or extramedullary stem cell, consistent with
their motile phenotype and repertoire of receptors associated
with migratory behavior. Finally, they may include the generative stem cell that perpetuates myeloma. Given the heterogeneity of the CD19+ PBMCs and the distribution of clonotypic cells among several CD19+ subsets'" (Bergsagel et al,
manuscript in preparation), all of the above interpretations
are possible and should not be viewed as mutually exclusive.
The results presented here support the notion that the malig-
BERGSAGELET
AL
nant clone in myeloma is heterogeneous, involving multiple
differentiation stages with different circulating B-lineage
subsets in ascendency at different times and stages of disease. The possibility also exists that similar CD19+ subsets in
patients with MGUSi2may reflect dormant myeloma, which,
when released from the mechanisms maintaining dormancy,
results in the diagnosis of frank myeloma. Overall, the presence of clonotypic cells among CD19+ populations in blood,
at times when the BM plasma cells have beenrendered
undetectable by chemotherapy, is consistent with properties
expected for a drug-resistant reservoir of malignant disease.I5.lb If drug-resistant circulating CD19' cells are responsible for perpetuating myeloma despite killing of the
BM-localized plasma cells, new modes of therapy maybe
required to eradicate the malignant clone.
ACKNOWLEDGMENT
This work would not have been possible without the skilled technical assistance of Darlene Paine, Eva Pruski, Dorota Rutkowski, and
Kimberly Howland. Joanne Hewitt assisted in collection of clinical
information and data entry. Dr Ben Ruether provided some of the
patient samples.
REFERENCES
1. Dune BGM, Salmon SS: Staging, kinetics, and flow cytometry
of multiple myeloma, in Wiemik P, Canellos G, Kyle R, Schiffer C
(eds): Neoplastic Diseases ofthe Blood, v01 2. New York, NY,
Churchill Livingston, 1985, p 513
2. Greipp PR: Advances in the diagnosis and management of
myeloma. Semin Hematol 29:24, 1992
3. Bergsagel DE: Treatment of plasma cell myeloma. Annu Rev
Med 30:431, 1979
4. Palmer M, Belch A, Hanson J, Brox L: Reassessment of the
relationship between M-protein decrement and survival in multiple
myeloma. Br J Cancer 59:l IO, 1989
5. Belch A, Shelley W, Bergsagel D, Wilson K, Klimo P, Willan
A: A randomized trial of maintenance versus no maintenance melphalan and prednisone in responding myeloma patients. Br J Cancer
57:94, 1988
6. Jagannath S, Barlogie B, Dicke K, Alexanian R,&gars G,
Cheson B, Lemaistre FC, Smallwood L, Pruitt K, Dixon DO:Autologous bone marrow transplantation in multiple myeloma: Identification of prognostic factors. Blood 76:1860, 1990
7. Browman GP, Belch A, Skillings J, Wilson K, Bersagel D,
Johnston D, Pater JL: Modified adriamycin-vincristine-dexamethasone (m-VAD) in primary refractory and relapsed plasma cell myeloma: An NCI (Canada) pilot study. Br J Haematol 825.55, 1992
8. Barlogie B, Epstein J, Selvanayagam P, Alexanian R: Plasma
cell myeloma-New biological insights and advances in therapy.
Blood 73:865, 1989
9. Hulin N, Conte PF, Pileri A: Biology of the human myeloma
cell population. 11. Cytokinetic characteristics. Clin Lab 8:49, 1978
10. Pilarski LM, Jensen GS: Monoclonal circulating B cells in
multiple myeloma: A continuously differentiating possibly invasive
population as defined by expression of CD45 isofoms and adhesion
molecules. Hematol Oncol Clin North Am 6:297, 1992
11. Jensen GS, Mant MJ, Pilarski LM: Progressive differentiation
of monoclonal B lineage cells from blood, spleen, lymph node and
bone marrow of a patient with terminal myeloma. Am J Hematol
41:199, 1992
12. Jensen GS, Mant MJ, Belch AJ, Berensen JR, Ruether BA,
From www.bloodjournal.org by guest on February 6, 2015. For personal use only.
CLONOTYPIC B CELLS IN MYELOMA
Pilarski LM: Selective expression of CD45 isoforms defines
CALLA+ monoclonal B lineage cells in peripheral blood from myeloma patients as late stage B cells. Blood 78:711, 1991
13. Jensen GS, Belch AR, Kherani F, Mant MJ, Ruether BA,
Pilarski LM: Restricted expression of immunoglobulin light chain
mRNA and of the adhesion molecule CD1 Ib on circulating monoclonal B lineage cells in peripheral blood of myeloma patients. Scand
J Immunol 36:843, 1992
14. Jensen GS, Belch AR, Mant U T , Ruether BA, Yacyshyn BR,
Pilarski LM: Expression of multiple beta-l integrins on circulating
monoclonal B cells in patients with multiple myeloma. Am J Hemato1 43:29, 1992
15. Pilarski LM, Belch AJ: Circulating monoclonal B cells expressing p-glycoprotein may be a reservoir of multidrug resistant
disease in multiple myeloma. Blood 83:724, 1994
16. Pilarski LM, Mant MM, Belch AR: Circulating, monoclonal,
multi-drug resistant B cells may comprise the malignant stem cells
population in multiple myeloma, in Dammaco F, Barlogie B (eds):
Challenges of Modern Medicine, v01 4. Ares Sereno Symposia Publications, 1994, p 31
17. Cassel A, Leibovitz N, Hornstein L, Quitt M, Aghai E: Evidence for the existence of circulating monoclonal B-lymphocytes in
multiple myeloma patients. Exp Hematol 18:1171, 1990
18. Berenson J, Wong R, KimK, Brown N, Lichtenstein A:
Evidence for peripheral blood B lymphocyte but not T lymphocyte
involvement in multiple myeloma. Blood 70:1550, 1987
19. Pilarski LM, Masellis Smith A,
Belch
AR, Yang B,
Savani RC, Turley EA:RHAMM, a receptor for hyaluronan-mediated
B cell malignancy:
molility, on normal lymphocytes, thymocytes inand
A mediator in B cell malignancy? Leuk Lymphoma 14363, 1994
20. Bergsagel PL, Masellis-Smith A, Belch AR, Pilarski LM: The
blood B cells and bone marrow plasma cells in patients with multiple
myeloma share identical IgH rearrangements. Cum Top Microbiol
Immunol (in press)
2 I. Pilarski LM, Belch AR: Intrinsic expression of the multidrug
transporter, P-glycoprotein 170, in multiple myeloma: Implications
for treatment. Leuk Lymphoma (in press)
22. Billadeau D, Ahmann G, Greipp P, Van Ness B: The bone
marrow of multiple myeloma patients contains B cell populations
at different stages of differentiation that are clonally related to the
malignant plasma cell. J Exp Med 178:1023, 1993
23. Corradini P, Voena C, Omede P, Astolfi M, Boccadoro M,
Dalla-Favera R, Pilieri A: Detection of circulating tumor cells in
multiple myeloma by a PCR based method. Leukemia 7:1879, 1993
24. Dreyfus F, Melle J, Quarre C, Pillier C: Contamination of
peripheral blood by monoclonal B cells following treatment of multiple myeloma by high dose chemotherapy. Br J Haematol 85:411,
1993
447
25. Pilarski LM, Jensen GS: Expression of CD45 isofoms (leukocyte common antigen) and adhesion molecules during normal and
abnormal B lymphocyte development. Adv Mol Cell Immunol
IB:75, 1993
26. Maddy AH, Sanderson A, Mackie MJ, Smith SK The role
of cell amturation in the generation of phenotypic heterogeneity in
B cell chronic lymphocytic leukemia. Immunology 68:346, 1989
27. Berenson JR, Lichtenstein AK: Clonal rearrangement of immunoglobulin genes in the peripheral blood of multiple myeloma
patients. Br J Haematol 73:425, 1989
28. Pilarski LM, Cass CE, Tsuro T, Belch AR: Multidrug resistance of a continuously differentiating monoclonal B lineage in the
blood and bone marrowof patients with multiple myeloma. Curr
Top Microbiol Immunol 182:177, 1992
29. Pilarski LM, Gillitzer R, Zola H, Shortman K, Scollay R:
Selective expression of CD45 (T200) antigens during human thymocyte differentiation. Eur J Immunol 19589, 1988
30. Smith SH, Brown MH, Rowe D, Callard RE, Beverly PC:
Functional subsets of human helper-inducer cells defined by a new
monoclonal antibody, UCHLI. Immunology 58:63, 1986
31. Anderson KC, Park EK, Bates MP, Hardy R, Schlossman SF,
Nadler LM: Antigens on human plasma cells identified by monoclonal antibodies. J Immunol 130:1132, 1983
32. MacKenzie MR. Paglieroni T, Caggiano V: CD5 positive
immunoregulatory B cells in spleen populations from multiple myeloma patients. Am J Hematol 37: 163, 1991
33. Tedder TF, Issacs CM: Isolation of cDNAs encoding the
CD19 antigen of human and mouse B lymphocytes. J Immunol
143:712, 1989
34. Zhou L-J, Ord DC, Omori SA, Tedder TF: Structure of the
genes encoding the CD19 antigen of human and mouse B lymphocytes. Immunogenetics 35: 102, 1992
35. Tedder TF, Clement LT, Cooper MD: Discontinous expression of a membrane antigen (HB-7) during B lymphocyte differentiation. Tissue Antigens 24:140, 1984
36. Pilarski LM, Mant MJ, Ruether BA, Belch A: Severe deficiency of B lymphocytes in peripheral blood from multiple myeloma
patients. J Clin Invest 74:1301, 1984
37. Pilarski LM, Ruether BA, Mant MJ: Abnormal function of
B lymphocytes from peripheral blood of multiple myeloma patients.
I. Lack of correlation between the number of cells potentially able
to secrete IgM and serum IgM levels. J Clin Invest 75:2024, 1985
38. Pilarski LM, Mant MJ, Ruether BA: Review: Analysis of
immunodeficiency in multiple myeloma: Observations and hypothesis. J Clin Lab Anal 1:214, 1987
39. van Camp B, Durie BGM, Spier C, de Waele MC, van Riet
I, Vela E, Frutiger Y, Richter L, Grogan TM: Plasma cells in multiple
myeloma express a natural killer cell-associated antigen: CD56
(NHK-I; Leu-19). Blood 76:377, 1990
From www.bloodjournal.org by guest on February 6, 2015. For personal use only.
1995 85: 436-447
In multiple myeloma, clonotypic B lymphocytes are detectable among
CD19+ peripheral blood cells expressing CD38, CD56, and monotypic
Ig light chain [published erratum appears in Blood 1995 Jun
1;85(11):3365]
PL Bergsagel, AM Smith, A Szczepek, MJ Mant, AR Belch and LM Pilarski
Updated information and services can be found at:
http://www.bloodjournal.org/content/85/2/436.full.html
Articles on similar topics can be found in the following Blood collections
Information about reproducing this article in parts or in its entirety may be found online at:
http://www.bloodjournal.org/site/misc/rights.xhtml#repub_requests
Information about ordering reprints may be found online at:
http://www.bloodjournal.org/site/misc/rights.xhtml#reprints
Information about subscriptions and ASH membership may be found online at:
http://www.bloodjournal.org/site/subscriptions/index.xhtml
Blood (print ISSN 0006-4971, online ISSN 1528-0020), is published weekly by the American
Society of Hematology, 2021 L St, NW, Suite 900, Washington DC 20036.
Copyright 2011 by The American Society of Hematology; all rights reserved.
© Copyright 2026