
Global Investment trends Monitor No 18
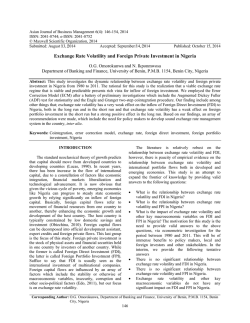
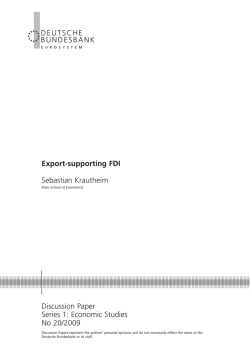
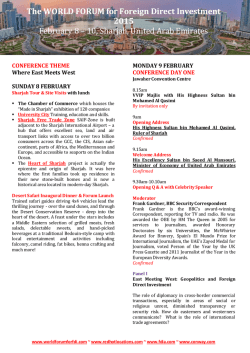
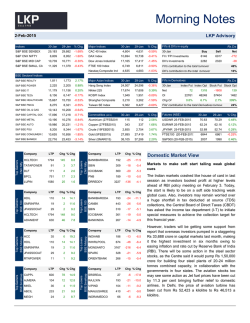
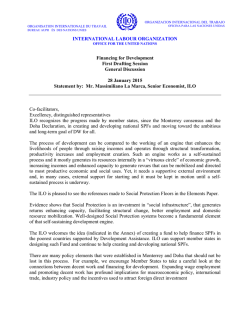
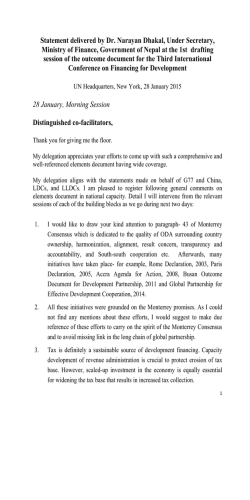
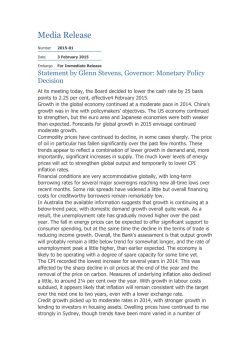
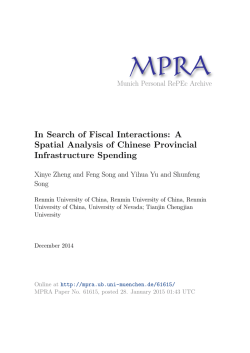
No. 18 29 January 2015 EMBARGO 29 JANUARY 2015, 17:00 GMT (12:00 New York, 18:00 Geneva) GLOBAL FDI FLOWS DECLINED IN 2014 CHINA BECOMES THE WORLD’S TOP FDI RECIPIENT HIGHLIGHTS In 2014, global foreign direct investment (FDI) inflows declined by 8% to an estimated US$1.26 trillion (figure 1) due to fragility of the global economy, policy uncertainty and geopolitical risks. A large divestment in the United States also lowered the global level of FDI flows. Figure 1. Estimated global FDI inflows, 2007–2014 (Billions of US dollars) Source: ©UNCTAD. * Revised; ** Preliminary estimates. Note: Excluding Caribbean offshore financial centres. FDI flows to developed countries dropped by 14% to an estimated US$511 billion, significantly affected by a large divestment in the United States. FDI flows to the European Union (EU) reached an estimated US$267 billion; this represents a 13% increase on 2013, but is still only one-third of the 2007 peak. Flows to transition economies more than halved reaching US$45 billion as regional conflict, sanctions on the Russian Federation, and negative growth prospects deterred foreign investors (especially from developed countries) from investing in the region. Developing economies saw their FDI reaching a new high of more than US$700 billion, 4% higher than 2013, with a global share of 56%. At the regional level, flows to developing Asia were up, those to Africa remained flat, while FDI to Latin America declined. In 2014, China, with a modest increase of 3%, became the world's largest recipient of FDI. The United States fell to the 3rd largest host country with almost a third of their 2013 level. Among the top five FDI recipients in the world, four are developing economies. Cross-border mergers and acquisitions (M&As) rose by 19%, driven mainly by restructuring deals. Announced greenfield investment projects rose by 3% in 2014. A solid FDI rise remains distant. A subdued global economic outlook, volatility in currency and commodity markets and elevated geopolitical risks will negatively influence FDI flows. On the other hand, the strengthening of economic growth in the United States, the demand-boosting effects of lower oil prices and proactive monetary policy in the Eurozone, coupled with increased liberalization and promotion measures, will favourably affect FDI flows. Global FDI flows declined by 8% in 2014 to an estimated US$1.26 trillion, down from a revised US$1.36 trillion in 2013 (data in this Trends Monitor exclude Caribbean offshore financial centres and FDI flows passing through special purpose entities (SPE) in Austria, Hungary, Luxembourg and the Netherlands). Flows were heavily influenced by economic uncertainty and geopolitical risks including regional conflicts, and by the US$130 billion mega-buy-back of shares by Verizon (United States) from Vodafone (United Kingdom) which significantly reduced the equity component of FDI inflows to the United States. With inflows to China at an estimated $128 billion – including both financial and non-financial sectors – the country became the largest FDI recipient in the world in 2014 (figure 2). The United States fell to the 3rd largest host country. Among the top five FDI recipients in the world, four are developing economies. Figure 2. Estimated FDI inflows: top 10 host economies, 2014 (Billions of US dollars) Source: ©UNCTAD. Note: FDI estimations in this Trends Monitor are based primarily on quarterly FDI data derived from the (extended) directional principle, though there are some countries for which the asset/liability data are used for estimation. A decrease of FDI flows in developed countries Preliminary estimates show that FDI flows to developed countries as a whole dropped by 14% to an estimated US$511 billion. FDI flows to the United States fell to an estimated US$86 billion − almost a third of their 2013 level. Cross-border M&A sales in the United States declined from US$60 billion in 2013 to just US$10 billion in 2014, primarily due to the Verizon-Vodafone deal. To put this in perspective, crossborder M&A sales in the United States exceeded US$222 billion at their peak in 2008. FDI inflows to the European Union (EU) rose by 13% to an estimated US$267 billion. Among the largest economies, the United Kingdom saw its inflows rise to an estimated US$61 billion, helped by rising reinvested earnings and cross-border M&As. According to UNCTAD estimates, FDI flows to Sweden and Portugal rose significantly, though from very low levels in 2013. Inflows to the Netherlands and Luxembourg increased to US$42 billion and US$36 billion, respectively. In contrast, inflows to Germany and France were in negative territory, to -US$2.1 billion and to -US$6.9 billion, respectively. In Germany FDI flows declined due to changes in the flows of intra-company loans, while in France in addition to the repayment of loans to parent companies, a single large divestment took place (Nestlé (Switzerland) sold its 8% share in L'Oreal for US$9 billion)1. Lower intra-company loans by EU investors diminished FDI flows to Ireland to just US$10 billion. Figure 3. Estimated FDI inflows by region, 2013-2014 (Per cent change and value of inflows in 2014 in billions of US dollars) Source: ©UNCTAD. Note: Latin America and the Caribbean excludes Caribbean offshore financial centers. Elsewhere in the developed world, Japan, while still a small host country, continued to perform well, with FDI inflows rising to US$10 billion in 2014. Inflows to Canada declined by 26% to US$53 billion as a result of a sharp fall in intra-company loans. 1 "Nestle cuts stake in L'Oreal, but staying for 'long haul'", Reuters, 11 February 2014. Developing Asia absorbed FDI worth almost half a trillion; Latin America faltered after four years of consecutive increases FDI flows in developing economies remained resilient in 2014, reaching more than US$700 billion, the highest level ever recorded, and accounting for 56% of global FDI flows. The increase was mainly driven by developing Asia − the world's largest recipient region − while Latin America saw its flows decline (figure 4). Although economic growth in developing Asia slowed down, FDI inflows remained resilient. Preliminary estimates demonstrate that combined inflows to 40 economies in the region grew by an estimated 15% to a historical level of around US$492 billion in 2014. Among the subregions East Asia, South-East Asia and South Asia experienced rapid increases in inflows, while those to West Asia dropped. Inflows to China amounted to an estimated US$128 billion, rising by about 3% from 2013. This was mainly driven by an increase in FDI in the service sector, while FDI to the manufacturing sector fell, particularly from Japan, and especially in industries that are sensitive to rising labour costs. By contrast, FDI inflows to India surged, increasing by about 26% to an estimated US$35 billion, despite macroeconomic uncertainties and financial risks. Figure 4. Estimated FDI inflows, by region, 2012–2014 (Billions of US dollars) Source: ©UNCTAD. Note: Latin America and the Caribbean excludes Caribbean offshore financial centers. Inflows to Hong Kong (China) – a leading regional business hub and location of regional headquarters of transnational corporations (TNCs) in Asia – rose by an estimated 46% to an annual total of about US$111 billion. This significant growth was partly driven by the US$42 billion consolidation deal within the CITIC group. Other deals include the purchase of a 25% stake in A.S. Watson Co. by Singapore's Temasek Holdings for US$5.6 billion. Similarly, FDI inflows to Singapore, another international business hub in the region, rose by 27% to an estimated US$81 billion. FDI was also on the rise in other South-East Asian economies, including Indonesia and Thailand. However, as locations for foreign companies' production in labour-intensive industries, a number of low-income economies in the subregion exhibited a mixed picture: flows to Myanmar doubled, while those to Cambodia and Viet Nam fell. FDI flows to West Asia are estimated to have maintained their downward trend in 2014 for the sixth consecutive year, decreasing by around 4% to US$44 billion. This is due to a further deterioration of the security situation in the region that deterred FDI not only to countries directly affected − like Iraq, Syria and Yemen − but also in neighbouring countries and regionally. FDI remained sluggish also in the oil-rich Gulf Cooperation Council (GCC) countries, even though they have avoided large scale political unrest and enjoyed strong economic growth. In general, since the beginning of the global economic crisis in 2008 followed by political instability shortly after, they have witnessed a relative fall in private investment and a significant increase in public investment. FDI is estimated to have also decreased in Turkey to US$12.2 billion driven by a significant decrease of flows to the financial sector, while flows aiming at real estate acquisitions registered a strong increase. FDI inflows to Africa fell by 3% to an estimated US$55 billion, largely accounted for by a decrease of FDI into North Africa. Other subregions experienced similar FDI inflows to 2013. FDI into Africa was buoyed by increased inflows to Mozambique driven by its potential as one of the world’s largest liquefied natural gas exporters. FDI into North Africa declined by 17% to US$12.5 billion, with continued civil unrest in Libya dragging down the region's potential as an FDI host. Notwithstanding strong inflows to Mozambique, FDI into Sub-Saharan Africa remained flat. Africa saw cross-border M&As sales increase by 41% to US$5.4 billion, as investors looked to tap into Africa’s growing consumer markets. Private equity firms and Middle East investors also played a role. In Nigeria, significant cross-border M&A growth to US$1.3 billion, especially into consumer-orientated sectors, helped counterbalance the decline in FDI to other sectors, stemming the level at US$4.9 billion. FDI flows to Latin America are estimated to have decreased by 19% to US$153 billion in 2014, after four years of consecutive increases. This was mainly the consequence of a 26% decline in crossborder M&As and of reduced investment in the extractive industries due to lower commodity prices. Most of the decline took place in Mexico where inflows are estimated to have fallen 52% − or by US$22 billion − due to both the exceptional levels reached in 2013 (after the US$13 billion purchase of the Modelo brewery by the Belgian multinational Anheuser-Busch InBev) − and the US$5 billion divestment by AT&T (United States) of its stake in América Móvil. FDI to Venezuela registered an estimated US$6 billion decline to US$0.9 billion due to a strong increase in reverse intra-company loans (the repayment of loans to the parent company). Flows to Argentina are estimated to be down by 60% to US$4.5 billion due to the US$5.3 billion compensation received by Repsol for the 2012 nationalization of 51% of YPF. In Brazil, despite a significant increase of cross-border M&As (by 45% to US$14 billion), FDI flows are estimated down around 4% to US$62 billion affected by a strong fall in flows to the primary sector, while those to manufacturing and services increased. In Chile, FDI flows were boosted by exceptionally high levels of cross-border M&A sales that increased almost four-fold to US$9 billion in 2014, without which FDI would have registered a significant decline due to waning FDI in the mining sector. The latter also affected FDI to Colombia and Peru where inflows are estimated to have fallen to US$15.8 billion and US$7.4 billion, respectively. FDI flows to transition economies halved Transition economies experienced a 51% decline in their FDI inflows, reaching an estimated US$45 billion, as regional conflict and sanctions on the Russian Federation − the largest host country in the region − have deterred foreign investors (especially from developed countries). FDI flows to the Russian Federation are estimated to have fallen by 70% to an estimated US$19 billion, due to both the country's negative growth prospects and the exceptional level reached in 2013 (because of the US$55 billion Rosneft−BP transaction). Major oil and gas companies based in developed countries have cancelled or withheld equity investments in the Russian Federation. In Ukraine, FDI flows turned negative to -US$0.2 billion. In contrast, FDI flows to Kazakhstan and Azerbaijan rose. Cross-border M&As rebound Cross-border M&As rebounded strongly in 2014, reaching their highest level since 2011. TNCs have gradually gained the confidence to go back on the acquisition trail and make strategic deals. Tax inversion deals also contributed to the increase in 2014. Cross-border M&As increased by 19% to US$384 billion (figure 5) with strong performance in finance, as well as pharmaceuticals, metals, and communications and media industries. The financial industry played its most prominent role since 2008 in cross-border M&A sales at US$135 billion, accounting for 35% of global sales. This industry intensified its ongoing restructuring to cope with new monetary policies and meet more stringent capital adequacy requirements. Megadeals dominated the scene in 2014. There were 222 cross-border deals worth more than US$1 billion, a 32% increase on 2013. While developing Asia and Europe were the regions with the highest growth in M&A sales, Latin America saw the biggest decline. Least developed countries (LDCs) registered record deal values driven by an Indian gas purchase into Mozambique (US$2.4 billion) and South Africa’s Nedbank agreement of the purchase of a 20% stake in Togo’s Ecobank (US$0.49 billion). The value of announced greenfield investment increased by 3% in 2014 (figure 5). Among major groupings, developing economies saw their greenfield investment up by 7%, developed economies remained flat with a decline of 1%, and transition economies declined by 10%. This reinforced developing economies as the main hosts of greenfield investment with their share accounting for three quarters of total announced deals. Figure 5. The value of cross-border M&A sales and of announced greenfield investment projects, a 2007–2014 (Billions of US dollars) Greenfield FDI projects Cross-border M&As 1 800 1 800 1 200 1 200 600 600 3% 19% 0 0 2007 2008 2009 2010 2011 2012 2013 2014 2007 2008 2009 2010 2011 2012 2013 2014 Source: ©UNCTAD, based on cross-border M&A database for M&As, and information from the Financial Times Ltd, fDi Markets (www.fDimarkets.com) for greenfield projects. a Data for 2014 are preliminary. Note: Excluding Caribbean offshore financial centres. A solid FDI rise remains distant Trends in global FDI flows are uncertain for 2015. The fragility of the world economy, with growth tempered by hesitant consumer demand, volatility in currency markets and geopolitical instability will act as a deterrent for investors. The decline in commodity prices will also lower investments in the oil and gas and other commodity industries. Among developed countries, the increasing divergence in economic growth between the United States and the euro area and Japan will lead to different patterns of FDI. In developing and transition economies, slower growth prospects in some emerging markets and regional conflicts are likely to affect investment negatively. Despite those risks, TNCs are expected gradually to increase strategic investments and to deploy part of their record levels of cash holdings. Various corporate surveys point to the fact that TNCs are gaining more confidence in their business growth prospects. Stronger economic growth in the United States, the demandboosting effect of lower oil prices and proactive monetary policy in the Eurozone could support increased FDI flows. Increased investment liberalization and promotion measures will also favourably affect FDI flows (see UNCTAD’s recent Investment Policy Monitor). Annex table 1. FDI inflows, by major region, 2012–2014 (Billions of US dollars) Region / Economy World Developed economies Europe European Union North America Developing economies Africa North Africa Other Africa Latin America and the Caribbean South America Central America Caribbean Developing Asia West Asia East Asia South Asia South-East Asia Transition economies 2012 1324 590 310 282 213 650 55 17 39 178 145 27 6 414 48 217 32 116 84 2013a 2014 b 1363 594 225 235 302 677 56 15 41 190 133 53 5 427 46 220 35 127 92 1260 511 305 267 139 704 55 13 42 153 118 31 4 492 44 254 43 151 45 Growth rate 2013–2014 (%) -8 -14 36 13 -54 4 -3 -17 2 -19 -11 -41 -16 15 -4 16 23 19 -51 Source : ©UNCTAD. The data can be cited provided acnowledgement is explicitly given to UNCTAD. a Revised. b Estimated. Note : FDI estimations in this Trends Monitor are primarily based on quarterly FDI data derived from the (extended) directional principle, though there are some countries for which the asset/liability data are used for estimation. World FDI inflows are projected on the basis of 136 economies for which data are available for part of 2014, as of 21 January 2015. Data are estimated by annualizing their available data, in most cases the first three quarters of 2014. The proportion of inflows to these economies in total inflows to their respective region or subregion in 2013 is used to extrapolate the 2014 regional data. Data exclude the financial centres in the Caribbean. The next issue of UNCTAD’s Global Investment Trends Monitor will be released in mid-April 2015. The latest issue of UNCTAD’s Investment Policy Monitor was released on 19 January 2015.

© Copyright 2026