
A model ® - Solvay Plastics
Amodel ® Amodel® PPA Design Guide SPECIALTY POLYMERS Table of Contents Introduction . . . . . . . . . . . . . . . . . . . . . . . . . . . . . 3 Amodel® Polyphthalamide (PPA) . . . . . . . . . . . . . . 3 Chemistry . . . . . . . . . . . . . . . . . . . . . . . . . . . . . . . . . 3 Crystallinity . . . . . . . . . . . . . . . . . . . . . . . . . . . . . . . . . 4 Moisture Effects . . . . . . . . . . . . . . . . . . . . . . . . . . . . . 5 Product Data . . . . . . . . . . . . . . . . . . . . . . . . . . . . 6 Amodel® Resin Property Tables . . . . . . . . . . . . . . . 6 Nomenclature . . . . . . . . . . . . . . . . . . . . . . . . . . . . . . . 7 Product Selection . . . . . . . . . . . . . . . . . . . . . . . . . . . . 7 Property Data . . . . . . . . . . . . . . . . . . . . . . . . . . . 8 Typical Properties . . . . . . . . . . . . . . . . . . . . . . . . . . 8 Accelerated Moisture Conditioning . . . . . . . . . . . . 8 Mechanical Properties . . . . . . . . . . . . . . . . . . . . . . Short-Term Mechanical Properties . . . . . . . . . . . . . . Tensile Properties . . . . . . . . . . . . . . . . . . . . . . . . . . . Test methods . . . . . . . . . . . . . . . . . . . . . . . . . . . . Tensile property comparison . . . . . . . . . . . . . . . . Tensile properties for GR PPA vs. temperature . . Tensile properties of A-1000 GR grades at elevated temperatures . . . . . . . . . . . . . . . . . . . . . Test methods . . . . . . . . . . . . . . . . . . . . . . . . . . . . Flexural property comparison . . . . . . . . . . . . . . . . Flexural properties at elevated temperatures . . . . Shear Properties . . . . . . . . . . . . . . . . . . . . . . . . . . . . Compressive Strength and Modulus . . . . . . . . . . . . . Impact Strength . . . . . . . . . . . . . . . . . . . . . . . . . . . . Izod (Cantilevered Beam) Impact . . . . . . . . . . . . . . . Falling weight impact properties . . . . . . . . . . . . . . Poisson’s Ratio . . . . . . . . . . . . . . . . . . . . . . . . . . . . . Long-term Mechanical Properties . . . . . . . . . . . . . . . Creep . . . . . . . . . . . . . . . . . . . . . . . . . . . . . . . . . . . . Tensile creep . . . . . . . . . . . . . . . . . . . . . . . . . . . . Isochronous stress/strain curves . . . . . . . . . . . . . Tensile creep rupture . . . . . . . . . . . . . . . . . . . . . . Flexural creep . . . . . . . . . . . . . . . . . . . . . . . . . . . . Compressive creep . . . . . . . . . . . . . . . . . . . . . . . Fatigue Resistance . . . . . . . . . . . . . . . . . . . . . . . . . . Fatigue strength of Amodel® resin . . . . . . . . . . . . Moisture Effects . . . . . . . . . . . . . . . . . . . . . . . . . . . . Significance of moisture absorption . . . . . . . . . . . Moisture absorption and glass transition temperature (Tg) . . . . . . . . . . . . . . . . . . . . . . . . . . Absorption amount . . . . . . . . . . . . . . . . . . . . . . . Effect of moisture on strength and stiffness . . . . . Dimensional change due to moisture . . . . . . . . . . 21 21 21 21 22 23 24 25 25 26 27 28 28 29 31 31 32 32 33 35 35 36 36 37 37 38 38 39 39 40 40 Thermal Properties . . . . . . . . . . . . . . . . . . . . . . . . Heat Distortion Temperature – HDT . . . . . . . . . . . . . Deflection Temperature Values for Amodel® Resins . . . . . . . . . . . . . . . . . . . . . . . . . . . . Coefficient of Linear Thermal Expansion . . . . . . . . . . Thermal Conductivity . . . . . . . . . . . . . . . . . . . . . . . . Specific Heat . . . . . . . . . . . . . . . . . . . . . . . . . . . . . . Thermal Stability . . . . . . . . . . . . . . . . . . . . . . . . . . . . Thermogravimetric analysis (TGA) . . . . . . . . . . . . Relative thermal index (UL) . . . . . . . . . . . . . . . . . . Glow wire testing . . . . . . . . . . . . . . . . . . . . . . . . . Smoke density test (NBS) . . . . . . . . . . . . . . . . . . . Horizontal burning test . . . . . . . . . . . . . . . . . . . . . 50W (20 mm) Vertical burn test . . . . . . . . . . . . . . 500 W Vertical burning test . . . . . . . . . . . . . . . . . 42 42 43 43 45 46 47 47 48 49 50 50 50 51 Electrical Properties . . . . . . . . . . . . . . . . . . . . . . . 51 Dielectric Breakdown Voltage and Strength ASTM D149 . . . . . . . . . . . . . . . . . . . . . . . . . . . . . . . 51 Volume Resistivity - ASTM D257 . . . . . . . . . . . . . . . . 52 Surface Resistivity - ASTM D257 . . . . . . . . . . . . . . . 52 Dielectric Constant - ASTM D150 . . . . . . . . . . . . . . . 52 Dissipation Factor - ASTM D150 . . . . . . . . . . . . . . . .53 UL 746A Short-Term Properties . . . . . . . . . . . . . . . . 53 High-Voltage, Low-Current, Dry Arc Resistance – ASTM D495 . . . . . . . . . . . . . . . . . . . . . . . . . . . . . . . 53 Comparative Tracking Index (CTI) – ASTM D3638 . . . 54 Hot Wire Ignition (HWI) - ASTM D3874 . . . . . . . . . . . 54 High-Current Arc Ignition (HAI) . . . . . . . . . . . . . . . . . 55 High-Voltage Arc Resistance to Ignition . . . . . . . . . . 55 UL Relative Thermal Indices . . . . . . . . . . . . . . . . . . . 55 Environmental Resistance . . . . . . . . . . . . . . . . . . . Chemical Resistance . . . . . . . . . . . . . . . . . . . . . . . . Chemical Compatibility . . . . . . . . . . . . . . . . . . . . . Gamma Radiation . . . . . . . . . . . . . . . . . . . . . . . . . . . 56 56 60 60 Design Information . . . . . . . . . . . . . . . . . . . . . . 61 Mechanical Design . . . . . . . . . . . . . . . . . . . . . . . . 62 Using Classical Stress/Strain Equations . . . . . . . 65 Limitations of Design Calculations . . . . . . . . . . . . . . . 65 Deflection Calculations . . . . . . . . . . . . . . . . . . . . . . . 65 Stress Calculations . . . . . . . . . . . . . . . . . . . . . . . . . . 65 Reinforcing Fiber Orientation Considerations . . . . . . .65 Designing for Equivalent Part Stiffness . . . . . . . . . . . 66 Changing section thickness . . . . . . . . . . . . . . . . . 66 Adding ribs to maintain stiffness . . . . . . . . . . . . . . 66 Designing for Sustained Load . . . . . . . . . . . . . . . . . . 67 Calculating deflection . . . . . . . . . . . . . . . . . . . . . . 67 Calculating allowable stress - creep rupture . . . . . 68 Considering Stress Concentrations . . . . . . . . . . . 69 Considering Thermal Stresses . . . . . . . . . . . . . . . 69 Loss of Bolt Tightness Due to Creep . . . . . . . . . . . . 70 Designing for Assembly . . . . . . . . . . . . . . . . . . . . . 71 Interference or Press Fits . . . . . . . . . . . . . . . . . . . . . 71 Amodel® PPA Design Guide / 1 Calculating the Allowable Interference . . . . . . . . . . . . Mechanical Fasteners . . . . . . . . . . . . . . . . . . . . . . . . Self-tapping screws . . . . . . . . . . . . . . . . . . . . . . . Improving torque retention . . . . . . . . . . . . . . . . . . Tightening torque . . . . . . . . . . . . . . . . . . . . . . . . . Pull out force calculation . . . . . . . . . . . . . . . . . . . Threaded inserts . . . . . . . . . . . . . . . . . . . . . . . . . Molded-in threads . . . . . . . . . . . . . . . . . . . . . . . . Designing with snap fits . . . . . . . . . . . . . . . . . . . . Straight cantilever beam equation . . . . . . . . . . . . Tapered Cantilever Beam Equation . . . . . . . . . . . . . . 71 72 72 72 73 73 73 74 74 74 75 Designing for Injection Molding . . . . . . . . . . . . . . Wall Thickness . . . . . . . . . . . . . . . . . . . . . . . . . . . . . Wall Thickness Variation . . . . . . . . . . . . . . . . . . . . . . Draft Angle . . . . . . . . . . . . . . . . . . . . . . . . . . . . . . . . Ribs . . . . . . . . . . . . . . . . . . . . . . . . . . . . . . . . . . . . . Coring . . . . . . . . . . . . . . . . . . . . . . . . . . . . . . . . . . . Bosses . . . . . . . . . . . . . . . . . . . . . . . . . . . . . . . . . . . 76 76 76 76 77 77 77 2 \ Amodel® PPA Design Guide Secondary Operations . . . . . . . . . . . . . . . . . . . 79 Welding . . . . . . . . . . . . . . . . . . . . . . . . . . . . . . . . . . Hot Plate Welding . . . . . . . . . . . . . . . . . . . . . . . . . . . Vibrational Welding . . . . . . . . . . . . . . . . . . . . . . . . . . Spin Welding . . . . . . . . . . . . . . . . . . . . . . . . . . . . . . Ultrasonic Welding . . . . . . . . . . . . . . . . . . . . . . . . . . 79 79 79 80 81 Adhesive Bonding . . . . . . . . . . . . . . . . . . . . . . . . . 81 Coatings and Surface Finishes . . . . . . . . . . . . . . . Vacuum Metallizing . . . . . . . . . . . . . . . . . . . . . . . . . . Laser Marking . . . . . . . . . . . . . . . . . . . . . . . . . . . . . . Inkjet Printing . . . . . . . . . . . . . . . . . . . . . . . . . . . . . . Overmolding . . . . . . . . . . . . . . . . . . . . . . . . . . . . . . . 82 82 82 82 83 Index . . . . . . . . . . . . . . . . . . . . . . . . . . . . . . . . . . 85 Introduction Amodel® Polyphthalamide (PPA) Amodel® PPA resins were commercialized in 1991. Polyphthalamide resin technology can produce a wide range of polymers that includes both semi-crystalline and amorphous resins. Since 1991, several base polymer formulations have been commercialized to meet specific industry needs. All of the commercial Amodel® products are semi-crystalline. The semi-crystalline grades of Amodel® PPA resins have excellent mechanical properties, outstanding dimensional stability, exceptional elevated thermal performance, and good processing characteristics. Amodel® resins bridge the cost/performance gap between the high-volume, moderate-performance engineering resins, such as thermoplastic polyesters and aliphatic nylons, and the low-volume, high-cost specialty thermoplastics, such as polyetheretherketone (PEEK). The Amodel® product portfolio contains well over 100 different grades. Each grade has been designed to have a unique balance of properties that are important for specific application and processing requirements. Applications for Amodel® PPA have been developed in a wide range of industries including automotive/ transportation, industrial equipment, water handling, telecommunications, electrical/electronic, coatings, composites, food service, and consumer goods. This manual is intended to be an easy-to-use reference tool for designers and fabricators interested in Amodel® PPA as a solution to their material needs. It includes property data for select grades of the portfolio as well as part design and processing recommendations. Chemistry Amodel® resins are classified in the general chemical family known as polyamides. Polyamides may be produced by the reaction of a difunctional organic acid with a difunctional amine, or the self-condensation of either an ω-amino acid or a lactam. Polyamides can be produced from a wide variety of acids and amines. The naming convention for polyamides uses the number of carbon atoms in the monomers with the diamine component first. Thus, a polyamide made from hexamethylene diamine and adipic acid is called polyamide 6,6 or nylon 6,6; the one made from hexamethylene diamine and dodecanedioic acid would be nylon 6,12. When an aromatic diacid is used instead of an aliphatic diacid, the nomenclature is modified to reflect the isomeric form of the aromatic diacid, and the term polyphthalamide may be used to distinguish these polymers from those of solely aliphatic raw materials. Polyamide 6,T produced by the condensation of hexamethylene diamine with terephthalic acid, has long been recognized for its excellent dimensional stability, low moisture absorption, high strength, and heat resistance. The fundamental problem preventing its commercialization has been that its high crystalline melting point of 370 °C (698 °F) is above its thermal decomposition temperature. Therefore, it cannot be processed by most conventional melt processing techniques, such as injection molding or extrusion. In addition, its melting point, among other factors, complicates the polymerization process. The basic polyamide 6,T technology has been modified by adding comonomers to produce the Amodel® family of polyphthalamide (PPA) resins which are composed of proprietary compositions of matter. Varying the amount and nature of the comonomers leads to a family of resins. All of these resins have melting points lower than polyamide 6,T and exhibit rapid crystallization. The thermal properties of the Amodel® PPA base resins are shown in Table 1.1. Table 1.1 A model® PPA base resin properties Base Resin Tg Tm [°C(°F)] [°C(°F)] A-1000 123 (253) 313 (595) A-4000 100 (212) 325 (617) A-5000 89 (192) 294 (561) A-6000 88 (190) 310 (590) Amodel® PPA Design Guide / 3 These base resins when combined with mineral, glassfiber, and/or other compounding ingredients provide a wide range of injection molding compounds that offer an excellent balance of processing and thermal/mechanical performance. Compounds based on A-1000 base resin require molds using oil for temperature control; compounds based on the other base resins can be processed using water controlled molds. Crystallinity Thermoplastics are often divided into two classes: amorphous and semi-crystalline. One of the major differences between amorphous and semi-crystalline polymers is the way their properties change in response to changes in temperature. Figure 1.1 shows a typical response of modulus to temperature change for amorphous and semi-crystalline polymers. Figure 1.1 M odulus changes with temperature Amorphous In the case of semi-crystalline polymers, the modulus also gradually decreases with increasing temperature. At or near the glass transition temperature, the modulus decreases rapidly to a lower but still useful level. Continuing to increase the temperature causes the modulus to remain at or near this new level (the crystalline plateau) until the melting point temperature (Tm ) is reached. At Tm, the modulus decreases rapidly again. Semi-crystalline polymers are often used at temperatures above their glass transition temperatures, but below their melting points, particularly when they are modified with glass fibers and/ or mineral fillers. When semi-crystalline polymers are processed, the amount of crystallinity can be affected by processing conditions. For example, Amodel® A-1000 PPA based products require mold surface temperatures of at least 135 °C (275 °F) for development of the maximum amount of crystallinity during injection molding. Products based on Amodel® A-4000 or A-6000 base resin will give high crystallinity at mold temperatures of about 80 °C (176 °F). Above the Tm, a semi-crystalline polymer melts, changing from the solid state to the liquid state. Modulus Tg The thermal capability of a semi-crystalline polymer is defined to a large extent by its Tg and Tm, as these values indicate the temperature ranges where the polymer has high stiffness (below Tg ), moderate stiffness (between Tg and Tm ), or no useful stiffness (above Tm ). Figure 1.2 shows the modulus versus temperature behavior of the Amodel® base resins as measured by dynamic mechanical analysis (DMA). Figure 1.2 Modulus versus temperature for Amodel® base resins Temperature Semi-crystalline Temperature [ °F ] 100 200 300 400 1,800 Modulus [ GPa ] Modulus 200 1,200 150 1,000 800 100 600 400 50 200 0 Temperature 0 0 50 100 150 200 Temperature [ °C ] When the temperature is raised, the modulus of amorphous polymers generally decreases slowly until the glass transition temperature (Tg ) is reached. At temperatures above the Tg, the modulus decreases rapidly. Therefore, amorphous thermoplastics are rarely used at temperatures higher than their glass transition temperature. 4 \ Amodel® PPA Design Guide 250 300 Modulus [ kpsi ] 1,400 Tm 250 A-1000 A-4000 A-6000 1,600 Tg 500 Moisture Effects Like other polymers, polyphthalamide resins absorb moisture from the environment. In general, polyphthalamides will absorb less water than aliphatic polyamides, like PA 6,6, and they will absorb the moisture at a slower rate. When an article made from an Amodel® product based on A-1000 base resin reaches equilibrium with a 100 % relative humidity (RH) atmosphere, the increase in weight due to moisture absorption will be roughly 5 % to 6 % of the polyphthalamide resin weight. Figure 1.3 compares the glass transition temperatures of Amodel® A-1000 resin and PA 6,6 at a range of moisture contents. These materials absorb moisture at different rates and they have different maximum moisture adsorption amounts. The most useful and practical comparison is achieved by plotting the Tg versus the equilibrium moisture content at various relative humidities. Dimensional change [ % ] 2.5 300 2.0 1.5 1.0 0.5 A-1000 PPA PA 6,6 250 0.0 200 150 100 Tg [ °F ] Tg [ °C ] A-1000 PPA PA 6,6 Not only do polyphthalamides absorb less moisture than typical polyamides, they do so much more slowly. The diffusion coefficient for water in Amodel® A-1000 resin is approximately 20 % of that for PA 6,6 at 23 °C (73 °F). Figure 1.4 Dimensional change vs. water immersion time Figure 1.3 E ffect of moisture on Tg 140 120 100 80 60 40 20 0 -20 -40 Figure 1.4 compares the dimensional change of Amodel® A-1000 resin to that of PA 6,6 after being immersed in water at 23 °C (73 °F). Results shown are for 3.2 mm (0.125 in.) thick plaques. After one year (about 8,800 hours), the dimensional change of the PA resin is approximately three times that of the PPA resin. 0 1,000 2,000 3,000 4,000 5,000 6,000 7,000 8,000 Time [ hours ] 50 0 -50 0 10 20 30 40 50 60 70 80 90 100 Relative humidity [ % ] Comparing dry PA 6,6 to dry Amodel® A-1000 resin, Amodel® resin has a Tg advantage of about 60 °C (108 °F). If the comparison is made at the 50 % RH equivalent moisture content, the Tg advantage of Amodel® resin is about 89 °C (160 °F). The exceptional dimensional stability and property retention of Amodel® polyphthalamide is due largely to the higher Tg and the fact that the Tg remains well above room temperature, even at the moisture content appropriate for 100 % RH. The Tg of PA 6,6, on the other hand, falls to -15 °C (5 °F) at moisture contents consistent with equilibria at 50 % to 60 % RH. Amodel® PPA Design Guide / 5 Product Data Amodel® Resin Property Tables Amodel® PPA resins are typically combined with reinforcements, fillers, impact modifiers, flame retardants, colorants, and other additives to achieve a wide range of performance profiles. Currently the family contains over 100 commercial grades. This document provides detailed property information on 12 grades that were selected to be representative of the product family. Your Solvay representative can help you select the most cost-effective material for your application. The base polymers are translucent white due to crystallinity, and the natural color of a specific product will vary depending on the additives used. Most grades are available in natural and black. Other colors can often be provided. Please discuss your color requirements with your Solvay representative. Table 2.1 Amodel® resin nomenclature system Position Characteristic Meaning/Example 1st letter Product family A = Amodel® E = extra Next letter(s) Optional descriptor E = electrical/electronic F = flame retardant P = paintable/plateable S = thick-wall parts (>3 mm) T = toughened - Hyphen 1st digit Base resin 1 = A-100x base resin 4 = A-400x base resin 5 = A-500x base resin 6 = A-600x base resin 9 = A-900x base resin 2nd digit Filler or reinforcement type 0 = unfilled 1 = glass 2 = mineral A 3 = mineral A + glass 4 = mineral B 5 = mineral B + glass 6 = carbon or graphite fiber 9 = glycol resistant 3rd and 4th digits Filler or reinforcement amount 33 = 33 % by weight 45 = 45 % by weight, etc. Space Next letter(s) Suffix HN = heat stabilized, not lubricated HS = heat stabilized HSL = heat stabilized and lubricated L = lubricated, not heat stabilized NL = neither lubricated nor heat stabilized V0 Z = UL 94 V0 at 0.8mm (0.032 in.) Space Next 2 letters Color code NT = natural, unpigmented BK = black WH = white, etc. 6 \ Amodel® PPA Design Guide Nomenclature Product Selection The Amodel PPA grade nomenclature system outlined in Table 2.1 is designed to communicate important compositional information. There are a few exceptions to this nomenclature, such as ET for extra tough grades and HFZ for high-flow grades. Solvay Specialty Polymers has the most comprehensive portfolio of PPA resins in the industry. Table 2.2 shows the relative performance of several Amodel® products to assist you in selecting the right product for your specific application. The products listed here are a good representation of the portfolio; however, there are many other grades not listed and one of these may be the perfect fit for you. It is recommended that you contact a Solvay Specialty Polymers representative before making a final product selection decision. Additional product selection resources and technical data can be found on the website. ® To illustrate, consider Amodel® AFA-6133 V0 BK324 which is a flame-retardant product (AFA) that uses an A-600x base resin containing 33 % glass fiber by weight (6133). It has a UL94 rating of V0 at 0.8 mm (0.032 in.) and is pigmented black with colorant formula 324. Table 2.2 Relative ranking of selected properties for major Amodel® PPA grades(1) Strength at RT Stiffness at RT Stiffness at 100 °C Impact Notched Deflection Temperature Specific Gravity A-1133 HS 9 6 8 4 7 6 A-1145 HS 9 8 8 7 7 7 A-6135 HN 8 7 6 5 8 4 A-4133 HS 7 6 5 4 9 4 AT-1002 HS 2 2 2 8 2 1 ET-1000 HS 1 1 1 9 1 1 AT-1116 HS 5 4 4 7 4 3 AT-6115 HS 4 3 3 6 4 3 6 8 7 5 6 8 A-1240 L 3 4 4 2 3 6 A-1565 HS 4 9 9 1 5 10 AS-1566 HS 8 9 9 3 6 9 Glass-Reinforced Grades Toughened Grades Toughened Glass-Reinforced Grades Flame Retardant Grades AFA-6133 V0 Z Mineral and Mineral/Glass Filled Grades (1) Properties ranked from 1 to 10, with 10 being the highest Amodel® PPA Design Guide / 7 Property Data Typical Properties The typical property data contained in the following short-term property tables fall within the normal range of product properties. Actual properties of individual batches will vary within specification limits. These values should not be used to establish specification limits, nor should they be used alone as the basis for part design. Accelerated Moisture Conditioning In general, polyamides absorb moisture from the atmosphere, and the absorbed moisture can affect some properties. To provide the design engineer with more relevant property information, polyamide suppliers customarily list properties as molded (dry) and also after moisture absorption. The convention is to list a 50 % RH value, which is intended to provide the property value after the material has achieved equilibrium with a 50 % relative humidity environment. This convention is appropriate for polyamide 6,6, because that polymer absorbs moisture quickly and many properties change significantly due to moisture. This approach is really not appropriate for polyphthalamides, because these materials absorb moisture slowly and most properties don’t change significantly due to moisture content. In order to be consistent with the industry, values after moisture absorption were generated. The correct way of preparing the samples with absorbed moisture is to place them in a 50 % RH environment and wait until constant weight, i.e. moisture equilibrium, is reached. The moisture absorption rate of Amodel® PPA is so slow, that more than two years would be required. Because of this, a method of accelerating the moisture absorption was developed. 8 \ Amodel® PPA Design Guide The accelerated moisture conditioning method used was to boil the test specimens in an aqueous solution containing 80 grams of potassium acetate per 100 grams of water for 96 hours. This procedure was developed empirically to approximate the moisture uptake of samples that were placed in a constant humidity chamber until equilibrium was achieved. Because the temperatures involved in this conditioning are between 100 °C and 130 °C (212 °F and 266 °F), some annealing takes place, and the 50 % RH modulus values are sometimes a few percent higher than the “dry, as molded” values. In addition, exposure to the aqueous conditioning media at these relatively high temperatures combined with an exposure time of 96 hours results in some hydrolysis of the glass/resin matrix interface. In many cases, the properties that depend on glass/resin adhesion, such as tensile strength, notched Izod, etc., are about 10 % lower than would have been obtained had the samples been allowed to condition to 50 % RH in air at room temperature. Table 3.1 Mechanical properties – glass-reinforced grades (US units) Method Temperature Units A-1133 HS A-1145 HS A-6135 HN AS-4133 HS ASTM Tensile strength 23 °C (73 °F) kpsi 32.0 37.5 29.4 29.0 D638 Tensile strength 50 % RH 23 °C (73 °F) kpsi 28.0 33.0 25.5 25.0 D638 Tensile strength 23 °C (73 °F) kpsi 33.8 38.1 30.6 30.6 527 100 °C (212 °F) kpsi 21.5 25.1 17.6 18.1 527 150 °C (302 °F) kpsi 11.5 12.3 13.4 12.7 527 175 °C (347 °F) kpsi 10.4 11.0 11.9 11.5 527 Tensile elongation 23 °C (73 °F) % 2.5 2.6 1.9 2.5 D638 Tensile elongation 50 % RH 23 °C (73 °F) % 2.1 2.1 2.1 2.2 D638 Tensile elongation 23 °C (73 °F) % 2.5 2.7 2.0 2.6 Property ISO 527 100 °C (212 °F) % 2.9 2.5 4.3 4.3 527 150 °C (302 °F) % 8.7 7.2 4.9 6.6 527 175 °C (347 °F) % 8.5 6.5 4.7 6.6 527 Tensile modulus 23 °C (73 °F) Mpsi 1.90 2.50 2.00 1.70 D638 Tensile modulus 50 % RH 23 °C (73 °F) Mpsi 1.90 2.50 1.77 1.70 D638 Tensile modulus 23 °C (73 °F) Mpsi 1.94 2.44 1.67 1.83 527 100 °C (212 °F) Mpsi 1.57 1.62 1.06 0.99 527 150 °C (302 °F) Mpsi 0.97 1.16 0.91 0.77 527 175 °C (347 °F) Mpsi 0.62 0.78 0.77 0.70 527 Flexural strength 23 °C (73 °F) kpsi 46.0 52.6 45.0 42.0 D790 Flexural strength 50 % RH 23 °C (73 °F) kpsi 36.9 42.7 36.1 35.0 D790 Flexural strength 23 °C (73 °F) kpsi 46.3 54.7 43.5 42.9 100 °C (212 °F) kpsi 33.0 38.7 24.7 25.6 178 150 °C (302 °F) kpsi 13.5 16.1 17.8 16.1 178 178 175 °C (347 °F) kpsi 11.5 13.7 16.2 14.4 Flexural modulus 23 °C (73 °F) Mpsi 1.65 2.00 1.65 1.60 D790 Flexural modulus 50 % RH 23 °C (73 °F) Mpsi 1.65 2.00 1.59 1.60 D790 Flexural modulus 178 23 °C (73 °F) Mpsi 1.68 2.31 1.65 1.51 178 100 °C (212 °F) Mpsi 1.42 1.89 0.96 1.04 178 150 °C (302 °F) Mpsi 0.58 0.78 0.71 0.67 178 175 °C (347 °F) Mpsi 0.52 0.71 0.67 0.61 Shear strength 23 °C (73 °F) kpsi 14.7 15.6 12.7 13.0 D732 178 Shear strength 50 % RH 23 °C (73 °F) kpsi 12.9 13.3 10.7 11.0 D732 Compressive strength 23 °C (73 °F) kpsi 26.9 28.1 21.4 26.0 D695 Poisson’s ratio 23 °C (73 °F) 0.41 0.41 0.39 0.41 Izod impact, notched 23 °C (73 °F) ft-lb/in 1.5 2.1 1.6 1.5 D256 Izod impact, notched 50 % RH 23 °C (73 °F) ft-lb/in 1.1 1.9 1.3 1.5 D256 Izod impact, unnotched 23 °C (73 °F) ft-lb/in 14 21 15 19 D4812 Izod impact, notched 23 °C (73 °F) ft-lb/in2 4.2 4.9 4.3 4.6 Izod impact, unnotched 23 °C (73 °F) ft-lb/in 2 23 29 30 28 180/1U Charpy impact 23 °C (73 °F) ft-lb/in2 4.5 4.9 4.4 5.1 179/1eA Charpy impact, unnotched 23 °C (73 °F) ft-lb/in2 35 44 28 32 Rockwell hardness 23 °C (73 °F) R 125 125 125 124 180/1A 179/1eU D785 Amodel® PPA Design Guide / 9 Table 3.2 Mechanical properties – glass-reinforced grades (SI units) Property Temperature Units A-1133 HS A-1145 HS A-6135 AS-4133 HN HS Method ASTM ISO Tensile strength 23 °C (73 °F) MPa 221 259 202 200 D638 Tensile strength 50 % RH 23 °C (73 °F) MPa 193 228 178 172 D638 Tensile strength 23 °C (73 °F) MPa 233 263 211 211 527 100 °C (212 °F) MPa 148 173 121 125 527 150 °C (302 °F) MPa 80 85 93 87 527 175 °C (347 °F) MPa 72 76 82 79 527 Tensile elongation 23 °C (73 °F) % 2.5 2.6 1.9 2.5 D638 Tensile elongation 50 % RH 23 °C (73 °F) % 2.1 2.1 2.1 2.2 D638 Tensile elongation 23 °C (73 °F) % 2.5 2.7 2.0 2.6 100 °C (212 °F) % 2.9 2.5 4.3 4.3 527 150 °C (302 °F) % 8.7 7.2 4.9 6.6 527 527 175 °C (347 °F) % 8.5 6.5 4.7 6.6 Tensile modulus 23 °C (73 °F) GPa 13.1 17.2 13.8 11.7 D638 Tensile modulus 50 % RH 23 °C (73 °F) GPa 13.1 17.2 12.2 11.7 D638 Tensile modulus 527 23 °C (73 °F) GPa 13.4 16.8 11.5 12.6 527 100 °C (212 °F) GPa 10.8 11.2 7.3 6.8 527 150 °C (302 °F) GPa 6.7 8.0 6.3 5.3 527 175 °C (347 °F) GPa 4.3 5.4 5.3 4.8 Flexural strength 23 °C (73 °F) MPa 317 363 310 290 D790 Flexural strength 50 % RH 23 °C (73 °F) MPa 254 294 249 241 D790 Flexural strength 527 23 °C (73 °F) MPa 319 377 300 296 178 100 °C (212 °F) MPa 227 267 171 176 178 150 °C (302 °F) MPa 93 111 123 111 178 175 °C (347 °F) MPa 80 95 112 100 Flexural modulus 23 °C (73 °F) GPa 11.4 13.8 11.4 11.0 D790 Flexural modulus 50 % RH 23 °C (73 °F) GPa 11.4 13.8 10.9 11.0 D790 Flexural modulus 23 °C (73 °F) GPa 11.6 15.9 11.4 10.4 178 100 °C (212 °F) GPa 9.8 13.0 6.6 7.2 178 Shear strength 178 150 °C (302 °F) GPa 4.0 5.4 4.9 4.6 178 175 °C (347 °F) GPa 3.6 4.9 4.6 4.2 178 23 °C (73 °F) MPa 101 108 88 90 D732 Shear strength 50 % RH 23 °C (73 °F) MPa 89 92 74 76 D732 Compressive strength 23 °C (73 °F) MPa 185 194 148 179 D695 Poisson’s ratio 23 °C (73 °F) 0.41 0.41 0.39 0.41 Izod impact, notched 23 °C (73 °F) J/m 80 110 85 80 D256 Izod impact, notched 50 % RH 23 °C (73 °F) J/m 60 100 70 70 D256 Izod impact, unnotched 23 °C (73 °F) J/m 770 1105 780 1030 D4812 Izod impact, notched 23 °C (73 °F) kJ/m 2 8.8 10.3 9.1 9.7 180/1A Izod impact, unnotched 23 °C (73 °F) kJ/m2 49 61 62 59 180/1U Charpy impact 23 °C (73 °F) kJ/m2 9.5 10.3 9.2 10.7 179/1eA Charpy impact, unnotched 23 °C (73 °F) kJ/m2 73 93 60 68 179/1eU Rockwell hardness 23 °C (73 °F) R scale 125 125 125 124 10 \ Amodel® PPA Design Guide D785 Table 3.3 Thermal, electrical, and general properties – glass-reinforced grades Method Units A-1133 HS A-1145 HS A-6135 HN AS-4133 HS ASTM Deflection temperature under load, 264 psi °C 285 287 291 300 D648 °F 545 549 556 572 Deflection temperature under load, 1.8 MPa °C 280 281 288 294 °F 536 538 550 561 °C 303 304 301 314 °F 577 580 573 597 Property ISO Thermal Vicat softening temperature Melting point 75AF D1525 306 D3418 11357-3 °C 313 310 310 327 °F 595 590 590 620 HB HB HB HB UL-94 V/mil 533 584 — 510 D149 kV/mm 21 23 — 21 Flammability, 3.2 mm (0.125 in.) bar Electrical Dielectric strength at 3.2 mm (0.125 in.) Dielectric strength at 1.6 mm (0.062 in.) Volume resistivity Surface resistivity Comparative tracking index V/mil 813 — — 813 kV/mm 32 — — 32 ohm-cm 1x10¹⁶ 1x10¹⁶ — 1x10¹⁶ ohms 15 — — 15 D257 550 550 — >600 D3638 4.4 4.6 — 3.8 D150 volts Dielectric constant at 60 Hz 1x10 1x10 D149 D257 Dielectric constant at 100 Hz 5.1 — — 4.6 D150 Dielectric constant at 10 6 Hz 4.2 4.4 — 3.6 D150 3.7 — — 3.6 D150 Dissipation factor at 60 Hz 0.005 0.005 — 0.004 D150 Dissipation factor at 10 6 Hz 0.017 0.016 — 0.012 D150 Dissipation factor at 10 9 Hz 0.016 — — 0.013 D150 1.48 1.59 1.45 1.45 D792 1183A 0.2 0.1 0.3 0.3 D570 62 9 Dielectric constant at 10 Hz General Specific gravity Moisture absorption, 24 hours % Mold shrinkage, flow direction % 0.4 0.2 0.6 0.5 D955 294-4 Mold shrinkage, transverse direction % 0.8 0.6 0.9 1.0 D955 294-4 Amodel® PPA Design Guide / 11 Table 3.4 Mechanical properties – toughened grades (US units) Property Tensile strength Method Temperature Units AT-1002 HS ET-1000 HS ASTM 23 °C (73 °F) kpsi 12.1 10.0 D638 D638 ISO Tensile strength 50 % RH 23 °C (73 °F) kpsi 11.1 9.1 Tensile stress at yield 23 °C (73 °F) kpsi 10.9 10.2 527 Tensile stress at break 23 °C (73 °F) kpsi 9.9 8.7 527 5.6 4.9 527 Tensile stress at yield 100 °C (212 °F) kpsi Tensile stress at break 100 °C (212 °F) kpsi 23 °C (73 °F) % 5.0 6.0 Tensile elongation at yield 527 D638 Tensile elongation at break 23 °C (73 °F) % 10-12 20.0 D638 Tensile elongation at break 50 % RH 23 °C (73 °F) % 30.0 18 D638 Tensile strain at yield 23 °C (73 °F) % 5.0 5.0 527 Tensile strain at break 23 °C (73 °F) % 10.0 7.0 527 Tensile strain at yield 100 °C (212 °F) % 3.7 4.3 527 Tensile strain at break 100 °C (212 °F) % >95 >95 Tensile modulus 23 °C (73 °F) kpsi 400 350 D638 527 Tensile modulus 50 % RH 23 °C (73 °F) kpsi 400 350 D638 Tensile modulus 23 °C (73 °F) kpsi 400 350 527 Tensile modulus 100 °C (212 °F) kpsi 305 290 527 Flexural strength 23 °C (73 °F) kpsi 14.9 15.8 D790 D790 Flexural strength 50 % RH 23 °C (73 °F) kpsi 10.6 12.4 Flexural strength 23 °C (73 °F) kpsi 11.5 10.2 178 Flexural strength 100 °C (212 °F) kpsi 7.2 6.4 178 Flexural modulus 23 °C (73 °F) kpsi 320 330 D790 Flexural modulus 50 % RH 23 °C (73 °F) kpsi 330 310 D790 Flexural modulus 23 °C (73 °F) kpsi 330 260 178 Flexural modulus 100 °C (212 °F) kpsi 250 190 178 Shear strength 23 °C (73 °F) kpsi 9.3 8.5 Shear strength 50 % RH 23 °C (73 °F) kpsi Poisson’s ratio 23 °C (73 °F) Izod impact, notched 23 °C (73 °F) ft-lb/in 8.3 D732 D732 0.38 0.39 2.4 17.0 D256 Izod impact, notched 50 % RH 23 °C (73 °F) ft-lb/in 2.6 20.0 D256 Izod impact, unnotched 23 °C (73 °F) ft-lb/in No break No break D4812 Izod impact, notched 23 °C (73 °F) ft-lb/in2 6.0 34.9 Izod impact, unnotched 23 °C (73 °F) ft-lb/in 2 84 No break 180/1U Charpy impact 23 °C (73 °F) ft-lb/in2 6.4 36.9 179/1eA Charpy impact, unnotched 23 °C (73 °F) ft-lb/in2 No break No break 179/1eU Rockwell hardness 23 °C (73 °F) R 119 120 12 \ Amodel® PPA Design Guide 180/1A D785 Table 3.5 Mechanical properties – toughened grades (SI Units) Method Temperature Units AT-1002 HS ET-1000 HS ASTM Tensile strength 23 °C (73 °F) MPa 83 69 D638 Tensile strength 50 % RH 23 °C (73 °F) MPa 76 63 D638 Tensile stress at yield 23 °C (73 °F) MPa 75 70 527 Tensile stress at break 23 °C (73 °F) MPa 68 60 527 Tensile stress at yield 100 °C (212 °F) MPa 39 34 527 Tensile stress at break 100 °C (212 °F) MPa – – 527 23 °C (73 °F) % 5.0 6.0 Property Tensile elongation at yield ISO D638 Tensile elongation at break 23 °C (73 °F) % 10-12 20.0 D638 Tensile elongation at break 50 % RH 23 °C (73 °F) % 30.0 18.0 D638 Tensile strain at yield 23 °C (73 °F) % 5.0 5.0 527 Tensile strain at break 23 °C (73 °F) % 10.0 7.0 527 Tensile strain at yield 100 °C (212 °F) % 3.7 4.3 527 Tensile strain at break 100 °C (212 °F) % >95 >95 Tensile modulus 23 °C (73 °F) GPa 2.8 2.4 D638 527 Tensile modulus 50 % RH 23 °C (73 °F) GPa 2.8 2.4 D638 Tensile modulus 23 °C (73 °F) GPa 2.8 2.4 527 Tensile modulus 100 °C (212 °F) GPa 2.1 2.0 527 Flexural strength 23 °C (73 °F) MPa 103 109 D790 D790 Flexural strength 50 % RH 23 °C (73 °F) MPa 73 85 Flexural strength 23 °C (73 °F) MPa 80 70 178 Flexural strength 100 °C (212 °F) MPa 50 44 178 Flexural modulus 23 °C (73 °F) GPa 2.2 2.3 D790 Flexural modulus 50 % RH 23 °C (73 °F) GPa 2.3 2.2 D790 Flexural modulus 23 °C (73 °F) GPa 2.3 1.8 178 Flexural modulus 100 °C (212 °F) GPa 1.8 1.3 178 Shear strength 23 °C (73 °F) MPa 64 59 D732 Shear strength 50 % RH 23 °C (73 °F) MPa D732 Poisson’s ratio 23 °C (73 °F) Izod impact, notched 23 °C (73 °F) J/m 57 – 0.38 0.39 130 905 D256 Izod impact, notched 50 % RH 23 °C (73 °F) J/m 140 1065 D256 Izod impact, unnotched 23 °C (73 °F) J/m No break No break D4812 Izod impact, notched 23 °C (73 °F) kJ/m 2 13 74 2 180/1A Izod impact, unnotched 23 °C (73 °F) kJ/m 177 No break 180/1U Charpy impact 23 °C (73 °F) kJ/m2 14 78 179/1eA Charpy impact, unnotched 23 °C (73 °F) kJ/m2 No break No break 179/1eU Rockwell hardness 23 °C (73 °F) 119 120 D785 Amodel® PPA Design Guide / 13 Table 3.6 Thermal, electrical, and general properties – toughened grades Property Method Units A-1002 HS ET-1000 HS ASTM °C 121 120 D648 °F 250 248 ISO Thermal Deflection temperature under load, 264 psi Deflection temperature under load, 1.8 MPa °C 118 109 °F 244 228 Vicat softening temperature °C 286 283 °F 547 542 Melting point °C 315 310 °F 599 590 HB HB UL-94 D149 Flammability, 3.2 mm (0.125 in.) bar 75AF D1525 306 D3418 11357-3 Electrical Dielectric strength at 3.2 mm (0.125 in.) V/mil 431 — kV/mm 17 — ohm-cm 1x10¹⁶ — Surface resistivity ohm 13 — D257 Comparative tracking index volts >600 — D3638 3.3 — D150 Volume resistivity Dielectric constant at 60 Hz 6 Dielectric constant at 10 Hz 8x10 D257 3.3 — D150 0.004 — D150 0.016 — D150 1.13 1.13 D792 1183A % 0.5 0.7 D570 62 Mold shrinkage, flow direction % 2.0 1.5 D955 294-4 Mold shrinkage, transverse direction % 2.1 1.5 D955 294-4 Dissipation factor at 60 Hz 6 Dissipation factor at 10 Hz General Specific gravity Moisture absorption, 24 hours 14 \ Amodel® PPA Design Guide Table 3.7 Mechanical properties – toughened glass-reinforced and flame retardant grades (US units) Property Tensile strength Method Temperature Units AT-1116 HS AT-6115 HS AFA-6133 V0 Z ASTM 23 °C (73 °F) kpsi 23.3 17.7 28.8 D638 D638 ISO Tensile strength 50 % RH 23 °C (73 °F) kpsi 19.0 13.9 24.1 Tensile strength 23 °C (73 °F) kpsi 23.2 16.5 27.0 527 100 °C (212 °F) kpsi 9.5 9.9 16.5 527 150 °C (302 °F) kpsi – – 10.9 527 175 °C (347 °F) kpsi – – 9.2 527 Tensile elongation 23 °C (73 °F) % 3.8 3.4 1.7 D638 Tensile elongation 50 % RH 23 °C (73 °F) % 2.8 5.3 1.7 D638 Tensile elongation 23 °C (73 °F) % 3.7 3.9 1.6 527 100 °C (212 °F) % 4.2 7.7 2.4 527 150 °C (302 °F) % – – 5.1 527 175 °C (347 °F) % – – 4.9 527 Tensile modulus 23 °C (73 °F) Mpsi 0.94 0.78 2.33 D638 Tensile modulus 50 % RH 23 °C (73 °F) Mpsi 1.03 0.97 1.99 D638 Tensile modulus 23 °C (73 °F) Mpsi 1.00 0.78 2.10 527 100 °C (212 °F) Mpsi 0.97 0.45 1.33 527 150 °C (302 °F) Mpsi – – 0.86 527 175 °C (347 °F) Mpsi – – 0.74 527 Flexural strength 23 °C (73 °F) kpsi 32.8 24.0 32.5 D790 Flexural strength 50 % RH 23 °C (73 °F) kpsi 29.1 16.7 33.2 D790 Flexural strength 23 °C (73 °F) kpsi 28.6 24.7 37.6 178 100 °C (212 °F) kpsi 20.5 9.7 23.3 178 150 °C (302 °F) kpsi – – 14.6 178 175 °C (347 °F) kpsi – – 12.7 Flexural modulus 23 °C (73 °F) Mpsi 0.87 0.64 1.90 D790 Flexural modulus 50 % RH 23 °C (73 °F) Mpsi 0.90 0.50 1.93 D790 Flexural modulus 178 23 °C (73 °F) Mpsi 0.97 0.62 1.83 178 100 °C (212 °F) Mpsi 0.72 0.34 1.17 178 150 °C (302 °F) Mpsi – – 0.72 178 175 °C (347 °F) Mpsi – – 0.67 Shear strength 23 °C (73 °F) kpsi 10.1 8.2 11.6 D732 Shear strength 50 % RH 23 °C (73 °F) kpsi 9.5 6.4 9.0 D732 kpsi D695 Compressive strength 23 °C (73 °F) Poisson’s ratio 23 °C (73 °F) Izod impact, notched 23 °C (73 °F) 18.0 14.5 21.1 0.40 0.39 0.37 ft-lb/in 1.8 1.7 1.6 178 D256 Izod impact, notched 50 % RH 23 °C (73 °F) ft-lb/in 0.9 1.5 1.5 D256 Izod impact, unnotched 23 °C (73 °F) ft-lb/in 18 16 13 D4812 Izod impact, notched 23 °C (73 °F) ft-lb/in 2 3.8 5.5 3.9 Izod impact, unnotched 23 °C (73 °F) ft-lb/in 2 25 26 21 180/1U Charpy impact 23 °C (73 °F) ft-lb/in2 4.3 5.2 6.6 179/1eA Charpy impact, unnotched 23 °C (73 °F) ft-lb/in2 41 36 22 Rockwell hardness 23 °C (73 °F) R scale 124 116 125 180/1A 179/1eU D785 Amodel® PPA Design Guide / 15 Table 3.8 Mechanical properties – toughened glass-reinforced and flame retardant grades (SI units) Method Temperature Units AT-1116 HS AT-6115 HS AFA-6133 V0 Z ASTM Tensile strength 23 °C (73 °F) MPa 161 122 199 D638 Tensile strength 50 % RH 23 °C (73 °F) MPa 131 96 166 D638 Tensile strength 23 °C (73 °F) MPa 160 114 186 527 100 °C (212 °F) MPa 66 68 114 527 Property ISO 150 °C (302 °F) MPa – – 75 527 175 °C (347 °F) MPa – – 63 527 Tensile elongation 23 °C (73 °F) % 3.8 3.4 1.7 D638 Tensile elongation 50 % RH 23 °C (73 °F) % 2.8 5.3 1.7 D638 Tensile elongation 23 °C (73 °F) % 3.7 3.9 1.6 527 100 °C (212 °F) % 4.2 7.7 2.4 527 150 °C (302 °F) % – – 5.1 527 175 °C (347 °F) % – – 4.9 527 Tensile modulus 23 °C (73 °F) GPa 6.5 5.4 16.1 D638 Tensile modulus 50 % RH 23 °C (73 °F) GPa 7.1 6.7 13.7 D638 Tensile modulus 23 °C (73 °F) GPa 6.9 5.4 14.5 527 100 °C (212 °F) GPa 6.7 3.1 9.2 527 150 °C (302 °F) GPa – – 5.9 527 175 °C (347 °F) GPa – – 5.1 527 Flexural strength 23 °C (73 °F) MPa 226 165 224 D790 Flexural strength 50 % RH 23 °C (73 °F) MPa 201 115 229 D790 Flexural strength 23 °C (73 °F) MPa 197 170 259 178 100 °C (212 °F) MPa 141 67 161 178 150 °C (302 °F) MPa – – 101 178 175 °C (347 °F) MPa – – 88 Flexural modulus 23 °C (73 °F) GPa 6.0 4.4 13.1 D790 Flexural modulus 50 % RH 23 °C (73 °F) GPa 6.2 3.4 13.3 D790 Flexural modulus 178 23 °C (73 °F) GPa 6.7 4.3 12.6 178 100 °C (212 °F) GPa 5.0 2.4 8.1 178 150 °C (302 °F) GPa – – 5.0 178 175 °C (347 °F) GPa – – 4.6 Shear strength 23 °C (73 °F) MPa 70 56 80 D732 Shear strength 50 % RH 23 °C (73 °F) MPa 66 44 62 D732 MPa D695 Compressive strength 23 °C (73 °F) Poisson’s ratio 23 °C (73 °F) Izod impact, notched 23 °C (73 °F) J/m 124 100 145 0.40 0.39 0.37 95 90 85 178 D256 Izod impact, notched 50 % RH 23 °C (73 °F) J/m 45 80 80 D256 Izod impact, unnotched 23 °C (73 °F) J/m 945 825 710 D4812 Izod impact, notched 23 °C (73 °F) kJ/m 2 8.1 11.6 8 Izod impact, unnotched 23 °C (73 °F) kJ/m 2 53 54 44 180/1U Charpy impact 23 °C (73 °F) kJ/m2 9.1 11.0 14.0 179/1eA Charpy impact, unnotched 23 °C (73 °F) kJ/m2 85 75 47 Rockwell hardness 23 °C (73 °F) R scale 124 116 125 16 \ Amodel® PPA Design Guide 180/1A 179/1eU D785 Table 3.9 Thermal, electrical, and general properties – toughened glass-reinforced and flame retardant grades AT-1116 HS AT-6115 HS °C 254 °F 489 Deflection temperature under load, 1.8 MPa °C Vicat softening temperature °F Property Method AFA-6133 V0 Z ASTM 271 277 D648 519 531 258 265 282 °F 497 509 540 °C 295 296 291 563 565 556 Units ISO Thermal Deflection temperature under load, 264 psi Melting point 75AF D1525 306 D3418 11357-3 °C 310 307 310 °F 590 585 590 HB HB V-0 UL 94 – 533 609 D149 21 24 711 686 28 27 1x10¹⁶ 1x10¹⁶ 15 15 D257 – D3638 Flammability, 3.2 mm (0.125 in.) bar Electrical Dielectric strength at 3.2 mm (0.125 in.) V/mil kV/mm Dielectric strength at 1.6 mm (0.062 in.) V/mil – kV/mm Volume resistivity ohm-cm Surface resistivity ohm Comparative tracking index volts – 1x10 – – 1x10 D149 D257 Dielectric constant at 60 Hz – – – D150 Dielectric constant at 100 Hz – 4.0 4.8 D150 Dielectric constant at 10 6 Hz – 3.3 4.1 D150 Dielectric constant at 10 Hz – 3.1 3.7 D150 Dissipation factor at 60 Hz – – – D150 Dissipation factor at 100 Hz – – – D150 Dissipation factor at 10 Hz – 0.013 0.011 D150 Dissipation factor at 10 9 Hz – 0.011 – D150 9 6 General Specific gravity 1.28 1.22 1.68 D792 1183A Moisture absorption, 24 hours % 0.2 0.2 0.2 D570 62 Mold shrinkage, flow direction % 0.6 1.0 0.3 D955 294-4 Mold shrinkage, transverse direction % 0.6 1.1 0.6 D955 294-4 Amodel® PPA Design Guide / 17 Table 3.10 Mechanical properties – mineral and mineral/glass filled grades (US units) Method Temperature Units A-1240 L Tensile strength 23 °C (73 °F) kpsi 15.0 Tensile strength 50 % RH 23 °C (73 °F) kpsi 13.5 17.9 25.4 Tensile strength 23 °C (73 °F) kpsi 15.1 20.0 29.0 527 100 °C (212 °F) kpsi 10.1 13.3 18.4 527 Property A-1565 HS AS-1566 HS ASTM 19.0 30.0 D638 D638 ISO 150 °C (302 °F) kpsi 4.2 6.7 7.6 527 175 °C (347 °F) kpsi 3.5 4.7 6.3 527 Tensile elongation 23 °C (73 °F) % 1.6 1.2 1.7 D638 Tensile elongation 50 % RH 23 °C (73 °F) % 1.2 1.2 1.8 D638 Tensile elongation 23 °C (73 °F) % 1.6 1.0 1.4 527 100 °C (212 °F) % 1.9 1.3 1.5 527 150 °C (302 °F) % 9.1 2.4 3.4 527 175 °C (347 °F) % 7.3 1.8 3.1 527 Tensile modulus 23 °C (73 °F) Mpsi 1.30 3.00 2.90 D638 Tensile modulus 50 % RH 23 °C (73 °F) Mpsi 1.20 3.02 3.03 D638 Tensile modulus 23 °C (73 °F) Mpsi 1.45 2.86 3.26 527 100 °C (212 °F) Mpsi 0.81 2.23 2.49 527 150 °C (302 °F) Mpsi 0.16 0.83 1.06 527 175 °C (347 °F) Mpsi 0.13 0.74 0.90 527 Flexural strength 23 °C (73 °F) kpsi 30.0 30.5 42.0 D790 Flexural strength 50 % RH 23 °C (73 °F) kpsi 25.6 28.4 38.1 D790 Flexural strength 23 °C (73 °F) kpsi 24.9 30.6 41.2 178 100 °C (212 °F) kpsi 17.6 23.6 29.7 178 150 °C (302 °F) kpsi 4.0 10.1 13.9 178 175 °C (347 °F) kpsi 3.2 8.1 11.0 178 Flexural modulus 23 °C (73 °F) Mpsi 1.10 2.60 2.70 D790 Flexural modulus 50 % RH 23 °C (73 °F) Mpsi 1.00 2.61 2.88 D790 Flexural modulus 23 °C (73 °F) Mpsi 1.00 1.32 2.98 178 100 °C (212 °F) Mpsi 0.87 0.99 2.44 178 150 °C (302 °F) Mpsi 0.16 0.36 1.06 178 175 °C (347 °F) Mpsi 0.13 0.33 0.93 Shear strength 23 °C (73 °F) kpsi 13.9 10.3 11.6 D732 Shear strength 50 % RH 23 °C (73 °F) kpsi 13.5 7.2 9.1 D732 Compressive strength 23 °C (73 °F) kpsi D695 Poisson’s ratio 23 °C (73 °F) Izod impact, notched 23 °C (73 °F) 26.8 27.4 25.3 0.29 0.31 0.35 ft-lb/in 0.9 0.7 1.2 178 D256 Izod impact, notched 50 % RH 23 °C (73 °F) ft-lb/in 0.6 0.6 1.0 D256 Izod impact, unnotched 23 °C (73 °F) ft-lb/in 7 7 13 D4812 Izod impact, notched 23 °C (73 °F) ft-lb/in2 2.2 1.9 3.1 Izod impact, unnotched 23 °C (73 °F) ft-lb/in 2 11 15 21 180/1U Charpy impact 23 °C (73 °F) ft-lb/in2 1.9 1.6 2.9 179/1eA Charpy impact, unnotched 23 °C (73 °F) ft-lb/in2 14 21 16 179/1eU Rockwell hardness 23 °C (73 °F) R scale 125 124 122 18 \ Amodel® PPA Design Guide 180/1A D785 Table 3.11 Mechanical properties – mineral and mineral/glass filled grades (SI units) Method Temperature Units A-1240 L Tensile strength 23 °C (73 °F) MPa 103 131 207 D638 Tensile strength 50 % RH 23 °C (73 °F) MPa 93 123 175 D638 Property Tensile strength A-1565 HS AS-1566 HS ASTM 23 °C (73 °F) MPa 104 138 200 527 100 °C (212 °F) MPa 70 92 127 527 150 °C (302 °F) MPa 29 46 53 527 175 °C (347 °F) MPa 24 32 44 Tensile elongation 23 °C (73 °F) % 1.6 1.2 1.7 D638 Tensile elongation 50 % RH 23 °C (73 °F) % 1.2 1.2 1.8 D638 Tensile elongation 527 23 °C (73 °F) % 1.6 1.0 1.4 527 100 °C (212 °F) % 1.9 1.3 1.5 527 150 °C (302 °F) % 9.1 2.4 3.4 527 175 °C (347 °F) % 7.3 1.8 3.1 Tensile modulus 23 °C (73 °F) GPa 9.0 20.7 20.0 D638 Tensile modulus 50 % RH 23 °C (73 °F) GPa 8.3 20.8 20.9 D638 Tensile modulus ISO 527 23 °C (73 °F) GPa 10.1 20.0 22.8 527 100 °C (212 °F) GPa 5.6 15.4 17.2 527 150 °C (302 °F) GPa 1.1 5.7 7.3 527 175 °C (347 °F) GPa 0.9 5.1 6.2 527 Flexural strength 23 °C (73 °F) MPa 207 210 290 D790 Flexural strength 50 % RH 23 °C (73 °F) MPa 177 196 263 D790 Flexural strength 23 °C (73 °F) MPa 172 211 284 178 100 °C (212 °F) MPa 121 162 205 178 150 °C (302 °F) MPa 27 70 96 178 175 °C (347 °F) MPa 22 56 76 178 23 °C (73 °F) GPa 7.6 17.9 18.6 D790 D790 Flexural modulus Flexural modulus 50 % RH 23 °C (73 °F) GPa 6.9 18.0 19.8 Flexural modulus 23 °C (73 °F) GPa 7.0 9.1 20.8 178 100 °C (212 °F) GPa 6.0 6.8 16.8 178 150 °C (302 °F) GPa 1.1 2.5 7.3 178 175 °C (347 °F) GPa 0.9 2.3 6.4 178 Shear strength 23 °C (73 °F) MPa 96 71 80 D732 Shear strength 50 % RH 23 °C (73 °F) MPa 93 50 63 D732 Compressive strength 23 °C (73 °F) MPa 185 189 174 D695 Poisson’s ratio 23 °C (73 °F) 0.29 0.31 0.35 Izod impact, notched 23 °C (73 °F) J/m 50 35 65 D256 Izod impact, notched 50 % RH 23 °C (73 °F) J/m 30 30 55 D256 Izod impact, unnotched 23 °C (73 °F) J/m 345 395 700 D4812 Izod impact, notched 23 °C (73 °F) kJ/m2 4.7 4.0 6.6 180/1A 23 °C (73 °F) kJ/m 2 24 31 44 180/1U 2 Izod impact, unnotched Charpy impact 23 °C (73 °F) kJ/m 4.1 3.4 6.2 179/1eA Charpy impact, unnotched 23 °C (73 °F) kJ/m2 29 44 34 179/1eU Rockwell hardness 23 °C (73 °F) R 125 124 122 D785 Amodel® PPA Design Guide / 19 Table 3.12 Thermal, electrical, and general properties – mineral and mineral/glass filled grades Property A-1240 L Units A-1565 HS AS-1566 HS Method ASTM ISO Thermal Deflection temperature under load, 264 psi °C 179 271 278 °F 355 520 532 Deflection temperature under load, 1.8 MPa °C 174 271 280 °F 346 520 536 Vicat softening temperature °C 302 296 298 °F 575 565 569 Melting point D648 75AF D1525 306 D3418 11357-3 °C 310 311 311 °F 590 592 592 HB HB HB UL-94 V/mil — — 737 D149 kV/mm — — 29 Volume resistivity ohm-cm 15 14 1x10¹⁶ D257 Surface resistivity ohm — — 1x10¹⁵ D257 Comparative tracking index volts 550 >600 — D3638 Flammability, 3.2 mm (0.125 in.) bar Electrical Dielectric strength at 1.6 mm (0.062 in.) 9x10 4x10 Dielectric constant at 60 Hz — — — D150 Dielectric constant at 100 Hz 4.2 — 5.7 D150 Dielectric constant at 10 6 Hz 4.0 — 4.7 D150 — — — D150 0.006 — — D150 0.017 — 0.011 D150 1.54 1.90 1.84 D792 Dissipation factor at 60 Hz Dissipation factor at 100 Hz 6 Dissipation factor at 10 Hz General Specific gravity 1183A Moisture absorption, 24 hours % 0.1 0.1 0.1 D570 62 Mold shrinkage, flow direction % 1.0 0.3 0.3 D955 294-4 Mold shrinkage, transverse direction % 1.0 0.5 0.5 D955 294-4 20 \ Amodel® PPA Design Guide Mechanical Properties Tensile Properties The mechanical properties of a material are of fundamental importance to engineers when designing a part. The designer must match the mechanical properties of various candidate materials to the performance requirements of each application in order to determine which material is suitable for a given part design. Conversely, the designer can use the material property values to achieve an optimum part design. Test methods Short-Term Mechanical Properties Short-term mechanical properties typically include tensile strength and modulus, flexural strength and modulus, several impact tests, compressive strength, shear strength, and surface hardness. These properties are usually reported at room temperature and at other temperatures as appropriate. Since some polymers absorb atmospheric moisture that may affect the properties, the moisture content may also be specified, often using the Relative Humidity (RH) convention. The data sheets provided by material suppliers typically list short-term properties, and their primary utility is for comparing similar materials. When using data sheets to compare materials, it is very important to insure that the same test methods have been used and that the data is reported in similar units. When parts are fabricated by a molding process they will likely contain a number of features such as stress concentrations, weld lines, corners or other aspects that may reduce strength. The strength of a material in an actual component may also be reduced, or in some cases enhanced, by reinforcing fiber orientation, relative degree of crystallinity, or thermal history (annealing). In addition, short-term properties do not provide any insight regarding time-related effects or the influence of chemical environments. When the applied stress is plotted against the resulting strain, a curve similar to that shown in Figure 3.1 for Amodel® ET-1000 HS resin is obtained. This is known as a stress/strain curve and is very useful in determining the short term behavior of a material when a load is applied. The curve of a ductile metal would have a similar shape. Figure 3.1 Typical stress/strain curve for Amodel® ET-1000 70 10 60 8 50 6 40 30 4 20 Stress [ kpsi ] The utility of short-term mechanical properties in design is limited. Typically, the properties are measured using molded test specimens that have been specifically designed to yield reproducible results, under carefully controlled environmental conditions, using specified loading rates. These measurements often provide the highest value obtainable for any property and material. For both test methods, tensile properties are determined by clamping each end of a test specimen in the jaws of a testing machine that applies a unidirectional axial force to the specimens at a specified rate. The force required to separate the jaws divided by the minimum cross-sectional area of the test specimen is defined as the tensile stress. The test specimen will elongate as a result of the stress being applied. The amount of elongation divided by the original length of the test specimen is the strain. Stress [ MPa ] To assist the designer, the material properties listed in this manual have been grouped into short-term or instantaneous and long-term or time-dependent properties. The short-term properties generally measure strength at failure while the long-term properties show how the material properties are affected by temperature, continuous loading, or chemical exposure as a function of time. There are two widely accepted methods of testing tensile properties: ASTM method D638 and ISO method 527. These test methods measure the same property, but slightly different test specimens and test procedures are used. If the same material is tested using both procedures, the results will be similar but not the same. Therefore, only values obtained using the same method should be compared. In this document, whenever a tensile property value is given, the test method is also given. In many cases values by both methods are provided. 2 10 0 0 0 5 10 15 20 Strain [ % ] Amodel® PPA Design Guide / 21 Figure 3.2 shows a typical stress/strain curve for a nonductile material, Amodel® A-1933 PPA. Strain at failure is much lower than that of the unreinforced grade. The addition of glass fiber reinforcement improves the strength and stiffness but reduces the elongation or strain at failure. arbitrarily designated strain level, usually 1 %. The tangent method has been removed from the ISO test method and replaced with a slope calculation based on specified strain values of 0.0005 and 0.0025. Alternatively, computerized machines can use the least squares method to calculate the slope over the same strain region. Figure 3.2 Typical stress/strain curve for Amodel® A-1933 The tangent method was used for the tensile data run by ASTM D638 presented in this brochure. 30 200 150 20 15 100 10 50 0 0.0 Stress [ kpsi ] Stress [ MPa ] 25 5 0 5 1.0 1.5 2.0 Strain [ % ] Ductile polymers undergo yield prior to rupture. At this point, the material undergoes additional elongation without an increase in stress. The stress level at which yield occurs is often referred to as tensile strength at yield or tensile stress at yield. The elongation achieved at this point is called the elongation at yield, yield strain or tensile strain at yield. As the test proceeds, the specimen continues to elongate until rupture occurs. The stress level at this point is called tensile strength at break, ultimate tensile strength or tensile stress at break. Tensile strength is defined as the greater of the measured stresses, which could be either the stress at yield or the stress at rupture. Tensile property comparison The initial portion of the stress/strain curve is also of special interest because its slope relates to the stiffness or modulus of the material as shown in Figure 3.3. Figure 3.3 Secant and tangent methods for estimating modulus Amodel® A-1133 HS resin has higher tensile strength at room temperature than 33 % GR polyamide (PA) 6,6, 30 % GR polyphenylene sulfide (PPS), and 30 % GR polyetherimide (PEI), as shown in Figure 3.4. Even after moisture conditioning, Amodel® PPA is stronger than the other resins. Figure 3.4 Tensile strength of 30 % – 33 % GR resins DAM 50% RH Strain [ % ] This figure shows that the strain is directly proportional to stress up to a certain amount of stress. This region is known as the “Hookean” or elastic region. The maximum stress level that results in a proportional amount of strain is known as the proportional limit. The tensile or elastic modulus is the slope of the stress/ strain curve when a specimen is subjected to a tensile loading. Since the stress/strain plot is non-linear above the proportional limit, some conventions have been developed to standardize the measurements and reduce the variability in test results. One method uses the slope of a line drawn tangent to the curve. Another method utilizes the slope of a secant drawn through the origin and some 22 \ Amodel® PPA Design Guide Tensile strength [ MPa ] Stess/strain curve Secant Tangent 30 25 150 20 15 100 10 50 0 5 A-1133 HS PA 6,6 PPS PEI 0 Tensile strength [ kpsi ] Stress [ MPa ] 200 The tensile modulus of 33 % GR Amodel® PPA is compared to the same resins in Figure 3.5. The Amodel® resin has a higher modulus as molded and shows no decline when moisture conditioned, while the PA 6,6 exhibits a reduction of over 20 %. Figure 3.7 Tensile strength of 33 % GR PPA vs. temperature Temperature [ °F ] 50 1.5 10 8 1.0 6 4 0.5 Tensile modulus [ Mpsi ] Tensile modulus [ GPa ] 12 2.0 30 200 150 20 100 50 0 0 50 PPS PEI Figure 3.6 Tensile elongation of 30 % – 33 % GR resins Tensile elongation [ % ] 5 DAM 50% RH Temperature [ °F ] 50 100 150 200 250 300 350 14 2.0 12 1.5 10 8 1.0 6 4 0 0 3 0.5 A-1133 HS A-4133 L A-6135 HN 2 4 50 0.0 100 150 200 Temperature [ °C ] 2 Figure 3.9 Tensile elongation of 33 % GR PPA vs. temperature 1 Temperature [ °F ] 50 PA 6,6 PPS PEI Tensile properties for GR PPA vs. temperature Figures 3.7 through 3.9 show the tensile properties of GR grades of Amodel® PPA based upon A-1000, A-4000, and A-6000 base resins from RT to 175 °C (347 °F). Amodel® A-1133 HS has the highest strength and stiffness at room temperature, but A-4133 L and A-6135 HN have better strength and stiffness above 150 °C (302 °F). 10 100 150 200 250 300 350 10 A-1133 HS A-4133 L A-6135 HN 8 8 6 6 4 4 2 2 Tensile elongation at break [ % ] A-1133 HS Tensile elongation at break [ % ] 0 200 Tensile modulus [ Mpsi ] This same comparison for tensile elongation is shown in Figure 3.6. The tensile elongation of the resins is low due to the glass fiber reinforcement. Moisture conditioning the PA 6,6 results in an increase in elongation due to the reduction in Tg. 150 Figure 3.8 Tensile modulus of 33 % GR PPA vs. temperature Tensile modulus [ GPa ] A-1133 HS PA 6,6 0.0 0 100 Temperature [ °C ] 2 0 10 A-1133 HS A-4133 L A-6135 HN Tensile strength [ kpsi ] DAM 50% RH Tensile strength [ MPa ] Figure 3.5 Tensile modulus of 30 % – 33 % GR resins 14 100 150 200 250 300 350 250 0 0 0 50 100 150 200 Temperature [ °C ] Amodel® PPA Design Guide / 23 Figure 3.12 Tensile elongation of GR A-1000 PPA grades vs. temperature Tensile properties of A-1000 GR grades at elevated temperatures Figures 3.10 through 3.14 show the tensile properties of three glass-reinforced grades of Amodel® PPA based on the A-1000 base resin containing 33 %, 45 % and 60 % glass fiber from room temperature (RT) to 175 °C (347 °F). The tensile strength and modulus increase with glass fiber content, which is typical of semi-crystalline thermoplastics. Temperature [ °F ] 50 8 6 4 4 2 2 0 0 0 50 10 A-1133 HS A-1145 HS A-1160 HSL 50 0 0 50 Tensile strength [ MPa ] Tensile strength [ MPa ] 15 100 5 150 150 20 15 100 10 50 5 0 0 200 50 100 150 200 250 300 350 3.0 2.5 15 2.0 1.5 10 1.0 5 0.5 0 0.0 50 100 Temperature [ °C ] 24 \ Amodel® PPA Design Guide 150 200 Tensile modulus [ GPa ] 3.5 3.5 A-1240 L A-1340 HS A-1565 HS AS-1566 HS 20 3.0 2.5 15 2.0 1.5 10 1.0 5 0.5 0 0.0 0 50 100 Temperature [ °C ] 150 200 Tensile modulus [ Mpsi ] 4.0 20 0 100 150 200 250 300 350 25 Tensile modulus [ Mpsi ] Tensile modulus [ GPa ] 50 A-1133 HS A-1145 HS A-1160 HSL 200 Temperature [ °F ] Temperature [ °F ] 25 150 Figure 3.14 Tensile modulus of mineral/glass PPA grades vs. temperature Figure 3.11 Tensile modulus of GR A-1000 PPA grades vs. temperature 30 100 Temperature [ °C ] Temperature [ °C ] 50 25 0 0 100 30 A-1240 L A-1340 HS A-1565 HS AS-1566 HS Tensile strength [ kpsi ] 20 150 Tensile strength [ kpsi ] 25 200 100 150 200 250 300 350 200 35 200 150 Temperature [ °F ] 50 30 100 Temperature [ °C ] 100 150 200 250 300 350 250 8 6 Temperature [ °F ] 300 10 A-1133 HS A-4133 L A-6135 HN Figure 3.13 Tensile strength of mineral/glass PPA grades vs. temperature Figure 3.10 Tensile strength of GR A-1000 PPA grades vs. temperature 50 100 150 200 250 300 350 Tensile elongation at break [ % ] Both strength and modulus decrease as temperatures rise. Elongation increases with increasing temperature. As a semi-crystalline material, Amodel® resins show a slow but steady loss in mechanical properties from ambient temperature up to the glass transition temperature (Tg ). At the Tg, there is a more significant loss over a narrow temperature range, followed by another gradual decline. This behavior is typical of all semi-crystalline thermoplastics. Tensile elongation at break [ % ] 10 Test methods The two test methods differ in test specimen dimensions, apparatus specifications, maximum deflection, and calculation details. The three-point loading refers to the specimen being supported at two points separated by a specified span and a vertical load applied to the top of the test specimen at a point midway between the supports. The test specimen deforms or bends as a result of the load. The specimen is deflected until rupture occurs or the maximum fiber strain is reached. The flexural strength is defined as the maximum fiber stress at the moment of rupture or maximum strain. The maximum strain specified by the ISO 178 method is 3.5 %, while ASTM D790 specifies 5 %. The flexural modulus of elasticity is the ratio, within the elastic limit, of the stress in the outermost fiber of the object being stressed to corresponding strain. As in tensile testing, the modulus is calculated from the slope of the load deflection curve in the linear “Hookean” region. Flexural testing provides information about the relative strength and stiffness of materials when subjected to bending loads. The material with the higher flexural strength can endure higher bending loads without fracture. Parts produced from a material with a higher flexural modulus will deflect less when subjected to a bending load than parts made of a lower modulus material. Figure 3.15 Flexural strength of 30 % – 33 % GR resins 300 DAM 50% RH 45 40 250 35 200 30 25 150 20 15 100 10 50 0 5 A-1133 HS PA 6,6 PPS PEI 0 This comparison for flexural modulus is shown in Figure 3.16. The flexural modulus of the Amodel® resin shown is quite high and it is not affected by moisture conditioning. The modulus of the PA 6,6 material declines significantly with moisture conditioning. Figure 3.16 Flexural modulus of 30 % – 33 % GR resins 12 DAM 50% RH 10 1.6 1.4 1.2 8 1.0 6 0.8 0.6 4 0.4 2 0 Flexural modulus [ Mpsi ] When the flexural properties of one material are determined by both methods, the results obtained by the ASTM are different from those obtained using the ISO method. Data by both methods are shown in the property tables. When comparing materials, ensure that the data being compared was obtained using the same test method and test condition. The flexural strength of 33 % GR Amodel® PPA is compared to that of comparable PPS, PEI, and PA 6,6 materials in Figure 3.15. Amodel® PPA’s strength is superior to the other resins. Although it declines somewhat with moisture conditioning, it is still higher than most of the other materials as molded. Flexural strength [ kpsi ] Flexural properties of thermoplastic materials are determined in accordance with either ASTM D790 or ISO 178. ASTM D790 includes a three-point loading test (Method I) and a four-point loading test (Method II). In this document, whenever D790 is referenced, Method 1 was used. ISO 178, Plastics - Determination of Flexural Properties, specifies three-point loading. Flexural property comparison Flexural strength [ MPa ] Like tensile strength and modulus, the flexural strength and modulus of a plastic material can be increased by adding glass fibers to the plastic resin. Treatment of the glass fibers can produce a strong chemical bond between the plastic and the glass that enhances both tensile and flexural properties over a wide range of environmental conditions. As the amount of glass fiber reinforcement is increased in the plastic, both the flexural strength and modulus increase. Glass fibers and mineral additives increase the flexural strength and modulus of Amodel® PPA compared to the unfilled resin. The resultant higher modulus may be desirable in many applications. Flexural modulus [ GPa ] Flexural Properties 0.2 A-1133 HS PA 6,6 PPS PEI 0.0 Amodel® PPA Design Guide / 25 Flexural properties at elevated temperatures Figures 3.17 and 3.18 show the flexural properties of three glass-reinforced Amodel® grades based on A-1000, A-4000, A-6000 base resins from room temperature up to 175 °C (347 °F). The grade based on A-1000 has higher strength and stiffness and room temperature, but the grades based on A-4000 and A-6000 are better at temperatures above 125 °C (257 °F). Figures 3.19 and 3.20 present the flexural properties of Amodel® PPA resins based on A-1000 containing different glass reinforcement levels. As expected, the higher glass content grades have the higher strength and stiffness across the temperature range. Figure 3.19 Flexural strength of GR A-1000 PPA grades vs. temperature Temperature [ °F ] Figure 3.17 Flexural strength of GR PPA resins vs. temperature 50 40 250 30 200 150 20 100 10 A-1133 HS A-4133 L A-6135 HN 50 0 0 50 100 0 1.2 1.0 6 0.8 0.6 4 0.4 A-1133 HS A-4133 L A-6135 HN 100 Temperature [ °C ] 26 \ Amodel® PPA Design Guide 0.2 0.0 150 200 Flexural modulus [ GPa ] Flexural modulus [ GPa ] 8 150 200 100 150 200 250 300 350 A-1133 HS A-1145 HS A-1160 HSL 25 4.0 3.5 3.0 20 2.5 15 2.0 1.5 10 1.0 5 0.5 0 0.0 0 50 100 Temperature [ °C ] 150 200 Flexural modulus [ Mpsi ] 1.4 Flexural modulus [ Mpsi ] 10 0 100 30 1.6 50 50 10 Temperature [ °F ] 100 150 200 250 300 350 12 0 A-1133 HS A-1145 HS A-1160 HSL 50 1.8 0 20 100 0 Temperature [ °F ] 2 30 200 Figure 3.20 Flexural modulus of GR A-1000 PPA grades vs. temperature 200 [ °CGR ] Figure 3.18 FlexuralTemperature modulus of PPA resins vs. temperature 50 40 Temperature [ °C ] 0 150 Flexural strength [ MPa ] 300 Flexural strength [ kpsi ] Flexural strength [ MPa ] 50 50 300 Flexural strength [ kpsi ] 100 150 200 250 300 350 350 60 400 Temperature [ °F ] 50 100 150 200 250 300 350 Figure 3.21 Flexural strength of mineral/glass PPA resins vs. temperature Shear Properties 50 100 150 200 250 300 350 A-1240 L A-1340 HS A-1565 HS AS-1566 HS 250 200 40 35 30 25 150 20 15 100 10 50 Flexural strength [ kpsi ] Flexural strength [ MPa ] 300 5 0 0 0 50 100 150 200 Temperature [ °C ] Figure 3.22 Flexural modulus of mineral/glass PPA resins vs. temperature Temperature [ °F ] 50 100 150 200 250 300 350 3.5 A-1240 L A-1340 HS A-1565 HS AS-1566 HS 20 3.0 2.5 15 2.0 1.5 10 0.5 0 0.0 0 50 100 Temperature [ °C ] 150 200 Shear strength was determined in accordance with ASTM D732. In this test, a plaque molded from the material to be tested is placed on a plate with a circular hole in it. A circular punch whose diameter is slightly smaller than the hole in the plate is pushed through the molded plaque, punching out a circular disc. The maximum stress is reported as the shear strength and is calculated by dividing the load required to shear the specimen by the sheared area, which is calculated by multiplying the circumference of the hole by the thickness of the plaque. Figure 3.23 compares the shear strength of Amodel® PPA to PA 6,6, PPS, and PEI. The shear strength of Amodel® PPA is comparable to that of PA 6,6 and PEI and superior to that of PPS. Figure 3.23 Shear strength of 30 % – 33 % GR resins 120 DAM 50% RH 100 14 12 80 10 60 8 6 40 4 20 0 16 Shear strength [ kpsi ] 1.0 5 Flexural modulus [ Mpsi ] Flexural modulus [ GPa ] 25 Shear strength is the resistance to yield or fracture of two planes moving relative to one another in the direction of load. Shear strength can also be defined as the maximum load required to shear the specimen being tested in such a manner that the moving plane has completely cleared the stationary plane. Shear strength values are important in designing structural components because in actual applications the maximum stress on a component is often a shear stress. Shear strength [ MPa ] Temperature [ °F ] 2 A-1133 HS PA 6,6 PPS PEI 0 Amodel® PPA Design Guide / 27 250 25 150 20 15 100 10 50 5 A-1133 HS PA 6,6 PPS PEI 0 Figure 3.25 Compressive strength of A-1000 resins vs. temperature Temperature [ °F ] Compressive strength [ MPa ] 50 100 150 200 250 300 A-1133 HS A-1145 HS A-1160 HSL 200 150 30 25 20 15 100 10 50 5 Compressive strength [ kpsi ] The ability of a plastic part to absorb energy is a function of its shape, size, thickness, and the type of plastic used to make the part. The impact resistance testing methods most frequently used may not adequately provide the designer with information that can be used analytically. These tests are most useful for determining relative impact resistance and comparing the notch sensitivities of materials. While the results may not adequately predict practical toughness in actual applications, they will serve to offer comparisons between materials. 30 200 0 Impact Strength Because polymers are viscoelastic, their properties depend upon the rate at which a load is applied. When the loading rate is rapid, the part is said to be subjected to impact loading. If a plastic part is to survive an impact without damage, it must be able to absorb the kinetic energy transferred by the collision. 35 Compressive strength [ kpsi ] Compressive strength and modulus are measured in accordance with ASTM D695. The test specimen is molded from the material to be tested and then placed between parallel plates. These plates then exert a compressive force on the specimen, while the force and the distance between the parallel plates is monitored. The compressive strain is given by the change in the distance between the plates. The stress at failure, calculated by dividing the force by the cross-sectional area, is the compressive strength, and the slope of the stress/strain curve is the compressive modulus. Figure 3.24 Compressive strength of 30 % – 33 % GR resins Compressive strength [ MPa ] Compressive Strength and Modulus 0 0 0 20 40 60 80 100 120 140 160 Temperature [ °C ] Figure 3.26 Compressive modulus of A-1000 resins vs. temperature Temperature [ °F ] 100 150 200 250 300 A-1133 HS A-1145 HS A-1160 HSL 12 10 8 1.0 6 4 0.5 2 0.0 0 0 20 40 60 80 100 120 140 160 Temperature [ °C ] 28 \ Amodel® PPA Design Guide 1.5 Compressive modulus [ Mpsi ] Compressive modulus [ GPa ] 50 Izod (Cantilevered Beam) Impact Izod impact can be determined using ASTM D256, Impact Resistance of Plastics and Electrical Insulating Materials, or ISO 180, Plastics – Determination of Izod Impact Strength. In both of these tests, a test specimen, as illustrated in Figure 3.27, with a notch of specified radius cut in its edge is struck by a swinging pendulum. After the impact, the pendulum continues to swing, but with less energy due to the collision. The methods differ in the dimensions of the test specimen and in the way the results are calculated. When using ASTM D256, the energy lost is divided by the width of the specimen remaining after notching, and the units are either Joules per meter (J/m) or foot-pounds per inch (ft-lb/in.). When using ISO 180, the amount of energy lost is multiplied by 1,000 and divided by the product of the remaining width and the specimen thickness, and the units are either kiloJoules per square meter (kJ/m2) or foot-pounds per square inch (ft-lb/in2). Figure 3.27 Izod impact test specimen Data using both methods are included in this document. The dimensions for the test specimens used are given in Table 3.13. Table 3.13 Izod test specimen dimensions ISO 180 ASTM D256 [mm (inch)] [mm (inch)] Length 80.00 (3.150) 63.50 (2.500) Width Dimension 10.00 (0.394) 12.70 (0.500) Thickness 4.00 (0.157) 3.20 (0.125) Notch radius 0.25 (0.010) 0.25 (0.010) Izod impact property comparison Figure 3.28 shows a comparison of the notched Izod impact strength of 33 % glass fiber reinforced Amodel® PPA to glass fiber reinforced grades of PA 6,6, PPS, and PEI. The glass fiber reinforcement adds strength to these materials but reduces elongation, and all of these materials have low Izod values. PA 6,6 shows an increase in impact strength when moisture conditioned. Figure 3.28 Izod impact strength of 30 % – 33 % GR resins, ASTM D256 Impact Clamp Izod impact strength [ J/m ] Notch radius 2.0 100 80 1.5 60 1.0 40 0.5 20 0 Izod impact can also be run on un-notched specimens. The applicable test methods are ASTM D4812 or ISO 180U. The major difference between these methods and the notched methods is that the full width of the specimen is used in the calculation. 2.5 120 A-1133 HS PA 6,6 PPS PEI Izod impact strength [ ft-lb/in ] DAM 50% RH 140 0.0 Amodel® PPA Design Guide / 29 Figure 3.29 shows the Izod impact strength of a toughened grade of Amodel® PPA, ET-1000 HS, and that of high impact grades of PA 6,6 and PA 6, as well as polycarbonate (PC) and a polycarbonate-polyester (PC/PBT) blend. The Amodel® grade has impact strength comparable to or better than the other materials. Figure 3.30 shows that this grade is not as sensitive to notch radius as most amorphous polymers are. Figure 3.31 shows that ET-1000 HS has good Izod impact at temperatures lower than room temperature, but Amodel® AT-1001 L has superior impact resistance at temperatures as low as -40 °C (-40 °F). Figure 3.31 Low temperature Izod of Amodel® PPA grades Temperature [ °F ] -40 Figure 3.29 Izod impact of Amodel® ET-1000 compared to PA and PC 12 10 8 400 6 4 200 ET-1000 HS PA 6,6 PA6 PC PC/PBT 10 15 20 Izod impact [ J/m ] 15 600 10 400 Polycarbonate ET-1000 HS Standard radius 200 5 0 0.2 0.3 0.4 Notch radius [ mm ] 30 \ Amodel® PPA Design Guide 0.5 0.6 Izod impact [ ft-lb/in ] 800 0.1 15 800 600 10 400 200 AT-1001 L ET-1000 HS 0 10 5 0 20 Charpy (supported beam) impact 1,000 0 0.0 20 Temperature [ °C ] Notch radius [ mils ] 5 60 1,000 0 Figure 3.30 Notch radius sensitivity of ET-1000 HS and PC 0 40 25 0 -50 -40 -30 -20 -10 2 0 Izod impact [ J/m ] Izod impact [ J/m ] 14 Izod impact [ ft-lb/in ] 16 600 20 1,200 18 800 0 1,400 Izod impact [ ft-lb/in ] 1,000 -20 Charpy is similar to Izod because a test specimen is struck by a falling pendulum and the energy to break the specimen measured. The primary difference is that in the Charpy test the specimen is supported at both ends and struck in the middle, as shown in Figure 3.32. The test methods used were ISO 179/1eA and 179/1eU. Figure 3.32 Charpy impact test specimen Support blocks Test specimen Impact DAM 50% RH 14 2.0 12 1.5 10 8 1.0 6 4 0.5 2 0 A-1133 HS PA 6,6 PPS PEI Table 3.14 Penetration impact of impact modified PPA, ASTM D3763 Charpy impact strength [ ft-lb/in2 ] Charpy impact strength [ kJ/m2 ] Figure 3.33 Notched charpy impact strength of 30 % – 33 % GR resins Max Load Grade Total Energy Condition N lb J ft-lb DAM 4,900 1,100 54 40 AT-1001 L AT-1002 HS DAM 4,400 1,000 54 40 AT-1002 HS 50 % RH 4,000 900 47 35 AT-5001 DAM 4,400 1,000 54 40 AT-5001 50 % RH 4,000 900 50 37 ET-1000 HS DAM 4,670 1,050 54 40 ET-1001 L DAM 5,600 1,260 64 47 0.0 Falling weight impact properties ASTM D3763, High-Speed Puncture Properties of Plastics Using Load and Displacement Sensors, was used to measure the practical toughness of Amodel® polyphthalamide resins. In this test, an injection molded specimen is clamped down over a 76 mm (3 in.) diameter hole and a weighted plunger is dropped from a predetermined height to give it a predetermined impact velocity. The plunger assembly consists of a 12.7 mm (0.500 in.) diameter steel rod with a hemispherical end. The plunger assembly is attached to a load cell which measures the energy needed to cause a sample to fail. Specimens can fail in either a brittle or a ductile mode. In a ductile failure mode, the specimen is permanently deformed to the shape of the plunger, but remains in one piece after the penetration by the plunger. In a brittle failure mode, the specimen does not have sufficient ductility to be deformed without failure, and therefore breaks into two or more pieces when impacted by the plunger. Poisson’s Ratio Poisson’s ratio is a measure of the strain characteristics imposed on a material transverse to the applied load. Poisson’s ratio is the ratio of lateral strain to longitudinal strain within the proportional limit. To illustrate, consider a cylindrical bar subjected to tensile stress: the length (L) increases and simultaneously its diameter (D) decreases. In this case, Poisson’s ratio (υ) would be calculated by: -ΔD D υ= ΔL L Most plastic materials have a Poisson’s ratio between 0.3 and 0.5. This method is preferred to ASTM D3029, because although the impact values obtained are similar in natureto the “stair step” falling weight impact test, the instrumented test results are obtained via a computerized data reduction technique and fewer samples are required. Amodel® PPA Design Guide / 31 Table 3.15 gives the Poisson’s ratios for various Amodel® formulations at 23 °C (73 °F), “dry, as molded”. Table 3.15 Poisson’s ratio for Amodel® products Grade Poisson’s Ratio [υ] ET-1000 HS 0.40 A-1115 HS 0.41 AS-1133 HS 0.41 AS-1145 HS 0.41 A-1230 L 0.31 A-1240 L 0.29 A-1340 HS 0.38 Long-term Mechanical Properties In order for any engineered component fabricated from a polymeric resin to perform within specified parameters throughout its intended design life, the design engineer must consider the long term effects of a number of factors. A variety of stress loads as well as property changes due to environmental factors must be taken into consideration. To assess the time related effects of stress on the behavior of polymeric materials, creep and fatigue properties are measured. A wide variety of environmental factors can also affect the performance of an engineered component which is discussed in detail in the section entitled “Environmental Resistance” starting on page 56. However, certain environmental factors are so pervasive that it was deemed appropriate to consider them in this section. These are the effects of moisture absorption and long-term exposure to high ambient temperatures. This section will present data generated to assist the design engineer with the analysis of design life requirements. The data in this section includes: • Creep modulus in tension, flexure, and compression modes • Tensile creep rupture • Fatigue endurance • Property changes due to moisture absorption • Dimensional changes due to moisture absorption • Property changes due to long-term exposure to elevated temperatures 32 \ Amodel® PPA Design Guide The long-term property data presented in this manual have been generated to show trends and property loss for a number of Amodel® PPA grades under a variety of representative conditions. Due to the time required to generate the data, not all grades or sets of conditions can be included. The data are intended to show trends as a function of filler/reinforcement systems so that the designer may make educated decisions. In some instances, attempts to generate data on long term properties utilize “accelerated” test conditions to speed data acquisition. Caution should be taken when evaluating data generated in this manner as it is often non-linear. This is especially true when measuring property loss as a function of elevated temperature and/or chemical exposure. Thermal “thresholds” such as the glass transition temperature (Tg ) and, ultimately, the melting point are the main contributors to this nonlinear behavior. Creep When a material is subjected to stress, an immediate strain occurs. For small strains, this strain is proportional to the stress and calculable from the appropriate modulus. If the application of stress continues for an extended period of time, additional strain may be observed. This behavior is referred to as creep and the additional strain as creep strain. While creep is observed in metals, the phenomenon is more significant with plastics. Their lower modulus means that at the same stress level, the magnitude of the strain is larger and a higher proportion of ultimate strain. In general, the closer the initial strain is to the ultimate strain, the more likely it is that creep is significant. The reality of creep must be factored into a design to ensure long term satisfactory performance. The initial task is to determine if the creep will have a significant effect on the dimensions or function of the part. If the stress levels are low enough so that any dimensional change will be insignificant, creep may be ignored. However, if the stress levels are such that creep will result in unacceptable deformation, an alternative design must be considered. This may include investigating a material with a higher creep modulus, or incorporation of an alternate design such as a metallic insert to serve as the load bearing member. Additional discussion can be found in the Design Information section. In general, glass and mineral/glass reinforced grades creep less than the unreinforced grades. The time required to observe measurable creep will also be shorter for the unreinforced grades. Apparent or creep modulus will decrease at elevated temperatures with a corresponding increase in creep. At temperatures above the glass transition temperature (Tg), the apparent modulus of the unreinforced grades is so low that even relatively low loads can result in significant creep, and therefore these unreinforced grades are usually not recommended for use in structural applications above these temperatures. Structural applications that will be exposed to elevated temperatures should be specified in the glass or mineral/glass reinforced grades. Creep can occur in tension, compression, or flexural modes. Therefore, to evaluate creep properties, strain is measured as a function of time while a specimen is subjected to a constant tensile, compressive or flexural load at specified environmental conditions. The procedure followed is described in ASTM D2990, Standard Test Methods for Tensile, Compressive, and Flexural Creep and Creep-Rupture of Plastics. ISO Method 899, Plastics Determination of Creep Behaviour is similar, but because of differences in the test specimen may not yield exactly the same results. The general trends shown by either method should be comparable, but material comparisons should only be done using data generated by the same method. The normal progression of creep occurs in these three stages: • A rapid initial deformation • Continued deformation at a slow and constant rate • Yield followed by rupture for ductile materials, or rupture for non-ductile materials The significance of data from creep tests is that they can be used to calculate the time dependent creep strain and creep modulus for use in stress calculations and to determine the safe stress levels for specific time and temperature conditions. If the creep tests are conducted until failure occurs at various stress levels, a creep rupture curve can be produced. Another aspect of creep may further complicate the analysis: under a given stress, creep will occur at the expected rate based on the apparent modulus. However, depending on how the stress is applied, the initial creep can result in stress relaxation. Consider a plastic part clamped with a bolt torqued to achieve a compressive stress on the plastic. As creep strain occurs, the compressive stress will drop, resulting in less creep. The compressive stress will drop until an equilibrium is established at a lower stress level. A “single point” analysis would indicate that torque retention would drop to a failure level, while, in reality, an acceptable equilibrium is reached before failure levels occur. Further discussion of the influence of creep on part design, including examples, can be found on page 68. Tensile creep Tensile creep was measured at three temperatures: 23 °C (73 °F); 125 °C (257 °F); and 175 °C (347 °F) and two stress levels: 13.8 MPa (2000 psi) and 34.5 MPa (5000 psi). Test specimens were 3.2 mm (0.125 in.) thick injection molded ASTM D638 Type I tensile bars. Samples were placed under test in the “dry, as molded” condition. The samples tested at the two elevated temperatures were placed in air circulating ovens. Although the strain is measured, the results are typically presented as the apparent modulus, which is calculated by dividing the strain by the applied stress. The apparent modulus is the value design engineers use in their mechanical design calculations when designing components that must perform when subjected to sustained load. The materials tested were A-1133 HS (33 % glass fiber) and A-1145 HS (45 % glass fiber). The results of the room temperature testing are shown in Figures 3.34 and 3.35. The results of the tensile creep testing at 125 °C (257 °F) are shown in Figures 3.36 and 3.37; results for 175 °C (347 °F) are shown in Figures 3.38 and 3.39. Amodel® PPA Design Guide / 33 Figure 3.34 Apparent modulus at 23 °C (73 °F) and 13.8 MPa (2 kpsi) 12 2.0 1.5 10 1.0 5 0.5 A-1133 HS A-1145 HS 0 1 10 0.0 100 8 4 2 1 2.0 1.5 10 1.0 5 0.5 A-1133 HS A-1145 HS Apparent modulus [ GPa ] 15 0.0 1.4 1.2 8 1.0 6 0.8 0.6 4 0.4 2 0 1,000 1 10 8 1.5 10 8 1.0 6 4 0.5 A-1133 HS A-1145 HS 0.0 Time [ hours ] 34 \ Amodel® PPA Design Guide 1,000 7 1.0 6 0.8 5 4 0.6 3 0.4 2 1 0.2 A-1133 HS A-1145 HS 0 1 10 0.0 100 Time [ hours ] 1,000 Apparent modulus [ Mpsi ] 12 Apparent modulus [ GPa ] 2.0 100 1,000 Figure 3.39 Apparent modulus at 175 °C (347 °F) and 34.5 MPa (5 kpsi) Apparent modulus [ Mpsi ] Apparent modulus [ GPa ] 14 10 0.0 100 Time [ hours ] Figure 3.36 Apparent modulus at 125 °C (257 °F) and 13.8 MPa (2 kpsi) 1 0.2 A-1133 HS A-1145 HS Time [ hours ] 0 1,000 Apparent modulus [ Mpsi ] 2.5 2 0.0 100 10 Apparent modulus [ Mpsi ] Apparent modulus [ GPa ] 10 Figure 3.38 Apparent modulus at 175 °C (347 °F) and 13.8 MPa (2 kpsi) 3.0 100 A-1133 HS A-1145 HS Time [ hours ] 20 10 0.5 0 1,000 Figure 3.35 Apparent modulus at 23 °C (73 °F) and 34.5 MPa (5 kpsi) 1 1.0 6 Time [ hours ] 0 1.5 10 Apparent modulus [ Mpsi ] 15 Apparent modulus [ Mpsi ] 2.5 Apparent modulus [ GPa ] 3.0 20 Apparent modulus [ GPa ] Figure 3.37 Apparent modulus at 125 °C (257 °F) and 34.5 MPa (5 kpsi) Isochronous stress/strain curves Tensile creep rupture Another format for presenting creep data is through the use of isochronous (equal time) stress versus strain curves. To prepare an isochronous curve, plot the stresses and the resultant strains for a single time interval and draw a smooth curve through the points. Repeat this process for each time interval. Creep rupture is defined as a failure or rupture that occurs as a result of a sustained load. Because the stress level at which rupture occurs due to sustained load is lower than the short-term strength, creep rupture can be the limiting design property. This method has the advantage of providing a concise summary of a large amount of data. The apparent modulus at any point can be calculated by dividing the stress by the indicated strain. Please note that the figures show strain expressed in percent; actual strain is the plotted value divided by 100. The isochronous stress/strain curves for Amodel® A-1133 HS resin at 23 °C (73 °F), 125 °C (257 °F), and 175 °C (347 °F) are shown in Figure 3.40. Creep rupture envelopes were developed in accordance with ASTM D2990. Tensile specimens were 3.2 mm (0.125 in.) thick injection molded ASTM D638 Type I tensile bars. The environments were the same as in the tensile creep testing above. The samples were loaded in tension using pneumatically actuated bellows to maintain indicated stress levels. Figure 3.40 Isochronous stress-strain of A-1133 HS PPA Tensile creep - A-1133HS 40 35 4 25 3 20 15 2 Stress [ kpsi ] Stress [ MPa ] The tensile creep rupture envelopes for Amodel® AS-1133 HS resin are shown in Figure 3.42 at 65 °C (149 °F), 100 °C (212 °F), and 150 °C (302 °F). 5 30 The objective of tensile creep rupture testing is to determine the time required for a sustained load to produce a rupture. A plot of stress versus the time to rupture is commonly known as a “creep rupture envelope”. Because the strength of a material varies with temperature, a “creep rupture envelope” can be generated for each temperature of concern. Figure 3.42 Tensile creep rupture of AS-1133 HS 200 25 150 10 0 0.0 Stress [ MPa ] 5 0 0.2 0.4 0.6 0.8 1.0 1.2 1.4 1.6 Strain [ % ] 20 15 100 10 50 1 hr 23 °C 1 hr 125 °C 1 hr 175 °C® Figure 10 3.41 shows for10 Amodel hr 23 °C the same 10 hr information 125 °C hr 175 °C 23 expected, °C 100 125 °Cglass reinforcement 100 hr 175 °C in A-1145100 HS.hrAs thehrmore 1,000 hr 23 °C 1,000 hr 125 °C 1,000 hr 175 °C the compound, the better the creep resistance. 0 0.01 65 °C ( 149 °F ) 100 °C ( 212 °F ) 150 °C ( 303 °F ) 0.1 1 10 Stress [ kpsi ] 1 5 100 0 1,000 10,000 Time to rupture [ hours ] Figure 3.41 Isochronous stress-strain of A-1145 HS PPA Tensile creep - A-1145HS 40 35 5 4 25 3 20 15 2 Stress [ kpsi ] Stress [ MPa ] 30 10 1 5 0 0.0 0 0.2 0.4 0.6 0.8 1.0 1.2 1.4 1.6 Strain [ % ] 1 hr 23 °C 10 hr 23 °C 100 hr 23 °C 1,000 hr 23 °C 1 hr 125 °C 10 hr 125 °C 100 hr 125 °C 1,000 hr 125 °C 1 hr 175 °C 10 hr 175 °C 100 hr 175 °C 1,000 hr 175 °C Amodel® PPA Design Guide / 35 Creep resistance can be predicted to a large extent by the relationship of the service temperature to the material’s glass transition temperature. Typically, creep resistance is good at service temperatures much lower than Tg, and becomes poorer as service temperature approaches Tg. Therefore, it is not surprising that Amodel® resins have creep resistance superior to many traditional semicrystalline thermoplastics. For example, Amodel® A-1000 resin has a glass transition temperature of 123 °C (253 °F) as determined by Differential Scanning Calorimetry (ASTM D3418). The corresponding Tg for PA 6,6 is 65 °C (149 °F). At all temperatures up to its Tg, Amodel® resins do have superior creep resistance. Figure 3.43 compares the apparent flexural modulus of Amodel® AS-1133 HS and A-1240 L resins to a 33 % glass reinforced PA 6,6. While the AS-1133 HS resin is clearly superior to the glass reinforced PA, even the mineral filled Amodel® A-1240 resin has an effectively higher creep modulus after 1000 hours under load. 1.2 6 0.8 0.6 4 0.4 AS-1133 HS 33% GR PA 6,6 A-1240 L 2 0 1 10 100 0.2 1,000 0.0 10,000 Time [ hours ] Figure 3.44 compares the apparent flexural modulus of Amodel® ET-1000 resin with that of unreinforced and impact modified grades of PA 6,6 at 83 °C (181 °F) and 14 MPa (2 kpsi). 36 \ Amodel® PPA Design Guide 400 300 2.0 1.5 200 1.0 100 0.5 0 1 10 100 1,000 Time [ hours ] Compressive creep Compressive creep was determined according to ASTM D2990. Test specimens were 12.7 mm x 12.7 mm x 25.4 mm (0.5 in. x 0.5 in. x 1.0 in.) injection molded bars. The ends of the bars were machined until they were parallel to each other within 0.025 mm (0.001 in.) and perpendicular to the axis. Displacement was monitored with bonded strain gauges. As in the flexural creep experiments, the stress levels were chosen to be less than 35 % of the compressive strength at the temperature of the test. Figure 3.45 Apparent compressive modulus of AS-1133 HS 8 7 1.0 6 0.8 5 23 °C - 34 MPa ( 73 °F - 5 kpsi ) 100 °C - 28 MPa ( 212 °F - 4 kpsi ) 150 °C - 21 MPa ( 302 °F - 3 kpsi ) 4 3 0.4 2 0.2 1 0 0.1 0.6 Apparent modulus [ Mpsi ] 1.0 Apparent modulus [ Mpsi ] Apparent modulus [ GPa ] 1.6 8 2.5 0.0 0.1 Apparent modulus [ GPa ] 12 1.4 ET-1000 PA 6,6 High impact PA 6,6 Figure 3.45 shows the compressive creep moduli of Amodel® AS-1133 HS resin at 23 °C, 100 °C, and 150 °C (73 °F, 212 °F, and 302 °F). These moduli are lower than the flexural creep moduli given in Figure 3.43. This is due to less fiber orientation in the direction of the induced strain. Figure 3.43 Apparent flex modulus at 69 MPa (10 kpsi) at 23 °C (73 °F) 10 3.0 Apparent modulus [ kpsi ] Flexural creep was determined according to ASTM D2990 using the three-point bending mode with a 50.8 mm (2 in.) span. Test specimens were 127 mm x 12.7 mm x 3.2 mm (5.0 in. x 0.5 in. x 0.125 in.) injection molded bars placed on test “dry, as molded”. The environment was maintained at 50 % relative humidity and 23 °C (73 °F). Stress levels were predetermined from flexural strength versus temperature curves and chosen to be 25 % to 35 % of the ultimate strength of the material at the test temperature. Figure 3.44 Apparent flex modulus at 14 MPa (2 kpsi) at 83 °C (181 °F) Apparent modulus [ GPa ] Flexural creep 0.0 1 10 100 1,000 Time [ hours ] In most applications where Amodel® resin will be loaded in a compressive manner, the load will be applied in the direction transverse to flow direction and consequently the fiber orientation. Therefore, the apparent moduli presented here are representative of the material’s performance in typical applications. Fatigue Resistance Fatigue strength of Amodel® resin When a material is stressed cyclically, failure or rupture will occur at stress levels much lower than its short-term ultimate strength. Examples of cyclic stress would include components subjected to severe vibration, components of reciprocating or rotating devices where loading is cyclic, and mechanical devices such as gears where the cyclic load is a function of position. When measuring and/or comparing the fatigue strength of plastic materials, it is critical to specify the mode (tensile, compressive, or flexural), the frequency, and the stress profile. When designing a component that will be subjected to cyclic loading, the establishment of fatigue strength requirements is desirable. However, analysis of the fatigue strength requirements is complicated by a large number of factors that may influence them. Some of these factors include the following: • Shape of the component • Stress concentration factors • Rate of load application • Any temperature change caused by load application • Type of stress induced by load, that is, tensile, compressive, or shear, etc. • Environmental factors, such as, chemicals, radiation, ambient temperature • Residual stresses Figure 3.46 Flex fatigue of GR resins at 23 °C (73 °F) and 32 Hz 140 20 18 16 14 12 10 8 6 4 2 0 AS-1145 HS AS-1133 HS 33% GR PA 6,6 120 100 80 60 40 20 0 103 104 105 106 Stress [ kpsi ] While the term “Fatigue Endurance Limit” is sometimes used in design discussions involving plastic materials, the response of plastics to cyclic stress is more complex than the response of metals, and the term is not strictly applicable. Fatigue data is typically presented by plotting stress versus number of cycles at rupture. A smooth curve is calculated that represents the best fit to the data. For component design purposes, this S–N (stress–number of cycles) curve provides strength values appropriate for the components required life. Stress [ MPa ] This phenomenon is well known in metals. Metallurgists have defined the term “Fatigue Endurance Limit” to represent the maximum cyclical stress that a material can be subjected to without failure. Normally, this stress level corresponds to the highest stress level that does not cause failure in 10 million (107) cycles. The fatigue strength of Amodel® resins was determined in accordance with ASTM test method D671. This method uses a cantilever beam configuration with a constant deflection. The results shown in Figure 3.46 were generated at a frequency of 32 Hz. Failure was defined when the stress level decayed to 90 % of its initial value. The Amodel® resins resist higher cyclic loads longer than PA 6,6. 107 Cycles to failure Figure 3.47 gives the fatigue behavior of Amodel® AS-1145 HS resin at 110 °C and 170 °C (230 °F and 338 °F). As expected, raising the temperature reduces the amount of cyclic stress that can be endured. A good example of an application involving cyclical stress is a gear. As the driving gear causes the driven gear to rotate, each tooth is subject to stress. This is then followed by a period of time at low or zero stress. In designing a gear tooth, the appropriate strength criteria is the fatigue endurance limit of the material at the operating conditions of the gear. • Duty cycle • Desired component life Amodel® PPA Design Guide / 37 Figure 3.47 Flex fatigue of AS-1145 resin at elevated temperature 70 60 8 50 40 6 30 4 20 2 10 0 103 Stress [ kpsi ] Stress [ MPa ] 10 110 °C ( 230 °F ) 170 °C ( 338 °F ) 0 104 105 106 107 Cycles to failure After all of the calculations have been made, the part design can be modified to best utilize the properties of the selected material. Conversely, the material grade can be modified to best suit the application requirements. An extremely useful tool to verify a design is to perform Finite Element Analysis (FEA). In FEA, the part is electronically modeled and a computer program is used to simulate the anticipated loads and stresses. The resulting strain levels can be evaluated and, if necessary, part design or material changes can be made. It is much easier to make changes to the FEA model than to a fabricated part or tooling. Even after calculations and FEA’s have been performed, the best way of evaluating a material for a component subject to dynamic stresses is actual prototype testing. Prototype parts can be machined from available stock shapes and subject to performance testing under the requirements of the application. Stock shapes are usually available as extruded slabs or rods and generally exhibit slightly lower mechanical properties than the injection molded part. Additionally, the machining operations usually induce stresses that would not normally be present in an injection molded part. As a result, a successful prototype test imparts an extremely high confidence level in the reliability of the design. 38 \ Amodel® PPA Design Guide Moisture Effects As with most thermoplastic resins, parts made from Amodel® resins can absorb moisture from the atmosphere. Because absorption is a physical change and not a chemical change, it is a reversible process, in that parts can be “dried out” under proper conditions. Amodel® polyphthalamide resins have significant amounts of aromatic character in the polymeric “backbone” and this causes them to absorb much less moisture than aliphatic polyamides such as PA 6,6 and PA 6. As a result, the dimensions, strength, and stiffness of Amodel® parts will be significantly less affected by the absorption of moisture than traditional aliphatic PA parts. Since moisture is ubiquitous, knowledge of the effects of moisture on the properties of a material is critical to the design engineer trying to meet end use requirements. Significance of moisture absorption When a polymer absorbs atmospheric moisture, a number of changes may occur. Obviously, the part weight will increase and this weight increase is typically used to measure the amount of moisture absorbed. Additionally, there may be some dimensional changes and generally the parts become larger. The presence of reinforcing fillers such as fiberglass may result in anisotropic dimensional change due to the fact that the fibers align themselves in the direction of polymer flow as the resin fills the tool. Similar to mold shrinkage values, dimensional changes due to moisture absorption are often reported in flow and transverse directions. Mechanical properties may also be affected by moisture absorption. Generally, a slight decrease in physical properties such as tensile and flexural strength are seen. The respective moduli also decrease slightly. Impact strength values tend to increase slightly since the presence of moisture can tend to plasticize the polymer. Since water is a conductor, absorbed moisture can have a negative effect on the dielectric properties of a molded part. Manufacturers of polymers that absorb moisture usually publish two sets of data, one listing test results on test specimens that have no absorbed moisture, commonly referred to as “Dry–As Molded” (DAM), and a second set of data that is generated on test specimens that have been allowed to come to an equilibrium weight in a 50 % Relative Humidity environment, known as “50 % RH”. Polymers like PA 6 and PA 6,6 absorb moisture relatively quickly and reach equilibrium in a 50 % Relative Humidity environment quickly. Providing 50 % RH data for these materials is fairly easy and extremely relevant to design, as will be understood in the subsequent discussion. On the other hand, polymers like Amodel® PPA absorb moisture very slowly and can take years to reach an equilibrium at 50 % RH. In order to provide 50 % RH data, a method was developed to accelerate the conditioning of test specimens. This involves boiling the test specimens in an aqueous solution of potassium acetate until constant specimen weight is obtained, typically for several days. As would be expected, this accelerated procedure has some side effects that influence the test values. In the accelerated procedure, the test specimens are annealed and stress relieved, which may actually cause in an improvement in the property test results. Conversely, exposure to boiling water can cause some hydrolysis of the polymer, yielding a loss in properties. Additionally, exposure to the boiling salt solution has been shown to degrade the bond between the polymer and a reinforcing media, such as fiberglass, resulting in a loss of mechanical properties such as tensile, flexural and impact. Nonetheless, the effect of absorbed moisture on Amodel® resins is minimal. Alternatively, consider the Amodel® A-1000 series polymers, which have a dry Tg of 123 °C (253 °F). Absorption of moisture at room temperature can reduce this Tg to 84 °C (183 °F)and have a slight reduction in “room temperature” properties. However, since moisture absorption is a reversible phenomenon (moisture absorption is a physical, not a chemical reaction), at temperatures above 100 °C (212 °F), the polymer actually dries out, returning the Tg to the original 123 °C (253 °F) value. Therefore, the Tg reduction due to moisture absorption is essentially insignificant for Amodel® resins. The following data are presented for consideration in applications in which moisture absorption is expected at ambient temperatures and a slight loss of properties may be anticipated. Since the polymer “desorbs” moisture and regains dry properties on exposure to temperatures above 100 °C (212 °F), moisturized test data above 100 °C (212 °F) is irrelevant for Amodel® resins, but quite important for polymers that have a Tg near or below 100 °C (212 °F). Moisture absorption and glass transition temperature (Tg) As has been mentioned, water absorption is a reversible process. At each specified relative humidity and temperature, a resin will absorb moisture until an equilibrium is established. At equilibrium, a polymer absorbs moisture at the same rate, it releases moisture, achieving a constant weight. Since the polymer, not the filler or reinforcement additives, absorbs the moisture, the amount of water absorbed is proportional to the amount of polymer present in each grade; the more highly filled grades will have lower absorption than the unfilled grades. Figure 3.48 compares the increase in weight due to moisture absorption of Amodel® AS-1133 HS to that of 33 % glass reinforced PA 6,6 at room temperature and specified relative humidities. The 33 % glass reinforced PA 6,6 absorbs significantly more moisture than Amodel® AS-1133 HS resin. The amount of time required for Amodel® resins to reach equilibrium is also significantly longer than PA 6,6. The effect of absorbed moisture on semi-crystalline polymers is to lower the glass transition temperature. The severity of reduction is dependent on the specific polymer and the amount of moisture absorbed. This phenomenon becomes of significant concern when designing with a polymer that has a Tg near or below 100 °C (212 °F). For example, a polymer with a Tg of 80 °C (176 °F) (Dry as molded) might exhibit a Tg of only 60 °C (140 °F) after absorbing moisture. The designer must consider the significant loss in properties above 60 °C due to the reduction in Tg when making decisions. Polymers with even lower dry Tgs can have a Tg reduction at or near room temperature with moisture absorption. This can create a significant design consideration. Figure 3.48 Moisture absorption of GR resins 6 Weight change [ % ] Perhaps much more significant than the effect of moisture absorption on room temperature properties is the effect of moisture absorption on the Glass Transition Temperature (Tg) of a polymer. By definition, the Tg of a polymer is the temperature, above which the crystalline region of the polymer matrix is no longer dominant over the amorphous region. Above the Tg, the amorphous region is dominant and there is a noticeable loss in mechanical properties as seen in the discussion on mechanical properties vs. temperature. In unreinforced grades, this is very significant in that the properties drop to levels which are essentially useless from a mechanical design perspective. In the reinforced grades, while the properties above Tg are still useful from a design perspective, the loss of mechanical properties is significant enough to make major design considerations. Absorption amount AS-1133 HS 33% GR PA 6,6 5 4 3 2 1 0 0 10 20 30 40 50 60 70 80 90 100 Relative humidity [ % ] Amodel® PPA Design Guide / 39 Effect of moisture on strength and stiffness Dimensional change due to moisture 30 200 25 150 20 15 100 10 50 5 AS-1133 HS 33% GR PA 6,6 0 0 Tensile strength [ kpsi ] Tensile strength [ MPa ] Figure 3.49 Effect of moisture on tensile strength of GR resins 0 10 20 30 40 50 60 70 80 90 100 Relative humidity [ % ] Figure 3.50 compares the flexural modulus of Amodel® AS-1133 HS resin to that of a 33 % glass reinforced PA 6,6 at 23 °C (73 °F) and various moisture contents. The modulus of the Amodel® resin is higher as molded and remains relatively constant. The modulus of the PA resin drops rapidly with increasing moisture level and temperature due to the fact that the Tg of PA 6,6 is below 100 °C (212 °F) and decreases further with moisture absorption. 12 1.8 10 1.4 8 1.2 1.6 1.0 6 0.8 0.6 4 0.4 2 AS-1133 HS 33% GR PA 6,6 0 0 10 20 30 40 50 60 70 80 90 100 Relative humidity [ % ] 40 \ Amodel® PPA Design Guide 0.2 0.0 Flexural modulus [ mpsi ] Flexural modulus [ GPa ] Figure 3.50 Effect of moisture on flex modulus of GR resins To evaluate the effect of moisture absorption on part dimensions, plaques 102 mm x 102 mm x 3.6 mm (4 in. x 4 in. x 0.125 in.) were molded, measured, and then placed into environments at room temperature, 23 °C (73 °F), and either 50 % or 100 % relative humidity. Periodically the plaques were removed and measured. The direction of flow during the molding process was noted and data for both the flow direction and transverse to flow were reported. The dimensional change was calculated by subtracting the initial length from the final length, dividing the result by the original length, and multiplying the result by 100 to express the change in percent. Figure 3.51 shows the results of this testing for Amodel® AS-1133 resin. Even at 100 % relative humidity, the dimensions continue to change for a considerable length of time. These graphs show that after one year, the rate of change has greatly diminished but the dimensions are still changing. Dimensions in the flow direction change less than the transverse direction, most likely due to alignment of the reinforcement fiber in the flow direction. The magnitude of the dimensional change is relatively small (less than 0.6 %), but could be important in applications requiring extremely tight dimensional tolerances and stability. Figure 3.51 Dimensional change of 33 % GR PPA 0.6 Dimensional change [ % ] Figure 3.49 compares the tensile strength of Amodel AS-1133 HS resin to that of 33 % glass reinforced PA 6,6 at 23 °C (73 °F) and specified moisture content. The tensile strength of the Amodel® resin is superior to that of the PA “dry, as molded” and the difference increases with higher moisture levels. ® TD @ 100% RH FD @ 100% RH TD @ 50% RH FD @ 50% RH 0.5 0.4 0.3 0.2 0.1 FD = flow direction TD = transverse direction 0.0 0 2 4 6 8 Time [ month ] 10 12 14 Figure 3.52 Dimensional change of 40 % mineral Filled PPA Dimensional change [ % ] 0.6 TD @ 100% RH FD @ 100% RH TD @ 50% RH FD @ 50% RH 0.5 0.4 0.3 Figure 3.53 Dimensional comparison of GR PA 6,6 to GR PPA at 100 % RH 1.2 Dimensional change [ % ] Figure 3.52 shows the same results for Amodel® A-1340 PPA, a 40 % mineral filled grade. Not only is the magnitude of the dimensional change smaller, but the difference between flow and transverse direction is almost negligible. 1.0 AS-1133 HS - TD AS-1133 HS - FD 33% GR PA 6,6 - TD 33% GR PA 6,6 - FD 0.8 0.6 0.4 0.2 FD = flow direction TD = transverse direction 0.0 0 0.2 2 4 6 8 10 12 14 Time [ month ] 0.1 FD = flow direction TD = transverse direction 0.0 0 2 4 6 8 10 12 14 Time [ month ] Dimensional change compared to PA 6,6 Figure 3.53 compares the dimensional change due to moisture absorption of Amodel® AS-1133 HS resin with that of 33 % glass reinforced PA 6,6 at 100 % RH. To ensure a valid comparison, both resins were molded under conditions that promote maximum crystallinity. In the case of the Amodel® resin, a mold temperature of 135 °C (275 °F) was used. For the PA 6,6, the mold temperature was 93 °C (200 °F). Plaques with a thickness of 3.2 mm (0.125 in.) were exposed to 100 % RH at room temperature. Amodel® resin absorbs moisture much more slowly than PA 6,6, because the diffusion coefficient at room temperature of water in PA 6,6 is approximately five times larger than that of Amodel® resins. Therefore, for these plaques, PA 6,6 reaches equilibrium in approximately four months while Amodel® AS-1133 HS resin requires more than two years. Amodel® PPA Design Guide / 41 In general, the thermal properties characterize the way a material responds to changing temperatures, both in the short-term and long-term. Thermal properties include the effects of temperature on the following: • Strength and stiffness • Dimensions • Chemical changes in the polymer itself due to thermal or oxidative degradation • Softening, melting, or distortion • Morphology The properties of the material in its molten state are discussed in the Amodel® PPA Processing Guide. The behavior of the material while burning is discussed in the section on combustion properties. Heat Distortion Temperature – HDT Although details such as specimen geometry, deflection endpoint, specimen orientation, and distance between the supports are different for these methods, the desired stress levels for both methods includes a loading of 1.8 MPa (264 psi) and 0.45 MPa (66 psi). When comparing data from multiple sources, it is important to verify that the same test method was used for all the data being compared. In the product property tables starting on page 9, data collected using both methods is listed. Examination of the data will reveal a considerable amount of difference between the values for some grades. Certain test parameters can have a significant influence upon the results obtained in this test. The designer should be certain that data from multiple sources are comparable. The most common and critical error is to compare the results from testing performed at 1.8 MPa (264 psi) with results obtained from testing at 0.45 MPa (66 psi). All Amodel® resins are tested at 1.8 MPa, 42 \ Amodel® PPA Design Guide In general, annealing reduces the variability in deflection temperature measurements, in addition to raising the value slightly. Figure 3.54 shows the effects of mold temperature and annealing on the deflection temperature at 1.8 MPa (264 psi) for Amodel® AS-1133 HS resin. As can be seen, mold temperature and/or annealing effects can cause the deflection temperature to vary by as much as 17 °C (30 °F). The deflection temperature data in this manual were generated on specimens annealed at 160 °C (320 °F) for 2 hours. Figure 3.54 Mold temperature and annealing effects on HDT of Amodel® AS-1133 HS 300 570 295 560 290 550 285 540 280 530 275 270 520 265 510 260 121 °C 135 °C Annealed Mold temperature 2 hours @ 160 °C Deflection temperature [ °F ] The tests most commonly used by the plastics industry to measure short-term thermal capability are ASTM D648, Standard Test Method for Deflection Temperature of Plastics Under Flexural Load and ISO 75, Plastics Determination of Temperature of Deflection Under Load. These tests are commonly referred to as Heat Distortion Temperature (HDT) or Deflection Temperature under Load (DTUL). Both tests are similar in that the test specimen is supported at two points while a load is applied to the center. The temperature is increased at a constant rate until the specimen deflects a specified amount as indicated by a dial micrometer. unless otherwise specified. Other test parameters that should be considered are specimen thickness and thermal history. The test may be performed as molded or after heat treating or “annealing” for several hours at a temperature slightly above the glass transition temperature, or about 160 °C (320 °F) for Amodel® PPA. Deflection temperature [ °C ] Thermal Properties 500 Thermal history Deflection temperature measures modulus at temperature measurement. Classical stress/strain analysis indicates that the ASTM D648 test actually measures the temperature at which the flexural modulus is 240 MPa (35,000 psi) when the applied stress is 0.45 MPa (66 psi), or 965 MPa (140,000 psi) when the applied stress is 1.8 MPa (264 psi). Because the test method directs that the indicator be re-zeroed after five minutes, any creep strain that occurs in the first five minutes is effectively subtracted from the endpoint strain lowering the actual modulus at the end point of the test. The initial modulus can be related to the creep strain. Coefficient of Linear Thermal Expansion In summary, deflection temperature does not measure thermal capability, it simply provides one point on the modulus versus temperature curve. In general, HDT can only be used as a general indicator of short-term thermal capability. It is useful for comparing similar materials but can be misleading if, for example, an amorphous material is compared to a semi-crystalline material. It doesn’t provide any information about longterm thermal stability. The actual loads and performance requirements will dictate the suitability of the material. Many semi-crystalline resins can be used in applications that experience temperatures higher than their deflection temperature value. Deflection Temperature Values for Amodel® Resins Deflection temperature values by both ASTM D648 and ISO 75Af for representative grades of Amodel® PPA are shown in the Tables starting on page 7. Figure 3.55 HDT of 30 % – 33 % GR resins 550 500 240 450 220 200 400 180 350 160 A-1133HS PA 6,6 PPS PEI Deflection temperature [ °F ] Deflection temperature [ °C ] 300 260 If the coefficient α is known, the change in length of an uniform straight bar raised to a temperature TF can be calculated from: Δ L = αL ( TF − TO ) Where: Δ L = change in length L = original length α = coefficient of linear thermal expansion TF = final temperature TO = initial temperature The CLTE (α), as measured by ASTM E831, of several Amodel® grades and some common metals is given in Table 3.16. This method provides an average value for the expansion coefficient over a temperature range. Figure 3.55 compares the deflection temperature at 1.8 MPa (264 psi) of Amodel® AS-1133 HS resin with a 33 % glass fiber reinforced PA 6,6, a 30 % glass fiber reinforced PPS, and a 30 % glass fiber reinforced PEI. Amodel® resin offers a 75 °C HDT advantage relative to PEI, a 42 °C advantage relative to PA 6,6, and a 22 °C advantage relative to PPS. 280 The dimensions of most materials increase with increasing temperature. The coefficient of linear thermal expansion (CLTE) is the ratio of the change in length to the change in temperature. The thermal expansion behavior of metals is uniform over the temperature range of concern. As shown in Table 3.16, the thermal expansion coefficients of the polymer materials are a function of the temperature range used for the measurement. In general, the polymer materials expand slightly more above their glass transition temperature than they do below it and the behavior in the vicinity of the Tg is also somewhat non-linear. However, over large temperature ranges, the variations are usually insignificant and an excellent prediction of dimensional properties can be obtained using the values provided in the table. Also, the addition of glass fiber and other reinforcing additives results in the thermal expansion becoming directional. Since fibers tend to become oriented in the flow direction, and since glass has a lower thermal expansion coefficient than the polymers, the coefficients of expansion are generally lower in the flow direction than the transverse direction. The values shown in Table 3.16 should allow the design engineer to estimate the magnitude of the thermal stresses in parts molded from Amodel® resins due to thermal expansion. Amodel® PPA Design Guide / 43 Table 3.16 Coefficients of linear thermal expansion(1) Temperature 0-50 °C (32-122 °F) 50-100 °C (122-212 °F) 100-150 °C (212-302 °F) 150-200 °C (302-392 °F) FD(2) TD(3) FD TD FD TD FD TD per °C (°F) per °C (°F) per °C (°F) per °C (°F) per °C (°F) per °C (°F) per °C (°F) per °C (°F) A-1133 HS 24 (13) 50 (28) 24 (13) 60 (33) 27 (15) 99 (55) 27 (15) 130 (72) A-1145 HS 22 (12) 49 (27) 21 (12) 58 (32) 27 (15) 88 (49) 15 (8) 122 (68) A-6135 HN 23 (13) 59 (33) 21 (12) 63 (35) 16 (9) 96 (53) 15 (8) 109 (61) AS-4133 HS 20 (11) 64 (36) 20 (11) 87 (48) 20 (11) 114 (63) 9 (5) 126 (70) Direction Units Glass Reinforced Grades Toughened Grades AT-1002 HS 70 (39) 84 (47) 85 (47) 101 (56) 145 (81) 126 (70) 112 (62) 153 (85) ET-1000 HS 68 (38) 80 (44) 85 (47) 81 (45) 147 (82) 97 (54) 142 (79) 113 (63) ET-1001 L 71 (39) 69( 38) 94 (52) 80 (44) 167 (93) 88 (49) 170 (94) 118 (66) AT-5001 93 (52) 106 (59) 136 (76) 144 (80) 184 (102) 184 (102) 153 (85) 142 (79) Toughened Glass Reinforced Grades AT-1116 HS 20 (11) 72 (40) 23 (13) 77 (43) 16 (9) 116 (64) 16 (9) 133 (74) AT-6115 HS 23 (13) 83 (46) 21 (12) 97 (54) 34 (19) 116 (64) 26 (14) 121 (67) 18 (10) 56 (31) 16 (9) 72 (40) 11 (6) 93 (52) 3 (2) 120 (67) Flame Retardant Grades AFA-1633 V0 Z Mineral and Mineral/Glass Filled Grades A-1240 L 26 (14) 68 (38) 19 (11) 91 (51) 18 (10) 117 (65) 15 (8) 121 (67) A-1340 HS 34 (19) 50 (28) 42 (23) 60 (33) 51 (28) 103 (57) 19 (11) 103 (57) A-1565 HS 20 (11) 34 (19) 20 (11) 39 (22) 20 (11) 72 (40) 14 (8) 89 (49) AS-1566 HS 17 (9) 36 (20) 17 (9) 44 (24) 17 (9) 59 (33) 16 (9) 85 (47) AP-9240 NL 54(30) 48 (27) 87 (48) 61 (34) 110 (61) 81 (45) 87 (48) 110 (61) Common Metals Zinc alloy 27 (15) 27 (15) 27 (15) 27 (15) 27 (15) 27 (15) 27 (15) 27 (15) Aluminum alloy A-360 21 (12) 21 (12) 21 (12) 21 (12) 21 (12) 21 (12) 23 (13) 23 (13) Stainless steel 17 (9) 17 (9) 17 (9) 17 (9) 17 (9) 17 (9) 18 (10) 18 (10) 11 (6) 11 (6) 11 (6) 11 (6) 11 (6) 11 (6) 12 (7) 12 (7) Carbon steel (1) -6 Values are 10 L/L per degree where L is length FD = Flow direction (3) TD = Transverse direction or perpendicular to flow direction (2) 44 \ Amodel® PPA Design Guide Table 3.17 Thermal conductivity of Amodel® PPA resins Average Temperature 40 °C (104 °F) Grades Additive 100 °C (212 °F) Amount [%] W/mK Btu in./ hr ft 2 °F W/mK 150 °C (302 °F) Btu in./ hr ft 2 °F W/mK Btu in./ hr ft 2 °F A-1115 HS Glass 15 0.289 2.00 0.307 2.13 0.324 2.25 AS-1133 HS Glass 33 0.341 2.37 0.360 2.50 0.376 2.61 AS-1145 HS Glass 45 0.372 2.58 0.393 2.73 0.409 2.84 Mineral 40 0.377 2.62 0.388 2.69 0.399 2.77 Mineral/glass 25/15 0.422 2.93 0.430 2.98 0.436 3.02 A-1340 HS Thermal Conductivity The measurement of thermal conductivity was performed in accordance with ASTM F433. The test is conducted by placing a sample between plates controlled at different temperatures and monitoring the heat flow through the sample. The thermal conductivity was determined at three average temperatures, 40 °C (104 °F), 100 °C (212 °F), and 150 °C (302 °F), by setting the hot plate about 7 °C (12 °F) above the average and setting the cold plate about 7 °C (12 °F) below the average temperature. The thermal conductivity of various grades of Amodel® resin was measured at each of the stated temperatures and the results are presented in Table 3.17. Higher thermal conductivity values indicate greater heat flow, while lower values indicate better thermal insulating characteristics. Temperature [ °F ] 100 150 200 250 300 0.45 3.0 2.8 0.40 2.6 0.35 2.4 2.2 0.30 2.0 0.25 1.8 15% GR 33% GR 45% GR 0.20 40 60 80 1.6 1.4 100 120 140 Thermal conductivity [ BTU-in/hrft2 °F ] Thermal conductivity is the rate at which heat energy will flow through a material. This property is important in applications where the polymeric material is used as a thermal insulator, or where heat dissipation is of concern. Figure 3.56 Thermal conductivity of glass reinforced Amodel® PPA Thermal conductivity [ W/m-K ] A-1240 L 160 Temperature [ °C ] Figure 3.56 shows that the thermal conductivity increases with glass content and temperature. Amodel® PPA Design Guide / 45 Figure 3.59 Amodel® A-5000 PPA, specific heat vs. temperature Specific Heat Specific heat is defined as the amount of heat required to change the temperature of a unit mass one degree. Figures 3.57 through 3.60 show the specific heat as a function of temperature for the Amodel® base resins. Notice that the specific heat changes significantly at the melting point. This behavior is typical of semicrystalline thermoplastics. Temperature [ °F ] This information can be used by process engineers to calculate the heat input needed to process Amodel® resins on equipment such as extruders or injection molding machines. Figure 3.57 Amodel® A-1000 PPA, specific heat vs. temperature 400 1.2 4 1.0 5 1.2 4 1.0 0.8 3 0.6 0.4 1 0.2 0 0.0 150 200 250 300 350 Figure 3.58 Amodel® A-4000 PPA, specific heat vs. temperature 1 400 600 1.4 5 1.2 4 1.0 0.8 3 0.6 2 0.4 1 0.2 0.0 0 50 100 150 200 250 Temperature [ °C ] 46 \ Amodel® PPA Design Guide 50 100 150 200 250 300 350 Temperature [ °F ] 100 200 300 400 500 300 350 600 6 1.4 5 1.2 4 1.0 0.8 3 0.6 2 0.4 1 0.2 0.0 50 100 150 200 250 Temperature [ °C ] 500 6 0 0.0 0 Specific heat [ Btu/lb °F ] Specific heat [ J/g °C ] 300 0.2 0 Temperature [ °F ] 200 0.4 Figure 3.60 Amodel® A-6000 PPA, specific heat vs. temperature Temperature [ °C ] 100 0.6 2 300 350 Specific heat [ Btu/lb °F ] 2 100 0.8 3 600 1.4 50 600 Temperature [ °C ] 500 6 0 500 5 0 Specific heat [ J/g °C ] 300 400 0 Specific heat [ Btu/lb °F ] Specific heat [ J/g °C ] 200 300 1.4 Temperature [ °F ] 100 200 Specific heat [ Btu/lb °F ] Specific heat [ J/g °C ] 100 6 Thermal Stability The general term, thermal stability, is used to describe the ability of a material to resist loss of properties due to heat. Various methods are used to evaluate this tendency. In the next section, we will discuss several of these methods, including thermogravimetric analysis, and long-term heat aging. Thermogravimetric analysis (TGA) Thermogravimetric analysis is performed by increasing the temperature of a small sample of the test material at a constant rate while monitoring its weight. The atmosphere is controlled and the test can be performed using air or an inert atmosphere, such as nitrogen. Figure 3.61 shows the weight loss of Amodel® A-1000 resin as a function of temperature in air at a heating rate of 10 °C/min (18 °F/min). The graph shows that Amodel® PPA resins are thermally stable beyond the recommended upper processing temperature limit of 350 °C (662 °F). Figure 3.61 Thermogravimetric analysis of A-1000 in air Temperature [ °F ] 500 600 700 800 900 1,000 1,100 1,200 Thermal oxidative stability limits the acceptable long-term use temperature of some polymers. To evaluate these long-term effects on the properties of Amodel® PPA, molded test specimens of Amodel® resins were placed in circulating air ovens at several elevated temperatures. Specimens were removed from the oven at regular intervals, then tested at room temperature for tensile strength and impact resistance. Typically, these aging tests are run until the property being monitored has been reduced to one-half its starting value. The aging tests are conducted at several aging temperatures and an “Arrhenius Plot” is prepared. An “Arrhenius plot” plots the heat aging time required to reduce a property to one-half of its starting value, sometimes referred to as its half-life, against the reciprocal of the aging temperature in degrees Kelvin. The advantage of analyzing the data in this manner is that the plot is theoretically a straight line and, therefore, easily extrapolated. Figure 3.62 shows the plot of tensile strength half-lives of Amodel® AS-1133 HS resin and GR PA 6,6 versus the aging temperature. Amodel® PPA maintains its tensile strength longer than PA 6,6 does. Figure 3.62 Thermal aging comparison - tensile strength 100 Temperature [ °F ] 320 60 100,000 40 20 0 250 300 350 400 450 500 550 600 650 Temperature [ °C ] Thermal aging Nearly all polymeric materials exhibit some loss of performance properties after long-term exposure to elevated temperatures. While some polymers are more stable than others, the property loss is typically a function of both exposure time and temperature. Because the property losses result from both oxidative attack and thermal degradation, the term “thermal oxidative stability” is frequently used. Time to tensile strength half-life Weight [ % ] 80 340 360 380 400 420 440 AS-1133 HS 33% GR PA 6,6 10,000 1,000 100 150 160 170 180 190 200 210 220 230 Temperature [ °C ] Amodel® PPA Design Guide / 47 Figure 3.63 shows the thermal aging curves for notched Izod half-lives of Amodel® AS-1133 HS resin and GR PA 6,6 versus aging temperature. Amodel® PPA also requires longer aging times before loss of impact resistance occurs than the PA 6,6 resin. Figure 3.63 Thermal aging comparison - Izod impact Because the rate of decay is greater for thinner specimens, UL gives RTI ratings for each thickness tested. Temperature [ °F ] 320 340 360 Time to tensile strength half-life 100,000 380 400 420 440 AS-1133 HS 33% GR PA 6,6 10,000 1,000 100 150 160 170 180 190 200 210 220 230 Temperature [ °C ] Thermal aging tests like this are used to compare plastic materials and to estimate their service life. The service life of a material at a particular end-use temperature will be largely dependent upon the requirements of the application and should be judged on the basis of its heat aging data and actual or simulated end-use testing. Relative thermal index (UL) A primary function of Underwriters Laboratories Inc is to assist in the assessment of the risk of fire associated with electrical devices. Because insulating materials may deteriorate over time some method of evaluating this tendency and providing guidance to designers and users of electrical devices was required. Underwriters Laboratories (UL) has developed a method and rating system for this purpose. This method is UL Standard 746B, Polymeric Materials, Long-Term Property Evaluation. A similar method is ASTM D3045, Standard Practice for Heat Aging of Plastics Without Load. Based on the results of aging tests as described in the previous section, Underwriters Laboratories assigns a rating called the “Relative Thermal Index” to insulating materials. Because all material properties do not decay at the same rate, a material may have different Relative Thermal Indices for electrical properties, mechanical properties without impact, and mechanical properties with impact. 48 \ Amodel® PPA Design Guide The Relative Thermal Index or RTI is determined by a statistical analysis of thermal aging data for the properties being evaluated. The RTI predicts the aging temperature that a material can endure for 100,000 hours and still retain at least fifty percent of the initial property or properties being measured. To obtain a UL RTI rating, a long-term heat aging program is performed. Sets of test specimens molded from the material to be tested are put into ovens at preset temperatures. Periodically specimens are removed and tested. The results for each aging temperature are plotted on a time versus property graph, until the property being measured has declined to 50 % or less of its initial value. This combination of time and aging temperature can be referred to as the “half-life” for that property, material, and thickness. The half-lives (time to 50 % or less) for a particular property, which were experimentally determined at four aging temperatures, are plotted against the reciprocal of the absolute aging temperature. The points should establish a straight line that can be extrapolated to predict the half-life of the material for the particular property at other temperatures. This is called an “Arrhenius plot”. To estimate the RTI for the material, the best-fit straight line is drawn through the four half-life points for tensile strength and extended to 100,000 hours. The temperature at which this line crosses the 100,000 hours line is an estimate of the RTI for the material. If only three half-life points are available, such as when the data for the fourth temperature is still under test, then a provisional RTI can be granted. The RTI assigned by UL may be somewhat lower as statistical methods are used to compensate for experimental variability. Testing of Amodel® resins for the establishment of UL Relative Thermal Indices is a continuing long-term activity. The UL ratings of some Amodel® resins when this manual was printed are shown in Table 3.18. Because this testing is ongoing, the Underwriters Laboratories website (http://data.ul.com) should be consulted for the latest RTI’s. Table 3.18 Relative thermal indices of Amodel® PPA grades Relative Thermal Index (RTI) Mechanical Grade Color Thickness [mm] All 0.75 130 (266) 130 (266) 130 (266) 1.5 130 (266) 130 (266) 130 (266) 3.0 130 (266) 130 (266) 130 (266) AFA-4133 V0 Z AFA-6133 V0 Z AFA-6145 V0 Z All All Electrical [°C (°F)] With Impact [°C (°F)] Without Impact [°C (°F)] 0.75 130 (266) 130 (266) 130 (266) 1.5 130 (266F) 130 (266) 130 (266) 3.0 130 (266) 130 (266) 130 (266) 0.75 140 (284) – 130 (266) 1.5 140 (284) – 130 (266) 3.0 140 (284) 140 (284) 140 (284) Combustion Properties This section describes the resistance of Amodel® resins to burning and ignition, and the smoke density characteristics of the material once it has been ignited. Described below are glow wire test results, classifications according to UL 94 and ASTM smoke density test results. Glow wire testing The ability to support and sustain ignition in plastic materials may be characterized by the standardized glow wire test. This test simulates conditions present when an exposed, current carrying conductor contacts an insulating material during faulty or overloaded operation. The test method followed is referenced in IEC 695-2-1/3. The glow wire test apparatus consists of a loop of heavy gauge nickel-chromium resistance wire, a thermocouple, and a sample mounting bracket. During the test, an electrical current is passed through a nickel-chromium loop in order to obtain a predetermined temperature. The sample is then brought in contact with the wire for 30 seconds. The test is passed if after withdrawal, the sample displays no flame or glowing, or if so, it is self-extinguishing after 30 seconds. The test can be applied at one or more recommended temperatures and at any wall thickness needed. Recommended temperatures are 550 °C (1022 °F), 650 °C (1202 °F), 750 °C (1382 °F), 850 °C (1562 °F), and 960 °C (1760 °F). Thickness is usually mandated by the design or the requirements of the device. It is most difficult to resist ignition at the high glow wire temperature and thinner wall sections. Table 3.19 UL definitions of GWIT and GWFT IEC Glow-Wire Ignitability Temperature (GWIT) In accordance with IEC 695-2-1/3, is expressed as the temperature (in °C), which is 25 °C hotter than the maximum temperature of the tip of the glow wire which does not cause ignition of the material during three subsequent tests IEC Glow-Wire Flammability Temperature (GWFT) In accordance with IEC 695-2-1/2, is expressed as the highest temperature (in °C) at which, during three subsequent tests, flaming or glowing of the test specimen extinguish within 30 seconds after removal of the glow wire without ignition of the indicator by burning drips or particles. Amodel® resins have passed glow wire testing as shown in Table 3.20. Table 3.20 G low wire results GWIT Grade GWFT [°C (°F)] [°C (°F)] A(AS)-1133 HS 725 (1,337) 725 (1,337) AT-6115 HS 750 (1,382) 800 (1,472) AT-6130 725 (1,337) 750 (1,382) AS-1566 HS 775 (1,427) 800 (1,472) AS-4133 HS 750 (1,382) 750 (1,382) AFA-6133 V0 Z 960 (1,760) 960 (1,760) (1) (1) All samples tested at 0.8 mm (0.031 in.) thickness The UL definitions for the parameters usually reported are shown in Table 3.19. Amodel® PPA Design Guide / 49 Smoke density test (NBS) Horizontal burning test When a material burns, smoke is generated. The quantity and density of the generated smoke is important in many applications. ASTM E662, Standard Test Method for Specific Optical Density of Smoke Generated by Solid Materials, provides a standard technique for evaluating relative smoke density. This test was originally developed by the National Bureau of Standards (NBS), and is often referred to as the NBS Smoke Density test. The data in Table 3.21 was generated in both flaming and nonflaming modes. A six-tube burner is used to apply a row of flamelets across the lower edge of the specimen. A photometric system aimed vertically is used to measure light transmittance as the smoke accumulates. The specific optical density (Ds) is calculated from the light transmittance. The maximum optical density is called Dm. For a 94HB classification rating, injection molded test specimens are limited to a 125 mm length, 13 mm width and the minimum thickness for which the rating is desired. The samples are clamped in a horizontal position with a 20-mm blue flame applied to the unclamped edge of the specimen at a 45 degree angle for 30 seconds or so as soon as the combustion front reaches a premarked line 25-mm from the edge of the bar. After the flame is removed, the rate of burn for the combustion front to travel from the 25-mm line to a premarked 100-mm line is calculated. At least three specimens are tested in this manner. A plastic obtains an HB rating by not exceeding a burn rate of 40 mm/min for specimens having a thickness greater than 3 mm or 75 mm/min for bars less than 3 mm thick. The rating is also extended to products that do not support combustion to the 100-mm reference mark. Table 3.21 Smoke density Grade Ds at 4 min Dm Dm Corr. 565 510 469 3 162 162 Flaming Mode AS-1133 HS Non-Flaming Mode AS-1133 HS Vertical flammability per UL 94 The UL 94 flammability standard established by Underwriters Laboratories is a system by which plastic materials can be classified with respect to their ability to withstand combustion. The flammability rating given to a plastic material is dependent upon the response of the material to heat and flame under controlled laboratory conditions and serves as a preliminary indicator of its acceptability with respect to flammability for a particular application. The actual response to heat and flame of a thermoplastic depends on other factors such as the size, form, and end-use of the product using the material. Additionally, characteristics in end-use application such as ease of ignition, burning rate, flame spread, fuel contribution, intensity of burning, and products of combustion will affect the combustion response of the material. Three primary test methods comprise the UL 94 standard: Horizontal Burning Test, the 50W (20 mm) Vertical Burning Test, and the 500W (125 mm) Vertical Burning Test. 50 \ Amodel® PPA Design Guide Amodel® AS-1133 HS resin has obtained a 94HB rating in the Horizontal Burning Test, at thicknesses down to 0.8 mm in a black color. 50W (20 mm) Vertical burn test Materials can be classified V-0, V-1, or V-2 on the basis of results obtained from the combustion of samples clamped in a vertical position. The 50W (20 mm) Vertical Burn Test is more aggressive than the HB test and is done on samples that measure 125 mm long, 13 mm wide, and the minimum thickness at which the rating is desired (typically 0.8 mm or 1.57 mm). The samples are clamped in a vertical position with a 20-mm high blue flame applied to the lower edge of the clamped specimen. The flame is applied for 10 seconds and removed. When the specimen stops burning, the flame is reapplied for an additional 10 seconds and then removed. A total of five bars are tested in this manner. Table 3.22 lists the criteria by which a material is classified in this test. Table 3.22 UL Criteria for classifying materials V-0, V-1, or V-2 Criteria Conditions V-0 V-1 V-2 Afterflame time for each individual specimen, (t1 or t2) ≤ 10s ≤ 30s ≤ 30s Total afterflame time for any condition set (t1 + t2 for the 5 specimens) ≤ 50s ≤ 250s ≤ 250s Afterflame plus afterglow time for each individual specimen after the second flame application (t2 + t3) ≤ 30s ≤ 60s ≤ 60s Afterflame or afterglow of any specimen up to the holding clamp No No No Cotton indicator ignited by flaming particles or drops No No Yes 500 W Vertical burning test Electrical Properties A material which passes the flammability requirements established by the 500 W Vertical Burning Test earns either a 5VA or 5VB rating. This particular test is the most severe of the three described. The dimensions of the molded bars used in this test are identical to those used for the 20 MM Vertical Burning Test. Additionally, plaques are required that measure 150 mm by 150 mm by the minimum and maximum thicknesses required for the application. The bars are clamped in a vertical position with a 125-mm high flame applied five times for five seconds each time with a five second interval between each application. The plaques are clamped in a horizontal, flat position with a 125-mm high flame applied to the bottom surface at a 20° angle using the same burn times described for the bars. Table 3.23 lists the criteria that must be met to obtain a 5VA or 5VB rating. Many applications for thermoplastic resins depend upon their ability to function as electrical insulators. A wide variety of tests have been developed to measure specific aspects of material performance in electrical applications. A brief description of some of the more common tests are covered in this next section. Table 3.23 UL Criteria for classifying materials 5VA or 5VB Criteria Conditions 5VA 5VB ≤ 60s ≤ 60s Cotton indicator ignited by flaming particles or drops from any bar specimen No No Burn-through (hole) of any plaque specimen No Yes Afterflame time plus afterglow time after fifth flame application for each individual bar specimen Table 3.24 lists the current UL 94 ratings of some Amodel® resins. Because ratings may change and additional products rated please consult the Underwriters Laboratories website for the latest information. Dielectric Breakdown Voltage and Strength ASTM D149 Dielectric strength is a measure of the ability of a material to resist high voltage without dielectric breakdown. It is measured by placing a specimen between two electrodes and increasing the applied voltage until dielectric breakdown occurs. The dielectric strength is reported at the highest voltage prior to failure. Of the various methods included in ASTM D149, UL 746A specifies the short-time test using a uniform rate of voltage increase of 500 volts per second. Although the results are reported in units of kV/mm (volts/ mil), the dielectric strength is a function of thickness, moisture content, and temperature. Therefore, data on different materials are comparable only for equivalent sample thickness, moisture content, and test temperature. Table 3.24 shows the dielectric strengths of several Amodel® grades. The dielectric strength of samples conditioned to 50 % RH are the same as the dry as molded samples. Table 3.24 Dielectric strength of selected Amodel® grades Thickness 3.2 mm ( 0.125 in.) Table 3.24 UL 94 Ratings of Amodel® PPA grades Grade AFA-4133 V0 Z AFA-6133 V0 Z AFA-6145 V0 Z Grade 1.6 mm ( 0.063 in.) Cond.(1) kV/ mm V/ mil kV/ mm V/ mil Color Thickness [mm] UL 94 Rating A-1133 HS Dry 21 533 32 813 All 0.75 V-0 A-1133 HS 50 % RH 21 533 – – 1.5 V-0 A-1145 HS Dry 23 584 – – 3.0 V-0 A-1145 HS 50 % RH 23 584 – – 0.75 V-0 AS-4133 HS Dry 21 533 32 813 1.5 V-0 All All 3.0 V-0 0.75 V-0 1.5 V-0 3.0 V-0 AS-4133 HS 50 % RH 21 533 – – AT-1002 HS Dry 17 432 – – AT-1002 HS 50 % RH 17 432 – – AT-5001 Dry 17 432 – – AT-5001 50 % RH 17 432 – – AT-6115 HS Dry – – 28 711 AFA-6133 V0 Z Dry 24 610 27 686 A-1340 HS Dry – – 32 813 AS-1566 HS Dry – – 29 737 (1) Condition: dry is dry as molded, 50 % RH is moisture conditioned as described on page 8 Amodel® PPA Design Guide / 51 Volume Resistivity - ASTM D257 The volume resistivity of a material is defined as the electrical resistance of a unit cube of material. The material is subjected to 500 volts DC for 1 minute, and the current through the material is measured. Materials with higher volume resistivity are more effective at electrically isolating components. UL 746A specifies that the test be run on two sets of specimens: one set conditioned for 48 hours at 23 °C (73 °F) and 50 % relative humidity; and the other conditioned for 96 hours at 35 °C (95 °F) and 90 % relative humidity. Volume resistivity is particularly sensitive to temperature changes as well as changes in humidity. Data on different materials are comparable only for equivalent moisture content and temperatures. Materials with resistivities above 108 ohm-cm are considered insulators, while those with values of 103 to 108 ohm-cm are partial conductors. Table 3.25 Volume and surface resistivity of Amodel® resins Cond.(1) Volume Resistivity [ohm-cm] Surface Resistivity [ohm] A-1133 HS Dry 1 x 10¹⁶ 1 x 10¹⁵ A-1133 HS 50 % RH 2 x 10¹⁵ – A-1145 HS Dry 1 x 10¹⁶ – 50 % RH 15 – 16 15 Grade A-1145 HS 2 x 10 AS-4133 HS Dry AS-4133 HS 50 % RH 5 x 10¹⁴ – Dry 16 13 8 x 10 14 2 x 10¹³ 15 4 x 10 4 x 10¹⁵ AT-1002 HS AT-1002 HS 50 % RH 1 x 10 1 x 10 7 x 10 1 x 10 AT-5001 Dry AT-5001 50 % RH 2 x 10¹⁵ 2 x 10¹⁵ Dry 1 x 10¹⁶ 1 x 10¹⁵ AFA-6133 V0 Z Dry 16 1 x 10 1 x 10¹⁵ A-1240 L Dry 9 x 10¹⁵ – Surface Resistivity - ASTM D257 A-1240 L 50 % RH 2 x 10¹⁵ – The surface resistivity of a material is the electrical resistance between two electrodes on the surface of the specimen. The material is subjected to 500 volts DC for 1 minute, and the current along the surface of the material is measured. Although some finite thickness of material is actually carrying the current, this thickness is not measurable; therefore, this property is an approximate measure. Surface resistivity is affected by surface contamination and is not considered a basic material property. UL specifies the same specimen conditioning used for volume resistivity. Data from this test are best used to compare materials for use in applications where surface leakage is a concern. A-1340 HS Dry 16 – 16 15 52 \ Amodel® PPA Design Guide AT-6115 HS 1 x 10 A-1340 HS 50 % RH A-1565 HS Dry 4 x 10¹⁴ – Dry 16 15 AS-1566 HS 1 x 10 1 x 10 1 x 10 1 x 10 (1) Condition: dry is dry as molded, 50 % RH is moisture conditioned as described on page 8 Dielectric Constant - ASTM D150 The dielectric constant is defined as the ratio of the capacitance of a condenser using the test material as the dielectric to the capacitance of the same condenser with a vacuum replacing the dielectric. Insulating materials are used in two very distinct ways. First, to support and insulate components from each other and the ground, and second, to function as a capacitor dielectric. In the first case, it is desirable to have a low dielectric constant. In the second case, a high dielectric constant allows the capacitor to be physically smaller. Dielectric constants have been found to change rapidly with increasing temperature or moisture contents, hence data on different materials are comparable only at equivalent moisture content and temperature. Table 3.26 Dielectric constant of Amodel® resins Table 3.27 Dissipation factor of Amodel® resins Frequency [Hz] Frequency [Hz] Cond.(1) 60 100 10 6 10 9 A-1133 HS Dry 4.4 5.1 4.2 3.7 Grade Cond.(1) 60 100 10 6 10 9 A-1133 HS Dry 0.005 – 0.017 0.016 Grade A-1133 HS 50 % RH 4.7 – 4.3 – A-1133 HS 50 % RH 0.009 – 0.022 – A-1145 HS Dry 4.6 – 4.4 – A-1145 HS Dry 0.005 – 0.016 – A-1145 HS 50 % RH 4.9 – 4.5 – A-1145 HS 50 % RH 0.009 – 0.021 – AS-4133 HS Dry 3.8 4.6 3.6 3.6 AS-4133 HS Dry 0.004 – 0.012 0.013 AS-4133 HS 50 % RH 4.3 – 3.4 – AS-4133 HS 50 % RH 0.020 – 0.019 – AT-1002 HS Dry 3.3 – 3.3 – AT-1002 HS Dry 0.004 – 0.016 – AT-1002 HS 50 % RH 3.8 – 3.8 – AT-1002 HS 50 % RH 0.018 – 0.035 – AT-5001 Dry 3.2 – 3.2 – AT-5001 Dry 0.004 – 0.016 – AT-5001 AT-5001 50 % RH 3.6 – 3.6 – 50 % RH 0.012 – 0.027 – AT-6115 HS Dry – 4.0 3.3 3.1 AT-6115 HS Dry – – 0.013 0.011 AFA-6133 V0 Z Dry – 4.8 4.1 3.7 AFA-6133 V0 Z Dry – – 0.011 – A-1240L Dry – 4.2 4.0 – A-1240L Dry – 0.006 0.017 – A-1240L 50 % RH – 4.4 4.0 – A-1240L 50 % RH – 0.007 0.019 – A-1340 HS Dry – 4.5 4.3 – A-1340 HS Dry – 0.005 0.017 – A-1340 HS 50 % RH – 4.5 4.3 3.8 A-1340 HS 50 % RH – 0.008 0.017 0.014 Dry – 5.7 4.7 4.5 AS-1566 HS Dry – – 0.011 0.011 AS-1566 HS (1) Condition: dry is dry as molded, 50 % RH is moisture conditioned as described on page 8 Dissipation Factor - ASTM D150 Dissipation Factor (also referred to as loss tangent or tan delta) is a measure of the dielectric loss, or energy dissipated, when alternating current loses energy to an insulator. In general, low dissipation factors are desirable because they correspond to a better dielectric material. Contamination, testing frequency, temperature, and humidity can affect the dissipation factor. UL 746A Short-Term Properties Certain electrical properties are included in the Underwriters Laboratories (UL) Standard 746A entitled Standard for Polymeric Materials Short-term Property Evaluations and these properties are reported by “Performance Level Category” (PLC). For each property, UL has specified test result ranges and corresponding Performance Level Categories (PLC). Desired or best performance is assigned to a PLC of 0; therefore, the lower the PLC, the better the performance in that test. (1) Condition: dry is dry as molded, 50 % RH is moisture conditioned as described on page 8 High-Voltage, Low-Current, Dry Arc Resistance – ASTM D495 This test measures the time, in seconds, that a 12,500 volt arc can travel between two tungsten rod electrodes on the surface of a material, following a specified test sequence of increasing severity, until a conductive path or track is formed. This test is intended to approximate service conditions in alternating-current circuits operating at high voltage with currents generally limited to less than 0.1 ampere. Table 3.28 shows the relationship between the arc resistance and the UL assigned Performance Level Categories. Table 3.28 High-voltage, low-current, dry arc resistance performance level categories (PLC) Value Range [Sec.] > < 420 Assigned PLC 0 360 420 1 300 360 2 240 300 3 180 240 4 120 180 5 60 120 6 0 60 7 Amodel® PPA Design Guide / 53 Comparative Tracking Index (CTI) – ASTM D3638 Hot Wire Ignition (HWI) - ASTM D3874 The Comparative Tracking Index is defined as the voltage that causes the formation of a permanent electrically conductive carbon path when 50 drops of electrolyte are applied at a rate of 1 drop every 30 seconds. This test measures the susceptibility of an insulating material to tracking. Table 3.29 shows the relationship between the voltage obtained and the PLC. This test measures the relative resistance of plastic materials to ignition by an electrically heated wire. A portion of a test specimen is wrapped with a heater wire under specified conditions and a current is passed through the wire at a linear power density of 2.6 W/mm (65 W/in.). The current flow is maintained until ignition occurs, and the time to ignition is recorded. Table 3.29 Comparative tracking index performance level categories Under certain operational or malfunction conditions, components become abnormally hot. If these overheated components are in intimate contact with the insulating materials, the insulating material may ignite. The intention of this test is to determine relative resistance of insulating materials to ignition under these conditions. Table 3.31 shows the hot wire ignition times and the assigned PLC. Value Range [Volts] > < Assigned PLC 600 0 400 600 1 250 400 2 175 250 3 100 175 4 0 100 5 Table 3.31 Hot wire ignition performance level categories Value Range [Sec.] < High-Voltage Arc-Tracking-Rate (HVTR) This test measures the susceptibility of an insulating material to form a visible carbonized conducting path (track) over its surface when subjected to repeated highvoltage, low-current arcing. The value of the high-voltage, arc-tracking rate is the rate, in mm/minute, at which a conducting path is produced on the surface of a material under standardized test conditions. This test simulates a malfunctioning high-voltage power supply with lower values indicating better performance. Table 3.30 shows the HVTR values and the corresponding PLC. Table 3.30 High-voltage arc-tracking-rate performance level categories Value Range [mm/min] < Assigned PLC 0 10 0 10 25.4 1 > 25.4 80 2 80 150 3 150 54 \ Amodel® PPA Design Guide 4 > Assigned PLC 120 0 120 60 1 60 30 2 30 15 3 15 7 4 7 0 5 High-Current Arc Ignition (HAI) This test measures the relative resistance of insulating materials to ignition from arcing electrical sources. Under certain conditions, insulating materials may be in proximity to arcing. If the intensity and duration of the arcing are severe, the insulating material can ignite. This test measures the number of 240-volt 32.5 ampere arcs on the surface of a material required to cause ignition or a hole. The distance between the electrodes in increased at a rate of 254 mm (10 in.) per second. The maximum number of arcs to be used is 200. The relationship between the mean time to ignition and the Performance Level Categories is given in Table 3.33. Table 3.33 High voltage arc resistance to ignition performance level categories HVAR - Mean Time to Ignition [Sec.] < > Assigned PLC 300 0 300 120 1 120 30 2 30 0 3 This test measures the performance of an insulating material in close proximity to arcing. UL 746A Properties of Amodel® Resins Table 3.32 shows the relationship between the High-Current Arc Ignition value and the UL assigned Performance Level Categories. Selected UL 746A properties for selected Amodel® grades are shown in Table 3.34. The grades selected are the ones most often used for electrically insulating applications. Table 3.32 High-current arc ignition performance level categories Table 3.34 UL 746A property PLC for Amodel® PPA grades Grade Value Range [Sec.] < > 120 Assigned PLC A(AS)-1133 HS HAI HVTR CTI 0.80 0 0 4 0 (2) AT-6115 HS 0.80 0 1 0 0.80 4 0 1 0 0.80 – 0 0 0 (2) 120 60 1 60 30 2 AS-1566 HS 15 HWI 0 AT-6130 30 mm(1) 0 3 A-1340 HS 0.80 0 0 1 1 0.80 0(2) 0 1 0 15 7 4 AS-4133 HS 7 0 5 AFA-4133 V0 Z 0.75 0 0 1 1 AFA-6133 V0 Z 0.75 0 0 1 1 High-Voltage Arc Resistance to Ignition AFA-6145 V0 Z 0.75 0 1 – 1 This test measures the susceptibility of a material to resist ignition or form a visible carbonized conducting path when subjected to high-voltage, low-current arcing. The application of the high-voltage arc is continued until ignition, a hole is burned through the specimen, or 5 minutes. If ignition occurs, the time to ignition is reported. If ignition does not occur the value > 300 is reported. (1) (2) Minimum thickness, mm This value measured at 1.5 mm thickness UL Relative Thermal Indices The UL Relative Thermal Indices are the result of thermal aging tests and, therefore, appear in the Thermal Stability section on page 49. Amodel® PPA Design Guide / 55 Environmental Resistance As previously mentioned, the performance of polymeric materials may be reduced by environmental factors. This section discusses the effects of environmental factors on the performance of Amodel® resins such as chemical exposure, conditions likely to promote hydrolysis, and exposure to gamma and/or ultraviolet radiation. When appropriate, the effects of these environmental factors on the performance of competitive resins is included for comparison. Chemical Resistance Amodel® resins are semi-crystalline polyphthalamides, and like other members of the semi-crystalline polyamide family, they exhibit excellent chemical resistance to common organic solvents. However, the chemical structure of Amodel® resins is highly aromatic, imparting an even greater degree of chemical resistance to an even broader range of chemicals. It is difficult to predict the exact effect of chemical exposure on a polymeric component because the reagent, the concentration of the reagent, the exposure time, the temperature of the reagent, the temperature of the polymeric component, and the stress on the component all affect the extent of attack and any change in performance. While the only reliable method for evaluating the effect of chemical attack on the performance of a polymeric component is prototype testing; screening tests are often performed to provide general guidance and compare materials. Screening chemical resistance testing was performed by immersing ASTM D638 Type I tensile bars in various chemicals for 30 days at the indicated test temperatures. The Amodel® AS-1133 HS resin used was the 33 % fiber glass reinforced grade. Data on 33 % glass reinforced PA 6,6 and 30 % glass reinforced polyethylene terephthalate (PET) is provided for comparison. 56 \ Amodel® PPA Design Guide The material performance was rated as shown in Table 3.35. In addition to the performance rating, data on the percent change in tensile strength, length, and weight are reported. Table 3.35 Key to chemical resistance ratings Symbol Rating Reduction in Tensile Strength [%] E Excellent ≤ 10 A Acceptable ≤ 50 but ≥ 10 U Unacceptable > 50 The chemicals used for the screening tests were classified into three groups: • Organic solvents (Table 3.36) • Aqueous solutions (Table 3.37) • Automotive fluids (Table 3.38) The screening evaluation using aqueous solutions at elevated temperatures showed a loss in tensile strength for all three of the resins tested. This phenomenon is common to all glass reinforced thermoplastics. The loss of tensile strength for Amodel® AS-1133 HS resin in deionized water at 93 °C (200 °F) is initially rapid due to loss of interfacial adhesion between the glass fibers and the resin matrix, and then slows to a gradual rate reflecting hydrolytic attack. Aqueous solutions of antifreeze or zinc chloride produce a similar effect. PA 6,6 is severely attacked by the zinc chloride solution. PET is severely attacked by the antifreeze solution and even badly hydrolyzed by distilled water at elevated temperatures. Table 3.36 Resistance to organic chemicals — 30-day immersion at 23 °C (73 °F) Resin Rating Tensile Strength Retained [%] Amodel® AS-1133 HS E 97 0.1 33 % Glass PA 6,6 E 99 0.2 0.2 30 % Glass PET A 72 0.3 3.2 Amodel® AS-1133 HS E 99 0.0 0.2 Reagent Acetone Isopropanol Methanol Methylene chloride Methyl ethyl ketone Toluene 1,1,1 Trichloroethane Trichloroethylene Freon 113 ® n-Heptane Change in Length [%] Change in Weight [%] 0.2 33 % Glass PA 6,6 E 112 0.0 0.3 30 % Glass PET E 109 0.0 0.3 Amodel AS-1133 HS A 83 0.1 2.9 33 % Glass PA 6,6 A 68 0.5 5.6 30 % Glass PET E 96 0.1 0.5 Amodel AS-1133 HS E 94 0.0 1.1 33 % Glass PA 6,6 E 90 0.1 2.4 30 % Glass PET A 71 2.0 9.5 Amodel AS-1133 HS E 103 0.0 0.1 33 % Glass PA 6,6 A 113 0.0 0.1 30 % Glass PET A 72 0.1 3.0 Amodel AS-1133 HS E 101 0.0 0.1 33 % Glass PA 6,6 E 109 0.1 0.2 30 % Glass PET E 91 0.1 1.6 Amodel AS-1133 HS E 99 0.0 0.2 33 % Glass PA 6,6 E 110 0.0 0.2 ® ® ® ® ® 30 % Glass PET E 100 0.0 2.3 Amodel® AS-1133 HS E 102 0.0 0.3 33 % Glass PA 6,6 E 97 0.0 0.4 Amodel AS-1133 HS E 96 0.0 0.1 33 % Glass PA 6,6 E 99 0.0 0.2 Amodel® AS-1133 HS E 104 0.0 0.1 33 % Glass PA 6,6 E 96 0.0 0.2 ® Freon is a registered trademark of E. I. duPont de Nemours and Company. Amodel® PPA Design Guide / 57 Table 3.37 Resistance to aqueous chemical solutions — 30 day immersion at indicated temperature Reagent Ammonium hydroxide Deionized water Sodium chloride Zinc chloride Sulfuric acid Sodium hydroxide Sodium hypochlorite Conc. Temperature [%] [°C (°F)] 10 100 10 50 36 10 5 * Attacked 58 \ Amodel® PPA Design Guide 23 (73) 93 (200) 23 (73) 93 (200) 23 (73) 23 (73) 23 (73) Resin Tensile Strength Rating Retained [%] Amodel® AS-1133 HS E 33 % Glass PA 6,6 30 % Glass PET Change in Change in Length [%] Weight [%] 96 0.1 0.8 A 61 0.2 4.5 E 95 0.2 0.4 Amodel AS-1133 HS A 69 0.2 3.4 33 % Glass PA 6,6 A 62 0.2 5.0 30 % Glass PET U 19 0.0 2.4 ® Amodel AS-1133 HS E 97 0.1 2.1 33 % Glass PA 6,6 A 67 0.2 3.3 30 % Glass PET E 98 0.0 0.3 Amodel AS-1133 HS A 66 0.1 4.8 33 % Glass PA 6,6 U 0 * * 30 % Glass PET A 54 -0.1 0.6 Amodel AS-1133 HS E 92 0.0 1.8 33 % Glass PA 6,6 U 0 * * 30 % Glass PET E 94 0.0 0.3 Amodel AS-1133 HS E 93 0.0 1.6 33 % Glass PA 6,6 A 62 0.0 3.1 ® ® ® ® 30 % Glass PET A 70 0.0 -4.2 Amodel® A-1133 HS E 94 0.0 1.4 33 % Glass PA 6,6 A 57 0.0 -1.5 30 % Glass PET E 94 0.0 0.4 Table 3.38 Resistance to transportation fluids – 30 day immersion at indicated temperature Fluid 50 % Antifreeze solution Brake fluid Diesel fuel Gasohol (10 % ethanol) Hydraulic fluid JP-4 jet fuel Motor oil Power steering fluid Transmission fluid Unleaded gasoline Temperature [°C (°F)] Resin 104 (220) Amodel® AS-1133 HS 49 (120) 23 (73) 23 (73) 49 (120) 23 (73) 121 (250) 49 (120) 121 (250) 23 (73) Tensile Strength, Rating Retained [%] Change in Length [%] Change in Weight [%] A 77 0.2 5.6 33 % Glass PA 6,6 A 54 0.3 8.3 30 % Glass PET U 0 * * Amodel AS-1133 HS E 99 0.0 0.4 33 % Glass PA 6,6 E 105 -0.1 0.2 30 % Glass PET E 97 0.0 1.0 Amodel AS-1133 HS E 98 0.0 0.1 33 % Glass PA 6,6 E 100 0.0 0.3 30 % Glass PET E 100 -0.1 0.0 Amodel AS-1133 HS A 86 0.0 1.4 33 % Glass PA 6,6 A 65 0.1 3.5 30 % Glass PET E 93 -0.1 0.7 Amodel AS-1133 HS E 92 0.0 0.3 33 % Glass PA 6,6 E 103 0.0 0.3 30 % Glass PET E 105 -0.1 0.1 Amodel AS-1133 HS E 95 0.0 0.4 33 % Glass PA 6,6 E 100 0.0 0.3 30 % Glass PET E 100 0.0 0.1 Amodel AS-1133 HS E 100 0.0 0.1 33 % Glass PA 6,6 E 106 0.0 -0.2 30 % Glass PET E 91 -0.1 -0.6 ® ® ® ® ® ® Amodel AS-1133 HS E 97 0.0 0.1 33 % Glass PA 6,6 E 106 0.0 0.2 30 % Glass PET E 108 0.0 0.0 ® Amodel AS-1133 HS E 97 0.0 0.1 33 % Glass PA 6,6 E 105 -0.1 -0.2 ® 30 % Glass PET A 64 0.1 -0.5 Amodel® AS-1133 HS E 96 0.1 0.0 33 % Glass PA 6,6 E 99 0.1 0.1 30 % Glass filled PET E 99 0.0 0.1 * Attacked Amodel® PPA Design Guide / 59 Chemical Compatibility Table 3.39 can be used as a general guide to the chemical resistance of Amodel® resins. However, this data should be used for screening only. As mentioned earlier, the performance of Amodel® resins under actual chemical exposure conditions will vary with differences in mechanical stress, concentration, time and/or temperature. It is recommended that tests be conducted under conditions close to those anticipated in the actual application to get reliable performance information. Gamma Radiation Amodel® AS-1133 HS resin has excellent resistance to gamma radiation. Tests on injection molded tensile bars exposed to 5.0 megarads of gamma radiation indicate essentially no significant affect on the mechanical properties of Amodel® AS-1133 HS resin. Results are given in Table 3.40. Table 3.39 General chemical compatibility guidelines for Amodel® PPA resins Reagent Rating Aliphatic hydrocarbons E Aromatic hydrocarbons E Oils E Greases E Chlorinated hydrocarbons E Methylene chloride A Chloro-fluoro carbons E Ketones E Esters E Higher alcohols E Methanol A Phenols U Strong acids A Alkalis E Table 3.40 Effect of gamma radiation on Amodel® AS-1133 HS % Retention of Tensile strength [psi (kPa)] Tensile elongation [%] 60 \ Amodel® PPA Design Guide 5 mrad Exposure 90 (620) 100 Design Information In this section, basic design principles and general recommendations are presented to assist the design engineer in designing plastic components that meet the cost/performance requirements of their applications. Guidelines are given on the effects of stresses caused by assembly, temperature changes, environmental factors, and time as it relates to creep. Of the various materials available to a design engineer, thermoplastics offer the greatest variety, versatility and freedom of design. Plastics can be translucent or opaque, rigid or flexible, hard or soft. Plastic materials are available that provide a wide range of chemical resistance, from chemically inert to selective solubility in certain environments. Broad versatility is also available for other properties like strength, stiffness and impact resistance, lubricity and thermal capability. Blends and alloys are possible that further increase the material choices for a particular application. At times, designing with plastics may appear more complicated than with metals. But the diversity of products, conversion processes, and secondary operations (welding, inserts, printing, painting, metallizing) available with plastics gives the designer unprecedented freedom as shown in Table 4.1. A designer may be tempted to make a plastic part that merely duplicates the dimensions of a metal part without taking advantage of the versatility of the plastic material or the design freedom offered. This approach can lead to inefficient designs or parts that are difficult to produce, or whose performance is less than optimal. Table 4.1 Design benefits of Amodel® resin over metals Amodel® Resin Characteristics Amodel resins are fabricated by the injection molding process, which allows substantial design freedom ® Benefit in Design Ribs, bosses, or cored sections can be readily incorporated. Snap fits can be molded in, simplifying assembly. Eliminate many secondary operations such as drilling, tapping, boring, deburring, and grinding. Metal inserts can be easily used where necessary to optimize part strength. Features from several metal parts of an assembly may be combined into a single part, simplifying assembly and reducing cost. Amodel® resins are thermoplastic Parts may be joined with ultrasonic or vibration welding rather than fasteners. Color may be molded-in rather than added afterward as paint. Amodel® resins resist chemicals Parts will not rust, and resist corrosion. The following sections discuss those areas of mechanical design and stress analysis that relate to designing with plastics, comparing metal to plastics and discussing factors that are specific to plastics alone. Amodel® PPA Design Guide / 61 Mechanical Design The use of classical stress and deflection equations provide starting points for part design. Mechanical design calculations for Amodel® resins will be similar to those used with any engineering material. As with all plastics, however, the analysis used must reflect the viscoelastic nature of the material. In addition, the material properties can vary with strain rate, temperature, and chemical environment or with fiber orientation for fiber reinforced plastics. Therefore, the analysis must be appropriate for all anticipated service conditions. For example, if the service condition involves enduring load for a long period of time, then the apparent or creep modulus should be used instead of the short-term elastic modulus. If the loading is cyclical and long term, the fatigue strength at the design life will be the limiting factor. The initial step in any part design analysis is to determine the loads the part will be subjected to, and to calculate the resultant stress and deformation or strain. The loads may be externally applied or result from stresses due to temperature changes or assembly. An example of an externally applied load is the weight of medical instruments on a sterilizer tray. Examples of assembly loads are the loads on a housing flange when it is bolted to an engine or the load on the hub of a pulley when a bearing is pressed into it. Thermally induced stresses can arise when the temperature of the assembly increases and the dimensions of the plastic part change more or less than the metal part to which it is attached. 62 \ Amodel® PPA Design Guide Figure 4.1 Maximum stress and deflection equations Simply supported beam Concentrated load at center Cantilevered beam ( one end fixed ) Concentrated load at free end F F FL 4Z ( at load ) σ= L Y FL3 48EI ( at load ) Y= Simply supported beam Uniformly distributed load L FL Z ( at support ) σ= Y Cantilevered beam ( one end fixed ) Uniformly distributed load F ( total load ) F ( total load ) FL σ= 8Z ( at center ) FL 2Z ( at support ) σ= 5FL3 384EI ( at center ) L Y Both ends fixed Concentrated load at center FL3 8EI ( at support ) Y= Y= L Y Both ends fixed Uniformly distributed load F FL σ= 8Z ( at supports ) ½L L FL3 8EI ( at load ) Y= Y FL3 192EI ( at load ) F ( total load ) Y Y= FL σ= 12Z ( at supports ) FL3 384EI ( at center ) Y= L Amodel® PPA Design Guide / 63 Figure 4.2 Area and moment equations for selected cross sections Rectangular I-beam na d d c= 2 d bd3 I= 12 c d 2 I= bd3 – h3 (b – t ) 12 s Z= bd3 – h3 (b – t ) 6d b H-beam A= c= d na I= c Z= πd2 4 s d 2 A = bd – h (b – t ) h b πd4 na c= b 2 I= 2sb3 + ht3 12 c 64 Z= t πd3 32 Tube 2sb3 + ht3 6b d Hollow rectangular A= di do I= A = b1d1 – b2d2 π ( d o2 – d i 2 ) 4 d c= o 2 c na d2 b2 b1 π ( d o4 – d i 4 ) 32do T-beam or rib c= d1 2 I= b1d13 – b2d23 12 Z= b1d13 – b2d23 6d1 d1 c π ( d o4 – d i 4 ) 64 Z= s h c= c Circular na na bd2 Z= 6 b A = bd – h (b – t ) t A = bd U-beam A = bs + ht b c=d– na d h c Z= d2t + s2 ( b – t ) 2 ( bs + ht ) tc3 + b ( d – c )3 – ( b – t ) ( d – c – s )3 I= 3 A = bd – h (b – t ) h c=b– c t na I c t 64 \ Amodel® PPA Design Guide s b I= 2b3s + ht3 – A ( b – c )2 3 Z= d 2b2s + ht2 2A I c Using Classical Stress/Strain Equations To use the classical equations, the following simplifying assumptions are necessary: • The part can be analyzed as one or more simple structures • The material can be considered linearly elastic and isotropic • The load is a single concentrated or distributed static load gradually applied for a short time • The part has low residual or molded-in stresses While all of these assumptions may not be strictly valid for a particular situation, the classical equations can provide a starting point for analysis. The design engineer can then modify the analysis to take into consideration the effects of the simplifying assumptions. A variety of parts can be analyzed using a beam bending model. Figure 4.1 lists the equations for maximum stress and deflection for some selected beams. The maximum stress (σ) occurs at the surface of the beam furthest from the neutral surface and is given by: σ = Mc = M I Z Where: M = Bending moment, N · m (in.lb) c = Distance from neutral axis, m (in.) I = Moment of inertia, m4 (in.4 ) Z = I = Section modulus, m3 (in.3 ) c Figure 4.2 gives the cross-sectional area (A), the moment of inertia (I), the distance from the neutral axis (c), and the section modulus (Z) for some common cross sections. For other cross-sections and/or geometries, the design engineer can consult stress analysis handbooks or employ finite element analysis. Limitations of Design Calculations The designs given by the application of the classical mechanical design equations are useful as starting points, but some critical factors are simply not adequately considered by these analyses. The viscoelastic behavior of polymeric materials limits application of some of the design equations to, for example, low deflection cases. Often the calculation of maximum stress contains a number of simplifying assumptions that can diminish the credibility of the results, or the expected failure mode is buckling or shear, where the appropriate property data is lacking. Also, the impact resistance of a design is directly related to its ability to absorb impact energy without fracture. It is difficult to predict the ability of a design to absorb energy. In addition, even armed with the energy absorption requirements, practical toughness constants for engineering resins don’t exist. The results of laboratory testing vary with the type and speed of the impact test, even for fixed geometries. Therefore, the ability of the design to withstand impact must be checked by impact testing of prototype parts. Similarly, fatigue test results will vary depending on the cyclic rate chosen for the test, the dynamics of the test, and the test specimen used. Therefore, they should only be used as a rough indication of a material’s ability to perform in a fatigue application. Deflection Calculations To determine the deflection of a proposed part design using classical equations, a modulus of elasticity value is required. It is important that the appropriate value be used. The value must represent the modulus of the material at or near the temperature and humidity expected in the application. Room and elevated temperature values can be found in the property tables on pages 7 to 20. If the load is sustained, then the apparent or creep modulus should be used. Values are given in the isochronous stress/strain curves, in Figures 3.40 and 3.41 on page 35. Stress Calculations After the designer has calculated the maximum stress, those values are then compared to the appropriate material property, i.e., tensile, compressive, or shear strength. The comparison should be appropriate in terms of temperature and humidity to the requirements of the application. Reinforcing Fiber Orientation Considerations When designing with plastics, especially filled plastics, the designer must be cognizant of the effects of the fillers and reinforcing fibers on the mechanical properties of the plastic. The processing of filled plastics tends to cause orientation of fibers or high-aspect-ratio fillers parallel to the direction of flow. Throughout this manual, properties have been given both with and across flow direction whenever practical. Since the design of the part and the processing are interrelated, the designer should consider what portions of the part are likely to be oriented and how the properties will be affected. Shrinkage, strength, stiffness, and coefficient of thermal expansion will differ depending on the aspect ratio of the fiber (the ratio of its length to its diameter) and the degree of fiber orientation. Perpendicular to the fiber orientation, the fibers act more as fillers than as reinforcing agents. Amodel® PPA Design Guide / 65 When molding polymers, there are instances where melt fronts meet (commonly known as weld lines) such as when the plastic melt flows around a core pin. However, the reinforcement in the plastic, if present, does not cross the weld line. Thus the weld line does not have the strength of the reinforced polymer and at times can even be less than the matrix polymer itself. These factors must be taken into account when designing parts with reinforced plastics. Designing for Equivalent Part Stiffness Sometimes, a design engineer wants to replace a metal part with one made of plastic, but still wants to retain the rigidity of the metal part. There are two fairly simple ways to maintain the stiffness of a part when substituting one material with another material, even though the materials have different moduli of elasticity. In the first method, the cross-sectional thickness is increased to provide the stiffness. In the second, ribs are added to achieve greater stiffness. An example of each approach follows. Changing section thickness In reviewing the deflection equations in Figure 4.1, the deflection is always proportional to the load and length and inversely proportional to the modulus of elasticity and moment of inertia. Selecting one case, for example, both ends fixed with a uniformly distributed load, the deflection is determined by: Y= Therefore, to equate the stiffness using two different materials, the deflections are equated as follows: 384EI =Y= metal Substituting the E values in equation 1: ( 44.8 × 10⁹ ) I metal = ( 13.8 × 10⁹ ) I Amodel 3.25 I metal = I Amodel From Figure 4.2, the moment of inertia for rectangular sections is: I= bd3 12 where b is the width and d is the thickness of the section, substituting into our equation to determine the required thickness yields: 3.25 d3 metal = d3 Amodel If d for the metal part is 2.54 mm (0.10 in.) then the thickness of Amodel® resin is: dAmodel = 3 3.25 ( 2.54 )3 = 3.76 mm ( 0.148 in. ) or 48 % thicker than the magnesium part. However, ribs can be used to effectively increase the moment of inertia as discussed in the next section. FL3 384EI FL3 If the metal part were magnesium having a modulus of elasticity E of 44.8 GPa (6.5 Mpsi) and the thermoplastic chosen to replace it was Amodel® AS-1145 HS resin having a modulus of elasticity of 13.8 GPa (2.0 Mpsi), we need to increase the moment of inertia I of the plastic version by increasing the part thickness or adding ribs. FL3 384EI plastic Since the load and length are to remain the same, the FL3 becomes a constant on both sides of the equation and what remains is: Equation 1 [ EI ] metal = [ EI ] plastic This, then, is the governing equation for equating part stiffness. 66 \ Amodel® PPA Design Guide Adding ribs to maintain stiffness In the last section, it was determined that if a metal part were to be replaced with a part molded of Amodel® AS-1145 HS resin, a part thickness of 3.7 mm (0.148 in.) would be required to equal the stiffness of a 2.5 mm (0.100 in.) thick magnesium part. By incorporating ribs into the Amodel® design, the wall thickness and weight can be reduced very efficiently, yet be as stiff as the magnesium part. To demonstrate this, the moment of inertia (I) of the new rib design can be equated with that of the 3.7 mm (0.148 in.) thick plate design. Selecting the same material, Amodel® AS-1145 HS, the modulus of elasticity remains 13.8 GPa (2.0 Mpsi) in both cases; therefore, if the moment of inertia of the ribbed design is equal to the plate design, the parts will have equivalent deflection and/or stiffness. Designing for Sustained Load Up to this point, the stress strain calculations and examples have dealt with immediate stress/strain response and therefore short-term properties. If the part in question must sustain loads for long periods of time or at elevated temperatures, apparent (creep) modulus values must be used to account for the additional strain and part deflection that may occur. An example showing how the calculations are modified for sustained load follows. From Figure 4.2, the I for a ribbed section is selected. By assuming that the section width “b” is the same for both, the Irib has to be equal or greater than the Iplate. Assigning a section width “b” = 25.4 mm (1.0 in.), the moment of inertia of a ribbed construction that will satisfy that condition can be calculated. If a cantilever beam with a rectangular cross-section, as shown in Figure 4.4, is loaded with a 10 kg (22.0 lb) force at the free end, what is the deflection after 1,000 hours? The moment of inertia for the plate design is: Figure 4.4 Cantilever beam, bending load example Iplate = Calculating deflection F = 10 kg ( 22.0 lb ) bh3 25.4 × ( 3.76 )3 = = 112.5 mm4 ( 2.70 × 10⁻⁴ in4 ) 12 12 d = 6 mm ( 0.24 in ) By choosing the arbitrary rib design shown in Figure 4.3, and working through the calculations, the moment of inertia is found to be: Y L = 100 mm ( 3.94 in ) Irib = 1379 mm4 ( 33.9 × 10⁻⁴ in4 ) Figure 4.3 A dding ribs to increase stiffness 1.9 mm ( 0.075 in ) From Figure 4.1 on page 63, the deflection of a cantilever beam is given by: Y= 12.7 mm ( 0.50 in ) b = 25 mm ( 0.98 in ) FL3 3EI where I, the moment of inertia, as shown in Figure 4.2 is: I= bd3 12 and E is the flexural modulus of the material. 25.4 mm ( 1.00 in ) Calculating the moment of inertia for this example gives: 2.54 mm ( 0.100 in ) Therefore, the ribbed design will be 9.5 times stiffer than the Amodel® plate design or the original magnesium part that was 2.5 mm (0.100 in.) thick. The same rib having half the height would still produce a part twice as stiff as the magnesium part. The ribbed design shown requires placing a rib every 25 mm (1 in.) of section width. I= ( 25 )( 6 )3 = 450 mm4 ( 1.081 × 10³ in4 ) 12 The data sheet for Amodel® A-1133 HS resin gives 11.6 GPa (1.68 Mpsi) for the flexural modulus. Using this value and the equation previously cited, the short-term room temperature deflection can be calculated by: Y= ( 10 kg × 9.8066 )( .1 m )3 3( 11.6 × 10⁹ Pa )( 4.5 × 10⁻¹⁰ m4 ) Y = 6.3 mm ( 0.25 in ) Amodel® PPA Design Guide / 67 If the application requires that the load be sustained for a long time, we would expect the deflection to be greater than this because of creep. To calculate the deflection considering the creep, we would use the apparent modulus instead of the short-term flexural modulus. The value of apparent modulus shown for Amodel® A-1133 HS resin at 1,000 hours in Figure 4.5 is 7.58 GPa (1.10 Mpsi). Therefore the calculated deflection is: Y= ( 10 kg × 9.8066 )( .1 m )3 3( 7.58 × 10⁹ Pa )( 4.5 × 10⁻¹⁰ m4 ) Y = 9.6 mm ( 0.38 in ) The deflection is about 50 % greater when a sustained load is considered. 200 25 Stress [ MPa ] 15 100 10 50 0 0.01 65 °C ( 149 °F ) 100 °C ( 212 °F ) 150 °C ( 302 °F ) 0.1 1 10 5 100 Time to rupture [ hours ] 68 \ Amodel® PPA Design Guide 0 1,000 10,000 Stress [ kpsi ] 20 If a load is sustained for a long time and if the load and/ or temperature are high enough, rupture of the part will eventually occur due to creep. To estimate the combinations of time, temperature, and load that will cause this type of failure, creep rupture tests are conducted at various temperatures as shown in Figure 4.5. This figure illustrates the actual time to failure for different levels of stress so that a creep rupture envelope can be obtained. From this envelope, the safety factor in time or stress can be determined for that particular temperature. For instance, if the application life is 1,000 hours at 65 °C (149 °F) for a part molded from Amodel® A-1133 HS resin, the curve indicates that rupture will occur within that time frame if the part is exposed to a stress level of approximately 158 MPa (23 kpsi). Figure 4.5 Tensile creep rupture, Amodel® A-1133 HS resin 150 Calculating allowable stress - creep rupture If the part can be redesigned to reduce the stress to 124 MPa (18 kpsi), the predicted time to rupture is now well beyond 10,000 hours. This automatically builds a safety factor into the design. Actual part testing is still recommended to confirm these results. For operating temperatures that are different from the tested temperatures, information is usually extrapolated from known creep rupture envelopes to approximate the envelope for the temperature of interest. Considering Stress Concentrations Considering Thermal Stresses Classical mechanical design may result in a component design which fails prematurely or at a much lower stress than predicted. This could arise due to stress concentration. Stress concentrations may occur at sharp corners, around holes, or other part features. Impact and fatigue situations are especially sensitive to stress concentrations. When a plastic part attached to metal undergoes temperature changes, stresses may be induced that should be considered by the designer in the development of the part design. Minimizing sharp corners reduces stress concentrations and results in parts with greater structural strength. To avoid stress concentration problems, inside corner radii should be equal to at least half of the nominal wall thickness. A filled radius of 0.4 mm (0.015 in.) should be considered minimum. Figure 4.6 shows the effect of inside corner radius on the stress concentration factor. For example, if the nominal wall thickness is 2 mm (0.080 in.) and an inside corner radius is 0.5 mm (0.020 in.), then the radius to thickness ratio is 0.25 and the stress concentration factor will be over two. A stress of x will have the effect of over 2x on the part. Figure 4.7 illustrates a typical plastic flange fastened by a steel bolt to a steel frame. Because the thermal expansion of the plastic is significantly greater than that of the steel, an increase in temperature will produce an increase in compressive stresses in the plastic and tension in the bolt. It is the increase in compressive stress under the washer that must be considered if creep and loss of torque load on the bolt is of concern. Figure 4.7 Stress concentration factor at inside corners Steel bolt Washer Plastic Outside corners should have a radius equal to the sum of the radius of the inside corner and the wall thickness to maintain a uniform wall thickness. Figure 4.6 Stress concentration factor at inside corners L Steel Stress concentration factor 2.6 2.4 For example, the change in length of a material when exposed to a change in temperature is given by: 2.2 2.0 Δ L = L ( TF − TO ) α 1.8 1.6 1.4 1.2 1.0 0.0 0.2 0.4 0.6 0.8 1.0 1.2 1.4 Where: Δ L = change in length L = original length α = coefficient of thermal expansion TF = final temperature TO = initial temperature Radius / thickness ratio Amodel® PPA Design Guide / 69 Since the plastic is constrained, the unit elongation, combining both thermal expansion and strain, of both the steel bolt and the plastic, will be as follows: αS ( TF − TO ) + F F = αp ( TF − TO ) − ASES ApEp Where: AS = cross-sectional area of the bolt Ap = cross-sectional area of the washer ES = modulus of steel Ep = modulus of plastic αS = coefficient of thermal expansion of steel αp = coefficient of thermal expansion of plastic F = increase in the tensile force of the bolt Solving for F Figure 4.8 compares the amount of torque retained versus temperature. The coefficient of linear thermal expansion of Amodel® resin is lower than those of the other materials tested, and therefore closer to that of the steel. Figure 4.8 Bolt torque retention ( αp − αs ) ( TF − TO ) ASES AE 1+ S S ApEp F σ= Ap Loss of Bolt Tightness Due to Creep When threaded metal fasteners are used to retain or secure plastic parts to an assembly, and the assembly is subjected to changes in temperature, the difference between the thermal expansion coefficients of the metal and the plastic can cause problems. When a threaded fastener is tightened, the fastener is elongated slightly and a compressive stress is generated on the substrate. This compressive stress maintains the tightness of the bolt. When the assembly is heated, both the plastic part and the metal fastener will expand. The plastic part, however, is constrained by the metal fastener, and cannot expand. This results in increased compressive stresses in the plastic and a corresponding increased tendency for compressive creep or stress relaxation to occur. The relaxation of the compressive stress will result in reduced torque retention in the bolts. 70 \ Amodel® PPA Design Guide 75 100 125 150 175 200 225 60 6 50 5 40 4 30 3 20 2 A-1133 HS 33% GR PA 6,6 30% GR PA 6,6 1 0 20 40 60 Torque [ in-lb ] and the increase in compressive stress on the plastic will be: Temperature [ °F ] 50 7 Torque [ N-m ] F= To evaluate this tendency, 6.4 mm (0.250 in.) thick plaques of Amodel® A-1133 HS resin, 33 % glass reinforced PA 6,6 and 30 % glass reinforced PA 4,6 were bolted to a metal surface with steel machine bolts tightened to 6.8 N-m (60 in-lb) of torque with a torque wrench compressing the plastic plaque under the bolt face. The temperature of the bolted assemblies was then raised to the indicated temperatures shown in Figure 4.8, held for one hour, and then cooled to room temperature. The torque required to loosen the bolts was then measured. 10 0 80 100 120 Temperature [ °C ] The smaller difference in thermal expansion results in lower induced stress due to the compressive strain caused by the thermal excursion in the constrained part. This translates to lower creep and therefore better torque retention for such bolted assemblies. Designing for Assembly Interference or Press Fits One of the most economical methods that can be used to assemble two parts is a press fit. The joint is achieved by pressing or forcing the shaft into a hole whose diameter is smaller than the diameter of the shaft. The difference in diameter between the hole and shaft is referred to as the diametrical interference. The force maintaining the joint is primarily a compressive stress on the shaft resulting from the hoop stress in the hub created by the insertion of the shaft. Depending upon the relative moduli of the shaft and hub materials, the compressive stress in the shaft can also contribute to maintaining the joint. The stress holding an interference fit will exhibit relaxation over time in a manner that is analogous to creep, because the apparent modulus of the polymeric material decreases over time. Calculating the Allowable Interference The allowable interference between a shaft and a hub can be determined by using the general equation: I= SdDs F + υh 1 – υs + Eh Es F If the shaft and hub are made from the same grade of Amodel® resin, then: Eh = ES = E and the interference is: I= Sd F+1 D E s F If the hub is made from Amodel® resin and the shaft is made from metal, then the interference is: I= Sd Ds F + υh F Eh When a press fit is used with dissimilar materials, the differences in thermal expansion can increase or decrease the interference between two mating parts. This could increase or reduce the stress affecting joint strength. A press fit can creep or stress relax over time. This could cause a decrease in the retention force of the assembly. Therefore, testing the assembly under its expected operating conditions is highly recommended. and the geometry factor is given by: 2 1+ Ds Dh Ds Dh 2 1– F= Where: I = Diametrical interference Sd = Working stress Dh = Outside diameter of the hub Ds = Diameter of the shaft Eh = Modulus of the hub material Es = Modulus of the shaft material υh = Poisson’s ratio of the hub material υs = Poisson’s ratio of the shaft material F = Geometry factor Amodel® PPA Design Guide / 71 Mechanical Fasteners Self-tapping screws Mechanical fasteners provide an economical method of joining dissimilar materials together. Fasteners frequently used with injection molded plastic parts include screws, bolts, nuts, lock washers and lock nuts. When using metal mechanical fasteners, good design practice should be used to prevent the plastic parts being assembled from becoming overstressed. A common type of mechanical fastener used with plastics is a self-tapping screw. A self-tapping screw cuts or forms threads as it is inserted into the plastic and eliminates the need for molding internal threads or the secondary operation of tapping the thread form by machining. The major types are thread-forming and thread-cutting. The most obvious procedure for preventing a highly stressed assembly is to control the tightening of the mechanical fasteners with torque limiting drivers. When torque cannot be controlled, as might be the case with field assembly, shoulder screws will limit compression on the plastic part. Other alternatives may be to use flange-head screws, large washers or shoulder washers. Figure 4.9 presents some preferred designs when using mechanical fasteners. Figure 4.9 D esigning for mechanical fasteners Poor Better The modulus of elasticity of the plastic material plays an important role in deciding what type of self-tapping screw is most suitable for the application. For plastic materials with a modulus less than 3.0 GPa (440 kpsi), such as most unreinforced resins, thread-forming screws are best since the plastic is ductile enough to be deformed without cracking or shearing. For glass and mineral filled grades, thread-cutting screws are preferred. For optimum strip-out torque, the hole diameter of the boss should be equal to the pitch diameter of the screw. The outer diameter of the boss should be equal to two or three times the hole diameter and the boss height should be more than twice the thickness of the boss. Figure 4.10 illustrates the basic boss design for use with self-tapping screws. Figure 4.10 Boss design for self-tapping screws High bending stress as bolt is tightened Flathead screw Added bosses with small gap, when bosses touch, stress becomes compressive Boss o.d. < = 2 × pitch diameter Pitch diameter Truss or round head screw Radius 1 mm ( 0.039 in ) High stress from wedging action of screw head Recessed design avoids wedging stresses Standard screw can allow high stress on tightening Shoulder screw limits stress when tightened Repeated assembling and disassembling should be avoided when using self-tapping screws. If repeated assembly is required, thread-forming screws are recommended. To avoid stripping or high stress assemblies, torque controlled drivers should be used on assembly lines. Improving torque retention To minimize the loss of torque due to creep, reduce the compressive stress under the screw head by: • Increasing the screw head diameter • Using a large-diameter flat washer • Reducing the clamping torque • Using a spring or spiral washer • Using shoulder bolt to reduce stresses on plastic part • Using a metal bushing 72 \ Amodel® PPA Design Guide Tightening torque Pull-out force calculation Figure 4.11 shows how torque changes as a function of screw penetration. Tightening torque is the recommended installation torque for a given application. It must be high enough to fully engage the screw threads and develop clamp load but lower than the torque that would cause failure of the threads, known as the stripping torque. The strength of a joint can be characterized by the amount of force required to pull out a screw. The pull-out force can be estimated by using the following equation: Figure 4.11 Torque developed during screw installation Torque Stripping torque Clamp load Thread forming torque Head makes contact with captured material Driving torque Penetration depth The optimum tightening torque value can be calculated from the average driving torque and the average stripping torque using the following equation. TT = 1 2 3 1 T T + 2 D 2 s where TT = Tightening torque TD = Average driving torque TS = Average stripping torque Some self-tapping screws have been designed specifically for use with plastics and these have the advantage of having a greater difference between driving and stripping torque than the typical screws designed for metal. These special fasteners can provide an additional safety factor for automated assembly. F = π SDL where F = Pull-out force S = Shear strength D = Pitch diameter L = Thread engagement length When repeated assembly and disassembly are required or expected, threaded metal inserts should be used instead of self-tapping screws. Threaded inserts Threaded metal inserts can be used to provide permanent metal threads in a plastic part; a wide variety of sizes and types are available. Inserts are usually installed in molded bosses whose internal diameter is designed for the insert. The most commonly used metal inserts are either molded-in or ultrasonically placed in the part as a secondary operation. In the case of the molded-in insert, the insert is placed in the mold and the plastic is injected around it. Stress will develop when the plastic cools around the insert. To reduce this stress, heat the inserts to the temperature of the mold. The ultrasonic insert is pressed into the plastic by melting the plastic with high-frequency vibrations generated by an ultrasonic welding machine. The ultrasonic welding melts material around the metal insert as it is being installed, forming a bond between the insert and the plastic that is usually strong and relatively free of stress. Figure 4.12 depicts the recommended insert and boss designs for use with Amodel® PPA resin. Figure 4.12 Boss design for ultrasonic inserts Insert diameter Boss diameter = 2 × insert diameter 0.7 t t Amodel® PPA Design Guide / 73 Molded-in threads Straight cantilever beam equation One of the benefits of using plastic materials instead of metals is the ability to mold thread forms directly into the part. This eliminates the secondary machining operations needed with metal parts to form the threads. Molded-in threads can be either external or internal. In the case of internal threads, some type of unscrewing or collapsible core is required. External threads can be formed more easily if the parting line of the mold is perpendicular to the thread. The relationship between maximum deflection and strain for a straight cantilevered beam was calculated as follows: From Table 4.1, the cantilever beam was chosen and the drawing is repeated as Figure 4.14. The maximum stress, is given by the following: Designing with snap fits σ= FL Z Figure 4.14 Cantilever beam - concentrated load at free end F The use of snap fits in plastics is very prevalent. All snapfit designs require the plastic to flex like a cantilever spring as it moves past an interference that is designed on the mating part. Once the flexible arm moves past the interference, it returns to its normal unflexed, unstressed position. Usually a step or protrusion has been designed on the cantilever that engages and locks into the mating part, creating a simple assembly method without additional parts. This is shown in Figure 4.13. Figure 4.13 Cantilever type snap fit L Since this beam has a rectangular cross-section, Z= b I= d bd2 and 6 bd3 12 Therefore: L Y Each cantilever arm must deflect a distance “Y” in order to be inserted. The key to proper snap design is to not exceed the strain/stress limits of the material being used. A snap fit design that has been used for a ductile, low modulus plastic will probably not be suitable for a highly reinforced, very rigid plastic. For rigid materials, the length of the cantilever may be increased or the interference deflection “Y” reduced. Adding a “stop” can prevent over deflection of the cantilever during assembly. 74 \ Amodel® PPA Design Guide σ= FLd 2I The deflection of the beam, Y, is given by: Y= FL3 3EI Y Table 4.2 Strain recommendations for cantilever snap-fits Grade Maximum Strain [%] ET-1000 HS 1.0 A-1230 L 0.5 AS-1133 HS 1.0 Solving the deflection equation for F, the force needed to deflect the beam can be calculated as follows: Equation 1 F= Tapered Cantilever Beam Equation For the tapered design shown in Figure 4.15, hL is the thickness at the free end. The value of the proportionality constant, K, for a tapered beam design can be found in Figure 4.16. The maximum strain can be calculated from: Equation 4 ε= 3Yh0 2L2K Figure 4.15 Snap fit design using tapered beam L 3YEI L3 The modulus of elasticity, E, is defined as: E= σ ε and therefore ε = σ E substituting that in the cantilever stress equation: Equation 3 3Yd 2L2 This equation allows the designer to calculate the strain required from the maximum deflection of a design. Table 4.2 summarizes maximum strain recommendations for several grades of Amodel® resins. Once a suitable grade of Amodel resin has been selected, the basic equations can be used to find the load, F, needed to deflect the cantilever the required amount. ® In a cantilever snap fit, the stress and strain are maximum at the base of the cantilever and become proportionately lower toward the tip where the load is applied. In fact the stress and strain at any point can be calculated by substituting a different L, the distance from the load toward the fixed end. Therefore, if the cantilever thickness was gradually reduced from fixed end to tip, the beam will be able to deflect more than in the fixed thickness cantilever without incurring higher maximum stresses. In this way, the capability of the material can be maximized. For example, if the beam thickness has been gradually reduced to half its fixed end thickness; the ratio of hL to h0 would be 0.5 and K (from Figure 4.16) would be 1.6. Therefore, the maximum strain and the corresponding stress would be multiplied the reciprocal of K, 0.625. The strain will be reduced by about 40 % of the strain of a constant thickness cantilever beam design with equal deflection. Figure 4.16 Proportionality constant (K) for tapered beam 2.4 Proportionality constant [ K ] FLd 2EI Using the relationship of equation 1 and substituting for F in equation 2 the relationship between strain and deflection is derived: ε= hL h0 Equation 2 ε= Y maximum 2.2 2.0 1.8 1.6 1.4 1.2 1.0 0.3 0.4 0.5 0.6 0.7 0.8 0.9 1.0 Ratio of hL to hO Amodel® PPA Design Guide / 75 Designing for Injection Molding Draft Angle Many of the applications for Amodel PPA resins will be manufactured using the injection molding process. An engineer who has designed a part to meet the performance requirements of the application must also take into account the fact that there are elements in the part design that can influence moldability. These factors include wall thickness and wall thickness transitions, draft, ribs, bosses, and coring. The effect of these factors on moldability should be considered by the design engineer before a mold is built to make the part. To aid in the release of the part from the mold, parts are usually designed with a taper. The taper creates a clearance as soon as the mold begins to move, allowing the part to break free from its mold cavity. The taper is commonly referred to as draft, and the amount of taper as draft angle, as shown in Figure 4.18. ® Figure 4.18 Draft – designing for mold release Wall Thickness In general, parts should be designed with the thinnest wall that will have sufficient structural strength to support the expected loads, keep deflection within design criteria limits, have adequate flow, and meet flammability and impact requirements. Parts designed in this manner will have the lowest possible weight, and therefore the lowest material cost, and the shortest molding cycle. Wall Thickness Variation Part designs that contain uniform wall thicknesses are ideally suited for the injection molding process. They minimize molded-in stress, reduce the potential for sink marks on the surface of the part, and eliminate the potential for voids in a molded part. However, structural, appearance, and draft considerations may require varying wall thicknesses. When changes in wall section thickness are necessary, the designer should consider a gradual transition, such as the tapered or gradual designs shown in Figure 4.17. Figure 4.17 Wall thickness transition Poor Sharp Good Tapered Best Gradual Sharp transitions may create problems in appearance and dimensional stability, because they may result in differential cooling and turbulent flow. A sharp transition may also result in a stress concentration, which may adversely affect part performance under loading or impact. 76 \ Amodel® PPA Design Guide Draft angle Adequate draft angle should be provided to allow easy part removal from the mold. Generally, the designer should allow a draft angle of 0.5° to 1° per side for both inside and outside walls for Amodel® resins. However, in some special cases, smaller draft angles, as low as 1 ∕8 ° to 1 ∕4 °, have been used with draw polish on the mold surface. More draft should be used for deep draws or when cores are used. Textured finishes increase draft requirements by a minimum of 1° per side for each 0.025 mm (0.001 in.) of texture depth. Ribs Coring The stiffness of a part design can be increased with properly designed and located ribs, without creating thick walls as illustrated in the Design Section entitled “Adding Ribs to Maintain Stiffness” on page 66. Proper rib design will allow for decreased wall thickness. This will save material and weight, and shorten molding cycles. It will also eliminate thick walls, which can cause molding problems like sink marks on the surface of parts or voids on the inside of parts. Ribs that are correctly positioned may also function as internal runners, assisting plastic melt flow during molding. Proper design practice should include uniform wall thickness throughout a part. Heavy sections in a part can extend cycle time, cause sink marks on the part surface, cause voids within the part and increase molded-in stresses. In general, the following guidelines should be used when designing with ribs. The thickness at the rib base should be no greater than 60 % of the adjacent wall thickness. When ribs are opposite appearance areas, the width should be kept as thin as possible. If there are areas in the molded part where structure is more important than appearance, then ribs are often 75 %, or even 100 %, of the outside wall thickness. Whenever possible, ribs should be smoothly connected to other structural features such as side walls, bosses, and mounting pads. If there are several ribs in a part, they need not be constant in height or width, and are often matched to the stress distribution in the part. All ribs should have a minimum of ½ ° of draft per side and should have a minimum radius of 0.8 mm (0.03 in.) at the base to reduce stress concentrations and sink marks. Figure 4.19 shows the recommended rib size relationships. Figure 4.19 Draft – recommended rib design ½° to 1½° draft t Heavy sections should be cored to provide uniform wall thickness. For simplicity and economy in injection molds, cores should be parallel to the line of draw of the mold. Cores placed in any other direction usually create the need for some type of side action or manually loaded and removed loose cores. Cores which extend into the cavity will be subject to high pressure. For blind cores (cores that are unsupported) that have diameters greater than 1.5 mm (0.060 in.) the core lengths should not exceed three times the diameter, while blind cores with diameters less than 1.5 mm (0.060 in.) should not exceed twice their diameter in length. These recommendations may be doubled for through cores (cores that telescope into or shut off with the opposite side of the mold). Draft should be added to all cores, and all tooling draws should be polished for best ejection. Bosses Bosses are projections from the nominal wall of a part that will eventually be used as mounting or fastening points. The design of bosses is largely dependent upon their role in a given part. Cored bosses can be used for press fits, self-tapping screws, and ultrasonic inserts. Each of these will exert stress on the wall of the boss. As a general guideline, the outside diameter of a boss should be twice the inside diameter of the hole, and the wall thickness at the base of the boss should not exceed 60 % of the part wall thickness unless structural concerns override appearance requirements. Figure 4.20 illustrates these guidelines. Figure 4.20 Boss design – general guidelines t = 0.6T O.D. = 2 × I.D. R = > 0.8 mm ( 0.03" ) T O.D. I.D. 0.3 T T Amodel® PPA Design Guide / 77 Additional forces imposed on bosses may tend to be transmitted down the boss and into the nominal wall. For this reason, a minimum radius of 25 % of the wall thickness is required at the base of the boss to provide strength and reduce stress concentration. A boss can be further strengthened by using gusset-plate supports around the boss, or attaching it to a nearby wall with a properly designed rib. Bosses should be designed in the same manner as ribs. Heavy sections should be avoided to prevent the occurrence of sink marks on the surface and voids in the interior of the part. Undercuts Some design features, depending on orientation, can place portions of the mold in the way of ejecting the part. These features are called undercuts and can require special mold configurations, such as slides or cams, to move prior to ejection. In some cases, the material being molded will have enough flexibility that the part can be pushed off the undercut without damage. For example, the typical automotive thermostat housing, as shown in Figure 4.21, has beads to provide for leakproof hose connections. To provide a smooth surface for the hose connection, the designer has specified that the parting line cannot be in this area. This results in an undercut at each bead. Under some circumstances, it may be possible to eject a part with an undercut if the core can be pulled first and the undercut ratio is 8 or less. 100 ( bead diameter ( A ) − tube OD ( B ) ) Undercut = Tube ID ( C ) ratio ( R ) If the part must be molded without side pulls and the undercut ratio calculated is greater than 8, the design should be modified. One possible modification is to taper the tube inside diameter effectively reducing the wall thickness under the bead. For tubes with inside diameters less than 25 mm (1 in.), it may be necessary to modify the bead geometry to get an undercut ratio of 8 or less. The success of this approach is based upon removing the part from the mold while the part is still hot and therefore more flexible than it will be a room temperature. Figure 4.22 Undercut diagram B Figure 4.21 Thermostat housing showing beads C A 78 \ Amodel® PPA Design Guide Secondary Operations Welding Components produced from Amodel® resins can be readily joined using hot-plate, vibration, spin,or ultrasonic welding. In this section, each welding method is described, and the apparatus and the conditions that produced acceptable welds with Amodel® AS-1133 HS resin are discussed. These conditions are the suggested starting points for determining welding conditions for actual applications. Other Amodel® grades may require refinement of the noted process conditions. In some instances, additional information will be provided, such as sensitivity to welding conditions, sample geometry, or moisture content. Because Amodel® resins absorb moisture, tests were performed on specimens conditioned to three different moisture levels: 0 %, 1.8 % and 3.8 % moisture. These moisture contents were selected to represent the moisture levels for parts molded from Amodel® AS-1133 HS resin that had reached equilibrium in air with relative humidity levels of 0 %, 50 %, and 100 % respectively. To simplify the discussion of results, the term dry will be used for the dry, as molded specimens, normal for those containing 1.8 % moisture, and saturated for those containing 3.8 % moisture. In summary, acceptable welds can be achieved using all of the welding techniques evaluated and described in this section. Ultrasonic welding does require near-field energy application for strong welds. In general, absorbed moisture does not interfere with welding, but best results are obtained using samples that contain normal amounts of moisture (1.8 %) or less. Hot Plate Welding In hot plate welding, the thermoplastic samples are pressed against a heated element causing the contact surface to melt. The element is then removed and the samples are forced together under pressure. This welding method typically requires a longer cycle time than other methods, but it allows for the joining of parts that have a much larger surface area. With care, a strong and hermetic bond may be obtained using this method with Amodel® resins. The hot plate welding machine used was a Bielomatic HV 4806 welding machine manufactured in 1986 by Leuze GMBH. The specimens used were bars 102 mm long x 25 mm wide x 6 mm thick (4 in. x 1 in. x 0.25 in.) thick. The welding machine was set up to provide a nominal lap shear weld of 13 mm x 25 mm (0.5 in. x 1 in.). A diagram of the weld joint is shown in Figure 5.1. Figure 5.1 Joint design for hot plate welding Best results were obtained using a hot plate temperature of 330 °C (626 °F), a clamping pressure of 207 KPa (30 psi). The optimum heating time for the test samples proved to be 40 seconds, with a holding time of 20 seconds. The strength of the bond produced was comparable to the strength of the material itself, i.e., the majority of the specimens failed at points other than the joint during mechanical testing. Test plaques occasionally stuck to the hot plate unless a silicone mold release was applied and the hot plate was allowed to reach thermal equilibrium. Tests showed that the use of mold release did not reduce the weld strength. Absorbed moisture did not significantly affect weld strength at dry (0 %) and normal (1.8 %) levels, but it did reduce weld strength at the saturated (3.8 %) condition. Vibrational Welding In vibrational welding, friction is used to generate heat at the weld joint. One of the parts to be assembled is held stationary while the mating part vibrates ~0.8 mm to 1.5 mm (0.030 in. to 0.060 in.) in a linear fashion at 100 Hz to 400 Hz. Vibrational welding is limited to flat parts, but has a relatively fast cycle time and a low tooling cost. Amodel® PPA Design Guide / 79 The machine used for these experiments was a Vinton Hydroweld Vibration welding machine. This machine operates at a nominal frequency of 240 Hz. The specimens used were 102 mm (4 in.) long, by 25 mm (1 in.) wide, by 6 mm (0.25 in.) thick, and they were welded in a 25 by 13 mm (1 by 0.5 in.) lap shear configuration as shown in Figure 5.2. Spin welded joints using Amodel® PPA should incorporate a design known as a shear joint like that shown in Figure 5.3. Details known as flash traps may be incorporated to channel the localized flow of the material to one side of the part depending on requirements. Figure 5.3 Shear joint configuration Figure 5.2 Lap shear joint configuration 0.2 mm (0.008 in.) Depth of weld 30° - 45° Interference This method was very effective and welds as strong as the parent material were easily obtained. This technique proved relatively insensitive to welding conditions, giving good results at weld times as short as 0.60 seconds and pressures as low as 2.20 MPa (320 psi). Best results were obtained using specimens containing a normal (1.8 %) amount of moisture. Spin Welding The spin welding method uses frictional heat to join two cylindrical or spherical mating parts. While one half is held stationary in a nest fixture, the mating part is spun rapidly against it. Friction at the interface raises the temperature of the material until melting occurs. When the spinning action is stopped, the parts are held under pressure until cooled. Obviously, this welding method is limited to parts with circular geometry at the joint. The advantage obtained through spin welding is the increased dispersion of material at the joint compared to other techniques. This allows for the development of hermetic seals and reduces the tolerance requirements on the joint geometry. The spin welding machine used for these experiments was a Mechasonic KLN Omega machine, model SPN063. Typically the important parameters for this welding method are angular speed, in revolutions per minute, normal force, and welding time. Because this specific machine was an inertia- type, the energy available for spinning the sample was limited to that stored in the flywheel. Instead of adjustments per se to speed, the energy stored in the flywheel was controlled. More modern spin welding machines allow for the control of speed, force, time, and in some cases, angular location. The specimens used for the spin weld testing were injection molded cups with an interference joint design. Excellent weld strength was obtained using this method. Because the welding condition settings were machinespecific, they are not generally useful in setting a starting point. Rather, it was observed that as forge pressure and angular velocity were increased, weld strength increased up to a maximum and then decreased when an excessive amount of either pressure or velocity were applied. The values for these parameters are strictly dependent on the part geometry and therefore they are not noted here. The explanation of the observed phenomena is that when a weld was made with too high of a forge pressure, the spinning motion was stopped too rapidly and not enough polymer melted and flowed to create a sound joint. In the other extreme, a high angular velocity and a low forge pressure, the top part essentially sat on top of the bottom part and freely rotated without being forced into the interference fit. Thus, to assure a good joint, a welding condition must be found so both melting and forging occurs. Moisture content did not significantly affect weld strength. 80 \ Amodel® PPA Design Guide Ultrasonic Welding Adhesive Bonding In the ultrasonic welding of thermoplastic materials, high-frequency (10 to 40 KHz) mechanical vibrations are transmitted through one of the mating parts to the joint interface while the other half of the assembly is held stationary. The combination of friction and an applied force causes the temperature at the joint interface to increase to the melting temperature of the material. Normal force is held after the ultrasonic energy input is removed to achieve a mechanical bond or weld. Injection molded samples of Amodel® A-1133 HS resin were bonded with both an epoxy and a urethane adhesive. Both adhesives were supplied by Lord Corporation. The epoxy was a two-part adhesive sold under the trade name Lord® 305-1/305-2 and the urethane was a twopart system known as Lord® 7500 A/C. Ultrasonic welding has the advantage of being very high speed and is well-suited to high-volume production. Weld consistency and quality are high using this method; even hermetic seals may be obtained with close tolerance parts. Aside from the ultrasonic weld equipment, a customized horn must be employed for each assembly to focus the ultrasonic energy for the given part configuration. An energy-directing joint design is recommended for use with Amodel® materials to ensure that there is localized melting at the joint. A typical joint design is shown in Figure 5.4. The recommended interference using a shear joint design is a minimum of 0.2 mm (0.008 in.). Figure 5.4 Typical energy-directing joint configuration W Impact performance was determined with a side impact tester according to GM specification #9751P. Lap shear values were measured on an Instron testing machine using a pull rate of 13 mm/min (0.5 in./min) according to ASTM D1002. The results are shown in Figures 5.5 and 5.6. In general, the epoxy adhesive performed slightly better than the urethane. Acrylic adhesives are not recommended for use with Amodel® resins. W/2 Draft angle 3° to 5° The bond strength for both materials was tested at low temperature, room temperature, and an elevated temperature. To evaluate the effect of humid aging, specimens were conditioned for 14 days at 38 °C (100 °F) and 100 % relative humidity. Some specimens were tested immediately after conditioning; others were tested 24 hours after conditioning. W/3 Figure 5.5 Lap shear bond strength 7 6 W/10 The ultrasonic welding machine used for this testing was a Branson Model 910 M microprocessor-controlled machine. With this unit, it is possible to adjust the amount of ultrasonic energy that is applied to the sample. For testing, the output from the booster was fed to near and far field horns. The samples used were similar to the injection molded cup used for the spin welding evaluation. Aluminum fixtures held the parts in place and a butt weld joint configuration was employed. 1,000 900 800 302 1/2 7500 A/C 5 3 700 600 500 400 2 300 4 1 0 23 °C -34 °C 82 °C Promptly After ( 73 °F ) ( -30 °F ) ( 180 °F ) 24 hours Lap shear [ psi ] W/5 Lap shear [ MPa ] W/12 To prepare the test specimens for the Lord® 305-1/305-2, a cure cycle of 30 minutes at 120 °C (250 °F) followed by conditioning at room temperature for 72 hours was employed. The cure cycle for the Lord® 7500 A/C adhesive was 10 minutes at 90 °C (200 °F) followed by a 72-hour room temperature conditioning step. 200 100 0 Welds produced using a near field horn [defined as 6 mm (0.25 in.) or less measured from the horn to the weld joint] were excellent. Welds made using the far field horn position were weak (one-third of the strength achieved with near field) and are probably not useful. The conditions that gave acceptable weld strength were weld energy of 750 J and pressure of 4.3 MPa (617 psi). Amodel® PPA Design Guide / 81 Figure 5.6 Side impact bond strength 8 70 302 1/2 7500 A/C 60 6 50 5 40 4 30 3 2 20 1 10 0 0 23 °C ( 73 °F ) -34 °C ( -30 °F ) Promptly After 24 hours Side impact [ in-lb ] Side impact [ J ] 7 Laser Marking It is possible to obtain a durable, high contrast mark on Amodel® resins using commercially available laser marking systems. Depending upon the wavelength and intensity of the laser system used, the appearance of the mark can range from a bleached surface to an engraved mark. No one set of conditions can be specified for laser marking all Amodel® PPA resins. Operating parameters must be adjusted depending upon the particular application and part being marked. The manufacturers in Table 5.1 have equipment that should be suitable for marking Amodel® PPA resins. Table 5.1 Suppliers of laser marking equipment Coatings and Surface Finishes Company Vacuum Metallizing Videojet Systems International, Inc. Vacuum metallization involves the evaporation, and subsequent condensation, of a metal onto a substrate in a vacuum chamber. The metal used in most industrial applications is aluminum. When the end-use requirement is primarily decorative, the substrate is usually processed with two organic coatings called the basecoat and the topcoat with the metal layer deposited in between. The primary function of the basecoat is to produce a smooth surface on molded plastic parts so that the metal layer will have maximum luster. A secondary function of the basecoat is to maximize adhesion of the metal layer to the substrate. On substrates that tend to outgas in a vacuum, the basecoat also provides a barrier layer. The function of the topcoat is to protect the metal layer from physical, oxidative, or chemical deterioration. Basecoats that are compatible with Amodel® resins include #VB-4315, #VB-4774, and #VB-4836-1 from Pearl Paints, http://www.pearlpaints.com. Topcoats that are compatible with Amodel® resin include #VT 4316-2, also from Pearl Paints. Because of the need to vaporize the metal materials during this process, an elevated temperature may be expected in the vacuum chamber. The rate at which parts may be coated is controlled by the thermal characteristics of the substrate material. For this reason, Amodel® resin, with its high heat deflection temperature, is an excellent candidate material when metallization is required as comparatively rapid cycle times may be obtained. 82 \ Amodel® PPA Design Guide Panasonic Electric Works Corporation ID Technology Website www.videojet.com www.panasonic-electric-works.co.uk www.idtechnology.com Inkjet Printing Inkjet printing can be used to provide a highly visible mark on Amodel® PPA resin substrates of any color. The durability of marks made using an inkjet system depends upon the environment to which the marked part will be exposed and the type of ink used to make the mark. In many cases the durability of the mark will be satisfactory. Equipment needs vary depending upon the type of ink used, the speed at which the mark is made, and size of the desired mark. A wide variety of equipment and inks are commercially available. Two sources are shown in Table 5.2. Table 5.2 Suppliers of inkjet printing equipment Company Videojet Systems International, Inc. ID Technology Website www.videojet.com www.idtechnology.com Painting Overmolding Several grades of Amodel® PPA resin were evaluated for their compatibility with various automotive paint systems. Representative glass-reinforced, mineral-reinforced, and mineral/ glass-reinforced compounds were evaluated. A process developed by the Bryant Rubber Corporation allows for the overmolding of Amodel® materials with soft touch silicone rubber. The silicone rubber materials are ideal for the creation of sealing surfaces, tactile grips, and sound/noise dampening details. While overmolding with silicone rubber is not a new idea, these design details are typically characterized as having poor adhesion to the rigid substrates even if primers, or priming processes, are employed. The adhesion and peel strength achieved through the use of Bryant’s Select Primerless Adhesion Polymer System (SPAPS™ Technology) is uniquely better than anything that has previously been achieved. In fact, cohesive failure of the silicone rubber is typical of the SPAPS™ Technology process. As with all plastic substrates, the primer system is critical. The test specimens were cleaned with isopropyl alcohol then coated with primers and cured as per the manufacturer’s instructions. The plaques were tested for tape adhesion (GM9071P, method A) and cross-hatch adhesion (GM9071P, method B) and gravelometer chip resistance (GM9508P and SAEJ400) as coated and after conditioning for 96 hours with water/fog/humidity per GM4465P specification. Table 5.3 lists primers that meet or exceed all test requirements and represent adequate coating performance for most painted automotive applications. Table 5.3 Suitable automotive primers Supplier BASF PPG Red Spot Siebert-Oxidermo Sherwin-Williams Primer Description U04KD004 Solvent, flexible U04AD041 Solvent, rigid U36AD001 Water based RPP9870 Solvent, high solids AHAP9470R Solvent, one coat AE146 Solvent, lacquer UBP9604 Solvent, high solids BP2024 Solvent E75BC2301 Solvent E75AC6 Solvent Amodel® resins are particularly well-suited for use in conjunction with SPAPS™ silicone rubbers due to their excellent properties at high temperatures. This allows for reduced cycle times for the silicone cure process, improving overall economics. The silicone materials match the long-term thermal stability of Amodel® resin, more so than other elastomeric materials, ensuring long-term performance in difficult environments. The SPAPS™ silicone rubbers are offered in the full range of property options available in other common silicone rubbers. The materials are naturally transparent and colorable using liquid colorants during the molding process, offering excellent color fastness even with prolonged ultraviolet light exposure. They are available with durometer ratings of 10 to 85 on the Shore A scale. Their chemical resistance is similar to that of other silicone rubber materials. The unreactive character of the materials will allow for agency approvals, such as NSF, FDA, and U.S.P., of the finished parts. Further information regarding the overmolding process may be obtained from the Bryant Rubber Corporation at http://www.bryantrubber.com/. Amodel® PPA Design Guide / 83 84 \ Amodel® PPA Design Guide Index A Absorption Amount . . . . . . . . . . . . . . . . . 39 Accelerated Moisture Conditioning . . . . . . . . . . 8 Adding Ribs to Maintain Stiffness . . . . . . . . . . .66 Adhesive Bonding . . . . . . . . . . . . . . . . . .81 Amodel Polyphthalamide (PPA) Resins . . . . . . . . 3 Amodel® Resin Property Tables . . . . . . . . . . . 6 B E Effect of Moisture on Strength and Stiffness . . . . . 40 Electrical Properties . . . . . . . . . . . . . . . . . 51 Environmental Resistance . . . . . . . . . . . . . . 56 F Falling weight impact properties . . . . . . . . . . . 31 Fatigue strength of Amodel® resin . . . . . . . . . .37 Flexural Properties . . . . . . . . . . . . . . . . . .24 Flexural properties at elevated temperatures . . . . .26 Flexural property comparison . . . . . . . . . . . . .25 Bosses . . . . . . . . . . . . . . . . . . . . . . . .77 G C Gamma Radiation . . . . . . . . . . . . . . . . . . 60 Glow Wire Testing . . . . . . . . . . . . . . . . . . 49 Calculating Allowable Stress - Creep Rupture . . . . 68 Calculating Deflection . . . . . . . . . . . . . . . . 67 Calculating the Allowable Interference . . . . . . . . 71 Changing Section Thickness . . . . . . . . . . . . .66 Charpy (supported beam) impact . . . . . . . . . . 30 Chemical Compatibility . . . . . . . . . . . . . . . .60 Chemical Resistance . . . . . . . . . . . . . . . . .56 Chemistry . . . . . . . . . . . . . . . . . . . . . . . 3 Coatings and Surface Finishes . . . . . . . . . . . .82 Coefficient of Linear Thermal Expansion . . . . . . .43 Comparative Tracking Index (CTI) –ASTM D3638 . . . 54 Compressive creep . . . . . . . . . . . . . . . . . .36 Compressive Strength and Modulus . . . . . . . . .28 Considering Stress Concentrations . . . . . . . . . .69 Considering Thermal Stresses . . . . . . . . . . . .69 Coring . . . . . . . . . . . . . . . . . . . . . . . .77 Creep . . . . . . . . . . . . . . . . . . . . . . . . 32 Crystallinity . . . . . . . . . . . . . . . . . . . . . . 4 D Deflection Calculations . . . . . . . . . . . . . . . .65 Deflection Temperature Values for Amodel Resins . . 43 Design Information . . . . . . . . . . . . . . . . . .61 Designing for Assembly . . . . . . . . . . . . . . . 71 Designing for Equivalent Part Stiffness . . . . . . . .66 Designing for Injection Molding . . . . . . . . . . . .76 Designing for Sustained Load . . . . . . . . . . . . 67 Designing with Snap Fits . . . . . . . . . . . . . . .74 Dielectric Breakdown Voltage and Strength ASTM D149 . . . . . . . . . . . . . . . . . . . 51 Dielectric Constant - ASTM D150 . . . . . . . . . . 52 Dimensional Change Compared to PA 6,6 . . . . . .41 Dimensional Change due to Moisture . . . . . . . . 40 Dissipation Factor - ASTM D150 . . . . . . . . . . .53 Draft Angle . . . . . . . . . . . . . . . . . . . . . .76 H Heat Deflection Temperature – HDT . . . . . . . . . 42 High-Current Arc Ignition (HAI) . . . . . . . . . . . .54 High-Voltage Arc Resistance to Ignition . . . . . . . 55 High-Voltage Arc-Tracking-Rate (HVTR) . . . . . . . 54 High-Voltage, Low-Current, Dry Arc Resistance – ASTM D495 . . . . . . . . . . . . . . . . . . . 54 Horizontal burning test . . . . . . . . . . . . . . . .50 Hot Plate Welding . . . . . . . . . . . . . . . . . . 79 Hot Wire Ignition (HWI) - ASTM D3874 . . . . . . . .54 I Impact Strength . . . . . . . . . . . . . . . . . . . 28 Improving torque retention . . . . . . . . . . . . . .72 Inkjet Printing . . . . . . . . . . . . . . . . . . . . .82 Interference or Press Fits . . . . . . . . . . . . . . .71 Introduction and Typical Properties . . . . . . . . . . 3 Isochronous Stress/Strain Curves . . . . . . . . . . 35 Izod (Cantilevered Beam) Impact . . . . . . . . . . .29 Izod impact property comparison . . . . . . . . . . 29 L Laser Marking . . . . . . . . . . . . . . . . . . . . 82 Limitations of Design Calculations . . . . . . . . . . 65 Long-term Mechanical Properties . . . . . . . . . . 32 Loss of Bolt Tightness Due to Creep . . . . . . . . .70 Amodel® PPA Design Guide / 85 M T Mechanical Design . . . . . . . . . . . . . . . . . .62 Mechanical Fasteners . . . . . . . . . . . . . . . . 72 Mechanical Properties . . . . . . . . . . . . . . . 21 Moisture Absorption and Glass Transition Temperature (Tg) . . . . . . . . . . . . . . . . .39 Moisture Effects . . . . . . . . . . . . . . . . . . 5, 38 Molded-In Threads . . . . . . . . . . . . . . . . . .74 Tapered Cantilever Beam Equation . . . . . . . . . .75 Tensile Creep . . . . . . . . . . . . . . . . . . . . .33 Tensile Creep Rupture . . . . . . . . . . . . . . . .35 Tensile Properties . . . . . . . . . . . . . . . . . . 21 Tensile properties for GR PPA vs. temperature . . . .23 Tensile properties of A-1000 GR grades at elevated temperatures . . . . . . . . . . . . . . 24 Tensile property comparison . . . . . . . . . . . . .23 Tensile Property Comparison . . . . . . . . . . . . .22 Test Methods . . . . . . . . . . . . . . . . . . . . .21 Thermal Aging . . . . . . . . . . . . . . . . . . . .47 Thermal Conductivity . . . . . . . . . . . . . . . . .44 Thermal Properties . . . . . . . . . . . . . . . . . .42 Thermal Stability . . . . . . . . . . . . . . . . . . .47 Thermogravimetric Analysis (TGA) . . . . . . . . . .47 Threaded Inserts . . . . . . . . . . . . . . . . . . .73 Tightening torque . . . . . . . . . . . . . . . . . . 73 Typical Properties . . . . . . . . . . . . . . . . . . . 8 N Nomenclature . . . . . . . . . . . . . . . . . . . . . 7 O Overmolding . . . . . . . . . . . . . . . . . . . . .83 P Poisson’s Ratio . . . . . . . . . . . . . . . . . . . .31 Product Data . . . . . . . . . . . . . . . . . . . . . 6 Product Selection . . . . . . . . . . . . . . . . . . . 7 Property Data . . . . . . . . . . . . . . . . . . . . . 8 Pull Out Force Calculation . . . . . . . . . . . . . . 73 R Reinforcing Fiber Orientation Considerations . . . . .65 Relative Thermal Index (UL) . . . . . . . . . . . . . 48 Ribs . . . . . . . . . . . . . . . . . . . . . . . . . 77 S Secondary Operations . . . . . . . . . . . . . . . .79 Self-Tapping Screws . . . . . . . . . . . . . . . . .72 Shear Properties . . . . . . . . . . . . . . . . . . .27 Short-Term Mechanical Properties . . . . . . . . . .21 Significance of Moisture Absorption . . . . . . . . . 38 Smoke Density Test (NBS) . . . . . . . . . . . . . .50 Specific Heat . . . . . . . . . . . . . . . . . . . . .46 Spin Welding . . . . . . . . . . . . . . . . . . . . .80 Straight Cantilever Beam Equation . . . . . . . . . .74 Stress Calculations . . . . . . . . . . . . . . . . . .65 Surface Resistivity - ASTM D257 . . . . . . . . . . .52 86 \ Amodel® PPA Design Guide U UL 746A Short-Term Properties . . . . . . . . . . . 53 UL Relative Thermal Indices . . . . . . . . . . . . . 55 Ultrasonic Welding . . . . . . . . . . . . . . . . . .81 Using Classical Stress/Strain Equations . . . . . . . 65 V Vacuum Metallizing . . . . . . . . . . . . . . . . . .82 Vertical Burn Test . . . . . . . . . . . . . . . . . . .50 Vertical Flammability per UL 94 . . . . . . . . . . . .50 Vibrational Welding . . . . . . . . . . . . . . . . . .79 Volume Resistivity - ASTM D257 . . . . . . . . . . .52 W Wall Thickness . . . . . . . . . . . . . . . . . . . .76 Wall Thickness Variation . . . . . . . . . . . . . . . 76 Welding . . . . . . . . . . . . . . . . . . . . . . . 79 Specialty Polymers Worldwide Headquarters [email protected] Viale Lombardia, 20 20021 Bollate (MI), Italy Americas Headquarters [email protected] 4500 McGinnis Ferry Road Alpharetta, GA 30005, USA Asia Headquarters [email protected] No.3966 Jindu Road Shanghai, China 201108 www.solvay.com Safety Data Sheets (SDS) are available by emailing us or contacting your sales representative. Always consult the appropriate SDS before using any of our products. Neither Solvay Specialty Polymers nor any of its affiliates makes any warranty, express or implied, including merchantability or fitness for use, or accepts any liability in connection with this product, related information or its use. Some applications of which Solvay’s products may be proposed to be used are regulated or restricted by applicable laws and regulations or by national or international standards and in some cases by Solvay’s recommendation, including applications of food/feed, water treatment, medical, pharmaceuticals, and personal care. Only products designated as part of the Solviva® family of biomaterials may be considered as candidates for use in implantable medical devices. The user alone must finally determine suitability of any information or products for any contemplated use in compliance with applicable law, the manner of use and whether any patents are infringed. The information and the products are for use by technically skilled persons at their own discretion and risk and does not relate to the use of this product in combination with any other substance or any other process. This is not a license under any patent or other proprietary right. All trademarks and registered trademarks are property of the companies that comprise the Solvay Group or their respective owners. © 2014, Solvay Specialty Polymers. All rights reserved. D 2002 | R 11/2014 | Version 5.0
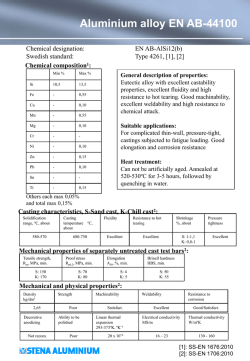


© Copyright 2026