
What Advanced Industries Are
15 20 3, .F EB . W H AT WHERE 12 :0 1 A. M WHY L BROOKINGS TI A DVA N C E D N INDUSTRIES EL E AS E U PROJECT EM BA R G O ED FO R R A M E R I C A’ S A D VA N C E D INDUSTRIES W H AT T H E Y A R E , W H E R E T H E Y A R E , A N D W H Y T H E Y M AT T E R 15 20 3, .F EB . A. M 1 :0 CONTENTS 12 Executive Summary..............................................................2 L I. Introduction...................................................................... 10 TI II. America’s Advanced Industries: AS E in the United States and Globally............................... 23 V. Implications: Strategies for Promoting U.S. Advanced Industries.............................................. 45 EL E VI. Conclusion...................................................................... 61 Selected References.......................................................... 62 BA R G O ED FO R R Endnotes............................................................................... 68 EM U IV. Findings: Advanced Industries N What They Are and Why They Matter........................ 12 III. Defining and Measuring Advanced Industries........ 19 15 20 12 :0 1 A. M .F EB . 3, A M E R I C A’ S A D VA N C E D INDUSTRIES TI L W H AT T H E Y A R E , W H E R E T H E Y A R E , EM BA R G O ED FO R R EL E AS E U N A N D W H Y T H E Y M AT T E R MARK MURO, JONATHAN ROTHWELL, SCOTT ANDES, KENAN FIKRI, and SIDDHARTH KULKARNI February 2015 W H AT 15 WHERE WHY 20 EXECUTIVE SUMMARY 3, .F EB . T he need for economic renewal in the United States remains urgent. A. M Years of disappointing job growth and stagnant incomes for the major- 1 ity of workers have left the nation shaken and frustrated. At the same 12 :0 time, astonishing new technologies—ranging from advanced robotics and “3-D L printing” to the “digitization of everything”—are provoking genuine excitement U N TI even as they make it hard to see where things are going. AS E Hence this paper: At a critical moment, this report asserts the special ABOUT THE ANALYSIS importance to America’s future of what the paper calls America’s EL E “advanced industries” sector. Individual advanced industries were identified development (R&D) and STEM (science, technology, engineering, per worker, which equates to roughly over from manufacturing industries such as automaking and aerospace to 20 percent of industries on this measure energy industries such as oil and gas extraction to high-tech services R and math) workers, the sector encompasses 50 industries ranging ED ●● Characterized by its deep involvement with technology research and Industry R&D spending that exceeds $450 FO ●● R using two criteria: Industry workforce composition in which such as computer software and computer system design, including for health applications. O at least 20 percent of workers have STEMThese industries encompass the nation’s “tech” sector at its broad- above the national industry average est and most consequential. Their dynamism is going to be a central BA R G knowledge intensive occupations, a level component of any future revitalized U.S. economy. As such, these industries encompass the country’s best shot at supporting innovative, inclusive, and sustainable growth. For that reason, this report provides tion and employ skilled technical workers to a wide-angle overview of the advanced industry sector that reviews its develop, diffuse, and apply new technologies to role in American prosperity, assesses key trends, and maps its met- enhance firm productivity. ropolitan and global competitive standing before outlining high-level EM Together these two criteria identify 50 indus- tries that invest heavily in technology innova- strategies to enhance that. The overview finds that: 2 THE BROOKINGS INSTITUTION | AMERICA’S ADVANCED I N D U ST R I ES Advanced industries represent a sizable economic anchor for the U.S. economy and have led the post-recession employment recovery AS AN EMPLOYER AND SOURCE OF ECONOMIC ACTIVITY THE ADVANCED INDUSTRY SEC- 20 ●● 15 Modest in size, the sector packs a massive economic punch: TOR PLAYS A MAJOR ROLE IN THE U.S. ECONOMY. As of 2013, the nation’s 50 advanced industries 3, (see nearby box for selection criteria) employed 12.3 million U.S. workers. That amounts to about 9 percent of total .F EB . U.S. employment. And yet, even with this modest employment base, U.S. advanced industries produce $2.7 trillion in value added annually—17 percent of all U.S. gross domestic product (GDP). That is more than any other sector, including healthcare, finance, or real estate. A. M At the same time, the sector employs 80 percent of the nation’s engineers; performs 90 percent of private-sector R&D; generates approximately 85 percent of all U.S. patents; and accounts for 60 percent of U.S. exports. Advanced industries also support unusually extensive supply chains and other forms of ancillary economic activity. On a per worker 1 basis, advanced industries purchase $236,000 in goods and services from other businesses annually, compared with :0 $67,000 in purchasing by other industries. This spending sustains and creates more jobs. In fact, 2.2 jobs are created 12 domestically for every new advanced industry job—0.8 locally and 1.4 outside of the region. This means that in addi- L tion to the 12.3 million workers employed by advanced industries, another 14.3 million U.S. workers owe their jobs to TI economic activity supported by advanced industries. Directly and indirectly, then, the sector supports almost 39 million U N jobs—nearly one-fourth of all U.S. employment AS E The 50 Industries That Constitute the Advanced Industries Sector EL E MANUFACTURING Aerospace Products and Parts Agr., Construction, and Mining Machinery Electric Power Generation, Trans., and Distribution Motor Vehicles Metal Ore Mining Navigation, Measurement, and Control Instruments Oil and Gas Extraction R Aluminum Production and Processing Audio and Video Equipment ENERGY Motor Vehicle Parts Other Chemical Products SERVICES Other Electrical Equipment and Components Architecture and Engineering Other General Purpose Machinery Cable and Other Subscription Programming Commercial and Service Industry Machinery Other Miscellaneous Manufacturing Computer Systems Design Communications Equipment Other Nonmetallic Mineral Products Data Processing and Hosting Computers and Peripheral Equipment Other Transportation Equipment Medical and Diagnostic Laboratories Electric Lighting Equipment Pesticides, Fertilizers, and Other Agr. Chemicals Mgmt., Scientific, and Technical Consulting Electrical Equipment Petroleum and Coal Products Other Information Services R Basic Chemicals G O ED FO Clay Products Pharmaceuticals and Medicine Other Telecommunications Foundries Railroad Rolling Stock Satellite Telecommunications Household Appliances Resins and Synthetic Rubbers, Fibers, and Filaments Scientific Research and Development Industrial Machinery Semiconductors and Other Electronic Components Software Publishers Ship and Boat Building Wireless Telecommunications Carriers EM BA R Engines, Turbines, and Power Trans. Equipment Iron, Steel, and Ferroalloys Motor Vehicle Bodies and Trailers T H E B R O O K I N GS I NSTITUTION | I. EXECUTIVE SUMMARY 3 I N TERMS OF THE SECTOR’S GROWTH AND CHANGE, THE TOTAL NUMBER OF JOBS IN THE SECTOR HAS REMAINED MOSTLY FLAT SINCE 1980, BUT ITS OUTPUT HAS SOARED. ●● From 1980 to 2013 advanced industry output expanded at a rate of 5.4 percent annually—30 percent faster than the economy as a whole. Since the Great Recession, moreover, both employment and output have risen dramatically. The sector has added nearly one million jobs since 2010, with employment and output growth rates 1.9 and 2.3 times higher, respectively, than in the rest of the economy. Advanced services led this post-recession surge and created 65 percent 15 of the new jobs. Computer systems design alone generated 250,000 new jobs. Certain advanced manufacturing indus- 3, 20 tries—especially those involved in transportation equipment—have also added thousands of jobs after decades of losses .F EB . The advanced industry sector’s post-recession employment surge has been broad-based but led by services :0 12 L TI N U 25,000 AS E 75,000 Misc. Chemicals Computer Eqpmnt. Petroleum & Coal Products Electrical Lighting Eqpmnt. Pesticides & Fertilizers Household Appliances Resins & Synthetic Materials Basic Chemicals Semiconductors Medical Eqpmnt. & Supplies Other Nonmetal Mineral Prods. Aluminum Prod. & Process. Railroad Rolling Stock Misc. Electrical Eqpmnt. Iron, Steel, and Ferroalloys Ship & Boat Building Industrial Machinery Engines & Power Eqpmnt. Metal Ore Mining Electrical Eqpmnt. Misc. Manufacturing Medical and Diagnostic Labs Aircraft Products & Parts Foundries R&D Services Data Processing & Hosting Motor Vehicle Bodies & Trailers Motor Vehicles General Purpose Machinery Software Products Oil & Gas Extraction Agri., Constr., & Min. Machinery Web Search and Internet Pub. Architecture & Engineering Motor Vehicle Parts Management Consulting Computer Systems Design 125,000 ■ = Services 1 175,000 ■ = Energy A. M ■ = Manufacturing 225,000 Communications Eqpmnt. Wireless Telecoms Carriers Precision Instruments Other Telecoms Electric Power Generation Magnetic & Optical Media Comm. & Service Ind. Machinery Satellite Telecoms Pharmaceuticals Audio & Video Eqpmnt. Cable and Other Programming Misc. Transportation Eqpmnt. Clay Products Absolute Increase in Jobs (2010–2013) 275,000 A DVANCED INDUSTRIES ALSO PROVIDE HIGH-QUALITY ECONOMIC OPPORTUNITIES FOR ED ●● FO R R EL E -25,000 WORKERS. Workers in advanced industries are extraordinarily productive and generate some $210,000 in annual O value added per worker compared with $101,000, on average, outside advanced industries. Because of this, advanced G industries compensate their workers handsomely and, in contrast to the rest of the economy, wages are rising sharply. BA R In 2013, the average advanced industries worker earned $90,000 in total compensation, nearly twice as much as the average worker outside of the sector. Over time, absolute earnings in advanced industries grew by 63 percent from EM 1975 to 2013 after adjusting for inflation. This compares with 17 percent gains outside the sector. Even workers with 4 lower levels of education can earn salaries in advanced industries that far exceed their peers in other industries. In this regard, the sector is in fact accessible: More than half of the sector’s workers possess less than a bachelor’s degree THE BROOKINGS INSTITUTION | AMERICA’S ADVANCED I N D U ST R I ES Since 1975, average earnings in advanced industries have increased almost five times as fast as those in the overall economy $100,000 15 20 $80,000 3, $60,000 United States .F EB . $40,000 $20,000 1975 1980 1985 1990 1995 2000 2005 2010 :0 1 0 A. M Average Earnings per Worker (inflation adjusted) Advanced Industries N TI L 12 The advanced industries sector is highly metropolitan and varies considerably in its composition and depth across regions U Advanced industries are present in nearly every U.S. region, but the sector’s geography is uneven: A DVANCED INDUSTRIES TEND TO CLUSTER IN LARGE METROPOLITAN AREAS. Looking AS E ●● across the country, the 100 largest metro areas contain 70 percent of all U.S. advanced industries jobs. In terms of the EL E sector’s local clustering, San Jose is the nation’s leading advanced industry hub with 30.0 percent of its workforce employed in the sector. Seattle follows with 16.0 percent of its local jobs in advanced industries. Wichita (15.5 percent); Detroit (14.8 percent), and San Francisco (14.0 percent) follow. Overall, advanced industries account for more than one T HIS CLUSTERING OCCURS IN A VARIETY OF CONFIGURATIONS. Some metropolitan areas—such FO ●● R R in 10 jobs in nearly one-quarter of the country’s major metro areas as Grand Rapids, MI; Portland, OR; and Wichita—focus heavily on advanced manufacturing pursuits such as auto- ED motive, semiconductor, or aerospace manufacturing, respectively, while metros like Bakersfield and Oklahoma City exhibit strong energy specializations. By contrast, services such as computer systems design, software, and research O and development predominate in metropolitan areas like Boston, San Francisco, and Washington. For their part, EM BA R G San Jose, Detroit, and Seattle exhibit depth and balance across multiple advanced industry categories T H E B R O O K I N GS I NSTITUTION | I. EXECUTIVE SUMMARY 5 Advanced industries’ share of total employment varies significantly across major metropolitan areas ● ●● ● ● ● A. M ● ● ● 1 ● ●● U N TI L 12 :0 ● ● ● ●●● ●● ●● ● ● ● ●● ●●●● ● ● ●●● ● ● ● ● ● ● ● ● ● ● ● ●● ● ● ● ● ●● ● Advanced Industry ● ● ● ● Share of Total ● ● ● ● ● ● Employment ● ● ● ● by Quintile ● ● ● 1.9 to 5.9 percent ● ●● ● 5.9 to 7.7 percent ● ● ● 7.7 to 9.0 percent ● ● ● ● ●● ● 9.0 to 10.1 percent ● ●● 10.1 to 29.9 percent ● ● 3, ● ● ●● ●● ● ● ●● ● ● 15 ● 20 ● .F EB . ● OVERALL, NUMBER OF EXTREMELY DENSE CONCENTRATIONS OF ADVANCED INDUSTRY AS E ACTIVITY HAS DECLINED. In 1980, 59 of the country’s 100 largest metropolitan areas had at least 10 percent of EL E their workforce in advanced industries. By 2013, only 23 major metro areas contained such sizable concentrations FO R R The United States is losing ground to other countries on advanced industry competitiveness The United States has the most productive advanced industries in the world, behind only energy-intensive Norway. However, T HE NATION’S DECLINING CONCENTRATION IN ADVANCED INDUSTRIES AND ITS NEGA- O ●● ED this competitiveness appears to be eroding: G TIVE TRADE BALANCE IN THE SECTOR DO NOT BODE WELL. Since 2000, the sector’s employment BA R and output as a share of the total U.S. economy has shrunk, and the nation’s standing on these measures now lags world leaders. Equally worrisome is the balance of trade in the sector. Although advanced industries export $1.1 trillion EM worth of goods and services each year and account for roughly 60 percent of total U.S. exports, the United States ran a $632 billion trade deficit in the sector in 2012, in line with similar yearly balances since 1999. To be sure, a handful of individual advanced industries such as royalties and other intellectual property and aerospace manufacturing enjoy trade surpluses that exceeded $60 and $80 billion in 2012. However, numerous areas of historical strength such as communications equipment, computer equipment, motor vehicles, and pharmaceuticals now run sizeable deficits, as do high-value R&D services and computer and information services 6 THE BROOKINGS INSTITUTION | AMERICA’S ADVANCED I N D U ST R I ES 15 Oil and gas 3, Motor vehicles 20 Computer eqpmnt. Communications eqpmnt. Motor vehicle parts Pharmaceuticals Semiconductors Audio and video eqpmnt. Appliances .F EB . Iron and steel Electrical eqpmnt. :0 1 A. M Electric lighting Computer services Other electrical components Analytic instruments Aluminum Commercial machinery Medical eqpmnt. Pesticides General purpose machinery R&D services Ship building Basic chemicals Railroad stock Industrial machines Telecom Other chemicals -$210,000 Energy Services U N TI Manufacturing L 12 -$160,000 Engines and turbines -$110,000 Agriculture and other machinery Aerospace -$60,000 Resin and rubber -$10,000 Software $40,000 Royalties Trade Surplus/Deficit (millions) (2012) $90,000 Other transportation eqpmnt. With few exceptions, the United States runs a significant trade deficit in advanced industries N OTWITHSTANDING THE NATION’S STRONG INNOVATION ENTERPRISE, THE UNITED AS E ●● STATES’ ADVANTAGE ON THIS FRONT IS SLIPPING. For certain the advanced industry sector remains EL E the key site of U.S. technology gains. However, the United States is losing ground relative to other countries on measures of innovation performance and capacity. For example, the U.S. share of global R&D and patenting is falling much faster than its share of global GDP and population, meaning that U.S. slippage cannot simply be attributed to demog- R raphy or macroeconomic convergence. Likewise, America’s research dominance looks less impressive after adjusting R for the size of its working age population. Turning to the nation’s critical regional innovation ecosystems, surpris- FO ingly few U.S. metropolitan areas rank among the world’s most innovative—as measured by patent cooperation treaty applications per capita. Among the nation’s most patent-intensive regions, just two—San Diego and the San Jose-San J OBS IN ADVANCED INDUSTRIES ARE AVAILABLE AT ALL LEVELS OF EDUCATION, BUT O ●● ED Francisco combined area—rank in the global top 20 and just two more (Boston and Rochester) score in the top 50 BA R G ONLY A NARROW EDUCATIONAL AND TRAINING PIPELINE CHANNELS POTENTIAL WORKERS INTO THE SECTOR. At the same time, the sector faces a labor supply challenge. By definition, an outsized share of advanced industries’ workers can be found in STEM occupations. So the sector is a critical storehouse of the EM nation’s STEM knowledge base. However, globalization and technological change are increasing the education require- ments of the sector, sharpening its skills challenge. Amid these trends, many advanced industry employers report difficulties finding qualified workers, which places a drag on their competitiveness. For example, a posting for a STEMrelated occupation in an advanced industry remains online for an average of 43 days. This compares with 32 days for non-STEM ads. Contributing to those hiring delays is the fact that the U.S. education system graduates too few college students in STEM fields and does too little to adequately prepare children in mathematical and scientific concepts. U.S. youths and adults alike perform much more poorly on international exams of math and science competencies than T H E B R O O K I N GS I NSTITUTION | I. EXECUTIVE SUMMARY 7 many of their peers in developed countries. Moreover, even students in the top 10 percent of U.S. performers score well below their highest-scoring peers in other developed countries Complicating the sector’s human capital challenges are sharp regional variations in the availability of skills. For example, in 15 of the largest 100 U.S. metropolitan areas the number of STEM graduates as a share of the young adult population (aged 20 to 34) exceeds Finland’s, which holds the highest share internationally. These skills poles include 15 some of the nation’s most successful advanced industry hubs, including Boston, San Jose, Raleigh, and Provo. At the 20 other end of the spectrum, however, 33 large U.S. metropolitan areas’ STEM graduation rates trail those of Spain, which ranks 24th internationally. These metropolitan areas include prominent such places like Phoenix, Las Vegas, Miami, .F EB . the ability of many metropolitan areas to support advanced industries locally and nationally 3, Dallas, Detroit, Houston, and Kansas City. This variation in the availability of human capital places a serious drag on A. M The nation’s private and public sectors must engage to defend and expand America’s advanced industries Looking forward, this description and assessment of the advanced industry sector points to significant opportunity—but also :0 1 challenges. 12 On the positive side, the combination of intensive technology investment and highly skilled STEM workers in the advanced L industry sector represents a potent source of U.S. prosperity—including for workers without a bachelor’s degree. Advanced TI industries power the national economy and their success is a prerequisite for building an opportunity economy in the United N States. Moreover, the report makes clear that a distinct advanced industry geography has emerged within which varied U combinations of industries cluster in various regions to avail themselves of key innovation resources, skilled workers, and supplier networks. In this respect, America’s advanced industries are not national. They are local, and in regions like Austin, AS E Boston, San Diego, Seattle, and Silicon Valley they are world-class hubs of prosperity. EL E Yet too many U.S. advanced industries and local advanced industries clusters are ceding global leadership. The deterioration of the nation’s balance of trade in advanced technology products over the last decade raises especially sober- R ing questions, not just about trade policy, but about the long-term vitality of the sector. Likewise, too few regional advanced R industry ecosystems now retain the technology inputs, labor pools, and supplier density to generate the synergies that drive FO global competitiveness. Making matters worse is the gridlock in Washington that continues to preclude national action to ED strengthen advanced industries through sensible corporate tax reform or strategic trade liberalization and enforcement. All of which means private and public sector leaders—particularly those working at the state and regional level—must engage. O Already numerous state and regional partnerships are working to expand America’s advanced industries, often by attending BA R G to the fundamental inputs needed to ensure these industries’ long-term growth. Yet more can and should be done. Among other initiatives, the nation’s private- and public-sectors should together: EM ●● COMMIT TO INNOVATION. Innovation remains the only lasting source of advantage for firms and places in the advanced industry sector, yet its speed and complexity are ratcheting up and demanding new strategies. Accordingly, both the private and public sectors need to radically rethink their technology development strategies. Lead actors in firms and government each need to ramp up the scale of their innovation efforts and reconsider the formats through which they conduct them. More R&D conducted within new, more open or networked innovation models will be necessary in the coming years 8 THE BROOKINGS INSTITUTION | AMERICA’S ADVANCED I N D U ST R I ES 0.5% 15 20 1.0% 20% Change in Advanced Industries' Share of Total Employment (2000-2010) 1.5% 25% 3, 0.0% 15% .F EB . -0.5% 10% -1.0% -1.5% A. M 5% lg iu m -2.5% Be rw No an ay 1 ce s er Fr la nd :0 es at th 12 ni U Cz L Change in Share of Employment ●● U N TI Share of Employment -2.0% Ne te d Au St st ar ria k ly nm De Ita d en an nl Fi Sw ed y ar y ng an Hu Ge Sl ov rm en bl pu ec h Re ia 0% ic Advanced Industries' Share of Total Employment (2010) U.S. employment in advanced industries is low by international standards and falling rapidly R ECHARGE THE SKILLS PIPELINE. More qualified workers with different and more technical skillsets are AS E also critical to the future competitiveness of the sector. However, the skills prerequisites of modern advanced industries have been changing faster than the country’s ability to train the needed workers. Now that the economy is heating EL E up and firms are beginning to expand again, both private- and public-sector actors—often in partnership—need to bear down on improving the availability of skilled workers by developing smart, industry led, sector-specific, regional skills initiatives. Overall, firms need to get much more involved in developing the skills pipeline and the public sector must E MBRACE THE ECOSYSTEM. Finally, firms, governments, and other relevant actors must work to strengthen FO ●● R R become much more responsive to their needs the nation’s local advanced industry ecosystems—the regional industrial communities within which firms operate. ED Innovation and skills development do not happen just anywhere. They happen in places, most notably within metropolitan regions, where firms tend to cluster in close geographic proximity, whether to profit from local knowledge flows, O access skilled workers, or tap regional supplier networks. Unfortunately, though, in too many places America’s advanced G industry clusters are thin or eroded after decades of offshoring and disinvestment. It is critical, therefore, that pri- BA R vate- and public-sector leaders work together to renew the vitality of the nation’s regional advanced industries ecosystems—the most durable foundations of U.S. competitiveness in the sector. Firms should seek to quantify the value they EM derive from vibrant local ecosystems even as localities and states work to enhance the local environment for advanced industry activity through investments in anchor institutions and support for cluster infrastructure America’s advanced industries are a critical anchor of national prosperity. Business leaders, government, and the civic sector need to work together in new ways to augment their vitality. n T H E B R O O K I N GS I NSTITUTION | I. EXECUTIVE SUMMARY 9 BROOKINGS A DVA N C E D INDUSTRIES 15 PROJECT 20 I. INTRODUCTION 3, .F EB . T he need for economic renewal in the United States is urgent. Years A. M of disappointing job growth and stagnant incomes for the majority 1 of workers have left the nation frustrated and pessimistic. Many 12 :0 doubt that the nation’s economy can still deliver on its promise of prosperity. L At the same time, with “disruption” in the air, astonishing new technologies— N TI ranging from advanced robotics and 3-D printing to the “digitization of AS E U everything”—are provoking genuine excitement even as they make it difficult to see where the economy is headed. In short, it has become hard to agree on EL E the elements of a rebuilt American economy that works for all even as great FO R R potential remains evident. Which is where this paper comes in. Amid this climate of uncertainty, this report asserts that one particular swath of highly ED significant industries will be an important component of any revitalized U.S. economy. That sector is what this paper calls the “advanced industries” sector. First highlighted by McKinsey & Co., advanced industries—characterized by their deep O involvement with technological innovation and STEM (science, technology, engineering, and math) workers—create good G jobs in dozens of high-value, high-technology fields. These fields range from manufacturing industries such as automaking, BA R aerospace, and medical devices to fast-growing service industries such as computer software, to energy industries such as oil and gas extraction. Through their activities, these industries encompass the nation’s “tech” sector at its broadest and most EM consequential. What is more, these industries also drive productivity in other portions of the economy. They support long supply chains, and they stimulate local economies through the spending of their workers. Altogether, the sector directly and indirectly supports as much as one-fourth of the nation’s jobs. 10 THE BROOKINGS INSTITUTION | AMERICA’S ADVANCED I N D U ST R I ES 15 20 “Advanced industries support opportunity in other 3, sectors, and have led the post-recession employment .F EB . recovery. Their future competitiveness and growth are TI L 12 :0 1 A. M prerequisites for broadly shared prosperity.” N In short, the advanced industries sector—defined by its deep investment in R&D and STEM workers—encompasses the U nation’s highest-value economic activity. As such, these industries are the country’s best shot at innovative, inclusive, and AS E sustainable growth. But there is a problem. The future competitiveness of the U.S. advanced industries sector is uncertain. Competitor nations EL E are accelerating their investments in research and development (R&D), STEM workers, and strong regional technology ecosystems just as the U.S. commitment weakens. As a result, recent decades have seen large-scale losses of manufacturing jobs and a growing trade deficit even in advanced technology products.1 At the same time, the national government remains R locked in partisan paralysis when it should be providing a platform for renewal. Going forward, a new alignment of states, R cities, and metropolitan areas—and regional networks of public, private, and civic institutions—is going to be needed to tran- FO scend Washington’s paralysis and make advanced industry competitiveness a top priority. ED And so, at a moment of uncertainty about the sources of U.S. economic renewal, this report urges the nation to double down on the advanced industries sector as one component of future prosperity. The report first explains what the advanced O industries are and why they matter. It then explores the size, nature, and geography of the advanced industries sector, with G particular attention to its distribution across U.S. metropolitan areas. It describes both the strength of the sector in the BA R United States and a number of challenges that are undercutting its international competitiveness. Finally, the report suggests several priority areas for private- and public-sector work to promote the sector’s growth. EM Ultimately, the main point is simple: A competitive and growing advanced industries sector is prerequisite any future broadly shared prosperity. The nation should place a high priority on revitalizing them. n T H E B R O O K I N GS I NSTITUTION | INTRODUCTION 11 W H AT 15 WHERE WHY .F EB . 3, 20 I I . A M E R I C A’ S A D VA N C E D I N D U S T R I E S : W H AT T H E Y A R E A N D W H Y T H E Y M AT T E R A. M W :0 1 hat are advanced industries, and why do they matter? 12 Characterized by their heavy use of technology and technical work- TI L ers, advanced industries constitute the commercial innovation U N sector. Specifically, they represent the prime site in developed economies for AS E the conversion of technical invention into industrial-scale business enterprise. In EL E short, these industries anchor American economic well-being. R R What Advanced Industries Are FO This report defines advanced industries as those that both conduct large amounts of R&D and employ a disproportionate share of STEM workers. More precisely, Brookings defines advanced industries as those in which R&D spending per ED worker reaches the top 20 percent of all industries and the share of workers with significant STEM knowledge exceeds the national average. (See Chapter 3 and the methodological appendix online for more background on this definition and G O related analytic issues.) BA R Based on this definition, the U.S. advanced industries sector encompasses 50 diverse industries including 35 manufacturing, 3 energy, and 12 service industries. These industries include advanced manufacturing industries such as pharmaceuticals, motor vehicles, aerospace; energy providing industries such as oil and gas extraction and electric power generation; and EM critical service activities such as R&D services, software design, and telecommunications.2 These industries frequently defy easy classification and indeed conventional approaches to industry analysis have tended to obscure their increasing interrelatedness. 1 2 THE BROOKINGS INSTITUTION | AMERICA’S ADVANCED I N D U ST R I ES Time-worn delineations, such as those that differentiate between manufacturing and services, or between “low-tech” and “high-tech” goods, categorize industries based on products instead of the inputs and processes that create value (such as R&D and skills). Today, however, the increasing complexity and interconnectedness of the modern production system has eroded the value of such conventional industrial groupings and demands an updated approach to industry analysis. The conventional distinction between manufacturing and services, for example, has begun to blur as global firms increasingly 20 15 offer both. integrated “end-to-end” solutions that bridge the division between product and service delivery.3 Likewise, researchers have questioned the traditional separation between production and innovation in economic analysis.4 3, In the past, production occurred on a manufacturing shop floor while innovation was isolated in labs and design facilities. Yet .F EB . greater technical complexity coupled with shorter product life cycles has driven firms to incorporate design into the assembly process, cutting lead time and modification costs. In this environment, firms require tight links between their research divisions and manufacturing facilities, which often come in the form of real-time exchange between researchers, engineers, A. M and high-skilled production workers.5 The concept of “high-tech”—which has tended to refer to the computer production and software industries—has also lost meaning as the “digitization of everything” (driven by the ubiquity of electronics and computing) has pervaded every 1 industry.6 With smart grid and advanced sensor technology, next-generation refrigerators, for example, may have more lines :0 of computer code than twentieth century desktop computers. For that matter, an auto company like Tesla Motors has an 12 occupational profile similar to a software company. Against this backdrop, the delineation of a single, high-value, advanced L industries sector—defined by its innovation and workforce assets and characterized by its converging technologies and busi- N TI ness models—helps keep the focus on what matters at a moment of extraordinary economic change. U In this regard, the advanced industry sector is characterized by the fact that it is the portion of the economy within which the most critical technology trends play out most dramatically.7 Witness how the arrival of disruptive technologies in IT, “big AS E data” analytics, materials science, next-generation genomics, and robotics are transforming even such seemingly mature advanced industries as automotive manufacturing, management consulting, cable programming, and diagnostic laborato- EL E ries.8 At the same time, advanced industries are enabling disruptive innovation in other sectors of the economy too. Through the delivery of business services via the cloud computing, the rise of virtual-to- R real design techniques, 3-D printing, and R real-time logistics, for example, advanced FO industry products and services are reducing the barriers to entry for innovative entre- ED preneurs and SMEs in a number of different markets. Transformations underway in retail, O healthcare, supply chain management, and G even urban transportation are powered by EM BA R advanced industries. T H E B R O O K I N GS I NSTITUTION | II. AMERICA’S ADVANCED INDUSTRIES: WHAT THEY ARE AND WHY THEY MATTER 13 Why Advanced Industries Matter for the United States and Its Regions But why do advanced industries matter so much to society and for the broader economy? Why single out these industries for 15 special attention? At the most immediate level, the advanced industries sector has transformed life and work. 20 Working often with university and public-sector laboratories, advanced industries helped put the first human on the moon, developed hybrid and electric cars, and are now building out the mobile internet to bring billions of the globe’s citizens into 3, the connected world. Likewise, advanced industries have made LASIK, GPS, and TiVo commonplace; delivered blockbuster .F EB . biotech drugs and high-yield seeds; and driven forward the current revolution in unconventional oil and gas extraction. The iPhone is an icon of advanced industry competitiveness. So, too, are the 787 Dreamliner airplane and Google’s self-driving car. To the extent humanity mitigates the worst aspects of climate change, it will owe its progress to advanced industries’ A. M expansion of renewable sources such as solar or nuclear energy generation. But the advanced industries sector also represents a compelling economic fact. As the leading location of technological devel- 1 opment and its application in the United States, the sector plays a pivotal role in generating prosperity across the nation. 12 E NCOMPASSES MANY OF THE NATION’S MOST CRUCIAL INDUSTRIES. Advanced industries are L ●● :0 Specifically, the advanced industries sector: TI in many respects their nations’ linchpin industries—the industries that, in developed economies, establish technological N advantage and embody national competitiveness. Sizable in their own right, these industries frequently make dispropor- U tionate contributions to GDP through above-average productivity, which is a leading predictor of worker wages. Likewise, because of the complexity of their products and services, these industries support long chains of raw materials providers, AS E specialized parts suppliers, and assorted service providers. Although it is certainly true that supply chains are increasingly global, trade data suggest that the United States retains many of their highest-value portions.9 Economic literature EL E also suggests that advanced industries have high employment and output multipliers—measures of the ancillary economic activity one job spurs elsewhere in the economy—given the above-average wages they pay and their strong links to other sectors of the economy, both for inputs and through their broader impacts.10 Yet the sector’s significance goes far beyond R its size. Advanced industries possess outsized economic importance for the nation and its regions. Nearly every advanced R industry resides in the traded sector—the sector that competes internationally, sells abroad at least partially, and returns FO sales revenue to America. Traded sector industries are essential to a nation’s prosperity. As innovation experts Stephen Ezell and Robert Atkinson write, “It’s simply impossible to have a vibrant national economy without a globally competitive ED traded sector.”11 For a nation that has been running significant trade deficits for years, including in “advanced technology O products,” advanced industries will be instrumental in reducing them.12 G Beyond matters of productivity and trade, the advanced industries sector looms large in supporting such national and BA R global objectives as national security, energy independence, food sustainability, health, and rising standards of living. The aerospace, electronics, and communications industries play a significant role in delivering the goods and services EM that help nations respond to threats such as terrorism, environmental disasters, and pandemics.13 The electric power, oil and gas, and scientific research industries are helping the world maintain access to—and store—low-cost, secure sources of energy, including clean energy. (Witness the progress that “cleantech” advanced industries have made in reducing the cost of photovoltaics and boosting the energy density of storage devices.) As the world’s population grows, biotechnology industries are enabling the world to feed its population through innovations in plant genomics, high-yield seeds, and improved crop and water management. Likewise, medical, pharmaceutical, genomic, electronic, and “big-data” advanced 1 4 THE BROOKINGS INSTITUTION | AMERICA’S ADVANCED I N D U ST R I ES industries are all working to advance the health of the nation and world through the development of remote monitoring, new prevention and treatments, and personalized medicines. Consumer-oriented advanced industries such as electronics, computers, motor vehicles, and appliances, for their part, have materially improved household standards of living by expanding purchasing options, bringing time- and money-saving capabilities to the average person, and driving prices down and quality up.14 In short, U.S. advanced industries are engaged in delivering highly important goods and services that respond directly to the nation’s most pressing challenges. H 3, HOW THE ECONOMIC IMPACT OF ADVANCED INDUSTRIES RADIATES 20 15 .F EB . igh and rising standards of living are generated largely in two ways: through trade and through economic growth. Advanced industries lie at the center of both. Advanced industries anchor the traded sector, which, by earning money from other locations, serves as the primary generator of wealth for cities, regions, and nations. Furthermore, trade encourages specialization, which A. M increases productivity. The potential to export also encourages investment by promising increased sales, economies of scale, and therefore profits. Advanced industries encompass the competitive heart of the U.S. traded sector—and for that reason pay well. 1 Yet the advanced industries sector’s role in the economy extends well beyond trade. Advanced industries support :0 large numbers of indirect jobs (a multiplier effect) and generate the technologies that enhance productivity and increase 12 economic growth. L The sector’s substantial “multiplier effect” on jobs explains why it plays such an outsized role in U.S. employment. As TI income earned by advanced industries is paid out to employees, suppliers, and service providers, money radiates out to U depends heavily on income from the traded sector. N the broader economy, supporting more jobs. The non-traded sector of the economy—where most people work—in fact Yet the impact of advanced industries radiates even further. As Philippe Aghion and Peter Howitt state, “In order to AS E sustain a positive growth rate in output per capita in the long run, there must be continual advances in technological knowledge.” Advanced industries represent the prime site of that technological knowledge in the economy. New knowl- EL E edge and technology in turn enable the economy to increase the value of output from a fixed quantity of inputs. In other words, it powers productivity growth economy-wide, which is the only durable means by which a society’s living standards can rise. R In sum, advanced industries are the nation’s crown jewel industries because they prime the economy with income, FO R knowledge, and technology. In doing so, they generate employment, value, and progress across the entire economy. BA R G O ED Sources: Robert Solow, “A Contribution to the Theory of Economic Growth,” Quarterly Journal of Economics, 70(1)(1956); Philippe Aghion and Peter Howitt, Endogenous Economic Growth Theory (Cambridge, MA: MIT Press, 1997), p. 11; Douglass North, “Location Theory and Regional Economic Growth,” Journal of Political Economy, 63(3) (1955); Paul Romer, “Endogenous Technological Change,” Journal of Political Economy, 98(5) (1990); Paul Krugman, The Age of Diminished Expectations (Cambridge, MA: MIT Press, 1994). ●● R EPRESENTS A KEY SITE OF INNOVATIVE ACTIVITY. Related to their orientation toward key national challenges is the fact that advanced industries are the nation’s principle locus of industrial innovation. Innovation matters EM to nations, states, regions, companies, and families because it represents the only viable avenue for high-wage economies to increase productivity and continue to improve their citizens’ standard of living in the long run.15 Advanced industries matter inordinately because, by definition, they draw together society’s innovation resources. In particular, they are the primary site of the R&D spending that drives product and process innovation in the economy.16 As such, the sector is the nation’s top source of the innovation that drives increased productivity, which in turn generates increased profits and market share for firms, growth for industries, and broad economic benefits for households, regions, and the nation.17 T H E B R O O K I N GS I NSTITUTION | II. AMERICA’S ADVANCED INDUSTRIES: WHAT THEY ARE AND WHY THEY MATTER 15 The sector’s significance as a source of innovation is likely undercounted. Considering that three-fourths of U.S. firms perform no R&D, economist David Audretsch asks, “Where do innovative firms with little or no R&D get the knowledge inputs?”18 The answer is from “spillovers” from the most R&D-intensive firms such as those in the advanced industries sector. Because innovative companies cannot capture all of the knowledge generated from their R&D investments, other firms that employ similar processes or create complementary products often acquire the new knowledge through imitation, use, worker turnover, or other ways.19 So advanced industry innovation investments, activities, and advances “spill 20 15 over” to other areas. They radiate. And in some cases, such as with IT products and services, advanced industry technologies have emerged as “general 3, purpose technologies” that have enabled truly significant productivity advances throughout the economy.20 Consider, .F EB . for example, the IT ecosystem. Although iconic firms such as IBM, AT&T, Microsoft, and Google created the IT ecosystem, thousands of other firms and entrepreneurs in nearly every other industry have reaped the bulk of the economic rewards. Altogether, the application of IT advancements in the United States has been responsible for more than 30 percent of A. M labor productivity growth economy-wide over the past decade.21 :0 1 HOW ADVANCED INDUSTRY INNOVATIONS SPILL OVER TO THE LARGER ECONOMY N 12 o technology better epitomizes how advanced industries support U.S. economic growth through innovation and L its wide adoption than information technology (IT). Prior to the mid-1990s productivity growth from IT remained TI almost exclusively within those firms producing software and hardware (all in advanced industries). Yet in the N decade following 1995, productivity gains from IT came predominately from firms outside of the IT sector, particularly U in high-value advanced industries such as management and R&D consulting, medical devices, and precision instrument manufacturing. These firms began leveraging IT to improve operations and to grow. During this period, IT was responsi- AS E ble for two-thirds of U.S. productivity growth, despite the IT sector only employing 2.5 percent of the workforce directly. Research by Jorgenson, Ho, and Samuels shows that total factor productivity increased sharply in sectors that used IT EL E extensively during the 1990s and fell in those that did not. During the years 1995–2000 sectors using IT registered 10 times higher total factor productivity than other sectors. Since then, the retail, wholesale, and hospitality sectors have begun to invest heavily in IT, and IT was responsible for R more than one-third of total labor productivity growth between 2002 and 2012. The further dissemination of IT into R large and conspicuously lagging sectors—namely health care and education—promises even greater productivity gains. FO The 30-year trajectory of IT illustrates a critical economic point: U.S. economic growth is contingent on waves of game-changing technologies that are typically introduced by a subset of advanced industry firms, then adopted by ED whole industries, and finally diffused into every corner of the economy. BA R G O Sources: Dale Jorgenson and others, “Information Technology and U.S. Productivity Growth: Evidence from a Prototype Industry Production Account,” Journal of Productivity Analysis, 35(2) (2011). Information technology is not the only general purpose technology generating a sizable impact. Others include the EM genomic revolution, the arrival of advanced material science, and emerging new developments in advanced robotics and machine learning.22 For example, McKinsey & Co. estimates that the economic impact of gene sequencing in health care, agriculture, and biofuels will equal more than $1 trillion during the next decade.23 In the coming decades, new general pur- pose technologies introduced by the advanced industries sector, such as nanotechnology and advanced energy storage, may emerge as major sources of economic growth. 1 6 THE BROOKINGS INSTITUTION | AMERICA’S ADVANCED I N D U ST R I ES ●● T RAINS AND EMPLOYS MUCH OF THE NATION’S STEM WORKFORCE. The sector also factors significantly in building and maintaining the nation’s skilled workforce. A storehouse of the nation’s STEM knowledge base, the sector also serves as a critical repository of skilled workers that over time flow out into the rest of the economy. STEM workers—from aerospace engineers to software developers, materials engineers, biochemists, power plant operators, mechanical engineers, and skilled technicians—matter because they make and apply the inventions that sustain innovation and growth.24 At the professional level, highly trained engineers and scientists keep American business on the cutting 15 edge through invention and entrepreneurship. At the sub-bachelor’s level, skilled technicians produce, install, maintain, 20 and repair the products and machines patented by researchers, allowing firms to reach their markets, reduce product defects, create process innovations, and enhance productivity. Moreover, as one of this paper’s co-authors has observed 3, elsewhere, although these technicians may not be directly involved in invention, they are critical to the implementation of .F EB . new ideas and advise researchers on the feasibility of design options, material choices, cost factors, and other practical aspects of technology development and deployment.25 Advanced industries, in this respect, not only employ a core cadre of the top workers in hundreds of the nation’s occupa- A. M tions, but they also contribute to the retraining and upskilling of workers throughout the rest of the economy.26 STEM workers, after all, introduce STEM skills into other industries, including management and professional services, finance, 1 and health care.27 In that sense, the impact of advanced industries again radiates outward through the economy. :0 *** 12 And yet advanced industries are not just a remote influence on national well-being. By dint of their uneven distribution TI L across U.S. states and regions they represent a critical determinant of metropolitan prosperity as well. N To see this one has only to think of Raleigh’s clusters of software, telecommunications, and medical and electrical equipment U manufacturing; Wichita’s strong aerospace industry; or San Diego’s substantial IT, biotech, software, and scientific consulting AS E activities. Advanced industries tend to cluster geographically because they depend on proximity to shared innovation resources such EL E as universities and national laboratories; access to pools of skilled labor; and myriad “ecosystem” benefits including information spillovers, local supply chain density, and available networks of related firms, specialized suppliers, and service provid- R ers.28 In doing so, these industries confer myriad economic benefits on their home regions. R Not only do metropolitan area economies profit by definition from the presence of these innovation- and STEM worker- FO intensive industries whose patenting, training, and value chains are associated with increased productivity growth, highwage employment, and entrepreneurship.29 In addition, regions can benefit from powerful feedback loops when they accrue ED sufficient densities of advanced industry activity. As more firms cluster, the accumulation of complementary economic activity—cutting-edge research, bespoke training programs, specialized suppliers, and industry associations—only increases O the attractiveness of the locale for other firms and new investments. This pooling can in turn accelerate the emergence of G new solutions and new hybrid industries as technologies converge and combine.30 In this respect, the benefits to regions can BA R be exponential. Such clustering dynamics help explain the emergence of a flourishing space technology cluster in Denver and a vibrant EM smart buildings specialization in Seattle. It also helps explain the emergence of urban “innovation districts” in many cities as firms, researchers, and their partners converge within urban spaces to absorb crucial market information and be close to fast-changing ideas.31 These physically compact, transit-accessible collaboration nodes—like those that have emerged at Kendall Square in Cambridge, or in Seattle’s South Lake Union area—are one of the most visible ways in which the evolving needs of advanced industries are beginning to change spatial development patterns too. T H E B R O O K I N GS I NSTITUTION | III. DEFINING AND MEASURING ADVANCED INDUSTRIES 17 DISRUPTIVE TECHNOLOGIES DEFINE THE ADVANCED INDUSTRIES SECTOR N umerous breakthrough technologies are not only transforming the advanced industries sector but in many respects redefining it. The cross-cutting nature of many of these disruptive technologies reinforces the ongoing convergence of production and innovation, manufacturing and services, and material and digital. Among the 20 ●● 15 most defining technology trends are: Additive manufacturing / 3-D printing: 3-D printing is the additive process of building objects through layering. 3, Additive manufacturing has the potential to substantially reduce the cost and time of prototyping in production ●● .F EB . industries and could also enable the mass customization of products. Advanced materials: Advanced materials are developed from compounds at a molecular level through applied physics, materials science, and chemistry. Advanced materials hold the prospect of reducing the weight of vehicles ●● A. M without losing strength, creating efficient clean energy, and more durable machinery. Advanced robotics: Automation and advanced robotics allow for greater speed, consistency, and complexity in the 1 production process. Although robotics are not new, only recently has artificial intelligence become sophisticated Big data/ advanced analytics: Big data refers to data sets that are too large for traditional computing tools and L ●● 12 :0 enough to automate nonroutine tasks such as assembly line quality control monitoring. TI require unique software and skilled technicians to store, manage, and analyze. Big data are important for not only N managing complex global supply chains or customer relationships, but also learning and innovation in the produc- U tion process. Cloud computing: Cloud technology allows nearly all computing applications to be delivered through networks or AS E ●● over the Internet. By radically reducing operating costs, cloud computing can potentially revolutionize business ●● EL E models in every industry from retail to software development. Internet of Things: Advanced software, robotics, cheap sensors, and network connectivity are combining to allow ●● R FO tasks and systems. R objects to interact digitally. As technologies improve, networked smart devices can bring new dynamism to old Next-generation genomics: Genomics is the study of DNA to unlock new organic knowledge. Low-cost gene- ED sequencing machines hold promise for revolutionary drug treatments, new biofuels, and drought- and pest-resis- O tant crops. Coming technologies will likely even yield radical innovations in gene manipulation. EM BA R G Sources: McKinsey Global Institute, “Disruptive Technologies: Advances That Will Transform Life, Business, and the Global Economy” (2013); President’s Council of Advisors on Science and Technology, “Capturing Domestic Competitive Advantage in Advanced Manufacturing” (2012). In short, advanced industries are vital to both the nation and its regions. These industries anchor the traded sector. They are the leaders in U.S. innovation and well-compensated technical employment, and they represent the focal point of U.S. technology convergence and transformation—locally and nationally. Identifying an advanced industries sector in the United States creates a clear view of the industries that matter most in driving U.S. prosperity. n 1 8 THE BROOKINGS INSTITUTION | AMERICA’S ADVANCED I N D U ST R I ES W H AT 15 WHERE WHY .F EB . 3, 20 III. DEFINING AND MEASURING A D VA N C E D I N D U S T R I E S T A. M o identify America’s advanced industries this analysis developed an 1 industry-level approach that focuses on industries’ efforts to research 12 :0 and develop new products, capabilities, and techniques combined with N TI L their employment of technical workers.32 U The two concepts—industry investment in R&D and a technically skilled workforce—are related but distinct. R&D speaks to the centrality of innovation to an industry, whether through the invention of new technologies, products, and processes or dif- AS E ferent combinations or improvements of existing ones. Such discoveries increase productivity, create new markets, and push frontiers in established product spaces.33 Ultimately, they enable society to generate more output for any given set of inputs EL E and enjoy rising standards of living in the process.34 The presence of technical workers, meanwhile, speaks not only to the workers who conduct R&D but also to those who apply R its outputs. For a company to realize the value of its discoveries or those of its clients, the production staff—whether factory R workers or software developers—must understand and implement the new processes; make refinements, fixes, and repairs to FO them; and provide informed feedback to the researchers and the company’s suppliers.35 The sales and management staff, to varying degrees, also need to understand at least some of the technical aspects of the company’s products and those of its ED suppliers and customers. O Accordingly, this analysis presumes that assessing two terms—the amount an industry spends on R&D activities and the G degree to which the industry’s occupations require a high degree of technical or STEM knowledge—provides a cogent frame- BA R work for identifying the most advanced industries in the economy. R&D spending, for its part, approximates the resources marshalled in the pursuit of new products, processes, and technolo- EM gies. Measures of R&D intensity—R&D expenditures as a share of output or per worker—capture the basic innovative stance of an industry. In high-wage, high-tech economies, R&D spending is a prominent driver of technological innovation and economic growth and has significant spillover benefits.36 This is particularly true at the industry level. T H E B R O O K I N GS I NSTITUTION | IV. FINDINGS 19 For their part, STEM workers encompass an industry’s ability to both innovate and realize the full value of innovations, whatever their origins. In this sense, STEM workers are closely involved in both the development of new techniques and technologies and in their adoption and diffusion. Accordingly, this report employs a relatively new method to determine the STEM-knowledge intensity of an industry’s workforce. The method utilizes the rich Occupational Information Network (O*NET) database, produced by the Department 15 of Labor’s Employment and Training Administration. This database collects detailed data from workers on various aspects 20 of their jobs and job requirements. These data allow for all occupations within an industry to be evaluated on the basis of the STEM knowledge they require. STEM knowledge categories include science (a composite measure that includes biology, 3, chemistry, and physics), math, computer science, and engineering (a composite measure that includes engineering, mechani- .F EB . cal, and design knowledge). In order to operationalize the full definition, this analysis deems “advanced” those industries—defined at the four-digit North American Industry Classification System (NAICS) code level—that both spend a large amount on R&D relative to the size of A. M their workforce and also rely on numerous STEM workers. 1 More specifically, the report categorizes industries as “advanced” when: R&D spending exceeds $450 per worker, as measured by the National Science Foundation’s 2009 Business R&D and :0 ●● Over 20 percent-above the U.S. average—of an industry’s workforce can be found in occupations requiring a high- TI ●● L 12 Innovation Survey (BRDIS), which equates to roughly the 80th percentile of spending intensity37 U N degree of STEM knowledge as defined by O*NET38 This definition is unique in the details of how STEM and R&D are measured and in the cut-offs used.39 In particular, this report AS E adopts R&D expenditures per worker as a principle metric rather than the more conventional R&D expenditures as a share of EL E revenue. This decision bears further elaboration. Using employment rather than revenue is advantageous for a number of reasons. The first is theoretical. Both labor and R&D are inputs into the production process, whereas revenue is an output. However, R the per worker measure gets closer to the ideal metric: the share of an industry’s workforce devoted to R&D. Empirically, the R per worker measure also performs better. Using data from the Organization for Economic Cooperation and Development FO (OECD) for member countries, R&D spending per worker is more highly correlated with average income or patents per worker than R&D as a share of GDP.40 Likewise, across U.S. industries, patenting per worker is more highly correlated with ED R&D per worker than R&D as a share of sales.41 O To determine the STEM knowledge intensity of individual industries, meanwhile, this report employs a novel and more G precise method developed by Jonathan Rothwell, a coauthor, the details of which are reported elsewhere.42 Ultimately, the BA R approach undertaken here identifies 50 distinct advanced industries. Thirty-five are in the manufacturing sector, three are in EM the energy sector, and 12 are service industries. 20 THE BROOKINGS INSTITUTION | AMERICA’S ADVANCED I N D U ST R I ES The advanced industries sector is composed of 50 individual R&D- and STEM knowledge-intensive industries Summary Statistics U.S. Output (2013) (thousands) 15 $80,188,100 $60,674,000 $34,691,800 $13,503,100 $141,516,200 $25,104,500 $3,885,300 $7,317,600 $15,203,100 $7,355,600 $13,991,200 $36,446,400 $15,796,400 $11,925,200 $14,842,400 $32,757,200 $60,734,100 $25,596,000 $3,970,800 $83,242,500 $88,975,600 $4,701,500 $6,166,800 $7,174,300 $20,528,800 $16,297,200 $41,639,800 $17,079,200 $79,621,800 $96,230,000 $3,641,600 $17,139,100 $4,548,600 $49,965,200 $33,273,900 EM BA R G O ED FO R R EL E AS E U N TI L 12 :0 1 A. M .F EB . 3, 4-Digit U.S. NAICS Employment Code Industry Title (2013) MANUFACTURING 3241 Petroleum and Coal Products* $693 42% 111,200 3251 Basic Chemicals $14,679 50% 141,600 3252 Resins and Synthetic Rubbers, Fibers, and Filaments $11,110 46% 91,500 3253 Pesticides, Fertilizers, and Other Agr. Chemicals $33,109 43% 37,900 3254 Pharmaceuticals and Medicine $143,110 48% 277,100 3259 Other Chemical Products* $45,778 29% 82,300 3271 Clay Products $6,308 30% 39,300 3279 Other Nonmetallic Mineral Products $4,558 22% 70,300 3311 Iron, Steel, and Ferroalloys $2,705 29% 90,800 3313 Aluminum Production and Processing $4,329 32% 57,900 3315 Foundries $1,372 36% 126,600 3331 Agr., Construction, and Mining Machinery $11,709 39% 250,600 3332 Industrial Machinery $23,672 50% 107,000 3333 Commercial and Service Industry Machinery $13,330 42% 87,200 3336 Engines, Turbines, and Power Trans. Equipment $13,557 45% 97,900 3339 Other General Purpose Machinery $5,293 42% 254,800 3341 Computers and Peripheral Equipment $60,339 71% 158,800 3342 Communications Equipment $91,428 57% 102,400 32% 19,600 3343 Audio and Video Equipment $28,074 3344 Semiconductors and Other Electronic Components $49,612 50% 374,900 3345 Navigation, Measurement, and Control Instruments $14,265 58% 393,000 3346 Magnetic and Optical Media $5,919 28% 19,000 3351 Electric Lighting Equipment* $821 28% 47,300 3352 Household Appliances* $821 27% 57,600 3353 Electrical Equipment* $821 37% 144,200 3359 Other Electrical Equipment and Components* $821 37% 124,900 3361 Motor Vehicles $48,461 27% 178,100 3362 Motor Vehicle Bodies and Trailers $759 23% 134,100 3363 Motor Vehicle Parts $6,791 36% 508,000 3364 Aerospace Products and Parts $20,501 60% 492,500 3365 Railroad Rolling Stock $2,782 32% 25,200 3366 Ship and Boat Building $4,640 39% 134,300 3369 Other Transportation Equipment $13,476 30% 32,300 3391 Medical Equipment and Supplies $24,343 33% 306,700 3399 Other Miscellaneous $8,547 23% 273,000 ENERGY 2111 Oil and Gas Extraction* $613 58% 197,700 2122 Metal Ore Mining $836 48% 44,500 2211 Electric Power Generation, Trans., and Distribution $2,173 47% 394,000 SERVICES 5112 Software Publishers $80,977 70% 297,200 5152 Cable and Other Subscription Programming $1,370 36% 72,500 40% 155,300 5172 Wireless Telecommunications Carriers $455 5174 Satellite Telecommunications $5,948 69% 9,700 5179 Other Telecommunications $1,999 57% 84,300 5182 Data Processing and Hosting* $1,020 56% 267,500 5191 Other Information $27,476 40% 194,200 5413 Architecture and Engineering $738 74% 1,353,700 5415 Computer Systems Design $7,225 75% 1,698,400 5416 Mgmt., Scientific, and Technical Consulting $1,950 39% 1,177,100 5417 Scientific Research and Development $13,627 73% 635,700 6215 Medical and Diagnostic Laboratories $988 50% 241,100 Advanced Manufacturing Industries 5,449,900 Advanced Energy Industries 636,200 Advanced Services Industries 6,186,700 Advanced Industries Total 12,272,800 T H E B R O O K I N GS I NSTITUTION | IV. FINDINGS * = Imputed from 3-digit NAICS by Brookings Sources: Brookings analysis of National Science Foundation, Bureau of Labor Statistics, and Moody’s Analytics data 20 Definitional Criteria R&D Share of High Spending STEM Knowledge per Worker Occupations (2009) (2012) $212,280,600 $19,094,400 $219,849,500 $116,417,500 $33,131,500 $49,110,500 $3,903,200 $32,904,700 $45,588,500 $45,801,200 $179,136,700 $246,466,900 $166,593,900 $112,426,700 $21,434,000 $1,175,724,700 $451,224,500 $1,052,915,300 $2,679,864,500 21 This approach has strengths and weaknesses. A strength is that the methodology allows for the use of standard industry data to define a single coherent body of high-value economic activity. By applying carefully crafted criteria to a familiar unit of analysis (four-digit NAICS industries), this method identifies a large group of highly sophisticated industries that previous studies have not aggregated. The use of NAICS-based industry data, meanwhile, permits comparability across a large body of standardized public and private statistics at the international, national, and regional scales.43 15 A key shortcoming here includes the difficulty of classifying individual firms whose activities, in practice, span multiple 20 industries. For example, that Amazon is an “advanced” firm is hard to dispute. However, Amazon’s classification as a retailer (NAICS 4541: electronic shopping and mail-order houses) technically precludes its inclusion in the advanced industries sector, 3, even though some of the company’s individual physical establishments specializing in, for example, computer systems design .F EB . or software programming, would be included. In a similar fashion, the present industry-oriented definition may miss pockets of sophisticated activities in other industries. Conversely, the method likely captures some relatively unsophisticated activities and establishments within industries that exhibit an “advanced” profile in aggregate national data but not necessarily in every particular region (think for example of the full range of firms and establishments classified in the “motor vehicle parts A. M manufacturing” industry across the country). *** 1 Overall, this analysis advances a fresh scan of the diverse range of sophisticated industries that represents the most :0 advanced portion of the American economy. For a more in-depth discussion of the data sources and method employed as 12 well as information on the methods employed for calculating multiplier effects, patenting rates, price effects, worker char- L acteristics, hiring difficulty, regional variation, and international comparisons, please see the online appendix accompanying AS E U N TI this report. n EL E “This analysis presumes that assessing two terms—the R amount an industry spends on R&D activities and the R degree to which the industry’s occupations require a FO high degree of technical or STEM knowledge—provides ED a cogent framework for identifying the most advanced EM BA R G O industries in the economy.” 22 THE BROOKINGS INSTITUTION | AMERICA’S ADVANCED I N D U ST R I ES W H AT 20 .F EB . 3, I V. F I N D I N G S : A D VA N C E D INDUSTRIES IN THE UNITED S T A T E S A N D G L O B A L LY 15 WHERE WHY A. M A 1 n analysis of the 50 industries that comprise the U.S. advanced indus- 12 :0 tries sector finds that, notwithstanding recent output and employ- N TI L ment gains, the sector’s global prominence is challenged: EL E AS E U U.S. advanced industries generate a large and rising share of the nation’s GDP and, after years of decline, have led the postrecession employment recovery As of 2013, the 50 advanced industries in the United States employed 12.3 million U.S. workers, or nearly 9 percent of total R employment. To put that in context, the sector employs 4 million more workers than the U.S. financial, insurance, and real R estate sectors combined but 5 million fewer than the health care and social services sector. And yet, even with this modest FO employment base, U.S. advanced industries generate $2.7 trillion worth of output annually, or 17 percent of U.S. GDP. That is ED more than any other sector, including health care, finance, or real estate. With that said, the number of jobs in the sector has barely budged since 1980 even as its output has soared. Looking at the O long-term trend, the sector added a modest one million jobs from 1980 to 2013 but saw its share of total U.S. employment G slip from 11.6 to 8.7 percent. During the period, however, the sector contributed a hefty 22 percent to the increase in GDP, BA R expanding at a rate of 5.4 percent annually, 30 percent faster than the economy as a whole. In the nearer term and since the Great Recession both employment and output levels in the sector rose dramatically from EM 2010 to 2013. Advanced industries have added nearly one million jobs since 2010, with employment and output growth rates 1.9 and 2.3 times higher, respectively, than in all other sectors combined. Advanced services led this post-recession surge and created 65 percent of the new jobs in the sector. Computer systems design alone generated 250,000 new jobs. Certain advanced manufacturing industries—especially those involved in transportation equipment—have added thousands of jobs during the recovery too. T H E B R O O K I N GS I NSTITUTION | IV. FINDINGS 23 24 Share of U.S. Employment 0% 4% ED O 2% G BA R EM 6% FO 8% R 12% U 1 :0 12 75,000 25,000 1980 -25,000 1984 1988 14% A. M .F EB . 3, 15 175,000 20 Communications Eqpmnt. Wireless Telecoms Carriers Precision Instruments Other Telecoms Electric Power Generation Magnetic & Optical Media Comm. & Service Ind. Machinery Satellite Telecoms Pharmaceuticals Audio & Video Eqpmnt. Cable and Other Programming Misc. Transportation Eqpmnt. Clay Products 125,000 Misc. Chemicals Computer Eqpmnt. Petroleum & Coal Products Electrical Lighting Eqpmnt. Pesticides & Fertilizers Household Appliances Resins & Synthetic Materials Basic Chemicals Semiconductors Medical Eqpmnt. & Supplies Other Nonmetal Mineral Prods. Aluminum Prod. & Process. Railroad Rolling Stock Misc. Electrical Eqpmnt. Iron, Steel, and Ferroalloys Ship & Boat Building Industrial Machinery Engines & Power Eqpmnt. Metal Ore Mining Electrical Eqpmnt. Misc. Manufacturing Medical and Diagnostic Labs Aircraft Products & Parts Foundries R&D Services Data Processing & Hosting Motor Vehicle Bodies & Trailers Motor Vehicles General Purpose Machinery Software Products Oil & Gas Extraction Agri., Constr., & Min. Machinery Web Search and Internet Pub. Architecture & Engineering Motor Vehicle Parts Management Consulting Computer Systems Design L TI N Services now account for a larger share of advanced industry employment than manufacturing AS E EL E 10% R Absolute Increase in Jobs (2010–2013) The advanced industry sector’s post-recession employment surge has been broad-based but led by services 275,000 225,000 ■ = Manufacturing 1992 1996 2000 2004 ■ = Energy 2008 ■ = Services Advanced Industries Sector Advanced Services Industries Advanced Manufacturing Industries Advanced Energy Industries 2012 Lying behind these trends is a diverse and evolving industry composition within the sector, which cuts across three major sub-sectors: manufacturing, energy, and services. In 1980, manufacturing industries employed the vast majority of the advanced industries workforce. However, decades of technological and structural change in the global economy saw the advanced manufacturing sector shed 3 million net jobs between 1980 and 2013. As a consequence, manufacturing’s share of total advanced industries employment fell from 75 percent to 44 percent during the period. Services now constitute the largest subsector of advanced industries. Within THE BROOKINGS INSTITUTION | AMERICA’S ADVANCED I N D U ST R I ES manufacturing, 32 of 35 individual advanced manufacturing industries lost jobs between 1980 and 2013—12 of which lost at least 100,000 jobs, including the aerospace and navigational and precision instrument manufacturing industries, which each shed more than 200,000 positions. Nevertheless, many advanced manufacturing industries continue to employ large numbers of workers, and employment in motor vehicle body and trailer, medical equipment, and pharmaceutical manufacturing has increased since 1980. In 15 fact, employment increased in 26 of the 35 advanced manufacturing industries between 2010 and 2013. During that time, 20 advanced manufacturing industries outperformed other manufacturing industries on both annual employment growth (1.8 versus 1.0 percent per year) and output growth (1.8 versus 0.4 percent per year), hinting at something potentially more .F EB . 3, durable than the standard bounce-back following a recession. At the same time, advanced services have demonstrated enormous strength, surpassing even advanced industries manufacturing in employment. Employment in these industries swelled by 3.8 million between 1980 and 2013, achieving a 3.2 percent annual average growth rate. This compares with 1.2 percent growth for the overall U.S. economy. Composing just over one- A. M half of the advanced industries workforce and 4.4 percent of the U.S. workforce, advanced service providers now generate 9.2 percent of GDP—up from 3.0 percent in 1980—after three decades of spectacular growth in value-added. 1 Computer systems design led all advanced industries in job growth by adding 1.5 million jobs between 1980 and 2013 with :0 swift annual average employment and output growth rates of 7.0 percent and 8.3 percent, respectively. Management, sci- 12 entific, and technical consulting services added another one million jobs. Architecture and engineering services, software TI L publishers, and scientific research and development services together added another 0.9 million jobs during the period. N Energy industries constitute the smallest subset of advanced industries and employ 6 percent of all workers in the sector. U Advanced energy industries include electric power generation, transmission, and distribution; oil and gas extraction; and metal ore mining. Each industry lost jobs between 1980 and 2013, and their shares of total U.S. output declined. During the AS E recovery period of 2010 to 2013, however, oil and gas extraction added 39,000 jobs and realized 10 percent annual average EL E GDP growth, likely propelled by the boom in oil and gas exploration fueled by new drilling technologies. FO R R Since 1975, average earnings in advanced industries have increased almost five times as fast as those in the overall economy ED Advanced Industries G O $80,000 $60,000 EM BA R Average Earnings per Worker (inflation adjusted) $100,000 United States $40,000 $20,000 0 1975 1980 1985 T H E B R O O K I N GS I NSTITUTION | IV. FINDINGS 1990 1995 2000 2005 2010 25 A DVA N C E D I N D U ST R I ES SUPPORT EXTREMELY HIGH-QUALITY ECO N O M IC O P P O RT U N I T I ES FOR WORKERS, REGIONS, AND T H E N AT I O N Workers in advanced industries are extraordinarily productive. Each worker generates approximately $210,000 worth of output compared with $101,000 for the average worker outside advanced industries.45 Moreover, productivity in the sector 15 has been rising for decades, and increased at a rate more than twice that of the overall U.S. economy (3.2 versus 1.3 percent 20 annual average growth) between 1980 and 2013.46 That additional value leads to higher tax revenue, profits, and salaries, 3, much of which eventually contributes to local and domestic business activity. .F EB . Advanced industries compensate their workers handsomely and, in contrast to the rest of the economy, wages are rising sharply. In 2013, the average advanced industries worker earned $90,000 in total compensation.47 This nearly doubled the $46,000 in total compensation earned by the average worker in other sectors. Absolute earnings in advanced industries grew by 63 percent between 1975 and 2013, after adjusting for inflation. This compares with just 17 percent for the average A. M worker outside the sector.48 Even workers with minimal education can earn salaries that far exceed their peers in other sectors. Advanced industries 1 workers with some college but no degree earn $53,000 a year, on average, and those with an associate’s degree earn :0 $58,000. This compares with $31,000 and $38,000, respectively, for their counterparts outside the sector. In fact, advanced 12 industries workers with an associate’s degree earn more than those with a bachelor’s degree in other industries, who aver- L age $55,000 annually. Those working in the sector with a graduate education can expect to earn well above six figures N TI whether they have a master’s, PhD, or professional degree. U High earnings and strong earnings growth are typical in nearly all 50 advanced industries. Of the 50, only one (motor vehicle body manufacturing) pays its average worker less than the average worker in other industries. Forty-three of the 50 expe- AS E rienced faster salary growth between 1975 and 2013 than the national average (13 percent) of other industries. Within the EL E sector, advanced services showed the highest salary growth.49 R Advanced industries offer a significant wage premium at every level of education Advanced Industries $115 $20 a No Se co nd a ry Di pl om a om Di pl Se co n da ry e So m $33 $28 $32 $44 $54 ge Co lle gr ee As so c ia te ’s De gr ee De Ba c he lo r ’s De as te rs ’s M Pr of es si on a lD eg Ph re e gr ee $38 $40 $0 $60 $56 $69 $89 $89 $80 D G BA R EM 26 Non-Advanced Industries $130 FO $117 ED $120 O Average Wage (thousands) $153 R $160 THE BROOKINGS INSTITUTION | AMERICA’S ADVANCED I N D U ST R I ES Powerful multiplier effects mean every new advanced industry job supports more than two others Manufacturing Services Total Sector 1.8 0.8 1.4 1.0 0.8 U.S. Economy Non-Advanced Industries 15 4.0 3.5 2.5 20 3.0 1.0 1.1 0.5 0.6 0.0 Local 0.5 0.5 A. M 1.5 .F EB . 3, 2.3 2.0 Non-local domestic 0.4 0.4 :0 1 Jobs Supported by Each Additional Worker Advanced Industries Energy 12 Advanced industries also support much deeper supply chains than most other industries. Advanced industries purchase L $236,000 in goods and services per worker from other businesses annually. This compares with $67,000 among other indus- N TI tries. Twenty percent of that spending stays local, and 69 percent stays within the United States. U Spending by advanced industries businesses and workers sustains and creates new jobs to an extraordinary degree. Every new advanced industries job creates 2.2 jobs domestically—0.8 jobs locally and 1.4 jobs outside of the region. This means AS E that in addition to the 12.3 million workers employed by advanced industries, another 27.1 million U.S. workers owe their jobs to economic activity supported by advanced industries through their supply chains and their employees’ consump- EL E tion. Directly and indirectly, in other words, the advanced industries sector supports over 39 million jobs, over one-fourth of the U.S. workforce. R This multiplier effect is significantly higher than other industries. On average in other industries, new jobs create only one R additional domestic job—0.4 jobs locally and 0.6 jobs outside the region. Advanced industries, therefore, provide communi- FO ties and the nation roughly two to three times the indirect employment impact of other industries. G O ED The advanced industries sector is highly metropolitan and varies considerably in its composition across regions BA R Advanced industry production takes place principally in metropolitan areas. Altogether the country’s 100 largest metropolitan areas contain 70 percent of all U.S. jobs in the sector, and the country’s full list of 378 metropolitan areas together contain 91 percent of all jobs in advanced industries. Large metropolitan areas contain at least four out of five U.S. workers in EM 12 individual advanced industries, among them communications equipment manufacturing, data processing and hosting, and software publishing. Two advanced industries—audio and video equipment manufacturing and satellite telecommunications— are located exclusively in large metropolitan areas. Moreover, the advanced industries that are most concentrated in large metropolitan areas (typically services industries) also tend to be the fastest growing. Advanced industries that are over-represented in large metropolitan areas—those in which the share of industry employment in large metropolitan areas exceeds 67 percent, the economy-wide benchmark—created 2.5 T H E B R O O K I N GS I NSTITUTION | IV. FINDINGS 27 More than two-thirds of the 15 large metro areas with the highest advanced industry intensities can be found in the west or the Sun Belt Share in Services Share in Energy 30.0% 16.0% 15.5% 14.8% 14.0% 13.7% 13.4% 13.3% 12.8% 12.3% 12.1% 12.0% 11.7% 11.3% 11.1% 8.7% 291,700 295,000 46,800 279,400 297,200 503,500 26,600 338,900 361,000 176,300 106,300 25,100 64,400 26,500 71,600 12,284,000 46.1% 44.8% 84.6% 49.4% 23.2% 6.0% 62.5% 30.7% 38.3% 37.2% 35.0% 32.5% 26.6% 63.8% 40.7% 44.4% 53.8% 54.8% 12.8% 48.7% 76.4% 92.6% 36.4% 68.0% 42.3% 61.5% 62.6% 66.9% 72.2% 35.4% 56.0% 50.4% 0.1% 0.4% 2.5% 1.9% 0.4% 1.4% 1.1% 1.3% 19.4% 1.3% 2.4% 0.6% 1.2% 0.8% 3.4% 5.2% 20 3, .F EB . A. M 1 :0 San Jose-Sunnyvale-Santa Clara, CA Seattle-Tacoma-Bellevue, WA Wichita, KS Detroit-Warren-Dearborn, MI San Francisco-Oakland-Hayward, CA Washington-Arlington-Alexandria, DC-VA-MD-WV Palm Bay-Melbourne-Titusville, FL Boston-Cambridge-Newton, MA-NH Houston-The Woodlands-Sugar Land, TX San Diego-Carlsbad, CA Austin-Round Rock, TX Provo-Orem, UT Raleigh, NC Ogden-Clearfield, UT Salt Lake City, UT United States 15 Share in Manufacturing L 1 2 3 4 5 6 7 8 9 10 11 12 13 14 15 Metro Area Advanced Industry Employment (2013) 12 Rank (Intensity) Advanced Industry Share of Total Area Employment (Intensity) (2013) TI million jobs between 1980 and 2013, growing more than 40 percent. Meanwhile, employment in industries that are under- U N represented in large metropolitan areas such as metal ore mining and foundries declined by 2 million, or 35 percent. Jobs in advanced industries are not confined to only a small number of places, however. Every large metropolitan area AS E contains at least a few thousand of them. Not unexpectedly, the country’s largest metropolitan areas generally contain the largest number of advanced industry jobs. New York leads the nation with 630,000 workers in advanced industries, followed EL E by Los Angeles (513,000), Washington, D.C. (503,000), Chicago (405,000), Houston (361,000), and Boston (339,000). ● G BA R EM 28 ● ● ● O ED ● FO ● R R Advanced industries’ share of total employment varies significantly across major metropolitan areas ● ●● ●● ● ● ●● ● ● ●● ● ● ● ● ● ● ● ● ● ●●● ●● ●● ● ● ● ● ● ●●●● ● ● ●●● ● ● ● ● ● ● ● ● ● ● ● ●● ● ● ● ● ●● ● Advanced Industry ● ● ● ● Share of Total ● ● ● ● ● ● Employment ● ● ● ● by Quintile ● ● ● 1.9 to 5.9 percent ● ●● ● 5.9 to 7.7 percent ● ● ● 7.7 to 9.0 percent ● ● ● ● ●● ● 9.0 to 10.1 percent ● ●● 10.1 to 29.9 percent ● ● THE BROOKINGS INSTITUTION | AMERICA’S ADVANCED I N D U ST R I ES Relative to total metro area employment, however, San Jose, emerges as the nation’s leading hotspot for advanced industries, with 30 percent of its workforce employed in the sector. Seattle follows with 16.0 percent of its jobs in advanced industries. Wichita, KS (15.5 percent), Detroit (14.8 percent), and San Francisco (14.0 percent) follow that. Overall, advanced industries account for more than one in 10 jobs in nearly one-fourth of the country’s major metropolitan areas. The sector’s share of the workforce falls below 5 percent, or one in 20 workers, in 10 of the country’s 100 largest metropolitan 15 areas, however. At the far end of the spectrum, advanced industries employ only 3.9 percent of the workforce in Honolulu, HI. 20 The share in Las Vegas is 3.6 percent; Fresno, CA, 3.2 percent; Stockton, CA, 2.8 percent; and, finally, McAllen, TX, 2.0 percent. 3, To put this in perspective, a worker in San Jose is 15 times more likely to be in an advanced industry than a worker in McAllen. .F EB . SMALL AND MID-SIZED METROPOLITAN AREAS EXHIBIT THEIR OWN ADVANCED INDUSTRY STRENGTHS A A. M lthough advanced industries are highly concentrated in large metropolitan areas, 1.9 million advanced industries jobs (15 percent of the country’s total) can be found in the nation’s many small- and mid-sized metropolitan areas. 1 Those smaller metro areas with large advanced industry bases tend to fall into two categories: economies dominated :0 by manufacturing, on the one hand, and concentrated clusters of diverse advanced industry activity, on the other. The 12 former are typically in the Midwest while the latter tend to be near anchor institutions such as universities or laborato- L ries throughout the country. TI Among the mid-sized metropolitan areas specializing in advanced manufacturing, six stand out: Columbus, IN (where N advanced industries account for 29.9 percent of all jobs, many with Cummins), Elkhart, IN (where the sector supports U 27.3 percent of all employment), and Kokomo, IN (22.5 percent), as well as Midland, MI (15.6 percent; home to Dow Chemical), Peoria, IL (13.7 percent; home to Caterpillar), and Fond du Lac, WI (13.4 percent). These metropolitan areas the automotive industry supply chain. AS E are typically home to a few large enterprises in addition to numerous smaller, specialized manufacturers, often part of EL E The metropolitan areas with more diversified clusters tend to concentrate the dynamism and diversity of larger metropolitan hubs into compact metro areas. Places such as Huntsville, AL (21.5 percent of all jobs); Boulder, CO (21.3 percent); Durham, NC (15.7 percent); and Manchester, NH (13.0 percent) combine multiple specialties spanning both R manufacturing and services. In part because of spillovers, collaboration, and networks emanating from their research- R intensive anchor institutions, these clusters focus frequently on scientific pursuits. FO On the whole, however, advanced industries are sparser in small and mid-sized metropolitan areas. In the average large metropolitan area, 8.5 percent of jobs are in advanced industries. In the average smaller metropolitan area, by ED contrast, 6.9 percent of jobs are in advanced industries, and small metro areas generally exhibit less diversity in their G O advanced industrial bases than do large ones. BA R Advanced industries in U.S. metropolitan areas come in a variety of configurations. For most places with significant concentrations of activity, a key distinction is between those more oriented towards providing services and those more oriented towards producing goods.50 A handful of places have no significant strength in either, while a small minority of metropolitan EM areas combine great strength in both sectors. Of the country’s 100 largest metropolitan areas, 37 contain relatively large and manufacturing-oriented advanced industry bases. Among those maunfacturing-oriented metro areas, Grand Rapids, MI; Ogden, UT; Portland, OR; Toledo, OH; and Wichita, KS, are the five metropolitan areas most specialized in advanced manufacturing industries, employing between 6 and 13 percent of the entire workforce. In Wichita, the aerospace industry provides the bulk of advanced industry T H E B R O O K I N GS I NSTITUTION | IV. FINDINGS 29 employment. In Ogden, Toledo, and Grand Rapids, motor vehicle-related manufacturing dominates, while Portland specializes in semiconductors. The energy subsector is both smaller more concentrated. In no major metropolitan area does energy employment define the advanced industry base. However, seven metropolitan areas register a significant specialization in energy industries.51 Bakersfield, CA; Birmingham, AL; Oklahoma City; and Tulsa, OK, lead the way, joined by Syracuse, NY, and Columbia, SC, 20 15 which host large power generation facilities. Services, meanwhile, predominate in 19 major metropolitan areas. Boston; Provo, UT; Raleigh, NC; San Francisco, and 3, Washington, DC, have the highest shares of advanced services employment, ranging from 8 to 11 percent of total metropoli- .F EB . tan area jobs. In San Francisco, Washington, DC, and Boston, computer systems design, management consulting, and scientific research and development services lead. Computer systems design is also the largest industry in Raleigh and Provo, where software also makes a large contribution. A. M Finally, two groups of metropolitan areas have relatively balanced assortments of advanced industries. In 30 of the country’s largest 100 metropolitan areas, none of the three advanced industry subsectors employs an above average share of the workforce. In addition to places where the advanced industry base is thin, this group also includes places such as 1 Columbus, OH, and St. Louis, MO, that score just below the national average for advanced industry employment but lack 12 :0 any distinctive concentration. L At the same time, 14 major metropolitan areas combine disproportionate strength in both advanced manufacturing and TI advanced services. Among these balanced hubs of activity, San Jose; Detroit; Houston; Palm Bay, FL; and Seattle N house the largest overall concentrations of advanced industry employment. San Jose specializes in 17 different advanced AS E U industries—including five services—ranging from computer systems design and research and development to semiconductor ● EL E Each major metropolitan area has its own constellation of advanced industry activity but falls into one of four general types ◆ R R ■ FO ■ G O ◆ ▲◆ ●◆ ED ■ EM BA R ■ ■ ◆ ●■ ● ▲ ▲ ◆ ◆ ▲ ■ ●◆ ■ ◆ ■ ■ ● ◆ ● ● ◆ ◆ ◆■ ■ ●■ ■■ ▲ ▲▲ ◆■ ■ ▲ ▲ ▲◆◆▲ ■ ● ◆ ▲ ■ ■ ■ ◆ ■ ■ ■■■ ■ ■ ■■ ● ■ ◆ 30 ■ ▲ ◆ ◆ ▲ ▲ ◆ ● ▲■ ◆■ ▲ ▲ ■ ■ ■ ● Metro Area Typology ■ ◆ ◆ ◆● ▲◆ ◆ ◆◆ Manufacturing-Oriented Advanced Industry Base ▲ Services-Oriented Advanced Industry Base ● Diversified Advanced Industry Base ◆ Not Specialized in Either Advanced Industry Sub-Sector THE BROOKINGS INSTITUTION | AMERICA’S ADVANCED I N D U ST R I ES and computer equipment manufacturing.52 Aerospace manufacturing and software publishing together compose onehalf of Seattle’s advanced industry workforce. Detroit retains its automotive manufacturing prowess but also specializes in engineering services, which accounts for 21 percent of its advanced industry workforce. Computer systems design, management consulting, R&D services, and data processing, meanwhile, employ another one-fourth of Detroit’s advanced industry workforce. In Houston, employment in architecture and engineering services outweighs even the oil and gas industry, although the former often supplies the latter. Audio and video equipment manufacturing, semiconductor 20 15 manufacturing, computer systems design, and engineering services anchor Palm Bay’s diversified advanced industry base. 3, ADVNCED INDUSTRIES ARE UNEVENLY CONCENTRATED ACROSS STATES .F EB . A dvanced industry employment is ubiquitous but varies considerably in its density across U.S. states and regions. Not surprisingly, California, Texas, and New York had the largest number of advanced industry jobs in 2013, followed by Illinois and Michigan. Together these five states encompassed 35 percent of all advanced industry A. M jobs in the United States, with both California and Texas containing more than one million each. By region, the South leads with 4.3 million positions, followed by 3.0 million in the West, and 2.9 and 2.1 million respectively in the Midwest and the Northeast. 1 In Michigan, advanced industries accounted for 11.8 percent of all state jobs in 2013, more than anywhere else. The :0 sector employed at least 10 percent of the workforce in six other states: California, Indiana, Massachusetts, Utah, 12 Virginia, and Washington. At the other end of the spectrum, advanced industries accounted for fewer than 6 percent of L all jobs in nine states, with the lowest shares in Hawaii, Maine, Montana, and Nevada. TI Michigan’s advanced industry base is highly specialized in automotive-related manufacturing. Washington, for its N part, is highly specialized in aerospace products and parts manufacturing and software publishing, while Massachusetts AS E U specializes in scientific R&D services and navigation, precision, and analytic instrument manufacturing. EM BA R G O ED FO R R EL E Dense concentrations of advanced industry activity can be found in every region of the country Share of State Employment in Advanced Industries 5.1 to 6.3 percent 6.3 to 7.8 percent 7.8 to 8.3 percent 8.3 to 9.6 percent 9.6 to 11.8 percent T H E B R O O K I N GS I NSTITUTION | IV. FINDINGS 31 Across the country, the geography of advanced industries—notwithstanding its broad-ranging diversity—has narrowed from what was once a more widely spread enterprise of regional prosperity. In 1980, 59 of the country’s 100 largest metropolitan areas had at least 10 percent of their workforce in advanced industries. By 2013, only 23 major metropolitan areas contained such sizable concentrations of advanced industry activity. As a result, the U.S. economy is more reliant on a smaller number of advanced industry clusters today than at any point in recent history. 15 This erosion is a story of both absolute and relative (compared to other sectors) decline in advanced industry employment. 20 From 1980 to 2013, total advanced industry employment fell in 164 of the country’s 381 metropolitan areas. The other metro- 3, politan areas saw stable or growing—in some cases significantly—employment in advanced industries. .F EB . Among large metropolitan areas, 39 added 10,000 or more advanced industry jobs from 1980 to 2013. Washington, DC, experienced the largest increase, gaining 353,000 advanced industry jobs, on net, over the period, followed by San Francisco, Seattle, Atlanta, and Houston. In percentage terms, the fastest growth occurred in Austin; Boise, ID; Provo, UT; Las Vegas; and A. M Cape Coral, FL, with each seeing the number of advanced industry workers at least triple, albeit in some cases from low bases. Conversely, 24 major metropolitan areas lost 10,000 or more advanced industry jobs, with the largest absolute losses occurring in Los Angeles, New York, Chicago, Cleveland, and Rochester, NY. In percentage terms, Youngstown, OH; Springfield, MA; :0 1 Rochester, NY; Scranton, PA; and Providence, RI, saw the sharpest declines. 12 Metropolitan areas with increasing employment in advanced industries between 1980 and 2013 share a number of character- L istics. Faster growing areas were more likely to be in the South or West. In 1980, they tended to have higher rates of bach- TI elor’s degree attainment in the population, more patents developed by local inventors, and a larger number of leading uni- N versity research programs in the sciences. These factors may in part explain the large geographic shifts in advanced industry U employment during the study period, though this analysis cannot identify whether any of these variables were causes of AS E growing advanced industry employment concentrations or mere correlations. FO R R EL E The United States is losing ground to other countries in advanced industry competitiveness and now runs a large trade deficit even in some advanced services Among the 14 countries with comparable employment and production data in 2010, the most recent year available from ED the OECD, the United States had the second-most productive advanced industries sector in the world, behind only energyintensive Norway. The average American advanced industry worker was about 2.5 times more productive than workers in G O Hungary and between 50 and 70 percent more productive than advanced industry workers in Italy, Sweden, and Germany. BA R This American productivity advantage appears to be holding up rather well. Among these 14 countries, only three saw faster growth in GDP per worker than the United States: the Czech Republic, Hungary, and Sweden.54 EM Despite this strength, however, the United States is losing ground on two other important measures of advanced industry competiveness: the size of the sector by employment and its output as a share of the total U.S. economy. These measures show the U.S. economy pivoting away from advanced industry pursuits more sharply than competitor nations. The United States saw the share of its jobs in advanced industries decline from 2000 to 2010 by more than any of the other 14 countries. To be sure, advanced industry employment fell in several other countries, but the declines were much more 32 THE BROOKINGS INSTITUTION | AMERICA’S ADVANCED I N D U ST R I ES 6.0% $200,000 20 5.0% 15 8.0% Annualized Growth in Advanced Industries GDP per Worker (2000–2010) $250,000 3, 4.0% $150,000 .F EB . 3.0% 2.0% $100,000 1.0% 0.0% A. M ia y en ec h Sl ov ng Hu pu 1 bl ar :0 Re nm -2.0% ar ic k d an nl De Ge Fi rm an y ce an en Fr Sw Au -1.0% U Cz 12 ni Ne th er ed ria Ita st ly s nd la lg iu es te d Be St at rw ay $ m $50,000 No Advanced Industries GDP per Worker (2010) The U.S. advanced industries sector sustains fast productivity growth even with output per worker that is already well above average Growth in GDP per Worker N TI L GDP per Worker 1.0% R 20% R 0.5% 0.0% FO 15% -0.5% ED 10% -1.0% O -1.5% 5% BA R -2.5% m lg iu Be rw ay ce No an Fr th er la nd s at es St ria st k U Ne ec ni t ed Au nm ar ly De Ita d en an nl Fi Sw ed y Hu ng ar y rm an Ge ia en ov Sl h Re pu bl ic 0% Cz EM -2.0% Change in Advanced Industries' Share of Total Employment (2000-2010) AS E 1.5% EL E 25% G Advanced Industries' Share of Total Employment (2010) U U.S. employment in advanced industries is low by international standards and falling rapidly Share of Employment T H E B R O O K I N GS I NSTITUTION | IV. FINDINGS Change in Share of Employment 33 modest than the 2.2 percentage point loss in the United States. Austria, Germany, Norway, Finland, and Italy, for example, saw the share of total employment in advanced industries fall by less than 1 percentage point during the 2000s. Advanced industry employment shares increased in lower-income OECD countries such as Slovenia, the Czech Republic, and Hungary. By 2010, nine of the 14 countries were more specialized in advanced industries than the United States. Output trends depict a similar slippage. Because of increasing productivity, the share of U.S. GDP in advanced industries 15 did not fall as quickly as employment from 2000 to 2010, according to OECD data, which define the sector more broadly. 20 Nonetheless, the contribution of advanced industries to U.S. GDP declined by 2 percentage points, putting the United States in the middle of the 15 countries for which output data are available. Advanced industries in Austria, Germany, Finland, 3, Sweden, and the Czech Republic all generated a larger share of their countries’ GDP in 2010 than in 2000. Overall, the 2010 .F EB . data suggest that the United States derives a smaller share of its national output from advanced industries than six of the 15 OECD countries, including South Korea, Germany, and Sweden. This gradual erosion of U.S. competitiveness is playing out starkly in terms of global trade, where advanced industries are A. M crucial. Advanced industries export $1.1 trillion worth of goods and services and account for 59 percent of total U.S. exports. However, the United States ran a $632 billion trade deficit in advanced industries in 2012, in line with typical yearly balances since 1999. Most of that deficit can be attributed to goods. The United States imports roughly $1.6 trillion in advanced indus- 1 try products but exports just $0.9 trillion. The United States does carry a comparatively small but positive trade balance in 12 :0 advanced services, exporting $230 billion and importing $131 billion worth. L To be sure, the United States exports more than it imports in a number of individual advanced industries. Royalties provide TI a net $84 billion to the trade balance, for example, and advanced industries all together account for some two-thirds of U.S. N export earnings from intellectual property.56 Other major net exporters include aerospace manufacturing, which runs a $61 AS E U billion trade surplus; resin and synthetic rubber and fiber manufacturing, with a $21 billion surplus; and agriculture and other EM -$160,000 Oil and gas Motor vehicles Computer eqpmnt. Communications eqpmnt. Motor vehicle parts Pharmaceuticals Semiconductors Audio and video eqpmnt. Appliances Iron and steel Electrical eqpmnt. Electric lighting Computer services Other electrical components Analytic instruments Aluminum Commercial machinery Medical eqpmnt. Pesticides General purpose machinery Other transportation eqpmnt. Software Basic chemicals Railroad stock Industrial machines Ship building R FO Telecom Other chemicals ED Engines and turbines -$110,000 Agriculture and other machinery O Aerospace G -$60,000 -$210,000 3 4 Resin and rubber -$10,000 Royalties $40,000 BA R Trade Surplus/Deficit (millions) (2012) $90,000 R&D services R EL E With few exceptions, the United States runs a significant trade deficit in advanced industries Manufacturing Energy Services THE BROOKINGS INSTITUTION | AMERICA’S ADVANCED I N D U ST R I ES ADVANCED INDUSTRY TRADE DEFICITS HAVE IMPORTANT IMPLICATIONS FOR THE U.S. ECONOMY M any questions and debates surround the origins and significance of the trade deficit nationally, but it is easier to parse the meaning of deficits within individual advanced industries. Deficits can symbolize lagging competi- 15 tiveness or they can stem from the distortionary economic policies of competing nations. 20 With respect to competitiveness, trade deficits can result when foreign countries are simply better at producing the products consumers want at the prices they are willing to pay, on the one hand, or they may indicate that other coun- 3, tries offer companies more profitable locations for production, on the other. As such, trade deficits in advanced indus- .F EB . tries can point to two serious shortfalls, lagging innovation and lagging cost-competitiveness, each of which public policy can help ameliorate. Trade deficits can and do also result from foreign government policies and practices that unfairly distort trade and which often disproportionately impact advanced industries. Among the blunter options, countries can manipulate the A. M value of their currencies to make their exports cheaper while raising the cost of competing imports. More targeted mercantilist policies include the covert theft of intellectual property as well as compulsory technology sharing requirements. Export subsidies, state-backed financing, divergent technical standards, and other difficult-to-measure nontariff barriers 1 further distort trade, especially in high-stakes advanced industries. All call for robust enforcement to be a pillar of U.S. :0 trade policy and international economic strategy. 12 Regardless of their origins, advanced industry trade deficits pose a serious threat to the country’s long-term prosper- L ity. Because most innovation builds on existing technologies and is evolutionary in nature, the concentration of advanced TI industrial activity and know-how outside of the United States puts the nation’s ability to own the next-generation of criti- N cal technologies into question. Reducing the trade deficit in advanced industries is essential to slow the erosion of U.S. U innovative capacity. Once competitiveness fundamentals are addressed and the rules of fair play in the international trading system AS E enforced, advanced industries should themselves hold the key to balancing trade. Because the sector aligns closely with the United States’ natural comparative advantage in high-skilled and capital-intensive industries, the sector represents EL E the economy’s best chance to increase exports and attract new investment into productive capital. FO R R Sources: Martin Baily and Barry Bosworth, “U.S Manufacturing: Understanding Its Past and Its Potential Future” (Washington: Brookings Institution, 2014); Robert Atkinson, “Understanding and Maximizing America’s Evolutionary Economy” (Washington: Information Technology and Innovation Foundation, 2014); G. Hatsopolous and others, “U.S. Competitiveness: Beyond the Trade Deficit,” Science 15 (1988); Michelle Wein and others, “The Global Mercantilist Index” (Washington: Information Technology and Innovation Foundation, 2014). ED machinery manufacturing, with a $12 billion surplus. Management consulting and architecture and engineering services generate the largest trade surpluses among advanced services industries. Software exports, for their part, are growing quickly G O but net only $479 million. BA R The earnings from these trade surpluses, however, are dwarfed by the deficits in other parts of the advanced industries sector. Not surprisingly, oil and gas extraction has the largest trade deficit, which stood at $205 billion in 2012 but has been declining steadily since 2011 thanks to increased domestic production. Perhaps more disconcerting are the trade deficits in EM such areas of purported strength as communications equipment, computer equipment, motor vehicles, and pharmaceuticals. Various trade barriers and currency manipulations surely play a role, but in any event the United States contends with trade deficits between $30 billion and $100 billion annually in nine key advanced industries.57 Nor can these deficits be entirely explained by trade barriers or cross-country differences in the cost of production alone. In addition to the deficits with relatively inexpensive, mercantilist locales such as China, U.S. advanced industry trades at a deficit with such open, high-cost countries as Austria, Canada, Denmark, Finland, France, Germany, Ireland, Italy, Japan, Sweden, Switzerland, and the United Kingdom. T H E B R O O K I N GS I NSTITUTION | IV. FINDINGS 35 As discomfiting as the trade deficit in advanced industry goods may be, the United States also runs a trade deficit in several very high value service industries where it is supposed to dominate. The United States imports $8 billion more in computer design services than it exports, and $2 billion more in scientific research and development services. Moreover, U.S. royalty payments to foreign intellectual property owners are growing faster than foreign payments to U.S. owners, suggesting that 20 In sum, productivity, output, and trade data suggest that U.S. competitiveness in advanced industries is under threat. 15 even that advantage may be eroding. .F EB . 3, Advanced industries are the focal point of innovative activities such as R&D and patenting, but the U.S. advantage on these fronts is slipping A. M Innovation is the fundamental driver of economic growth, and advanced industries represent the very core of the nation’s innovation enterprise. Advanced industries perform 90 percent of all private-sector R&D conducted in the United States. Advanced industries also dominate U.S. patenting, frequently the novel results from that R&D spending.58 From 2007 to 1 2012, companies in advanced industries developed approximately 82 percent of all U.S. patents. Moreover, since the 1970s, :0 the percentage of patents in technology classes associated with advanced industries has increased as a share of all patents. L 12 Patenting in advanced-industry-intensive classes now accounts for 85 percent of all U.S. patents, up from 76 percent in 1975. TI Patents in software technologies, in particular, have grown extraordinarily.59 In the 1970s, software technology was confined N to a small number of federally supported R&D centers, and computer programmers were essentially research scientists. That U changed in subsequent decades with the increasing penetration of personal computers and the software required to run AS E them. By 2012, software accounted for nearly one-fifth of all patents granted by the U.S. Patent and Trademark Office.60 R EL E Advanced industries have been responsible for an explosion in patenting during the past two decades FO Advanced Industry-Intensive Technology Classes ED 200,000 G O 150,000 100,000 EM BA R Patents Granted by the U.S. Patent and Trademark Office R 250,000 36 Other Technology Classes 50,000 0 1975 1978 1981 1984 1987 1990 1993 1996 1999 2002 2005 2008 2011 THE BROOKINGS INSTITUTION | AMERICA’S ADVANCED I N D U ST R I ES The explosion in innovation among advanced industries in recent decades and the continuing convergence of the physical and the digital realms have had profound effects on consumers and businesses. Prices of advanced industry goods and services have each fallen relative to prices of other products since 2004, as the prices of advanced industry goods increased 16 percentage points slower than other goods, and the prices of advanced industry services increased 26 percentage points slower than other services.61 In fact, many advanced industry products were cheaper in 2013 than in 2004 for the same (or .F EB . 3, Prices of advanced industry goods and services have fallen relative to the products of other sectors 20 15 better) level of quality, a decisive testimonial to the relentless pace of technological progress in the sector.62 Other Manufacturing Advanced Industry Manufacturing A. M 1.25 Other Services Advanced Industry Services 12 :0 1 1.00 0.50 2005 2006 2007 2008 2009 2010 2011 2012 2013 EL E AS E 2004 N TI L 0.75 U Producer Price Index (2004=1) 1.50 Despite the sector’s recent achievements, however, the United States is losing ground to other countries on measures of R innovation performance and capacity. R The U.S. share of global patenting and R&D is falling much faster than its share of global GDP and population, meaning that FO U.S. slippage cannot be attributed to simply demography or macroeconomic convergence. From 1981 to 2011—the most recent year of available data—the U.S. share of world GDP fell 7 percentage points, even as it lost only 1 percentage point in its share ED of world population.63 That fact represents strong progress in once desperately poor countries. More surprising, however, is O the fact that the United States lost 12 percentage points in its share of global patenting and R&D spending. G Coincident with this trend, U.S. R&D imports have grown 18 percent annually from 2000 to 2012, twice as fast as its R&D BA R export growth. The United States imports R&D services from many countries, including China and India, but most of the value—57 percent—comes from Europe. Ireland, which offers generous tax incentives for R&D, accounts for 17 percent of U.S. imports of R&D services, some of which comes from the subsidiaries of U.S.-owned companies. Germany, the Netherlands, EM Switzerland, the United Kingdom, and Japan are all high-cost countries with which the United States also runs a trade deficit in R&D services. The trend is clear: other countries are becoming relatively more attractive locations to conduct R&D. T H E B R O O K I N GS I NSTITUTION | IV. FINDINGS 37 What is more, even as non-U.S. workers develop an increasing share of patented technologies, the United States ranks well below several other rich and middle-income countries in patents per worker. On two different measures of patents per worker that give weight to patent quality, the United States ranks seventh and tenth among its peers. Denmark, Germany, Finland, Japan, the Netherlands, Sweden, and Switzerland all outperform the United States on both measures. These patenting outcomes are all the more surprising given that the United States ranks second on R&D expenditures per worker, 20 15 behind only Finland. Commentators on U.S. competitiveness, meanwhile, often take comfort in the strength of U.S. research universities.65 And 3, it’s true that the most compelling measures of university research strength do point to the preeminence of individual U.S. .F EB . research institutions.66 Yet, the United States is a big country, and it no longer looks as dominant in research after adjusting for the size of its working-age population. Per capita, Switzerland is the global leader in highly cited scientific publications, and eight other countries globally outperform the United States.67 The prolific output of country’s top universities masks A. M thinness lower in the ranks. What is more, on certain key metrics only a handful of U.S. metropolitan areas rank among the world’s most innovative regions. In terms of patent cooperation treaty applications per capita, for example, the vast majority of U.S. metropolitan areas fall well 1 below their counterparts in Western Europe and Asia.68 Among the nation’s most patent-intensive regions, just two—San Diego :0 and the San Jose–San Francisco combined area—rank in the global top 20, and just two more score in the top 50 (Boston and 12 Rochester, NY). In fact, Germany, Switzerland, and Japan each have more metropolitan areas in the global top 50 than the L United States. To put this in perspective, the average resident of Stockholm, a top 20 area, is over three times more likely to file TI a patent application than the average resident of the New York City metropolitan area, four times more likely than the average U N resident of Pittsburgh, and over five times more likely than the average resident of Phoenix. In summary, advanced industries are the prime site of U.S. innovation, but their global dominance is undercut by the nation’s AS E slippage on crucial metrics of innovative capacity and output. R 1,200 ED 300 1,000 O 250 800 G 200 600 400 50 200 0 38 Slovak Republic Chile China South Africa Poland Greece Portugal Czech Republic Estonia Slovenia Russian Federation PCT Applications Spain Hungary Taiwan New Zealand Iceland Australia Italy Canada Triadic Patents* Singapore Ireland Norway Luxembourg United Kingdom Austria Belgium Korea France Israel Denmark United States Netherlands Germany Finland Sweden Japan 0 Switzerland EM 100 Patent Cooperation Treaty Applications per Million Workers (2010–2012) 1,400 FO 350 150 1,600 R 400 BA R Triadic Patents per Million Workers (2010–2012) EL E The United States trails many of its key competitors on patent awards and applications per capita THE BROOKINGS INSTITUTION | AMERICA’S ADVANCED I N D U ST R I ES Eighteen of the world’s 20 most patent-intensive regions are outside the United States Patent Cooperation Treaty Applications per Million Residents 726 724 665 647 603 597 567 566 560 558 543 524 503 500 490 488 483 460 436 431 12 :0 1 A. M .F EB . 3, 20 15 Country Switzerland Germany United States Japan Germany Finland Germany Korea Germany United Kingdom United States Netherlands Finland Germany Sweden Switzerland Sweden Austria Japan Sweden L Region Basel-Stadt East Württemberg San Diego-Carlsbad-San Marcos, CA Tokyo Stuttgart Pirkanmaa Nuremberg Daejeon Regensburg Cambridgeshire San Jose-San Francisco-Oakland, CA North Brabant Uusimaa Munich Stockholm Vaud Uppsala Rhine Valley-Lake Constance Ibaraki Vastmanland U N TI Source: Brookings analysis of OECD statistics at territorial level 3 aggregations, roughly corresponding to metropolitan regions EL E AS E Jobs in advanced industries are available at all levels of education, but the education and training pipeline that channels workers into the sector is narrow R By definition, an outsized share of workers in advanced industries are in STEM occupations. Just over half, or 53 percent, R of all advanced industry employees work in occupations that demand extraordinary STEM knowledge in one or more fields. FO That compares with 17 percent outside the sector. ED The occupations over-represented in advanced industries fall into five groups: architecture and engineering; computer and mathematical science; life, physical, and social science; production; and business and financial operations. The average O U.S. worker in these groups is two to eight times more likely to be employed in an advanced industry than in other indus- G tries. Advanced industries employ 79 percent of all U.S. architecture and engineering workers, for example, and more than BA R one-half of all workers in computer and mathematical occupations and life, physical, and social science occupations in the economy. In this sense, advanced industries are a critical storehouse of the nation’s STEM knowledge base. EM In general, advanced industry workers have attained substantially higher levels of education than those in other industries. Forty-four percent hold at least a bachelor’s degree, compared with 32 percent of workers outside the sector. Individuals with a Ph.D. are 1.8 times more likely to work in an advanced industry than not, even though the education industry itself falls outside the sector. Those with a master’s degree are 1.6 times as likely to work in an advanced industry. T H E B R O O K I N GS I NSTITUTION | IV. FINDINGS 39 The advanced industries sector employs more than one-half of the country’s science, engineering, computer, and mathematics workforce Share of Advanced Industry Workers 79% 58% 54% 33% 21% 19% 10% 9% 8% 4% 13.1% 14.8% 3.9% 21.2% 9.0% 8.6% 1.4% 3.4% 12.2% 1.5% 3, 20 15 Advanced Industry Share of U.S. Total .F EB . Occupational Category Architecture and Engineering Occupations Computer and Mathematical Occupations Life, Physical, and Social Science Occupations Production Occupations Business and Financial Operations Occupations Management Occupations Arts, Design, Entertainment, Sports, and Media Occupations Installation, Maintenance, and Repair Occupations Office and Administrative Support Occupations Construction and Extraction Occupations A. M Source: Brookings analysis of OECD statistics at territorial level 3 aggregations, roughly corresponding to metropolitan regions 1 That said, the majority of advanced industry workers do not hold a bachelor’s degree. Nine percent of advanced industry :0 workers have an associate’s degree, but another 47 percent possess no college degree at all. That group includes the 12 21 percent of advanced industry workers who have attended some college and perhaps obtained a certification but hold L no degree. Advanced industry jobs are available at all education levels and hold out significant opportunity to lower- and N TI middle-skill Americans. AS E U Declining employment in advanced industries has come at the expense of the least, but not the middle, skilled EL E R 75 With a Bachelor's Degree or Higher FO R With a High School Diploma or Less G 25 O ED 50 With Some College or an Associate's Degree EM BA R Percent of Advanced Industry Workforce 100 40 0 1968 1973 1978 1983 1988 1993 1998 2003 2008 2013 THE BROOKINGS INSTITUTION | AMERICA’S ADVANCED I N D U ST R I ES Thanks to globalization and steady technological change, however, the education requirements of the advanced industries sector are rising, creating a significant skills challenge. In 1968, the first year for which data are available, 76 percent of advanced industry workers had never attended college. As late as 1980 that share stood at 63 percent. Since then, however, that share has plummeted to around 25 percent, which represents a loss of 4.5 million quality jobs for workers with a high school diploma or less. Since 1980, however, the number of advanced industry jobs for those with some college but less than a bachelor’s degree has expanded by 1.3 million, although their share of the sector’s workforce has plateaued since 1993. 15 The sectors’ steady upskilling, then, has come at the expense of those with the least education but rewarded those with both 20 moderate and high amounts. Overall, the sector continues to offer considerable opportunity to those with even a modicum of 3, postsecondary training in STEM fields. .F EB . IS THERE A SKILLS GAP? T his report contends that the demand for STEM skills in the United States exceeds the supply, particularly in A. M key areas such as computer science and engineering. Although this position is widely accepted, it still sparks disagreement. First, some macroeconomists question whether a “skills gap” has in fact slowed the economy’s recovery from the 1 Great Recession. However, this is not the claim here. As in typical recessions, the demand for labor fell, and as it did, job :0 vacancies became much easier to fill. Thus, poor macroeconomic performance largely coincided with an easing of the 12 STEM shortage. Since then, demand has recovered and the skills shortage has worsened. L Others skeptics point to the limited number of job openings with stable funding for academic scientists at research TI universities or that most production occupations at manufacturing companies are readily filled and do not require high N levels of skill. These points have merit, but they overlook the high demand for STEM skills in the much larger private U sector, in the first case, and for skilled blue-collar and professional STEM occupations, in the second case, particularly in advanced industries. AS E As it happens, there is a deeper element to the skills gap that is not directly affected by macroeconomic cycles nor limited to a segment of the labor market. In 2013, people working in STEM occupations earned 42 percent more than EL E those in other occupations, controlling for education, experience, and sex. This premium was just 19 percent in 1980, suggesting that growth in the demand for STEM skills has outpaced growth in the supply over the long run. Against this historic context, recent evidence points in the same direction: STEM vacancies take longer for employers to fill, real R and relative wages have been growing, and unemployment rates are low. These skills gap signals are clearest for STEM R professionals (such as computer workers, health care professionals, engineers, and scientists), but slightly less severe FO for skilled blue-collar STEM jobs (such as repair technicians, plumbers, machine programmers), and not at all evident for ED less skilled blue-collar jobs. BA R G O Sources: Jonathan Rothwell, “Education, Job Openings, and Unemployment in Metropolitan America” (Washington: Brookings Institution, 2012); Michael Teitelbaum, Falling Behind? Boom, Bust, and the Global Race for Scientific Talent (Princeton: Princeton University Press, 2014); Paul Osterman and Andrew Weaver, “Why Claims of Skill Shortages in Manufacturing are Overblown.” Issue brief no. 376 (Washington: Economic Policy Institute, 2014) Despite these trends, many advanced industry employers report difficulties finding qualified workers, which places a drag on EM advanced industry competitiveness. A key factor in these difficulties appears to be the sector’s heavy reliance on relatively scarce STEM skills. Sixty percent of all job postings in advanced industries are for STEM workers, compared with 34 percent outside of advanced industries.69 In any event, the typical posting for an advanced industry STEM vacancy remains online for an average of 43 days compared with 32 days for a non–STEM advanced industry ad. In the economy overall, ads are posted for an average of 35 days—a T H E B R O O K I N GS I NSTITUTION | IV. FINDINGS 41 Difficulties filling critical positions in advanced industries act as a brake on economic growth 20 3, .F EB . 46 45 44 36 37 27 39 37 33 32 15 Average Duration in Days of Job Postings in Advanced Industry Companies Difficult-to-fill Positions Computer and Mathematical Occupations Management Occupations Architecture and Engineering Occupations Business and Financial Operations Occupations Sales and Related Occupations Office and Administrative Support Occupations Life, Physical, and Social Science Occupations Installation, Maintenance, and Repair Occupations Production Occupations Healthcare Practitioners and Technical Occupations A. M Source: Brookings analysis of Burning Glass data 1 timespan driven up by continuously advertised positions in low-skilled and high-turnover jobs. Among advanced industry :0 vacancies unfilled for at least 60 days, computer and mathematic positions are the hardest to fill. These jobs include soft- 12 ware developers and computer systems analysts. Across the United States, 17,000 computer-related ads posted in the first L quarter of 2013 lingered for at least 60 days on company websites, signaling if not a structural shortfall in supply relative to N TI demand, then a serious matching problem. U A number of other positions outside of computer occupations also go unfilled for long periods in advanced industries. These positions include architecture and engineering jobs, whose postings in advanced industries last for 47 days, on average. AS E Advanced industry managerial positions are open for 43 days, on average. Job openings for installation, maintenance, and repair workers in advanced industries last 41 days, on average, and 47 days for ones that demand high levels of STEM EL E knowledge. These vacancy data, at any rate, suggest that many advanced industry companies are having difficulty finding workers with R the needed STEM skills, a problem that undercuts U.S. competiveness as a location for advanced industry production. At the R problem’s core lies the fact that the U.S. education system does not graduate enough college students in STEM fields, nor FO does it adequately prepare children to attain fluency in mathematical and scientific concepts. U.S. youths and adults alike perform much more poorly on OECD exams of math and science competencies than many of their peers in developed coun- ED tries.70 Moreover, even students in the top 10 percent of U.S. performers score well below their highest-scoring peers in other O developed countries. G This subpar academic performance in middle school and adulthood corresponds with low STEM graduation rates at the BA R postsecondary level. Measured in two ways—annual STEM graduates per capita and the share of total graduates completing degrees in STEM fields—the United States lags far behind other developed countries.71 In terms of annual STEM graduates per person aged 20 to 34, the United States ranks 23rd among developed nations.72 No fewer than eight countries—Finland, EM Korea, the Slovak Republic, the United Kingdom, New Zealand, Germany, Portugal, and Poland—graduate STEM students at a rate at least 50 percent higher than United States. Similarly, the United States ranks a distant 32nd in terms of the percentage of its graduates majoring in STEM fields, with just 13 percent of graduates choosing majors in science, computer science, or engineering. In Korea and Germany, 27 percent of college graduates choose these fields, and in countries as diverse as Greece, Mexico, and France, at least 20 percent of all graduates leave university with a STEM degree. Increasingly, the United States lacks the skills base to sustain advanced industry competitiveness. 42 THE BROOKINGS INSTITUTION | AMERICA’S ADVANCED I N D U ST R I ES 1.0% 25% 20 15 30% 20% 3, 0.8% 10% 5% 0% Chile Turkey Mexico Hungary Slovenia Greece Belgium 1 Estonia Spain Norway 15% L 12 :0 United States Italy Canada Israel Japan Switzerland Austria Denmark France Ireland Sweden Russian Federation Iceland Czech Republic Australia Poland Portugal Germany New Zealand United Kingdom Korea Slovak Republic 0.2% A. M 0.4% Netherlands .F EB . 0.6% 0.0% Share of Graduates in STEM Fields (2011) 1.2% Finland STEM College Graduates as Share of the Adult Population Aged 20-34 (2011) The United States lags behind most competitors and peers in graduating a STEM workforce Share of College Graduates in STEM Fields AS E U N TI STEM College Graduates as Share of Population Aged 20-34 R EL E Only 15 large U.S. metropolitan areas are home to more STEM graduates as a share of the young adult population than Finland, the global leader EM BA R G O ED FO R Metro Area Madison, WI Albany-Schenectady-Troy, NY Springfield, MA Rochester, NY Raleigh, NC Syracuse, NY Provo-Orem, UT Pittsburgh, PA Boston-Cambridge-Newton, MA-NH Greenville-Anderson-Mauldin, SC San Jose-Sunnyvale-Santa Clara, CA Worcester, MA-CT Dayton, OH Akron, OH Hartford-West Hartford-East Hartford, CT Finland Average U.S. Average STEM Share of Total Graduates 26% 18% 15% 24% 36% 18% 19% 21% 15% 23% 29% 22% 23% 14% 17% 22% 15% STEM Graduates per Person Aged 20-24 2.5% 1.9% 1.8% 1.7% 1.6% 1.6% 1.5% 1.3% 1.3% 1.2% 1.2% 1.2% 1.2% 1.2% 1.1% 1.1% 0.7% Source: Brookings analysis of Burning Glass data T H E B R O O K I N GS I NSTITUTION | IV. FINDINGS 43 Complicating the sector’s human capital challenges are sharp regional variations in the availability of skills. These variations underscore that the nation does not possess a single national labor market but instead hundreds of local ones. In this regard, the regional underpinnings of advanced industry competitiveness are characterized by stark contrasts. For example, at the high end of the distribution, certain U.S. metropolitan areas have amassed critical STEM skills at a rate consistent with international leaders. For instance, the number of STEM graduates as a share of the youth population (aged 15 20 to 34) exceeds the top international mark set by Finland in 15 of the largest 100 U.S. metropolitan areas by population. 20 These “skills poles” include some of the most successful of the nation’s advanced industry hubs, including Boston, San Jose, Raleigh, and Provo. Indeed, a strong correlation exists between STEM graduation rates and the share of total metropolitan 3, employment in advanced industries. At the other end of the spectrum, 33 large U.S. metropolitan areas have STEM gradua- .F EB . tion rates that trail Spain’s (which ranks 24th). These lagging metropolitan areas include prominent places such as Phoenix, Las Vegas, Miami, Dallas, Detroit, Houston, and Kansas City. This variation in the availability of human capital across regions creates a serious drag on the ability of many metropolitan areas to support advanced industries. A. M *** Together, these findings confirm both the importance of the advanced industries sector to American vitality and the sector’s considerable strength. At the same time, the findings suggest that the sector’s global competitiveness may be slipping. 1 Together, these conclusions point to the need for the nation, its firms, and its regions to recommit to innovation, strengthen EL E AS E U N TI L 12 :0 STEM education and workforce training, and deepen the nation’s regional advanced industry clusters. n R “The U.S. economy is more reliant on a smaller number FO R of advanced industry clusters today than at any point in EM BA R G O ED recent history.” 4 4 THE BROOKINGS INSTITUTION | AMERICA’S ADVANCED I N D U ST R I ES W H AT 15 WHERE WHY .F EB . 3, 20 V. I M P L I C A T I O N S : S T R A T E G I E S FOR PROMOTING U.S. A D VA N C E D I N D U S T R I E S A. M I 1 n describing the contours of the U.S. advanced industries sector, this report 12 :0 points to significant opportunity—but also challenges. On the positive side, L the analysis demonstrates that the combination of intensive technology N TI investment and highly skilled STEM workers in the advanced industries sector AS E U represents a potent source of U.S. prosperity. Advanced industries power the national economy, and their success is a prerequisite for building an opportunity EL E economy in the United States. R Moreover, the report identifies a distinct advanced industry geography, with varied combinations of industries clustering in R various regions to avail themselves of key innovation infrastructure, skilled workers, and supplier networks. In this respect, FO America’s advanced industries are not national. They are local, and in metropolitan areas such as Austin, Boston, San Diego, ED Seattle, and Silicon Valley, they are world-class hubs of prosperity. O With that said, too many U.S. advanced industries and local advanced industry clusters are ceding global leadership. G The deterioration of the nation’s balance of trade in advanced technology products during the last decade raises sobering BA R questions about the long-term vitality of the sector in this country. Likewise, too few regional advanced industry ecosystems now retain the technology inputs, labor pools, and supplier density to generate the synergies that drive global competitiveness. Making matters worse, the gridlock in Washington continues to preclude national action to strengthen the nation’s EM advanced industries. All of which means private- and public-sector leaders—particularly those working in America’s states and regions—need to engage. Already, numerous state and regional partnerships are working to expand America’s advanced industries, often by attending to the fundamental needs to ensure these industries’ long-term growth. T H E B R O O K I N GS I NSTITUTION | V. IMPLICATIONS: STRATEGIES FOR PROMOTING U.S. ADVANCED INDUSTRIES 45 Yet more can and should be done. Specifically, the nation’s private and public sectors should together: ●● COMMIT TO INNOVATION. Competitiveness will increasingly depend on the development and diffusion of gamechanging innovations. With “disruption” in the air, firms and policymakers need to redouble efforts to reignite innovation in the sector R ECHARGE THE STEM TALENT PIPELINE. Technological change has thrown the recruitment of appropri- 15 ●● 20 ately trained high- and middle-skilled STEM workers into flux. Companies and policymakers will need to collaborate to E MBRACE THE ECOSYSTEM. Loaded with knowledge-spillovers, supply-chain assets, partnership opportunities, .F EB . ●● 3, train the right workers in the right numbers and key institutions and forums, regions are critical platforms for advanced industry competitiveness. Firms and policymakers should work together to strengthen regional industry clusters and optimize connections across the platform A. M *** Of course, a wide variety of strategies reaching beyond those focused on innovation, skills, and industry ecosystems will be 1 necessary to defend and extend advanced industries’ competitiveness in the coming decade. :0 Companies will need to engage in broad “future-proofing.” Given that the advanced industries sector is essentially defined 12 by disruptive technology trends, business-as-usual will be less and less tenable. Therefore, firms in the sector will need to L constantly rethink what they do and how they do it.73 Companies will need to harness new digital formats ranging from TI cloud computing, “Internet of Things,” and deep analytics to develop new levels of situational awareness about their mar- N kets, supply chains, consumers, and the world around them. They will also need to become nimble collaborators to secure U the technology, suppliers, and markets they need, particularly when it comes to the software and IT applications that are reinventing every business. In these ways advanced industry firms can build new operational capacities and become what a AS E recent survey of executives called “disruption ready.”74 EL E For their part, governments, working with networks of business and civic partners, must do their part to provide the world’s best environment for advanced industry growth at a time of increased global competition. R At the federal level, an advanced industries growth agenda should focus intently on delivering the world’s most competitive R array of tax, trade, finance, and infrastructure policies.75 This does not mean simply cutting taxes or embracing free trade or FO practicing heavy-handed “industrial policy.” Rather, what is needed is a new set of smart, catalytic stances by government that facilitate a sustained public-private partnership to spur advanced industry growth. On taxes, Congress must get serious ED about corporate tax reform that simplifies the tax code, reduces the nation’s high topline corporate tax rate, and bolsters and makes permanent the research and experimentation tax credit.76 On trade, the government must simultaneously pursue O trade liberalization and trade enforcement.77 The United States should seek not only multilateral trade agreements but also G true market openings and regulatory harmonizations that reduce both tariff and nontariff barriers that advanced industry BA R exporters face in foreign markets.78 Countries that engage in unfair trade practices should be held accountable. Beyond taxes and trade, policymakers should consider how to ensure access to “patient capital”—capital that recognizes EM the time needed for young and small advanced industry firms to take innovative new products into large-scale production.79 For that matter, the nation must become more urgent and strategic about ensuring that the public, private, and civic sectors engage together to ensure the swift movement of people, goods, services, water, and energy along reliable national and globally connected infrastructure networks.80 4 6 THE BROOKINGS INSTITUTION | AMERICA’S ADVANCED I N D U ST R I ES At the same time, state and local governments must also work to provide an optimal environment for advanced industry development. To do this, it will be important that states and metropolitan areas work with industry to develop systematic competitive strategies for organizing action to advance their regions’ top advanced industry clusters.81 Data-driven cluster assessments can provide an invaluable framework for targeting government efforts where they are needed and knowing where they are not. 15 More specifically, a state strategy can provide a valuable context for a number of initiatives that parallel needed federal 20 efforts. As with their federal counterparts, state and local policymakers should work to improve the value proposition they offer to advanced industry firms and optimize their tax environments to encourage innovation and capital investment.82 3, Likewise, state and local leaders should also partner with regional firms, economic development leaders, and others to com- .F EB . bine export promotion and foreign investment outreach into an integrated global engagement strategy.83 As with their federal colleagues, state and metropolitan actors must go further and attend to the capital needs of small- and mediumsized enterprises (SMEs) in the advanced industries sector. Aware that patient capital frequently eludes even the most promising advanced industry SMEs, states and localities have already started moving in this direction.84 Last, states and A. M metropolitan areas must clear away the many local pinch points that impede flows along the nation’s road, rail, air, port, pipeline, and grid system.85 1 Notwithstanding their importance, moves like these are not enough. Neither steps by firms to improve their operations nor :0 moves by government to improve the environment for advanced industry growth will alone ensure the competitiveness of 12 the advanced industries sector. Given the trends depicted in this report, a more concentrated focus on the three deeper dimen- N TI L sions of advanced industry competitiveness—innovation, talent, and ecosystem development—is imperative. U Commit to Innovation AS E Innovation remains the only lasting source of advantage both for high-value firms and high-wage locations.86 As a result, the EL E competitiveness of the advanced industries sector will depend heavily on how effectively its firms continue to innovate. Yet the global climate for innovation is changing. New international competitors are mounting strong challenges to U.S. leadership. Further complicating matters, technology development no longer proceeds along a linear process from basic research R to applied and development research in a few highly specialized fields or inside a discrete set of laboratory silos run by large FO R corporations, universities, or the federal government.87 In short, the speed and complexity of innovation and its global champions are ratcheting up the urgency of the enterprise ED and demanding new strategies for engaging in it. O Both the private and public sectors must radically rethink their technology development strategies accordingly if they are G to remain relevant. Lead actors in firms and government will need to both increase the scale of their innovation efforts and BA R reconsider the formats they use to conduct it. EM Strategies for the Private Sector During the recent recession, many advanced industry firms survived by virtue of mergers and acquisitions, stock buybacks, and austerity plans.88 Now that the economy has begun to recover, firms should concentrate on innovation as their primary tool for creating value, whether to deliver unique capabilities, process and price savings, or new product offerings. T H E B R O O K I N GS I NSTITUTION | V. IMPLICATIONS: STRATEGIES FOR PROMOTING U.S. ADVANCED INDUSTRIES 47 The most concrete way firms can strengthen their position in the global innovation economy is by expanding corporate R&D and technology equipment portfolios. Many U.S. advanced industry companies are superbly positioned to own the development of next-generation technologies, provided they stay ahead of technological change and global competitors.89 During the last decade, however, the growth of private-sector R&D in the United States has lagged that in Denmark, Finland, Japan, and South Korea, to name a few advanced, global competitors. Moreover, the United States is the only OECD country in which private-sector R&D investment has shifted away from basic and applied research and toward development research.90 15 Without a balance between basic research and applied development, the U.S. private sector runs the risk of falling behind 20 technologically in the medium and long run. Moreover, evidence shows that many firms lag in their pursuit of innovationfocused investment opportunities. Research from McKinsey & Co. finds that a majority of U.S. firms are “sleepwalking” 3, through R&D investment decisions, maintaining risk-averse, legacy R&D portfolios.91 Support for the physical infrastruc- .F EB . ture—capital equipment, lab space, and the like—to sustain innovation has also fallen off.92 In view of that, advanced industry firms must ask themselves whether they are conducting adequate and appropriate R&D, particularly in such general purpose technology areas such as IT, robotics, or materials. Neither “sleepwalking” nor free-riding on public-sector investments will A. M suffice. However, simply investing more in R&D by itself will not solve the problem. Given the rapid pace of technological innovation, no company can know everything it needs to know on its own. Consequently, advanced industry firms must experiment 1 with new models for engaging in technological development that draw on networks of collaborators. Specifically, firms must :0 complement internal R&D initiatives with new open or networked innovation models.93 Through such models, successful 12 companies are increasingly partnering with a wide variety of academic institutions, national labs, competitors, customers, L venture-capital funds, and entrepreneurs to address both large and small innovation issues. Recent McKinsey & Co. work sug- TI gests these distributed or “open” approaches allow advanced industry firms to respond to the innovation imperative “faster N and at lower cost and lower risk.”94 The move toward open innovation may well be the key to enhanced return on investment U for advanced firms. Open approaches to innovation may also be the best way to tackle cross-industry “platform” issues— those issues that are too large for any one firm to solve alone, such as the commercialization of ultra-lightweight materials in FO R R EL E AS E manufacturing or energy storage in advanced batteries. ED “Both the private and public sectors must radically O rethink their technology development strategies EM BA R G if they are to remain relevant.” 48 THE BROOKINGS INSTITUTION | AMERICA’S ADVANCED I N D U ST R I ES Related to the more open approach to R&D is the need to attend to the technical capacity of the supply chain. Individual advanced industry firms are under extreme pressure to make sizable bets on future technologies. Yet for these gambles to be profitably adopted and diffused, technology strategies must be shared throughout the community of technical users and partners. From carbon fiber automobile parts to e-commerce procurement systems, coordinating technology development within the supply chain cuts costs, reduces redundancies, and facilitates risk-sharing. Accordingly, larger firms in the advanced industries sector should aggressively incubate new technology and process improvement throughout the value 15 chain. If the technical know-how among suppliers is lagging or fundamentally misaligned, investments in innovation will not 20 translate into strong growth. At minimum, advanced industry firms should be more open about their technology investment strategies and work with key suppliers to align technology. As technological complexity increases, more large firms will need 3, to embrace supplier development models such as Nissan’s Supply Chain Initiative, a joint effort between the company and .F EB . the University of Tennessee Center for Industrial Services to enhance quality and productivity throughout the value chain.96 T A. M BOLSTERING COLLABORATION IN THE INNOVATION COMMONS: VIRGINIA’S COMMONWEALTH CENTER FOR ADVANCED MANUFACTURING he Commonwealth Center for Advanced Manufacturing (CCAM) in Virginia represents a state-of-the-art example 1 of an industry-led, university-executed collaboration to advance manufacturing techniques. :0 CCAM is a collaboration among the state’s leading research universities—the University of Virginia, Virginia 12 Tech, Old Dominion, and Virginia State University—and advanced industry companies worldwide, including Rolls-Royce, L Siemens, and Airbus. As an applied research center, CCAM bridges the divide between fundamental research conducted TI at universities and commercial product development routinely performed by companies. N With a focus on advanced research in surface engineering, manufacturing systems, machining technologies, welding/ U joining/additive manufacturing, and composite materials, CCAM performs both generic research jointly developed by CCAM’s member companies and directed research projects exclusive to individual member companies. In both cases, AS E member companies guide the research agenda as a way to obtain production-ready solutions to some of their common technological challenges. In this fashion, CCAM’s collaborative model enables its member companies to pool R&D efforts EL E to increase efficiencies, lower research costs, and in the process spur technological innovation in multiple advanced industries. CCAM’s approach to intellectual property resonates strongly with member companies. Firms can fund directed R research and own the research outright. CCAM holds the intellectual property for generic research but makes it available R royalty-free with a nonexclusive worldwide license to member companies. Member companies thus share in and finan- FO cially support research that provides mutual benefits across a spectrum of advanced manufacturing processes. CCAM has made impressive progress since its inception in 2011, which was prompted by Rolls-Royce’s decision to ED build a jet engine component plant in Prince George County. It has increased its industry membership from seven to 20 companies and completed 18 research projects—nine generic, eight directed, and one externally funded. CCAM’s collab- O orative model has produced new processes and techniques that have been applied in aerospace, defense, transportation, G consumer electronics, and other advanced industries. BA R Consortia such as CCAM are breaking the mold and showing how new technology dynamics are motivating companies and their partners to craft creative, new innovation platforms to stay ahead. EM Source: Commonwealth Center for Advanced Manufacturing website T H E B R O O K I N GS I NSTITUTION | VI. CONCLUSION 49 Strategies for the Public Sector Private innovation strategies are only part of an industry’s technology system. Public-sector engagement—federal, state, and local—remains essential. Representing 30 percent of all U.S. R&D expenditures and more than 70 percent of basic R&D, the federal government’s R&D 15 strategies will remain critical to advanced industry competitiveness in the next decade. Federal R&D, after all, plays a key role 20 in supporting basic science—the first step in a long innovation chain. However, in the last decade and despite its importance to the U.S. economy, average federal R&D funding has fallen to below 1 percent of GDP for the first time since 1952, when .F EB . 3, data were first collected.97 For that reason, the federal government should significantly expand the nation’s research enterprise in economically strategic areas. To begin, the government should recommit to doubling its investment in basic R&D—a goal adopted by both President Obama and former President G. W. Bush.98 However, basic research is insufficient to support efforts by U.S. firms to A. M commercialize novel technologies. Therefore, the nation’s research pledge should extend to applied R&D. As a point of context, federal support for applied research as a percent of GDP was two times higher in 1964 than it was in 2013, and federal support for applied development was three times higher.99 At a moment of rapid technological change and intense competi- 1 tion, such declines must be reversed. Moreover, this expansion of the federal research project should focus on cross-cutting :0 technologies that have multiple applications for a number of advanced industries, whether advanced materials sciences, 12 next-generation genomics, or machine intelligence. This reorientation will ensure that any new R&D push yields insights with TI L maximum relevance. N More than just the scale and focus of federal research needs updating. The government also must update how federal R&D U is conducted if it is to accelerate the domestic commercialization of innovation. Specifically, the government must embrace and scale up new collaborative formats for delivering public-sector R&D in ways that place federal investments closer to AS E the marketplace, recognize the growing complexity of the innovation system, and improve the chances for commercialization at home. Along these lines, the government should invest in expanding a robust new model of collaborative, use-oriented EL E research aimed at accelerating new product development in the advanced industries sector. For example, Congress should build on a number of recent experiments, such as the initial Energy Innovation Hubs and the establishment of the first five institutes of the National Network for Manufacturing Innovation (NNMI).100 These experiments offer models for how the R federal government might co-invest in creating more public-private consortia to solve industry-relevant problems. Similarly, R tax policies such as a collaborative R&D tax credit would reward joint university–firm investments. Finally, given that the FO federal government funds nearly one-third of university-based technological research, it could allocate a portion of such funding to technology transfer—getting new technologies out of the lab and into firms. In doing so would galvanize university ED commercialization. O State and local governments and regional economic development organizations also have an important role to play in G encouraging innovation in the advanced industries sector. Together, state and metropolitan area leaders are well positioned BA R to encourage advanced industry innovation activities, given their proximity to local industry concentrations. To be sure, federal dollars will continue to fund the bulk of public R&D even at the state and local level. But plateauing federal investment and ideological gridlock mean that states and localities will play an increasingly important role in planning, funding, and EM facilitating innovation. States and their regions should therefore work to identify their regional innovation clusters and then move to formulate well-researched advanced industry innovation strategies or “business plans” for accelerating technological development and commercialization across them. In recent years states as diverse as Colorado, Massachusetts, Nebraska, Nevada, and Tennessee as well as numerous metropolitan areas—including Louisville-Lexington, Memphis, Newark, and Phoenix—have pursued their own “bottom-up” strategies to foster greater innovation.101 Other states and metropolitan areas should follow suit. 5 0 THE BROOKINGS INSTITUTION | AMERICA’S ADVANCED I N D U ST R I ES Growing numbers of states and regions are also working to enlarge the local technology development enterprise and maximize its commercial impact. States spend substantially more on traditional “smokestack-chasing” economic development strategies than technology-based economic development programs such as university technology transfer.102 Shifting some portion of the resources and attention lavished on the latter to more innovation- and technology-based programming would go a long way toward building regional advanced industry specializations. Meanwhile, more cities should follow the examples of New York and Seattle in developing bold partnerships to attract and better leverage advanced industry-related research or 20 15 anchor institutions to urban locations.103 At the same time, states should take steps to maximize the commercial impact of innovative activity within their 3, borders. Many states are working to facilitate technology transfer from universities and federal laboratories, whether by .F EB . creating tech-transfer offices, developing standardized technology licensing agreements, or providing innovation vouchers to help firms “buy” innovation services from available labs or universities.104 Innovation vouchers are particularly supportive of small- and medium-sized enterprises that typically lack both the resources and technical capacity to develop strategic partnerships with labs and universities.105 Likewise, numerous states and metropolitan areas are developing thoughtful accelera- A. M tor programs that provide modest grants to support the commercialization of new technology.106 12 :0 1 INVESTING TO POWER ADVANCED INDUSTRIES: COLORADO’S ADVANCED INDUSTRY ACCELERATOR PROGRAM F L inance is critical to innovation and technology commercialization in advanced industries. Although these indus- TI tries—particularly biotech, aerospace, and clean energy—have long driven Colorado’s economy, the sector’s expan- N sion has been challenged by limited access to capital among new firms. To reduce this barrier, the state launched U the Advanced Industries Accelerator (AIA) program in 2013. Today, a program originally focused on biotech has been revamped to operate as a competitive 10-year, $15 million annual matching grant program to support innovation and new AS E firm development across the state’s entire advanced industries ecosystem. The program offers four types of grants to advanced industries companies and Colorado research institutions: to EL E support 1) proof-of-concept research and development, 2) early-stage capital and business retention, 3) infrastructure, and 4) exports. The proof-of-concept grants enable companies and research institutions to prove new technologies or products, a prerequisite for commercialization. For its part, the early-stage matching grant helps small Colorado-based R companies attract private investment. The goal of infrastructure grant is to help build a foundation for companies to R thrive, while the export grant helps businesses that are either new to exporting or expanding into new export markets. In FO all cases, preference is given to collaborative projects and technologies that cut across advanced industries. Since the program’s inception, Colorado has awarded $8.3 million in proof-of-concept and early-stage capital grants. ED Consistently oversubscribed, the AIA program continues to enjoy strong bipartisan support from the state’s legislature fund. O and Govenor Hickenlooper. The FY15 budget provides an additional $5 million for the program from the state’s general G In addition to the AIA grant program, in 2014 the state legislature also passed the Advanced Industries Angel Investor BA R Tax Credit, which allows investors contributing at least $10,000 in an advanced industry company to receive a tax credit equal to 25 percent of their investment, with a maximum credit of $25,000. A complementary program to the AIA, the tax credit stimulates investment in startups with strong growth potential. EM Together these initiatives show how one state is focusing its resources to foster early-stage and small firm innovation and entrepreneurship in and across the advanced industries sector. Source: Advance Colorado’s Advanced Industries Accelerator Programs website T H E B R O O K I N GS I NSTITUTION | ENDNOTES 51 Finally, states and localities should recognize the importance of young firms to their metropolitan areas’ innovative capacity. The growth of new firms remains an important way for advanced industries to keep pace with technology cycles and retain their edge. Most innovative firms develop their proprietary technologies in the phase before profits are earned, when access to markets and capital are most critical. This is particularly true for firms outside the consumer software and life sciences industries, which venture capital funds favor. State and metropolitan supply chain mapping and export promotion services can improve new firms’ access to markets, while public investment funds or angel investment tax credits can help 20 15 make capital available for young and growing technology firms. .F EB . 3, Develop the Skills Pipeline More qualified workers with different skill sets are also critical to the future competitiveness of the advanced industries sector. The skills prerequisites of modern advanced industries have been changing faster than the country’s ability to train the needed workers. The result, as this report shows, is that advanced industry firms often struggle to fill job openings at both A. M the professional and middle-skill levels. The stresses are now sharpening. Evidence suggests that the recession may have temporarily obscured a skills gap that has 1 been growing for years. Now that the economy is heating up and firms are beginning to expand again, both private- and pub- 12 :0 lic-sector actors, often in partnership, must bear down on improving the availability of skilled advanced industry workers.109 N TI L Strategies for the Private Sector U Companies, to start, should reinvigorate their efforts to develop the talent they need in both the short and long term. Relentless pressure to slash costs has discouraged many advanced industry firms from investing directly in strong work- AS E force training practices.110 Now, however, the demands of renewed growth amid persistent skills gaps necessitate a stron- EL E ger focus on retention and internal training even as firms seek out new opportunities in recruiting talent. Many opportunities exist for meeting at least part of firms’ skills needs through improved management and training of current employees. Creating career pathways that help incumbent employees advance and grow remains an extremely efficient R way to meet worker shortages. Companies should therefore invest in strong talent management and retention strate- R gies. Novel management practices that motivate managers to identify talented employees, tailor incentive structures to FO retain these workers, and help them develop skills within the firm have been shown to lower attrition rates, reduce costs, and improve production flexibility.111 Moreover, availability of low-cost online training in many skill areas reduces the costs of ED company-funded training. O However, firms will not be able to meet all of their human capital needs this way. Companies also need smarter recruitment G and workforce development practices. One smart, near-term strategy is to implement more flexible hiring standards. BA R Relaxing formal education requirements expands the pool of potential workers. Many new or small advanced industry businesses are beginning to eschew formal academic requirements in favor of raw skills and commitment. Instead of college degrees, these firms seek mastery of certain programming languages or technical skills, often as demonstrated through EM national certifications.112 Larger companies, in contrast, often have more rigid standards, which may lead them to overlook talented workers.113 Going forward, the rise of new certification systems as well as online learning platforms such as Udacity, Coursera, and Tree House will make it all the more likely that people without formal degrees will be able to acquire advanced programming expertise and other technical skills. All companies should take advantage of this shift in training options. 52 THE BROOKINGS INSTITUTION | AMERICA’S ADVANCED I N D U ST R I ES Over the medium term, meanwhile, firms will need to get much more involved in developing the skills pipeline. Such involvement will require greater engagement with a wider array of local and regional partners. Already companies are beginning to aggressively expand recruitment efforts to include community colleges and career and technical education (CTE) programs. Beyond that, advanced industry firms should get more involved in modernizing their local workforce development systems.114 Not always have companies been precise about their needs and problem-solving. Working individually or with other companies, firms should develop strong industry-led, sector-oriented regional skills partnerships that bring together 15 community colleges and universities, workforce investment boards, chambers of commerce, and industry associations to cre- .F EB . SECURING THE TALENT PIPELINE: PACIFIC GAS & ELECTRIC’S POWERPATHWAY 3, 20 ate a lasting infrastructure that helps workers obtain the skills that companies need.115 T he utility sector has long faced a looming shortage of appropriately trained workers but few utilities have been A. M as proactive at getting ahead of the problem as Pacific Gas & Electric (PG&E). PG&E responded to the threat in 2008 with “PowerPathway,” a partnership between the company, unions, local education and training providers, and the public workforce development system. The partnership is building a sustainable workforce pipeline not only 1 for the company, but also for the entire sector. PG&E established a program larger than itself for two reasons. First, :0 the company knows that it must be able to both find and retain talent, which requires a large pool of potential workers. 12 Second, PG&E recognized that its success depends on the ability of its customers, suppliers, and business partners to L find the talent they need too. TI To those ends, PG&E works closely with community colleges throughout the state to design curriculum, train faculty N and trainers, and co-deliver instruction. It also hosts field visits and donates equipment. Curricula developed in part- U nership with PG&E are not proprietary and focus on marketable skills for positions such as welders, power engineers, substation technicians, gas field service technicians, and energy efficiency and renewables technology installers. The AS E company’s hands-on involvement ensures that the training remains flexible and up-to-date. The program has been a boon for students as well. Recruitment efforts target veterans and individuals from under- EL E privileged communities. After only six to eight weeks of training, participants are employment-ready and can expect starting wages of $25 per hour. To date, PowerPathway has trained more than 450 students since 2008 with a place- R ment rate more than 80 percent. ED FO R Sources: The Aspen Institute, “Skills for America’s Future Models of Success: PG&E PowerPathway” (2013); National Commission on Energy Policy, “Report from the Task Force on America’s Future Energy Jobs” (2014); Alex Brown, “How One Utility Giant Created Its Own Pipeline of Skilled Workers,” National Journal (January 13, 2014); Association for Career and Technical Education, “Taking Business to School: Pacific Gas and Electric Company” (2013). O Over the longer term, good corporate citizenship can align with self-interest in creating ambitious partnerships in education G and training. In this respect, firms should partner with local educational institutions to develop the next generation of BA R skilled STEM workers. To give just a few examples, in 2011, IBM partnered with the New York City school system to create P-TECH—Pathways in Technology Early College High School—an IT-oriented career and technical high school.116 In North Carolina, Biowork, a consortium of bio-tech companies, has fostered successful partnerships with the state’s community EM colleges, leading to high job placement rates for graduates.117 In Manchester, NH, advanced industry technology firms Dyn and Silvertech have invested in a local high school to create STEAM-Ahead, which encourages high school students to obtain one year’s worth of college credit in STEAM-oriented (STEM plus art) courses.118 Such deep partnerships are also emerging to support training for sub-baccalaureate and professional STEM workers. For example, firms in the Minneapolis-St. Paul biomedical sector work closely with a local community college to create specialized programs for medical technicians.119 T H E B R O O K I N GS I NSTITUTION | ENDNOTES 53 Strategies for the Public Sector The imperative for private-sector initiative and involvement notwithstanding, it remains the public sector that delivers most formal education and workforce training in the United States. And here, significant change is needed if the nation is to ensure the advanced industries sector has access to the workers it needs to thrive. 15 The federal government, which operates at a remove from front-line regional labor markets, can best support the develop- 20 ment of a high-quality advanced industry workforce by focusing on the quality of publicly funded education and directly 3, investing in STEM-oriented higher education. .F EB . On the first priority, the federal government has a role to play in improving the quality of P-12 basic education, the starting point for the nation’s technical workforce. The federal government should leverage its modest P-12 funding role to improve accountability and encourage innovation in education, particularly in schools that serve lower-income students. The Bush administration’s No Child Left Behind legislation introduced formal accountability to the system and the Obama admin- A. M istration’s Race to the Top contest spurred innovation by rewarding states and districts that, among other things, encouraged the creation of equitably funded charter schools. Both of these initiatives have strengths and weaknesses that have been dis- :0 when determining how and what the federal government funds in the future. 1 cussed at length elsewhere. However, lessons learned from these initiatives about what works in education should be applied 12 With regard to STEM education, the government should increase investment in applied STEM education at all levels. L Federal investments play a significant role in strengthening the workforce pipeline.120 Fourteen federal agencies, including TI the National Science Foundation, the National Institutes of Health, and the Department of Education, spend more than $4 N billion annually on graduate-level research grants and undergraduate fellowships.121 In addition, many of these agencies fund U professional development for STEM educators and STEM education programs from preschool through high school. Given the importance of STEM to national economic competitiveness, the federal government should maintain if not increase its AS E level of support for such activities. At the same time, the federal government should shift the focus of its STEM investments. Currently, the bulk of federal STEM education spending supports bachelor’s degree programs in science fields, with the goal EL E of developing research professionals.122 Although worthy, that focus means that relatively little funding flows to community colleges, for example, or middle-skilled training. As a result, the nation may be missing out on low-cost opportunities to R enhance the skills and earning power of a large segment of the American workforce. R States and local actors, for their part, should take the lead in prioritizing and delivering high-quality workforce development FO and STEM education that is aligned with the needs of regions’ core advanced industries. The lack of workforce development has in many regions reached a near crisis level, with serious shortages of workers in some middle- and high-skill occupa- ED tional categories. Given this, states must articulate and implement a strong vision of aligned advanced industry-related training and education. As the National Governor’s Association has noted, states are uniquely positioned to coordinate the O hundreds of state, local, private, and philanthropic actors that deliver services in the education and training ecosystem.123 G Governors and other state leaders should therefore prominently highlight the need for skill-building that meets the needs of BA R top advanced industries. They should also work to coordinate efforts related to education, training, and economic development, and launch strategies with measurable goals. Tennessee Govenor Bill Haslam’s “Drive to 55” initiative to ensure that EM 55 percent of Tennesseans earn an associate’s degree or certificate by 2025 targets all of these priorities (see box).124 54 THE BROOKINGS INSTITUTION | AMERICA’S ADVANCED I N D U ST R I ES BUILDING AN ADVANCED INDUSTRIES WORKFORCE: TENNESSEE’S DRIVE TO 55 INITIATIVE E fforts by states and regions to strengthen their advanced industries frequently focus on efforts to better align education and workforce training systems to the needs of local industries. 15 In Tennessee, for example, a renewed interest in strengthening the state’s auto industry and other advanced 20 industries inspired Gov. Bill Haslam to rethink how the state prepares workers for well-paying jobs. He began in 2013 by appointing a special advisor to make postsecondary education and workforce training more accessible, affordable, and 3, more closely aligned with firms’ workforce projections. This special advisor worked with the governor and leaders from .F EB . the state’s postsecondary institutions to craft a new approach to workforce development that encouraged greater postsecondary educational attainment while also inviting industry leaders to play an active role in the design and implementation of workforce training. That same year, the state embarked on its Drive to 55 initiative, which aims to ensure that 55 percent of Tennesseans A. M have either a postsecondary degree or certificate by 2025. The initiative has three key programs. The first is Tennessee Promise, which provides two years of free attendance for Tennessee high school graduates at a state community colleges or college of applied technology (TCATs). Tennessee Reconnect, the second program, provides tuition-free certifi- 1 cate training at the state’s TCATs. Finally, Tennessee Labor Education Alignment Program (LEAP) is a competitive grant :0 program that supports regional collaboration among businesses and education providers to use data to identify and 12 then address local skills gaps. L Taken together, the three Drive to 55 programs highlight the critical components needed for any successful workforce TI development program in advanced-industries: strong emphasis on postsecondary education (particularly at the sub- U N baccalaureate level) paired with clear incentives for industry involvement. EL E AS E Source: Office of the Governor of Tennessee, “Haslam Announces Higher Education Initiative: Corporate Leader to Spearhead Effort in Coordination with State Leadership” (Nashville: State of Tennessee, January 15, 2013) and Drive to 55 Alliance, “About the Alliance” (http://driveto55.org/about/the-alliance/). States should also facilitate and support “bottom-up” efforts to align labor supply with demand regionally throughout the workforce development and skills education system. Only through robust partnerships and open channels of commu- R nication can the public sector hope to respond to the rapidly changing needs of local advanced industry employers. States R and governors are well positioned to spur needed regional partnerships, which should then be managed by local actors. A FO program pioneered in Washington State shows the catalytic power of a well-designed state initiative. There, the state created a competitive workforce challenge grant to fund regional workforce development solutions to address documented ED skills needs in local labor markets.125 Maryland’s EARN program adopts a similar approach by providing competitive grants for industry-led regional skills partnerships.126 In both states, the programs created a competitive atmosphere within regions O that inspired new public-private partnerships.127 The approach also has the benefit of fostering experimentation and the dif- BA R G fusion of best practices. Meanwhile, because regions and metropolitan areas reside on the front lines of the labor market, they should lead the practical work of aligning skills development with the needs of regional advanced industries. Local consortia of employers, work- EM force development providers, unions, and community colleges are best situated to identify, develop, and deliver responses to worker training issues in partnership with and with support from their states. And yet, sustaining the long-term competitiveness of the advanced industries sector will require more than just near-term workforce training. It will also require increasing the STEM proficiency of many more American workers through the formal education system. T H E B R O O K I N GS I NSTITUTION | ENDNOTES 55 State-funded institutions of higher-education have the most urgent responsibility to meet the needs of employers, either by graduating new workers into the labor-force or re-training incumbent workers. The first priority in this regard is to attune educational curriculum to regional demand for STEM skills. This tuning can take three forms. First, postsecondary institutions—in the business of supplying the degrees demanded by students—could do most of the alignment work themselves if states took steps to better inform students about how local career opportunities 15 vary by field of study. Second, institutions and systems can take advantage of newly accessible labor market data and formal 20 relationships with business organizations to align curriculum with local skills needs. Third, state and local governments can and should invest directly in STEM higher education through tuition support, capital improvements, and efforts to recruit 3, and retain high-quality faculty at universities and community colleges. A number of states are acting on these priorities. In .F EB . Florida, state funding to institutions of higher education now takes into account the institutions’ number of STEM graduates. North Carolina’s Board of Community Colleges, meanwhile, recently proposed a new stream of dedicated funding for STEM programs. Both of these approaches were informed by careful study of job openings data and other indicators of labor A. M market dynamics. Apart from attuning curricula to the labor market, state college systems should also increase the number of graduates in in-demand fields. Each year, thousands of would-be graduates drop out of college or abandon STEM majors for a variety 1 of reasons, including financial hardship or poor grades. Over the years, this siphons away millions of would-be STEM work- :0 ers. To address this problem, states and institutions of higher education should take steps to boost student completion 12 rates. Strong student supports—including academic assistance through tutoring, expedited remediation, and summer bridge L programs as well as nonacademic wrap-around services such as child care, transit subsidies, and financial aid—can make the N TI difference between an employable graduate and a drop out, particularly for lower-income students. U However, because education is cumulative, special attention must also be given to earlier aspects of the preschool through high school years, upon which all else depends. States, local governments, and local districts should increase the num- AS E ber and quality of STEM learning opportunities in high school that provide students with college-level credit or careerrelevant certifications in STEM fields. For example, high schools can take steps to increase the number of students taking EL E Advanced Placement exams in computer science or engineering.128 Likewise, districts may choose to forge partnerships with local community colleges and universities that let students enroll in college courses and pursue industry-relevant certifications while still in high school. Also crucial will be steps to improve the quality of teaching in STEM disciplines in second- R ary and middle school. High-quality teachers make a huge difference in students’ lifetime learning, employment prospects, FO R and earnings.129 Even more fundamental is the need to ensure that all students have equal access to high-quality schools, regardless of ED where they live or how much their parents earn. No child should be forced to attend a chronically low-performing school. Therefore, more school districts should work to improve student access to strong schools by empowering parents to make O decisions about their children’s education. At the same time, greater state and local support for public charter schools—when G paired with strong accountability and performance measures—can further expand parents’ options by introducing into the BA R existing public school system new approaches to education. Finally, there remains the need to intervene as early as possible to enhance children’s lifetime learning potential. Early EM childhood education may seem remote from the demands of advanced industry competitiveness, but it is not. Irrefutable evidence now shows how crucial the earliest years of life are in shaping later cognitive and educational performance.130 Likewise, compelling cost-benefit analyses show large returns to early childhood education.131 For these and other reasons, state and local governments should expand access to high-quality early education. Universal pre-kindergarten and kindergarten could be the single most critical step states and regions take in securing the nation’s long-term advanced industry skills base. 5 6 THE BROOKINGS INSTITUTION | AMERICA’S ADVANCED I N D U ST R I ES Embrace the Ecosystem Finally, firms, governments, and other relevant actors should work to strengthen the nation’s regional advanced industry ecosystems. Innovation and skills development does not happen just anywhere. It happens in places, most notably within metropolitan regions, where firms tend to cluster in close proximity, whether to 15 profit from local knowledge flows, skilled workers, or regional supplier networks.132 To be sure, the forces of globalization and 20 dispersal remain powerful, as firms continue to shift industrial activity around the world depending on myriad technology, talent, and cost factors.133 Nevertheless, the future of America’s advanced industries will be heavily shaped by the depth and 3, vibrancy of its innovation, workforce, and supply chain competencies, which, though embedded in regions, together compose and capture the benefits from advanced industry growth.135 Places that do not, will not. .F EB . the nation’s industrial commons.134 Regions that cultivate their local industrial ecosystems will be well positioned to nurture Today, after decades of offshoring and disinvestment, America’s advanced industry clusters are in too many places thin or A. M eroded. It is therefore critical that firms and public-sector leaders work together to renew the vitality of the nation’s regional 1 advanced industries ecosystems, the most durable foundations of U.S. competitiveness in the sector. 12 :0 Strategies for the Private Sector L To be sure, it may be difficult for private companies to justify investing directly in the shared industrial commons where they TI operate because they cannot capture all of what would be shared benefits. Despite this constraint, however, growing numbers N of firms are coming to understand that vibrant local ecosystems matter intensely because of the difficult-to-replicate advan- U tages they can provide.136 These companies realize that dense local ecosystems can deliver solid business value by facilitating AS E knowledge exchange, workforce matching, or supply chain aggregation, for example. All of which suggests that advanced firms should do more to factor the value of strong local ecosystems into strategy. EL E Specifically, companies should work harder to make the strategic value of local ecosystem benefits explicit in their planning and incorporate that value into a multidimensional “total factor performance” approach to decisionmaking.137 Such an approach would move beyond simplistic assessments of local wage or transportation costs and take into account the full R R range of ways in which place affects a company’s bottom-line and long-term prospects. FO Some forward-thinking firms will choose to go further and engage actively to upgrade local ecosystems. Businesses are the actors best placed to identify and inform efforts to address ecosystem weaknesses, such as sluggish university-to-firm ED tech transfer or disconnected workforce training efforts.138 Given that, advanced industry businesses can make outsized contributions by actively participating in regional economic development discussions, signaling key issues, and helping to shape G O community problem-solving. BA R Ultimately, corporations may elect to play more active roles in coordinating and delivering needed solutions. GE Appliances turned to the ecosystem in its Louisville backyard to enlist small companies and independent innovators in solving the design, prototyping, and parts challenges of the next generation of smart appliances.139 The resulting GE FirstBuild microfac- EM tory leverages the utility of open innovation models by providing the company’s engineers a well-outfitted space in which to invent, iterate, and take innovations to scale alongside University of Louisville researchers, independent industrial designers, start-ups, and enthusiasts.140 Microsoft, for its part, is betting on Seattle’s broader competitive advantage in the “Internet of Things” to establish an accelerator for promising local building automation start-ups.141 Innovations developed by those companies may create new markets for Microsoft products. Cisco and Qualcomm have adopted similar strategies to build their local ecosystems to accelerate technology development in adjacent and emerging markets.142 The driving motivation of these top firms is clear: The success of these companies depends on the health and innovative vitality of their local ecosystems. T H E B R O O K I N GS I NSTITUTION | ENDNOTES 57 Strategies for the Public Sector Left to their own devices, however, profit-maximizing firms will not likely provide adequately for the broad health of regional ecosystems. For that reason, the public sector will always play an important role in maintaining and upgrading the nation’s advanced industrial commons. 15 The federal government, for its part, should redouble its efforts to revitalize the nation’s regional ecosystems by providing 20 tools and platforms that acknowledge and leverage local clusters, networks, and other assets. 3, Along these lines, Washington should expand the emerging “hubs and clusters” paradigm for co-investing in regional .F EB . industrial ecosystems. A variety of federal agencies have, in a somewhat piecemeal fashion, developed a smart set of programs for strengthening regional advanced industry ecosystems. One approach co-invests in regionally situated public-private research institutes as through the nascent NNMI, the Department of Energy’s Energy Innovation Hubs, or the National Science Foundation’s Engineering Research Centers (ERCs).144 Another model seeks to foster emerging regional industry A. M clusters with competitive grants such as those provided by the multi-agency Investing in Manufacturing Communities Partnership. Taken together, this pair of agendas responds to the need to embed federally supported centers for market- 1 oriented applied problem-solving within vibrant regional industry clusters. :0 The logic of linking federal hubs to regional clusters should also prompt Washington to reimagine federal assets in regions as 12 ecosystem anchors and free them to engage in local economic development. From the National Oceanic and Atmospheric L Administration to the National Institute of Standards and Technology and the Department of Energy, federal agencies main- TI tain a formidable array of innovation and talent centers in regions throughout the country. However, these institutions are not N always active participants in their local ecosystems or attuned to their region’s cluster needs.145 Federal agencies should open U their regional hubs to local exchanges. The Department of Energy’s National Lab Impact Initiative and the U.S. Patent and AS E Trademark Office’s move to embed satellite offices in technology clusters across the country point in the right direction.146 However, Washington has neither the knowledge nor the capacity to play the lead role in strengthening regional industry EL E concentrations. The bulk of the work must take place at the state and local levels. State and local leaders—including regional civic, philanthropic, and development entities or trade associations—should R develop and maintain fine-grained, timely information on existing and emerging advanced industry clusters. Such FO R analyses can identify top industries and firms and analyze their specializations, interrelationships, and geography. In addition, state and regional leaders can convert this granular intelligence into action by moving to convene public-private ED partnerships to identify and implement strategies for enhancing local advanced industry ecosystems. The State of Illinois, for example, is connecting firms to innovation resources, Washington State is aligning workforce training to industry O needs, Colorado is developing a statewide advanced industry roadmap, and Oregon is facilitating collaborative research at G a specialized R&D facility.147 Locally, alliances of leaders in Chicago, Kansas City, Minneapolis-St. Paul, Northeast Ohio, and BA R Syracuse, NY, have all used rigorous market analysis to inform regional strategies that strengthen local innovation networks, promote exports, attune worker training to firms’ needs, cultivate supplier competencies, and develop shared research initia- EM tives and test beds.148 Most places should prioritize cross-cutting initiatives that support the competitiveness of multiple advanced industries rather than focusing narrowly on single high-tech fields.149 In all cases, states, however, should take special care to align their strategies with the “bottom-up” ecosystem-building efforts of local regions. In recent years, for example, the state of Washington threw its weight behind a Puget Sound Regional Council initiative to establish a building technologies demonstration and testing facility, providing investment and adding its heft to an application for federal funding.150 58 THE BROOKINGS INSTITUTION | AMERICA’S ADVANCED I N D U ST R I ES Metropolitan leaders, meanwhile, are increasingly responsible for building and maintaining local industrial ecosystems. Not only are city and metropolitan economic development leaders closest to the action, but they also control or influence key administrative areas such as zoning and real estate rules, education and training, and transportation. Nor are cities and metropolitan areas just planning. Throughout the United States, cities and metropolitan areas are moving to implement transformative initiatives to enhance local advanced industry ecosystems. New York City, for example, is 15 rectifying its lack of a venue for applied science and engineering by spearheading the development of the Applied Sciences 20 NYC tech campus. Similar efforts to address workforce development challenges are underway elsewhere. In Ohio, actors from across the Greater Cincinnati region have forged the highly effective Partners for a Competitive Workforce, which 3, serves as a coordinating body for the region’s workforce development initiatives, sets priorities, and tracks progress in meet- .F EB . ing employer demand for skills.151 Related to all of this is, finally, is the need for cities, counties, and their regional partners to expand their efforts to meet the varied and changing spatial requirements of advanced industry production. This priority reflects not just the varied A. M location preferences and physical requirements of advanced firms but also local governments’ special role in real estate, infrastructure, and neighborhood place-making. Localities must strive to provide and connect an increasingly wide variety of physical sites for advanced industry firms, ranging from exurban “mega-sites” that enable the joint location of industrial EL E AS E U N TI L 12 :0 1 plants with their suppliers to modern urban collaboration spaces.152 R “The private, public, and civic sectors must work R together in new ways to strengthen the fundamental FO sources of advanced industries vitality: innovation, EM BA R G O ED technical skills, and dense ecosystems.” T H E B R O O K I N GS I NSTITUTION | ENDNOTES 59 REIMAGINING AN URBAN CORRIDOR AS A LIFE SCIENCES INNOVATION DISTRICT: ST. LOUIS’ CORTEX L ocal leaders in the St. Louis area are capitalizing on emerging trends in the geography of innovation to develop an innovation district centered on the region’s world-renowned strength in plant and life sciences research. 15 Powered by the Cortex Innovation Community (Cortex), the district is fast establishing itself as a midwestern hub 20 of commercialization and entrepreneurship. Cortex was formed in 2002 by a consortium of anchor institutions, which pooled local institutional and philanthropic 3, funds with state tax credits and city resources to redevelop a stretch of downtown St. Louis. In the years since, it .F EB . has been working with private- and public-sector stakeholders to transform the 928 acres, which includes St. Louis University, Washington University, and the BJH Healthcare district, into a center of research, enterprise, and collaboration as well as urban living. Building on the talent and expertise in the anchor institutions, a rich cluster of startups and supporting organizations A. M is forming alongside established firms such as DuPont Solae, a large supplier of soy protein products. Three innovation centers within the district support new and emerging technology companies by providing a rich array of innovation supports, including co-working office and lab space, events and programming, and access to capital. For example, 1 BioGenerator provides seed funding and access to shared lab space at the early stages of company formation. It contin- :0 ues to work with companies as they transition to their next phase of development. The prominent Cambridge Innovation 12 Center’s (CIC) first expansion outside of Cambridge, MA, is also in Cortex. Dynamic young firms have also begun to rec- L ognize the benefits of locating in the area. All told, approximately 85 new life science, IT, engineering, consumer prod- TI uct, and professional services companies now reside in the district, including Manifest Digital, Confluence Life Sciences, N aisle411 and Cultivation Capital, to name just a few. In total, they employ 2,800 workers. U Firm and job growth alone do not define the success of the district, however. The area’s developing innovation ecosystem both shapes and is shaped by a changing physical realm. The Cortex West Redevelopment Corporation, the city-des- AS E ignated master developer of the area, has spurred the development of approximately 1.5 million square feet of office and research space, as well as housing, infrastructure, and retail, leveraging $500 million in public, private, and civic capital. EL E Cortex is working with the city to improve infrastructure and transit links. When the plan is fully built, it will ultimately help create a dynamic and inclusive innovation district where St. Louis’ advanced industries, and the people who work R within them, can continue to grow and thrive. ED FO R Sources: Bruce Katz and Julie Wager, “The Rise of Innovation Districts” (Washington, Brookings Institution, 2014); MassEconomics, “Innovation District Advisory Group” (2014); CORTEX website: http://cortexstl.com. The importance of open knowledge flow, workforce matching, and complex partnerships suggests cities should work closely O with their advanced industries to enhance such exchanges. The new direction is reflected in the dozens of cities working with G private actors to enhance their local ecosystems by developing downtown co-working spaces, incubators, meeting places, BA R and the like. The trend is epitomized by the rise of “innovation districts”: dense, amenity-rich enclaves in cities’ cores where knowledge-intensive industries locate because of proximity to other firms, research labs, and universities. By doing so, they profit from the synergies of knowledge exchange and strong networks of firms in related fields. Innovation districts already EM exist in the downtowns and midtowns of Cambridge, Detroit, Philadelphia, and St. Louis. In cities such as Boston and Seattle, underused areas—particularly older industrial lands—are being re-imagined as convenient focal points of the local ecosystem. These examples show how cities and their partners can help foster dense innovation ecosystems where knowledge-intensive advanced industries such as biotech, robotics, software, and telecom can thrive. n 6 0 THE BROOKINGS INSTITUTION | AMERICA’S ADVANCED I N D U ST R I ES W H AT 15 WHERE WHY 3, 20 VI. CONCLUSION .F EB . T his report identifies a distinct yet overlooked part of the economy—the A. M advanced industries sector—that is at once critical to national well- 1 being and under pressure from eroding competitiveness and national 12 :0 economic drift. In some regions, the sector is deep, vibrant, and globally com- L petitive. In others, the sector has been hollowing out. In all places, its vibrancy is N TI a prerequisite for improved opportunity amid regional and national prosperity. AS E U Going forward, the private, public, and civic sectors must work together in new ways to strengthen the fundamental sources of advanced industries vital- EL E ity: innovation, technical skills, and dense ecosystems. If they do, the nation will EM BA R G O ED FO R R have a good shot a shoring up a key pillar of an opportunity economy. n T H E B R O O K I N GS I NSTITUTION | CONCLUSION 61 SELECTED REFERENCES General 15 Atkinson, Robert. 2012. “Innovation in Cities and Innovation by Cities.” Washington: Information Technology and Innovation 20 Foundation. 3, Atkinson, Robert, and Stephen Ezell. 2013. Innovation Economics: The Race for Global Advantage. New Haven: Yale University .F EB . Press. Audretsch, David, and Maryann Feldman. 2004. “Knowledge Spillovers and the Geography of Innovation.” In J. Vernon Henderson and Jean-Francois Thisse, eds., Handbook of Urban and Regional Economics: Cities and Geography, vol. 4. A. M Amsterdam: Elsevier. Basu, Susanto, and John Fernald. 2006. “Information and Communications Technology as a General-Purpose Technology: :0 1 Evidence from U.S. Industry Data.” Working Paper 2006-289. Federal Reserve Bank of San Francisco. 12 Berube, Alan. 2007. “MetroNation: How U.S. Metropolitan Areas Fuel American Prosperity.” Washington: Brookings TI L Institution. U N Chesbrough, Henry. Spring 2003. “The Era of Open Innovation.” MIT Sloan Management Review. Delgado, Mercedes, Michael Porter, and Scott Stern. 2010. “Clusters, Convergence, and Economic Performance.” Working AS E Paper 10-34. Washington, DC: U.S. Census Bureau Center for Economic Studies. EL E Helper, Susan, Timothy Kreuger, and Howard Wial. 2012. “Why Does Manufacturing Matter? Which Manufacturing Matters?” Washington: Brookings Institution. R R ——. 2012. “Locating American Manufacturing: Trends in the Geography of Production.” Washington: Brookings Institution. FO Katz, Bruce. Nov. 1, 2010. “City Centered: Investing in Metropolitan Areas to Build the Next Economy.” TIME Magazine. ED ——. 2010. “Delivering the Next American Economy: From Macro Vision to Metro Action.” Speech at the Global Metro Summit. O December 8. Chicago. G Katz, Bruce, and Mark Muro. 2012. “Remaking Federalism, Renewing the Economy: Resetting Federal Policy to Recharge the BA R Economy, Stabilize the Budget, and Unleash State and Metropolitan Innovation.” Washington: Brookings Institution. Katz, Bruce, and Julie Wagner. 2014. “The Rise of Innovation Districts: A New Geography of Innovation in America.” EM Washington: Brookings Institution. Katz, Bruce, Jennifer Bradley, and Amy Liu. 2010. “Delivering the Next Economy: The States Step Up.” Washington: Brookings Institution. Manyika, James, and others. 2012. “Manufacturing the Future: The Next Era of Global Growth and Innovation.” McKinsey Global Institute. 62 THE BROOKINGS INSTITUTION | AMERICA’S ADVANCED I N D U ST R I ES Manzi, Jim. Spring 2014. “The New American System.” National Affairs. Massachusetts Institute of Technology. 2013. “Report of the MIT Taskforce on Innovation and Production: A Preview of the MIT Production in Economy Report.” Cambridge: MIT Press. 15 McKinsey Global Institute. 2011. “Growth and Renewal in the United States: Retooling America’s Economic Engine.” 20 Muro, Mark, and Bruce Katz. 2010. “The New ‘Cluster Moment:’ How Regional Innovation Clusters Can Foster the Next 3, Economy.” Washington: Brookings Institution. .F EB . Muro, Mark, and others. 2008. “MetroPolicy: Shaping a New Federal Partnership for a Metropolitan Nation.” Washington: Brookings Institution. A. M National Governors Association. 2012. “Redesigning State Economic Development Agencies.” Washington. ——. 2013. “’Making Our Future: What States Are Doing to Encourage Growth in Manufacturing through Innovation, 1 Entrepreneurship, and Investment.” Washington. :0 Porter, Michael. 1998. “Clusters and the New Economics of Competition.” Harvard Business Review. November-December, pp. L 12 77-90. N TI Porter, Michael, and Jan Rivkin. October 29, 2012. “What Business Should Do to Restore Competitiveness.” Fortune. U Powell, Walter, and Stine Grodal. 2005. “Networks of Innovators.” In Jan Fagerberg, David C. Mowery, and Richard R. Nelson, AS E eds., Oxford Handbook of Innovation. London: Oxford University Press. Spence, Michael, and Sandile Hlatshwayo. 2011. “The Evolving Structure of the American Economy and the Employment EL E Challenge.” Washington: Council on Foreign Relations. Wein, Michelle, Stephen Ezell, and Rob Atkinson. 2014. “The Global Mercantilist Index: A New Approach to Ranking Nations’ FO R R Trade Policies.” Washington: Information Technology and Innovation Foundation. ED Advanced Industries O Andes, Scott, and Mark Muro. February 25, 2014. “Software: America’s Hidden Manufacturing Advantage.” The Avenue. BA R Avenue. G ——. November 25, 2014. “How Does Innovation Support Lower and Middle Class Families? Look to the Price Index.” The EM Andreessen, Marc. August 20, 2011. “Why Software Is Eating the World.” Wall Street Journal. Atkinson, Robert, and Andrew McKay. 2007. “Digital Prosperity: Understanding the Economic Benefits of the Information Technology Revolution.” Washington: Information Technology and Innovation Foundation. Baily, Martin, James Manyika, and Shalabh Gupta. 2013. “U.S Productivity Growth: An Optimistic Perspective.” Washington: Brookings Institution. T H E B R O O K I N GS I NSTITUTION | SELECTED REFERENCES 63 Berger, Suzanne. 2013. Making in America: From Innovation to Market. Cambridge: MIT Press. Bonvillian, William. 2012. “Reinventing American Manufacturing: The Role of Innovation.” Innovations 7 (3): 97–125. Brynjolfsson, Erik, and Andrew McAfee. 2014. The Second Machine Age: Work, Progress, and Prosperity in a Time of Brilliant 15 Technologies. New York: W.W. Norton. 20 Carey, David, Christopher Hill, and Brian Kahin. 2012. “Strengthening Innovation in the United States.” Working Paper 1001. 3, Paris: Organization for Economic Cooperation and Development. .F EB . Castellacci, Fulvio. 2007. “Technological Paradigms, Regimes, and Trajectories: Manufacturing and Services Industries in a New Taxonomy of Sectoral Patterns of Innovation.” Oslo: Norwegian Institute of International Affairs. de Weck, Olivier, and Darci Reed. 2014. “Trends in Advanced Manufacturing Technology Innovation.” In Richard Locke and A. M Rachel Wellhausen, eds., Production in the Innovation Economy. Cambridge: MIT Press. DeVol, Ross, and Perry Wong. 1999. “America’s High Tech Economy: Growth, Development, and Risks for Metropolitan Areas.” :0 1 Los Angeles: Milken Institute. 12 DeVol, Ross, Kevin Klowden, and Armen Bedroussian. 2009. “North America’s High Tech Economy: The Geography of TI L Knowledge-Based Industries.” Los Angeles: Milken Institute. N Ezell, Stephen, and Robert Atkinson. 2011. “The Case for a National Manufacturing Strategy.” Washington: Information U Technology and Innovation Foundation. AS E Fai, Felicia, and Nicholas von Tunzelmann. 2008. “Industry-Specific Competencies and Converging Technological Systems: EL E Evidence from Patents.” Working Paper 2008-08. Bath, UK: University of Bath School of Management. George, Katy, Sree Ramaswamy, and Lou Rassey. January 2014. “Next-Shoring: A CEO’s Guide.” McKinsey Quarterly. R R Hart, David. 2012. “The Future of Manufacturing: The United States Stirs.” Innovations 7 (3): 19–28. FO Hart, David, and others. 2012. “Why America Needs a National Network for Manufacturing Innovation.” Washington: ED Information Technology and Innovation Foundation. Helpman, Elhanan, and Manuel Trajtenberg. 1996. “Diffusion of General Purpose Technologies.” Working Paper 5773. G O Cambridge, MA: National Bureau of Economic Research. BA R Hobday, Mike. 1998. “Product Complexity, Innovation, and Industrial Organization.” Research Policy 26 (6): 689-710. EM Hoffman, William. 2014. “The Shifting Currents of Bioscience Innovation.” Global Policy 5 (1): 76-84. Koten, John. June 10, 2013. “A Revolution in the Making.” Wall Street Journal. Ludwig, Helmuth, and Eric Spiegel. 2014. “America’s Real Manufacturing Advantage: A New Wave of Software Innovation Is About to Transform Industry—and Give the United States the Chance for a Lasting Edge.” strategy+business 74: 39-49. 6 4 THE BROOKINGS INSTITUTION | AMERICA’S ADVANCED I N D U ST R I ES Manyika, James, Daniel Pacthod, and Michael Park. May 2011. “Translating Innovation into U.S. Growth: An AdvancedIndustries Perspective.” McKinsey Quarterly. Manyika, James, and others. 2013. “Disruptive Technologies: Advances That Will Transform Life, Business, and the Global Economy.” McKinsey Global Institute. 20 15 McKinsey Global Institute. 2011. “Big Data: The Next Frontier for Innovation, Competition, and Productivity.” 3, Muro, Mark. June 4, 2014. “How Technology Is Transforming U.S. Manufacturing.” Wall Street Journal. .F EB . ——. October 2, 2014. “Reshoring: Strong Regions Will Determine Where, How.” The Avenue. Muro, Mark, and Siddharth Kulkarni. October 3, 2014. “Reshoring: Why It’s Not Easy.” The Avenue. A. M Muro, Mark, and Devashree Saha. September 4, 2014. “Foreign Direct Investment a Learning Channel for U.S. Business.” The Avenue. :0 1 Muro, Mark, and others. 2014. “Powering Advanced Industries, State by State.” Washington: Brookings Institution. 12 Neely, Andy. 2009. “The Servitization of Manufacturing: An Analysis of Global Trends.” Operations Management Research 2 TI L (1): 103–118. U N ——. 2011. “The Servitization of Manufacturing: Further Evidence.” Cambridge: Cambridge Service Alliance. 376. Washington: Economic Policy Institute. AS E Osterman, Paul, and Andrew Weaver. 2014. “Why Claims of Skills Shortages in Manufacturing Are Overblown.” Issue Brief EL E Pacthod, Daniel, and Michael Park. 2012. “How Can the U.S. Advanced Industries Sector Maintain Its Competitiveness?” New York: McKinsey & Co. R Parilla, Joseph, and Jesus Leal Trujillo. Forthcoming. “Skills and Innovation Strategies to Strengthen Advanced FO R Manufacturing: Lessons from Germany.” Washington: Brookings Institution. Pilat, Dirk, and Anita Woelfl. 2005. “Measuring the Interaction between Manufacturing and Services.” STI Working Paper ED 2005-05. Paris: Organisation for Economic Cooperation and Development. G O Pisano, Gary, and Willy Shih. July-August 2009. “Restoring American Competiveness.” Harvard Business Review. BA R ——. 2012. Producing Prosperity: Why America Needs a Manufacturing Renaissance. Cambridge, MA: Harvard Business Publishing. EM Porter, Michael, and James Heppelmann. November 2014. “How Smart, Connected Products Are Transforming Competition.” Harvard Business Review. President’s Council of Advisors on Science and Technology. 2011. “Ensuring American Leadership in Advanced Manufacturing.” Washington: Executive Office of the President. T H E B R O O K I N GS I NSTITUTION | SELECTED REFERENCES 65 ——. 2012. “Transformation and Opportunity: The Future of the U.S. Research Enterprise.” Washington: Executive Office of the President. ——. 2012. “Capturing Domestic Competitive Advantage in Advanced Manufacturing.” Washington: Executive Office of the President. 15 Reynolds, Elisabeth. 2011. “The Changing Geography of Bio-Manufacturing.” Working Paper 11-001. Cambridge, MA: MIT 20 Industrial Performance Center. .F EB . 3, Rothwell, Jonathan. 2013. “The Hidden STEM Economy.” Washington: Brookings Institution. Shih, Willy. August 2014. “What It Takes to Reshore Manufacturing Successfully.” MIT/Sloan Management Review. Shipp, Stephanie, and others. 2012. “Emerging Global Trends in Advanced Manufacturing.” Alexandria, VA: Institute for A. M Defense Analysis. :0 Global Automotive Industry.” Journal of Economic Geography 8 (3): 297-321. 1 Sturgeon, Timothy, Johannes van Biesbroeck, and Gary Gereffi. 2008. “Value Chains, Networks, and Clusters: Reframing the 12 Tassey, Gregory. 2010. “Rationales and Mechanisms for Revitalizing U.S. Manufacturing R&D Strategies.” Journal of TI L Technology Transfer 35 (3): 283–333. N ——. 2014. “Competing in Advanced Manufacturing: The Need for Improved Growth Models and Policies.” Journal of Economic U Perspectives 28 (1): 27–48. AS E ——. 2015. “The Economic Nature of Knowledge Embodied in Standards for Technology-Based Industries.” In Cristiano EL E Antonelli and Albert Link, eds., Routledge Handbook of the Economics of Knowledge. Oxford: Routledge. R van Agtmael, Antoine, and Fred Bakker. March 28, 2014. “Made in the U.S.A (Again).” Foreign Policy. FO R Policy Accenture, Burning Glass, and Harvard Business School. 2014. “Bridge the Gap: Rebuilding America’s Middle Skills.” ED Cambridge: Harvard Business School. O Andes, Scott, Mark Muro, and Matthew Stepp. 2014. “Going Local: Connecting the National Labs to Their Regions to Maximize BA R G Innovation and Growth.” Washington: Brookings Institution. Carlson, Pete, and others. 2013. “Raising the Bar on Skill Development: Findings from the Front.” New York: Regional EM Prosperity Project. Ezell, Stephen, and Robert Atkinson. 2012. “Fifty Ways to Leave Your Competitiveness Woes Behind: A National Traded Sector Strategy.” Washington: Information Technology and Innovation Foundation. Institute for a Competitive Inner City. 2014. “The Missing Link: Clusters, Small Business Growth and Vibrant Urban Economies.” Roxbury, MA. 6 6 THE BROOKINGS INSTITUTION | AMERICA’S ADVANCED I N D U ST R I ES Lee, Jessica A., and Mark Muro. 2012. “Cut to Invest: Make the Research and Experimentation Tax Credit Permanent.” Washington: Brookings Institution. Lee, Jessica A., and others. 2014. “Cracking the Code on STEM: A People Strategy for Nevada’s Economy.” Washington: Muro, Mark, and Kenan Fikri. 2011. “Job Creation on a Budget: How Regional Industry Clusters Can Add Jobs, Bolster 20 Entrepreneurship, and Spark Innovation.” Washington: Brookings Institution. 15 Brookings Institution. 3, Muro, Mark, Scott Andes, and Matthew Stepp. September 11, 2014. “Department of Energy’s National Labs Can Also be .F EB . Regional Hubs.” The Avenue. National Governors Association. 2013. “Making Our Future: What States Are Doing to Encourage Growth in Manufacturing A. M Through Innovation, Entrepreneurship, and Investment.” Washington. ——. 2014. “America Works: Education and Training for Tomorrow’s Jobs—An Action Guide for Governors.” Washington. 1 National Science and Technology Council. 2012. “A National Strategy for Advanced Manufacturing.” Washington: Executive 12 :0 Office of the President. L Organisation for Economic Cooperation and Development. 2013. “Raising the Returns to Innovation: Structural Policies for a N TI Knowledge-Based Economy.” OECD Economics Department Policy Notes 17. Paris. U President’s Council of Advisors on Science and Technology. 2013. “National Network for Manufacturing Innovation: A AS E Preliminary Design.” Washington: Executive Office of the President. President’s Council of Economic Advisers. 2013. “Economic Report of the President.” Washington: United States Government EL E Printing Office. Saha, Devashree, and Mark Muro. 2013. “Cut to Invest: Create a Nationwide Network of Advanced Industries Innovation R R Hubs.” Washington: Brookings Institution. FO Stepp, Matthew, and others. 2013. “Turning the Page: Reimagining the National Labs in the 21st Century Innovation Economy.” Washington: Information Technology and Innovation Foundation, Center for American Progress, and Heritage ED Foundation. O Tassey, Gregory. 2010. “Rationales and Mechanisms for Revitalizing U.S. Manufacturing R&D Strategies.” Journal of BA R G Technology Transfer 35 (3): 283-333. –—. 2014. “Competing in Advanced Manufacturing: The New for Improved Growth Models and Policies.” Journal of Economic EM Perspectives 28 (1): 27–48. Turner, Mark, and others. 2013. “Evaluation of the U.S. Small Business Administration’s Regional Clusters Initiative: Two Year Report.” Washington: U.S. Small Business Administration. U.S. Congress Joint Economic Committee. 2012. “STEM Education: Preparing for the Jobs of the Future.” Washington. T H E B R O O K I N GS I NSTITUTION | ENDNOTES 67 ENDNOTES 1. In 2000, the U.S. maintained a $5 billion trade surplus in advanced technology products, which, as the name suggests, is a product-based rather than an industry-based account. Since then, the country has run a trade deficit each year on such goods. By 2013, the deficit reached $81 billion. U.S. Census For thorough discussions of the varied nature of particular manufacturing industries, see Susan Helper, Timothy Krueger, and Howard Wial, “Why Does 20 2. 15 Bureau, Foreign Trade Division, “Trade in Goods with Advance Technology Products” (2014). Manufacturing Matter? Which Manufacturing Matters? A Policy Framework” (Washington: Brookings Institution, 2012); James Manyika and others, 3, “Manufacturing the Future: The Next Era of Global Growth and Innovation” (San Francisco: McKinsey Global Institute, 2012). For a parallel discussion on 3. .F EB . services, see J. Bradford Jensen, “Global Trade in Services: Fear, Facts, and Offshoring” (Washington: Peterson Institute for International Economics, 2011). More than one-half of all U.S. manufacturers now offer services as well as goods. On the topic generally, see Gregory Tassey, “Competing in Advanced Manufacturing: The Need for Improved Growth Models and Policies,” Journal of Economic Perspectives 28 (1) (2014): 27–48; Manyika and others, A. M “Manufacturing the Future.” Tassey refers to the growing link between services and manufacturing as the “Fourth Industrial Revolution” and notes that economies of scale have been replaced by economies of scope in commercial importance. In other words, firms now derive greater value by grouping a variety of products and services together than by specializing in a single product and achieving scale. The trend has been underway for more than a :0 1 decade in the United States, and advanced industries have been leading the way. Increasingly firms are protecting their core strengths by offering integrated “end-to-end” solutions that blur the distinction between their specific product and their aftermarket service. Moreover, many product manufactur- 12 ers are able to capture higher margins by renting their capital-intensive machinery as a service platform instead. Rolls Royce, for example, has redesigned L its airplane engine business from the manufacturing and sale of units to the manufacturing and leasing “hours” of flight. In doing so, the company is TI responsible for services such as maintenance and repairs on the engine. The diffusion of services as an accessory to products (and vice versa) allows firms 4. U N to exist in an ever increasing number of industry categories even if their products do not. See, for example, Gary Pisano and Willy Shih, “Restoring American Competitiveness,” Harvard Business Review (July 2009); Andy Grove, “How America AS E Can Create Jobs,” BusinessWeek, July 1, 2010; Gregory Tassey, “Rationales and Mechanisms for Revitalizing U.S. Manufacturing R&D Strategies,” Journal of Technology Transfer 35 (3) (2010): 283-333; Manyika and others, “Manufacturing the Future”; Suzanne Berger, Making in America: From Innovation to 5. EL E Market (Cambridge, MA: MIT Press, 2013). For example, recent production methods known as continuous manufacturing dispatch the traditional R&D-design-production sequence with a far more R iterative process in which design and improvements occur at the same time as production or service delivery. Doing so, however, requires interplay R between engineers, designers, and shop floor production workers. Although product life cycles have grown shorter, bringing new technologies to market FO takes longer. See Tassey, “Rationales and Mechanisms”; and Gregory Tassey, “Beyond the Business Cycle: The Need for a Technology-based Growth 6. ED Strategy” (Washington: National Institute of Standards and Technology, 2012). Embedded software has not only transformed the physical composition of many traditional products (e.g. vehicle tires, cell phones, and traffic cameras) but O is also replacing physical objects. For more discussions of the digitalization of the economy see Robert Atkinson and Andrew McKay, “Digital Prosperity: G Understanding the Economic Benefits of the Information Technology Revolution” (Washington: Information Technology and Innovation Foundation, BA R 2007); Marc Andreessen, “Why Software is Eating the World,” Wall Street Journal, August 20, 2011; Olivier de Weck and others, “Trends in Advanced Manufacturing Technology Innovation” (Boston: MIT’s Production in the Innovation Economy, 2013); James Manyika and others, “Disruptive Technologies: Advances That Will Transform Life, Business, and the Global Economy” (San Francisco: McKinsey Global Institute, 2013); Erik Brynjolfsson and Andrew EM McAfee, The Second Machine Age: Work, Progress, and Prosperity in a Time of Brilliant Technologies (New York: W.W. Norton, 2014) 7. Whether innovation is accelerating or has entered a period of slower growth has become a topic of substantial debate. Economists Tyler Cowan and Robert Gordon believe that the U.S. economy has entered a long period of stagnation because the opportunity for productivity growth achieved by information technology is much lower than that of the large-scale innovations achieved in the postwar era. See Tyler Cowan, The Great Stagnation: How America Ate All the Low-Hanging Fruit of Modern History, Got Sick, and Will (Eventually) Feel Better Again (New York: Dutton, 2011); Robert Gordon, “Is U.S. Economic Growth Over? Faltering Innovation Confronts the Six Headwinds.” Working Paper 18315 (Cambridge, MA: National Bureau of Economic Research, 2012). By contrast, economist Brynjolfsson and technologist McAfee have made the opposite argument and believe the returns of the IT revolution are accelerating 6 8 THE BROOKINGS INSTITUTION | AMERICA’S ADVANCED I N D U ST R I ES and “recombining” and will dramatically transform the U.S. economy. See Brynjolfsson and McAfee, The Second Machine Age. The reality is likely to be somewhere in the middle. Certain technology categories such as information technology and computing power seem to be growing at their historical fast pace while other areas, such as the life sciences, have seen a decline in R&D productivity. For a compelling review of new technologies and the potential associated with their application, see Manyika and others, “Disruptive Technologies.” 9. See Organisation for Economic Co-operation and Development, “Measuring Trade in Value Added: An OECD-WTO Joint Initiative” (2013). 10. New research shows that the connectedness of firms through intermediate goods can be a source of productivity spillovers. In particular, Badinger and 20 15 8. 3, Egger find that firms that share similar characteristics like R&D or product categories see increases in their productivity when they are linked within supply .F EB . chains. See Harald Badinger and Peter Egger, “Intra- and Inter-Industry Productivity Spillovers in OECD Manufacturing: A Spatial Econometric Perspective.” Working Paper 2181 (CESIFO, 2008). Also, in part because of high wages, Moretti predicts that every “high-tech” job supports five jobs elsewhere in the economy. See Enrico Moretti, The New Geography of Jobs (New York: Houghton Mifflin Harcourt, 2012). Stephen Ezell and Robert Atkinson, “The Case for a National Manufacturing Strategy” (Washington: Information Technology and Innovation Foundation, A. M 11. 2011). 1 Increasing advanced manufacturing and services exports offers the most plausible strategy for ameliorating the U.S. trade deficit. See Martin Baily and :0 12. Robert Lawrence, “What Happened to the Great U.S. Job Machine? The Role of Trade and Electronic Offshoring,” Brookings Papers on Economic Activity 2 This paragraph reflects framings from the President’s Council of Advisors on Science and Technology, “Report to the President on Capturing Domestic TI 13. L 12 (2004): 211-284. See also Helper, Krueger, and Wial, “Why Does Manufacturing Matter?” 14. U N Competitive advantage in Advanced Manufacturing” (Washington: Executive Office of the President, 2012). Significant research has documented that the quality of consumer durables has been increasing. See, for example, Mark Bils, “Do Higher Prices for New AS E Goods Reflect Quality Growth or Inflation?” Quarterly Journal of Economics 124 (2) (2009): 637-675. See also Scott Andes and Mark Muro, “How Does 15. EL E Innovation Support Lower- and Middle-Class Families? Look to the Price Index,” The Avenue, November 25, 2014. Economists have long argued that technology innovation is the only method for long-run growth because additional investment in current-generation capital and labor will always have diminishing returns. This implies that while poorer countries can grow rapidly because they have yet to saturate their R economy with high levels of capital and labor, higher-income countries must rely on innovation to better use workers and machinery to increase produc- R tivity. Robert Solow, “A Contribution to the Theory of Economic Growth,” Quarterly Journal of Economics 70 (1) (1956): 64-94; Paul Romer, “Endogenous FO Technological Change,” Journal of Political Economy 98 (5) (1990): S71-S102. For a thorough discussion of why innovation matters to firms, regions, and nations, see Robert Atkinson and Howard Wial, “Boosting Productivity, Innovation, and Growth Through a National Innovation Foundation” (Washington: To be sure, not all innovation is captured in official R&D figures, which do not count branding, marketing, or management approaches. Nevertheless, signifi- O 16. ED Brookings Institution, 2008). G cant research confirms that R&D investment continues to be strongly associated with product and process “innovation” both at the firm and industry lev- BA R els. See National Science Foundation, “Science and Engineering Indicators 2014” (2014); OECD: “R&D Tax Incentives: Rationale, Design, Evaluation” (2010). 17. R&D is associated with a number of positive economic outcomes for firms. Several papers find consistent R&D funding can help firms overcome the transi- EM tory profits of single innovations by supporting a steady stream of innovation. See G. Barczak, “New Product Strategy, Structure, Process, and Performance in Telecommunications Industry,” Journal of Product Innovation Management 12 (3) (1995): 224-234. Other studies confirm that R&D’s contribution to the development of innovative products and processes can be a critical determinant of firm performance. See, for example, R.A Bettis and Michael Hitt, “The New Competitive Landscape,” Strategic Management Journal 16 (1995): 7–19; C. Helfat and M.A. Peteraf, “The Dynamic Resources-Based View: Capabilities Lifecycle,” Strategic Management Journal 24 (10) (2003): 997-1010. Several studies have found specific links between R&D spending and the emergence of new product lines in the pharmaceutical industry. Paul Roberts, “Product Innovation, Product-Market Competition and Persistent Profitability in the T H E B R O O K I N GS I NSTITUTION | ENDNOTES 69 Pharmaceutical Industry,” Strategic Management Journal 20 (7): 655–670. Similar studies show R&D increases the number of patents in the computer and chemical manufacturing industries. See J. Hagedoorn and G. Duysters, “The Effects of Mergers and Acquisitions on the Technology Performance of Companies in a High-Tech Environment,” Technology Analysis and Strategic Management 14 (1) (2002): 67-85. Other studies have found that although R&D influences invention (defined as patents) and innovation (defined as new product lines), its influence on product lines is much more strongly related to firm performance. See Kendall Artz and others, “A Longitudinal Study of the Impact of R&D, Patents, and Product Innovation on Firm Performance,” Journal of 15 Product Development and Management Association 27 (2010): 725–740. David Audretsch, “Agglomeration and the Location of Innovative Activity,” Oxford Review of Economic Policy 14 (2) (1998): 18-29. 19. A positive economic “spillover,” or externality, is any social benefit created by an economic entity that the originator cannot reap in profits. A significant 3, 20 18. .F EB . body of research shows that the benefits of these spillovers radiate far beyond individual companies and industries and provide major benefits to society. For example, Jones and Williams find that the social rate of return for R&D is 30 percent, which, according to their calculations, implies that R&D levels would need to be four times higher to achieve society’s optimal spillover benefits. See Charles Jones and John Williams, “Measuring the Social Return to R&D,” Quarterly Journal of Economics 113 (4) (1998): 1119–1135. Kortum and Griliches each estimate that the social rate of return from R&D is three times A. M higher than the private rate of return. See Samuel Kortum, “Research, Patenting, and Technological Change,” Econometrica 65 (6) (1997): 1389-1419; Zvi Griliches, “The Search for R&D Spillovers,” Scandinavian Journal of Economics 94 (1992): 29-47. In terms of how advanced industry innovation gains spread through the economy, the most obvious mechanism is through direct imitation. For example, by August 2010, just seven months after Apple unveiled the :0 1 first iPad, there were over 32 iPad-like devices on the market in the United States. Although patents protect some of the most critical elements of new inventions, they are generally unable to protect against re-engineering and slight adjustments from competing firms. This may hurt the bottom line of 12 inventing firms, but it is largely good for the economy because it creates competition, supports incremental improvements to technology, and reduces L prices. In this vein, Segerstrom shows that imitation is a critical source of economic growth. See Paul Segerstrom, “Innovation, Imitation, and Economic TI Growth.” Econometrics and Economic Theory Paper 8818 (Michigan State University, 1990). Another channel for the spread of innovation from advanced N firms into the rest of the economy is the movement of skilled workers among employers across sectors. Tassey explains that much of the design and U production intellectual property of a firm exists in the form of knowledge that workers accrue while on the job. When those workers go to other firms, they take that knowledge with them. Tambe and Hitt find that job-hopping among IT workers has a particularly powerful impact across sectors. See Tassey, EL E Management Science 60 (2) (2014): 338-355. AS E “Competing in Advanced Manufacturing”; Prasanna Tambe and Lorin Hitt, “Job Hopping, Information Technology Spillovers, and Productivity Growth,” 20. “General purpose technologies” are different from other technologies in their ability to significantly increase productivity outside of the industry in which they originate. For example, in the early years of IT, the majority of productivity gains to the U.S. economy came from the IT–producing sector and firms R such as Microsoft and IBM. However, by the mid-1990s, as productivity growth in the United States exceeded 3 percent per year, the bulk of the growth R gains took place in the IT–using rather than in the IT–producing sector. In particular, U.S. service industries were adopting IT and because services are FO the largest portion of the economy, overall productivity grew rapidly. For discussions of general purpose technologies and their broad impact, see Tim Bresnahan and Manuel Trajtenberg, “General Purpose Technologies: Engines of Growth?” Journal of Econometrics 65 (1995): 83–108; Richard Lipsey, ED Economic Transformations: General Purpose Technologies and Long Term Growth (Oxford: Oxford University Press, 2005). Also see Robert Atkinson, Long David Byrne, Stephen Oliner, and Daniel Sichel, “Is the Information Technology Revolution Over?” Working Paper 2013-36 (Washington, DC: Federal Reserve G 21. O Waves of Innovation that Power Cycles of Growth (New York: Edward Elgar, 2005). BA R Board, 2013); Erik Brynjolfsson and Adam Saunders, Wired for Innovation: How Information Technology is Reshaping the Economy (Cambridge, MA: MIT Press, 2010). See also, among other publications, K. J. Stiroh, “Information Technology and the U.S. Productivity Revival: What Do the Industry Data Say?” American Economic Review 92 (5) (2002): 1559–1576; Dale Jorgenson, Mun S. Ho, and Kevin Stiroh, “Will the U.S. Productivity Resurgence Continue?” EM Current Issues in Economics and Finance 10 (13) (2004): 1-7; Dale Jorgenson, Mun S. Ho, and Kevin Stiroh, “A Retrospective Look at the U.S. Productivity Resurgence,” Journal of Economic Perspectives 22 (1) (2008): 3-24. 22. Information technology, new drugs, bioengineered seeds, cheaper materials, and new energy sources (to name a few) have all contributed to the U.S. and global economies far beyond what their industries’ shares of total GDP suggest. In the pharmaceutical industry, Lichtenberg and Pettersson found that drug innovations between 1997 and 2010 extended the life expectancy of the average Swedish citizen by six months at a cost of just $109 per year. See 70 THE BROOKINGS INSTITUTION | AMERICA’S ADVANCED I N D U ST R I ES Frank Lichtenberg and Billie Pettersson, “The Impact of Pharmaceutical Innovation on Longevity and Medical Expenditure in Sweden, 1997-2012: Evidence from Longitudinal, Disease-Level Data.” Working Paper 3894 (Munich: CESifo, 2012). In material science, McKinsey & Co. predicts that the advent of lighter materials will reduce the cost of the current fleet of commercial airplanes by 30 percent. See McKinsey & Co., “Lightweight, Heavy Impact: How Carbon Fiber and Other Lightweight Materials Will Develop Across Industries and Specifically in Automotive” (San Francisco, 2013). Finally, the economic benefits of genetically modified crops to U.S. agriculture during the last 15 years are estimated to equal $98.2 billion. See Graham Brookes and Peter Barfoot, “GM 15 Crops: Global Socio-Economic and Environmental Impacts 1996-2011” (London: PG Economics, 2013). 20 23. Ibid. 3, 24. See Anthony Carnevale, Nicole Smith, and Michelle Melton, “STEM: Science, Technology, Engineering, Mathematics” (Washington: Georgetown University .F EB . Center on Education and the Workforce, 2011); Jonathan Rothwell, “The Hidden STEM Economy” (Washington: Brookings Institution, 2013). 25. Rothwell, “Hidden STEM Economy.” See also Philip Toner, Tim Turpin, and Richard Woolley, “The Role and Contribution of Tradespeople and Technicians in Australian Research and Development: An Exploratory Study” (Sydney: Center for Industry and Innovation Studies, 2010); Phillip Toner, “Tradespeople and A. M Technicians in Innovation.” In Penelope Curtin, John Stanwick, and Francesca Beddie, eds., Fostering Enterprise: The Innovation and Skills Nexus—Research Readings (Adelaide: National Center for Vocational Education Research, 2012). 12 Ibid. L 27. :0 1 26. Based on Brookings analysis of advanced industry occupations. See chapter 4 of this report. Carnevale, Smith, and Melton, “STEM.” TI 28. See, for example, Mark Muro and Bruce Katz, “The New Cluster Moment: How Regional Innovation Clusters Can Foster the Next Economy” (Washington: N Brookings Institution, 2010). See also S. Rosenthal and W. Strange, “Evidence on the Nature and Sources of Agglomeration Economies.” In J.V. Henderson U and J.F. Thisse, eds., Handbook of Regional and Urban Economics, vol. 4 (Amsterdam, North-Holland: 2004); MaryAnn Feldman and David Audretsch, “Innovation in Cities: Science-based Diversity, Specialization, and Localized Competition,” European Economic Review 43 (1999): 409–429; and Tassey, AS E “Competing in Advanced Manufacturing.” EL E 29. Jonathan Rothwell and others have noted the association of metropolitan patenting levels with numerous other indicators of regional prosperity, including higher productivity growth, lower unemployment rates, and the creation of more publicly traded companies. See Jonathan Rothwell and others, “Patenting Prosperity: Invention and Economic Performance in the United States and its Metropolitan Areas” (Washington: Brookings Institution, 2013). Rothwell R has also demonstrated that STEM-oriented metropolitan economies exhibit stronger job growth and employment rates, higher wages, and lower income FO R inequality than other metro areas. See Rothwell, “Hidden STEM Economy.” 30. Numerous commentators have noticed the phenomenon of industry convergence driven by technology convergence. See, for example, Christopher ED Barnatt’s discussion of the blurring of manufacturing, medicine, and media. Christopher Barnatt, “The New Industrial Convergence,” (blog post) www. ExplainingTheFuture.com. Delgado, Porter, and Stern, meanwhile, show empirically that the agglomeration of related industries into strong clusters in a O region not only improves the economic performance of existing industries but also matters significantly for the emergence of new industries in a region. G Mercedes Delgado, Michael Porter, and Scott Stern, “Clusters, Convergence, and Economic Performance.” Working Paper 18250 (Cambridge, MA: National BA R Bureau of Economic Research, 2012). See Bruce Katz and Julie Wagner, “The Rise of Innovation Districts: A New Geography of Innovation in America” (Washington: Brookings Institution, 2014). EM 31. 32. A number of other authors have used similar methods to define the high-tech section of the economy. Hecker evaluates the high technology sector of the economy using similar terms of R&D and workforce skills. Daniel Hecker, “High-Technology Employment: A Broader View,” Monthly Labor Review (June 1999):18-28. The Milken Institute’s 1999 and 2009 reports on “America’s High-Tech Economy” and “North America’s High-Tech Economy,” respectively, include a broader number of services in the high-tech sector, but do not include as many manufacturing industries as we do here. See Ross DeVol, “America’s High-Tech Economy: Growth, Development, and Risks for Metropolitan Areas” (San Francisco: Milken Institute, 1999); Ross DeVol and others, “North America’s High Tech Economy: The Geography of Knowledge-Based Industries” (San Francisco: Milken Institute, 2009). T H E B R O O K I N GS I NSTITUTION | ENDNOTES 71 33. Romer, “Endogenous Technological Change;” Solow, “A Contribution to the Theory of Economic Growth;” and Joseph Schumpeter, The Theory of Economic Development (Cambridge, MA: Harvard University Press, 1934). 34. Gene Grossman and Elhanan Helpman, Innovation and Growth in the Global Economy (Cambridge, MA: MIT Press, 1991); Paul Romer, “Increasing Returns and Long-Run Growth,” Journal of Political Economy 94 (5) (1986): 1002-1037; and Philippe Aghion and Peter Howitt, “A Model of Growth Through Creative 15 Destruction,” Econometrica 60 (2) (1992): 323-351. 20 35. See, among others, Toner, “Tradespeople and Technicians in Innovation”; Toner and others, “The Role and Contribution of Tradespeople;” and Philip Toner, 3, “Innovation and Vocational Education,” Educational and Labor Relations Review 21 (2) (2010): 75–98. .F EB . 36. Frank Lichtenberg, “R&D Investment and International Productivity Differences.” Working Paper 4161 (Cambridge, MA: National Bureau of Economic Research, 1992); Manuel Trajtenberg, Economic Analysis of Product Innovation (Cambridge: Cambridge University Press, 1990); Griliches, “Search for R&D Spillovers;” and David Audretsch and MaryAnn Feldman, “R&D Spillovers and the Geography of Innovation and Production,” American Economic Review 86 37. A. M (3) (1996): 630-640. The BRDIS offers a more complete measure of industry spending on R&D than other sources because it provides information at the four-digit NAICS indus- 12 38. See Rothwell, “Hidden STEM Economy,” for a definition and application of this approach. :0 1 try code level and categorizes R&D spending by lines of business rather than establishment industry classification. L 39. See, for example, DeVol, “America’s High-Tech Economy;” Daniel Hecker, “High-Technology Employment: A NAICS-Based Update,” Monthly Labor Review N TI (July 2005): 57–72; and Helper, Krueger, and Wial, “Locating American Manufacturing.” U 40. Across OECD countries the correlation between R&D as a share of GDP and GDP per worker is 0.35, but it is 0.69 for R&D per worker and GDP per worker. The correlations are 0.69 versus 0.50. The meth for determining patents by industry is discussed in online appendix accompanying this report. EL E 41. AS E The correlation with patents per worker is also higher using R&D per worker (0.78 versus 0.73). 42. Rothwell, “Hidden STEM Economy.” R 43. The advanced industries sector is defined as the group of 50, four-digit industries that meet the criteria enumerated in this report in the latest year for R which data are available. Accordingly, the industries that compose the sector do not change over time; any time series reports the history of the advanced FO industries sector as defined today. As it happens, most industries that meet the advanced industry criteria today would also have met the criteria in 1980. ED 44. Petroleum and coal products manufacturing, while closely related to and on many economic indicators performing like an energy industry, is nevertheless O classified according to its NAICS code as a manufacturing industry. G 45. These figures are derived from the Bureau of Economic Analysis’ 2007 Input-Output Use Tables for values and Moody’s Analytics for employment. We BA R converted 2007 prices into 2013 prices using the BEA’s GDP price index. 46. Nationally, the computer and electronics manufacturing industries have achieved the highest productivity growth in recent years. Economists have attrib- EM uted some of this extraordinary growth (roughly 20 percent per year) to data collection problems related to the importation of component parts. Although this documented phenomenon does likely overstate advanced industry productivity levels and growth to some extent, this critique does not apply to advanced services and other advanced manufacturing sectors, which have also seen very high productivity growth. Forty-six of the 50 advanced industries experienced productivity growth above rates in other industry (1.3 percent) from 1980 to 2013. Among the industries with 3.5 percent annual real productivity growth or higher are wireless telecommunications, satellite telecommunications, and software publishing. 72 THE BROOKINGS INSTITUTION | AMERICA’S ADVANCED I N D U ST R I ES 47. Total compensation includes, in addition to wages and benefits, business and property owner incomes, dividends, and government transfers. 48. Much of the advanced industry earnings premium is accounted for by education, experience, and gender. The premium falls to 38 percent after adjusting for these factors. This is true both within and across metropolitan areas, so the premium cannot be attributed to regional cost of living differences. Adding occupation to the list of controls lowers the premium to 23 percent. Still, this is remarkable. Workers in the same type of job, with the same education and 15 experience are paid 23 percent higher, on average, if they are in the advanced industries sector. The premium is high at every educational level. 20 49. Advanced service industry wages rose 91 percent from 1975 to 2013. Salaries in advanced energy industries grew by 81 percent. Even advanced manufac- 51. .F EB . 50. Orientation is determined by location quotients, details of which can be found in the online appendix accompanying this report. 3, turing saw 42 percent salary growth, far above the 15 percent growth in other manufacturing industries. Specialization defined as a location quotient greater than 2.0, meaning that, as a share of total area employment, the industry is twice as large locally as it A. M is nationally. 52. Specialization defined as a location quotient greater than 2.0, meaning that, as a share of total area employment, the industry is twice as large locally as it :0 1 is nationally. 53. This finding is based on a regression analysis using a metropolitan panel of 2012 advanced industry employment shares on 1980 advanced industry 12 employment shares, 1980 bachelor’s degree attainment rates, the number of university research-based doctoral programs, the number of patents granted L to local residents from 1976 to 1980, population in 1980, and state fixed effects. Bachelor’s degree attainment, patenting, research universities, and previ- TI ous advanced industry employment were all statistically significant. A dummy variable for right-to-work state was significant if state fixed effects were U N dropped. AS E 54. Data are from OECD. See Methods section for description of sources. 55. OECD data do not contain observations from the Republic of Korea (South Korea) in employment tables but do so in output (GDP) tables, hence the expan- EL E sion to 15 observations. 56. We estimate that advanced industries generate two-thirds of U.S. royalty income. To arrive at that number, we examined Internal Revenue Service (IRS) R data on royalty payments by industry for foreign-owned companies operating in the United States; 69 percent of such payments were registered by 57. FO R advanced industries. We assume that the ratio holds for domestically owned companies as well. For a discussion of and national benchmarking of international trade barriers across nations, see Michelle Wein, Stephen Ezell, and Robert Atkinson, “The ED Global Mercantilist Index: A New Approach to Ranking Nations’ Trade Policies” (Washington: Information Technology and Innovation Foundation, 2014). O 58. A patent, by legislative definition, must be novel and useful and goes through a rigorous approval process at the U.S. Patent and Trademark Office G (USPTO). Patents vary greatly in value, but there is strong evidence that, on average, they signal economically valuable inventions and are often the culmi- BA R nation of formal R&D. For that reason they are an accepted proxy for innovative activity. For more see Rothwell and others, “Patenting Prosperity.” EM 59. Rothwell and others, “Patenting Prosperity.” 60. Software patenting is controversial because applications are often written for ambiguous functions rather than for specific methods for solving technical problems. With that said, software patents appear to represent actually valuable inventions in most cases. See Mark Lemley, “Software Patents and the Return of Functional Claiming.” Working Paper 2117302 (Stanford Public Law, 2012) and Rothwell and others, “Patenting Prosperity.” T H E B R O O K I N GS I NSTITUTION | ENDNOTES 73 61. Calculated using the Bureau of Labor Statistics’ Producer Price Index. For a detailed discussion of the methodology, see the online appendix accompanying this report. 62. Andes and Muro, “Look to the Price Index.” 63. Unless otherwise noted, all international comparisons are calculated using OECD data. For a detailed discussion of sources and methodologies, see the 20 15 online appendix accompanying this report. 64. The two higher-quality patent measures are triadic patents—those granted by the European and Japanese patent offices and with applications into or 3, approval by the U.S. Patent and Trademark Office as well—and Patent Cooperation Treaty applications—a universal application that signals intent to seek .F EB . intellectual property protection by multiple offices. The OECD collects data on both measures. For a detailed discussion of sources and methods, see the online appendix accompanying this report. A. M 65. Michael S. Teitelbaum, Falling Behind? Boom, Bust and the Global Race for Scientific Talent (Princeton University Press, 2014). 66. For example, in terms of average number of citations in scientific journals adjusted for field, the world’s top 16 universities are all located in the United States. Such research universities draw top scientists from around the world, so much so that 39 percent of the most highly cited journal articles are :0 1 published by scholars at U.S. universities. The quality of research universities was assessed using the Leiden University Center for Science and Technology Studies (CWTS) ranking, which is recognized to offer the most straightforward and comprehensive assessment of academic research quality and output The nine countries are, in order, Switzerland, Denmark, Netherlands, Sweden, Singapore, United Kingdom, Israel, Canada, and Belgium. N TI 67. L 12 from around the world. For a detailed discussion of sources and methodologies, see the online appendix accompanying this report. U 68. Data collected by the OECD. For a detailed discussion of sources and methodologies, see the online appendix accompanying this report. AS E 69. Job openings data by industry and occupation are obtained from Burning Glass, a workforce information company that collects detailed information on nearly all internet-based job advertisements. For a detailed description of the data and methods underlying the analysis that follows, see the online appen- EL E dix accompanying this report and Jonathan Rothwell, “Still Searching: Job Vacancies and STEM Skills” (Washington: Brookings Institution, 2014). 70. See U.S. Department of Education, National Center for Education Statistics. On the Program for International Student Assessment (PISA) exams, which R assess students across countries at the eighth grade level, the United States ranks below the OECD average on mathematics. On the OECD’s Programme R for the International Assessment of Adult Competencies (PIAAC) exams, the United States ranks 21st of 23rd on adult numeracy. The United States does FO perform well on the Trends in International Mathematics and Science Study (TIMSS), which also assesses student competencies but is more directly linked to school curriculum than PISA. The latter emphasizes more applied knowledge. For a comparison of PISA and TIMSS, see Tom Loveless, “International O Data from the OECD. STEM fields include the life, physical, math, and computer sciences as well as engineering. G 71. ED Tests Are Not All the Same” (Washington: Brookings Institution, 2013). BA R 72. This age cohort is used to approximate a country’s STEM graduation rate, or the relative volume at which it is graduating STEM-trained workers. 73. This passage draws on discussion in Manyika and others, “Manufacturing the Future,” and Manyika and others, “Disruptive Technologies.” See also Mark EM Muro and others, “Launch! Taking Colorado’s Space Economy to the Next Level” (Washington: Brookings Institution, 2012); Mark Muro and others, “Drive! Moving Tennessee’s Automotive Sector Up the Value Chain” (Washington: Brookings Institution, 2013). 74. General Electric Corp., “Global Innovation Barometer” (2014). 75. This paragraph and the one following it draw on Stephen Ezell and Robert Atkinson, “Fifty Ways to Leave Your Competitiveness Woes Behind: A National 74 THE BROOKINGS INSTITUTION | AMERICA’S ADVANCED I N D U ST R I ES Traded Sector Competitiveness Strategy” (Washington: Information Technology and Innovation Foundation, 2012). See also Mark Muro and others, “Powering Advanced Industries State by State” (Washington: Brookings Institution, 2014); Muro and others, “Launch!” and “Drive!” 76. For a suggestions on how to reform the corporate tax code to maximize innovation-led, productive economic growth, see Robert Atkinson, “Effective Corporate Tax Reform in the Global Innovation Economy” (Washington: Information Technology and Innovation Foundation, 2009); Martin Neil Baily and For Brookings’ writings on the metropolitan perspective to these issues, see Alan Berube and Joseph Parilla, “Metro Trade: Cities Return to Their Roots in 20 77. 15 Barry Bosworth, “U.S. Manufacturing: Understanding Its Past and Its Potential Future,” Journal of Economic Perspectives 28 (1) (2014): 3-26. the Global Economy” (Washington: Brookings Institution, 2012); Devashree Saha, Kenan Fikri, and Nick Marchio, “FDI in U.S. Metro Areas: The Geography of .F EB . How U.S. Metros Lead National Export Growth and Boost Competitiveness” (Washington: Brookings Institution, 2010). 3, Jobs in Foreign-Owned Establishments” (Washington: Brookings Institution, 2014); and Emilia Istrate, Jonathan Rothwell, and Bruce Katz, “Export Nation: 78. For a review of nations’ trade barriers and needed U.S. responses see Wein, Ezell, and Atkinson, “Global Mercantilist Index.” A. M 79. Imperfections in the market for technology-intensive small business lending provide the rationale for targeted interventions by the public sector. The OECD identifies several financing instruments that public policy can support as particularly effective in promoting innovation: bank loans, grants and subsidies, angel investment, venture capital, corporate venturing, crowd-funding, and tax incentives. Organisation for Economic Co-operation and Development, “STI :0 1 Policy Profiles: Building Competencies and Capacity to Innovate.” In Science, Technology, and Industry Outlook 2012 (2012). 12 80. Brookings scholars Robert Puentes and Adie Tomer have built a large body of work articulating the critical role of infrastructure in the efficient and pro- L ductive working of modern economies and outlining the priorities of a national infrastructure strategy. See, for starters, Robert Puentes and others, “The TI Way Forward: A New Economic Vision for America’s Infrastructure” (New York: Kohlberg Kravis Roberts & Co., 2014); Adie Tomer, Joseph Kane, and Robert N Puentes, “Metro Freight: The Global Goods Trade that Moves Metro Economies” (Washington: Brookings Institution, 2013); Adie Tomer, Robert Puentes, and U Zachary Neal, “Global Gateways: International Aviation in Metropolitan America” (Washington: Brookings Institution, 2012); Robert Puentes, “A Bridge to 81. AS E Somewhere: Rethinking American Transportation for the 21st Century” (Washington: Brookings Institution, 2008). The National Governors Association (NGA) captures several recent related trends in best economic development practice among states, including the EL E strengthening of state and regional collaboration and the targeting of support on key clusters, especially advanced manufacturing. NGA has also been critical in advancing the “sector strategies” model of workforce development among states, which is organized around industry-driven partnerships among education, training, economic development, and other relevant organizations to define and meet the needs of specific key strategic industries. See NGA, R “Top Trends in State Economic Development” (2013); NGA “State Sector Strategies Coming of Age: Implications for State Workforce Policymakers” (2013). R Maryland’s cybersecurity industry strategy stands out as particularly comprehensive and effective in consolidating the state’s emerging advantage in the FO industry. The 2010 CyberMaryland report articulated a clear vision for the industry’s development in the state. The appointment of an executive director of cybersecurity development in 2013 within the state Department of Business and Economic Development underscored a lasting commitment to the sector.. ED To learn more, visit http://business.maryland.gov/about/key-industries/it-and-cybersecurity. The states of Colorado and Tennessee, for their part, have undertaken such strategy development to advance the competitiveness of their space and automotive industries, respectively, as well as their advanced O industry bases generally. Stakeholders from across the state and the private sector informed both strategies through a series of listening sessions. In G Colorado, the initiative piggybacked on a wider “Key Industry Process,” in which the state’s economic development office consulted extensively with busi- BA R nesses representing all of the state’s primary clusters. The process resulted in the state undertaking an advanced industry road-mapping exercise that is currently underway. The road-mapping involves identifying the state’s advanced industry companies and assets as well as an assessment of the shared technologies and platforms that unite the state’s clusters. Ultimately, the road-mapping exercise is intended inform state investment in a shared research EM facility to cut across the state’s clusters and anchor Colorado’s advanced industry enterprise. Brookings guided both states in their efforts with the reports by Muro and others, “Launch!” and “Drive!” respectively, each published in 2013. 82. States and localities will be best served by a “high-road” strategy to nurture and expand their advanced industry bases. Such strategies see leaders put delivering value for money over offering the lowest headline tax rates. States and localities stand to cultivate a much more durable advantage if they maintain rather than sacrifice investment in schools, universities, physical infrastructure, and softer cluster infrastructure such as shared research spaces T H E B R O O K I N GS I NSTITUTION | ENDNOTES 75 for small and mid-sized enterprises or investment in public-private industry initiatives. It should also go without saying that the most effective fiscal policies are done through the tax code and not inducements offered to single firms in an opaque manner and on a preferential basis. With regard to specific policies, R&D tax credits have proved popular and are currently in place in 37 states. However, in contrast to the federal R&D tax credit, which has been shown to induce R&D that otherwise would not have occurred, recent empirical evidence suggests that state credits simply shift activity from one locality to another. See Daniel Wilson, “Beggar Thy Neighbor? The In-State, Out-of-State, and Aggregated Effects of R&D Tax Credits.” Working Paper 2005-08 (Federal Reserve Bank of San Francisco, 2007). For evidence on their effectiveness, however, see Bronwyn Hall and Jon van Reenan, “How Effective Are 15 Fiscal Incentives for R&D? A Review of the Evidence,” Research Policy 29 (2000): 449-469. Capital expenditures credits have also been shown to support 20 process innovation in firms. See Stacy Tevlin and Karl Whelan, “Explaining the Investment Boom of the 1990s,” Journal of Money, Credit, and Banking 35 (2003): 1-22; Robert Chirinko, Steven Fazzari and Andrew Myer, “The Elusive Elasticity: A Long-Panel Approach to Estimating the Price Sensitivity of .F EB . 3, Business Capital,” 10th International Conference on Panel Data, Berlin, Germany, July 5-6, 2002. 83. Given that both exports and investment attraction are functions of the global reach of local competitive advantages, policymakers and practitioners will find economies of scale and scope in adopting a unified approach to these issues, which are too often kept separate. For more, see National Governors Association, “State Strategies for Global Trade and Investment” (2014). On export financings for small and mid-sized businesses, see Kati Suominen and A. M Jessica Lee, “Bridging the Trade Finance Gaps: State-Led Innovations to Bolster SME Exports” (Washington: Brookings Institution, 2014). For additional background, see Saha, Fikri, and Marchio, “FDI in U.S. Metro Areas” and Brad McDearman, Greg Clark, and Joseph Parilla, “The 10 Traits of Globally Fluent :0 1 Metro Areas” (Washington: Brookings Institution, 2013). 84. Several states have created innovative strategies for increasing access to capital at critical stages of technology development for small and mid-sized 12 enterprises. Innovation voucher programs, where such firms apply for small vouchers redeemable at participating research institutions such as universi- L ties for specific R&D services, offer a new and promising model. Utah has adapted the venture capital model to form a “Fund of Funds,” which invests in TI private venture firms that themselves promise to invest in Utah companies, authorizing an as-yet-untapped $300 million tax credit to investors in case the U considerable investment, risk, and mentoring expertise. N fund loses money. The program leverages the power of a public backstop to increase private investment in the state and takes advantage of venture firms’ AS E 85. Robert Puentes and Bruce Katz, “To Fix America’s Infrastructure, Washington Needs to Get Out of the Way,” Forbes, May 9, 2014; Puentes and others, “A EL E New Vision for America’s Infrastructure.” 86. Tassey, “Beyond the Business Cycle.” As discrete technologies are replaced by technology systems, the locus and speed of R&D is changing dramatically and becoming increasingly nonlinear. R 87. R Novel components and segments of production must seamlessly fit within larger component categories. Basic research in one area of production will affect FO incremental, or applied, research or manufacturing in other areas. Innovative firms can no longer expect to accelerate new products to market by “owning” one segment of R&D. Successful firms are able to work with key suppliers and toggle between basic and applied R&D—in both product and process R&D—to ED bring a new product or service to market. For a more complete explanation of technology systems and the interplay between basic and applied research, see Tassey, “Competing in Advanced Manufacturing.” For a review of the coordination needed between firms at different stages of R&D given shortening O product life cycles, see Pisano and Shih, “Restoring American Competitiveness.” From the energy and national labs perspective, see also James Duderstadt G and others, “Energy Discovery-Innovation Institutes: A Step Toward America’s Energy Sustainability” (Washington: Brookings Institution, 2009); Henry BA R Chesbrough, Open Innovation: The New Imperative for Creating and Profiting from Technology (Cambridge, MA: Harvard Business School Press, 2003). 88. McKinsey & Co., “The Future of the North American Automotive Supplier Industry: Evolution of Components Costs, Penetration, and Value Creation EM Potential Through 2020” (2012); Mariana Mazzucato, The Entrepreneurial State: Debunking Public vs. Private Sector Myths (London: Anthem Press, 2013). 89. Between 1999 and 2009, the latest year of comprehensive data, U.S. private-sector R&D as a percentage of GDP grew by 4 percent. By comparison, Finland, Japan, Denmark, South Korea, and China have seen their private-sector R&D grow at a rate of 9, 29, 43, and 256 percent, respectively. See Robert Atkinson and Scott Andes, “The Atlantic Century II: Benchmarking EU and U.S. Innovation and Competitiveness” (Washington: Information Technology and Innovation Foundation, 2011). 76 THE BROOKINGS INSTITUTION | AMERICA’S ADVANCED I N D U ST R I ES 90. The private sector has been conducting a declining share of basic R&D for several decades, despite steady increases in overall private-sector R&D. In 1960, the private sector represented nearly one-third of all basic R&D. Today, private sector R&D makes up 18 percent of basic R&D. On the other hand, at more than 80 percent of total U.S. development research, the private sector is the main thoroughfare for bringing inventions to market. See National Science Foundation, Science and Engineering Indicators 2014 (2014). Vanessa Chan, Marc de Jong, and Vidyadhar Ranade, “Finding the Sweet Spot for Allocating Innovation Resources,” McKinsey Quarterly, May 2014. 15 91. 20 92. U.S. private-sector investment in capital equipment is at its lowest levels since the 1970s. See Bureau of Economic Analysis, “Real Private Fixed Investment 3, in Equipment and Software” (2012). .F EB . 93. Daniel Pacthod and Michael Park, “How Can the U.S. Advanced Industries Sector Maintain Its Competitiveness?” (New York: McKinsey Global Institute, 2012). A. M 94. Ibid. 95. Manyika and others, “Manufacturing the Future.” :0 1 96. For more information on the initiative, see “The Nissan Supply Chain Initiative Supplier Development Program 2014” (Nashville: University of Tennessee In 1950, federal R&D represented 1.2 percent of total GDP. By the mid-1960s during the energy crisis and race to the moon, federal R&D represented just L 97. 12 Center for Industrial Services, December 2014). TI over 1.8 percent of GDP. Beginning in the 1970s, federal R&D contributions as a share of the economy began to fall. By 1990, the rate was below that of N 1950 and today, for the first time sense WWII, it stands at less than 1 percent of GDP. See National Science Foundation, Science and Engineering Indicators U 2014. In the near term, there is also little evidence that the federal government is willing to recommit to its R&D expenditures. The Obama administration’s FY2015 budget calls for a 1.2 percent increase in federal R&D spending, an amount that will not even keep pace with inflation. See also Martin Grueber and Robert Hinck, “R&D Funding, Obama v. Bush” (Washington: Center for Strategic and International Studies, 2010). EL E 98. AS E Tim Studt, “2014 Global R&D Funding Forecast,” R&D Magazine, December 2013. 99. Applied research fell from a high of 0.37 percent of GDP in 1964 to 0.18 percent in 2013, while development funding fell from 1.51 to 0.42 percent during the R R same period. National Science Foundation, Science and Engineering Indicators 2014. FO 100. On the Energy Innovation Hub see http://energy.gov/science-innovation/innovation/hubs; and Duderstadt and others, “Energy Discovery-Innovation Institutes.” About the National Network for Manufacturing Institutes see David Hart, Stephen Ezell, and Robert Atkinson, “Why America Needs a National ED Network for Manufacturing Innovation” (Washington: Information Technology and Innovation Foundation, 2012); Devashree Saha, “Create a Nationwide Network of Advanced Innovation Hubs” (Washington: Brookings Institution, 2013); and National Science and Technology Council, “National Network for G O Manufacturing Innovation: A Preliminary Design” (Washington: Executive Office of the President, 2013). BA R 101. See, for example, a number of the “bottom-up” regional strategies being developed through the Brookings-Rockefeller Project on State and Metropolitan Innovation. For more information visit: www.brookings.edu/about/projects/state-metro-innovation. EM 102. Robert Atkinson, “Innovation in Cities and Innovation by Cities” (Washington: Information Technology and Innovation Foundation, 2012). 103. For example, New York City Mayor Michael Bloomberg’s Applied Science NYC initiative forges a partnership with Cornell University and Technion-Israel Institute of Technology to create the “NYCTech” campus on Roosevelt Island. Similarly, in Seattle, the University of Washington has moved its medical research into South Lake Union to be closer to downtown. See Katz and Wagner, “Innovation Districts.” T H E B R O O K I N GS I NSTITUTION | ENDNOTES 77 104. The New Mexico Small Business Assistance program (NMSBA) is a good model for a national lab voucher program. Since its inception, the program has helped more than 1,000 small businesses work with Sandia and Los Alamos national labs to solve short-term technology problems. While it is true that labs currently have technology assistance funds, NMSBA is unique in that the state government is a partner and provides the financing for the program. Such a model provides labs the incentive to consider state economic development strategies more fully in their small and midsized business outreach efforts. More recently, the state of Tennessee and Oak Ridge National Laboratory (ORNL) have been working together to create a new voucher program called “Revv!” that will offer $2.5 million in state-funded innovation vouchers of varying sizes so that Tennessee manufacturers can “purchase” services 15 from ORNL. See “The New Mexico Small Business Assistance Program,” available atwww.nmsbaprogram.org; and Muro and others, “Powering Advanced 20 Industries.” .F EB . 3, 105. For a full discussion of innovation vouchers, see Muro and others, “Drive!” 106. Colorado’s Advanced Industries Accelerator Programs are a recent example. See Muro and others, “Powering Advanced Industries.” A. M 107. Rothwell, “Still Searching.” 108. Thomas Kochan, David Finegold, and Paul Osterman, “Who Can Fix the ‘Middle-Skills’ Gap?” Harvard Business Review, December 2012; Jonathan Rothwell, :0 1 “Understanding Hiring Difficulty: It’s Not that Complicated,” The Avenue, July 11, 2014; and Rothwell, “Still Searching.” 12 109. Mark Zandi, “U.S. Macro Outlook: How the Labor Market Heals” (New York: Moody’s Analytics, 2014). L 110. During the global recessions, firms had a singular clarion call: reduce costs. Because cost pressure was so strong and companies were seeking to reduce TI payroll by such large margins, workforce reductions were pursued based on near-term market requirements without moderate-term forecasting. Now that N the economy is growing again, firms will need to consider how fast to expand their workforces. Peter Cappelli and others have written about the impor- U tance of talent management strategies in times of growth. High-skilled workers are similar to inventory; it is important to have enough capacity to meet demand but too “deep a bench” increases costs. Talent management is extremely important as firms begin to forecast how fast demand will grow. See 111. EL E (Boston: Harvard Business School Publishing, 2008). AS E David Smith and others, “The Talent to Grow” (New York: Accenture, 2011); Peter Cappelli, Talent on Demand: Managing Talent in an Age of Uncertainty Ibid. R 112. For discussions of the skills needed in the software industry and how they may differ from purely academic training see Matt Weisfeld, “What Skills R Employers Want in a Software Developer: My Conversations with Companies Who Hire Programmers,” InformIT, November 12, 2013. For discussion of the FO rise of the manufacturing skills certification movement, see the website of the Manufacturing Skill Standards Council at www.msscusa.org ED 113. Weisfield, “What Skills Employers Want.” O 114. The private sector has often been criticized for paying only sporadic attention to regional workforce pipelines and eschewing deeper engagements in G curriculum design, professional development, or long-term mentorships. See “Lasting Impact: A Business Leader’s Playbook for Supporting America’s BA R Schools” (Boston: Harvard Business School, 2013). EM 115. Ibid. 116. For more information visit P-TECH’s website at www.ptechnyc.org. 117. Nichola Lowe, Harvey Goldstein, and Mary Donegan, “Patchwork Intermediation: Challenges and Opportunities for Regionally Coordinated Workforce Development,” Economic Development Quarterly 25 (2011): 158-171. 78 THE BROOKINGS INSTITUTION | AMERICA’S ADVANCED I N D U ST R I ES 118. Rachel Feintzeig, “Recruiting Tech Talent in High School,” Wall Street Journal, October 1, 2013. 119. The “M-Powered” program is a collaborative training partnership housed at Hennepin Technical College that brings together workforce development organizations, education and training providers, and firms from across the region. 120. For a review of the federal role in STEM education, see the corresponding section of National Science and Technology Council, “Federal Science, 15 Technology, Engineering, and Mathematics Education 5-Year Strategic Plan” (Washington: Executive Office of the President, 2013). For a review of previous 20 studies on the subject, including an accounting of spending, see Jeffrey Kuenzi, “STEM Education: Background, Federal Policy, and Legislative Action” 3, (Washington: Congressional Research Service, 2008). .F EB . 121. The $4 billion estimate of federal STEM education and training expenditure is from Rothwell, “The Hidden STEM Economy.” For a complete review of agency STEM-related programming, see Appendix Table A4 in National Science and Technology Council, “Federal Science, Technology, Engineering, and Mathematics Education 5-Year Strategic Plan.” A. M 122. See Rothwell, “Hidden STEM Economy.” :0 1 123. National Governors Association, “America Works: Education and Training for Tomorrow’s Jobs—An Action Guide for Governors” (Washington: 2014). 12 124. See www.driveto55.org and ibid. L 125. For details on each initiative, visit the State of Washington’s Workforce Board’s “High Skills, High Wages Strategic Fund” website at www.wtb.wa.gov/ TI HSHWStrategicFund.asp and read more about the State of Tennessee’s Skills Gap Grant, a program under the Labor Education Alignment Program (LEAP) U N initiative, at http://driveto55.org/initiatives/tennessee-leap/. 126. Maryland Department of Labor, Licensing, and Regulation “The EARN Maryland Program: Maryland’s New Workforce Training Initiative” (website), available AS E at www.dllr.state.md.us/earn/. EL E 127. Muro and others, “Drive!” R 128. Krista Mattern, Jessica Marini, and Emily Shaw, “Are AP Students More Likely to Graduate from College on Time?” (New York: College Board, 2013). R 129. Raj Chetty, John Friedman, Jonah Rockoff, “Measuring the Impacts of Teachers I: Evaluating Bias in Teacher Value-Added Estimates,” American Economic FO Review 104 (2014): 2593–2632; Raj Chetty, John Friedman, and Jonah Rockoff, “Measuring the Impact of Teachers II: Teacher Value-Added and Student ED Outcomes in Adulthood,” American Economic Review 104 (2014): 2633–2679. 130. James Heckman, “Schools, Skills, and Synapses,” Economic Inquiry 46 (3) (2008): 289-324; Timothy Bartik, “From Preschool to Prosperity: The Economic BA R 131. Ibid. G O Payoff to Early Childhood Education” (Kalamazoo, MI: Upjohn Institute, 2014). EM 132. See Mark Muro and Jessica Lee, “Hubs of Manufacturing: Let’s Get Started,” UpFront, August 20, 2012. 133. As product lifecycles run their course their industries’ location requirements change. Innovation often begins in diversified cities, where product and process refinement occurs through iterative interactions among innovators, suppliers, and consumers. Once product characteristics and production processes become established, production typically disperses to specialized cities without the congestion costs of the more dynamic, diversified cities. At this point, and after further standardization, production can disperse to overseas locales. See, for example, Gilles Duranton and Diego Puga, “Nursery Cities: Urban Diversity, Process Innovation, and the Life Cycle of Products,” American Economic Review 91 (5) (2001): 1454-1477. For thoughtful discussions of the interplay of local clustering and global siting with reference to the auto and electronics industries see, respectively, Timothy Sturgeon, Joannes van Biesebroek, T H E B R O O K I N GS I NSTITUTION | ENDNOTES 79 and Gary Gereffi, “Value Chains, Networks, and Clusters: Reframing the Global Automotive Industry, Journal of Economic Geography 8 (3) (2008): 297-321; and Timothy Sturgeon and Momoko Kawakami, “Global Value Chains in the Electronics Industry: Was the Crisis a Window of Opportunity for Developing Countries?” Working Paper 5417 (Washington: World Bank Group, 2010). See also Anne Markusen, Profit Cycles, Oligopoly, and Regional Development (Cambridge, MA: MIT Press, 1985). 134. Though varied terms and arguments are employed, substantial agreement exists among academic industry analysts that dense regional concentra- 15 tions of firms, workers, industrial know-how, and supporting organizations can enhance the competitiveness of individual firms, regional economies, 20 and national industries. Michael Porter and others have stressed the importance of regional industry “clusters” and argued that strong clusters foster innovation through dense knowledge flows and spillovers; strengthen entrepreneurship by supporting new enterprise formation and start-up survival; 3, enhance productivity and employment growth in industries; and positively influence economic performance. For general reviews of the cluster literature, .F EB . see Joseph Cortright, “Making Sense of Clusters: Regional Competitiveness and Economic Development” (Washington: Brookings Institution, 2006); Muro and Katz, “New Cluster Moment;” and Charles Wessner, “Growing Innovation Clusters for American Prosperity: Summary of a Symposium” (Washington: National Research Council, 2014). For their part, Pisano and Shih focus on the competitive value of local and national “industrial commons,” which support firm growth and which the authors define as the sum total of the local or nationally shared know-how, competencies, and skills related to a specific A. M technology. They note that “more often than not a particular industrial commons will be geographically rooted.” See Pisano and Shih, “Restoring American Competitiveness.” Similarly, Tassey, in “Rationales and Mechanisms,” describes the importance the “co-location synergies” that regions offer to resident actors. Finally, the MIT Task Force on Production in the Innovation Economy focuses on the concept of “industrial ecosystems—“the territorial base of :0 1 resources and relationships outside a company’s four walls that it can use in the development of its business.” See Berger, Making in America. L 12 135. Tassey, “Rationales and Mechanisms.” N TI 136. Pisano and Shih, Producing Prosperity. U 137. McKinsey & Co. recommends that companies take a broad “total factor performance” approach to location analysis. We would add that ecosystem benefits should be part of that. A “total factor performance” approach moves beyond simplistic assessments of local wage or transportation costs and takes into AS E account all variables while considering how these factors might evolve over time. See Manyika and others, “Manufacturing the Future.” EL E 138. Berger, Making in America. 139. General Electric reached a deal in late 2014 to sell its appliance division to Electrolux, a Swedish manufacturer. Whether Electrolux adopts a similar stance R to its local ecosystem remains to be seen. The University of Louisville, a partner on the microfactory, for its part, has demonstrated commitment to the R facility and plans to host the microfactory alongside a complementary “learning factory” at its Institute for Product Realization once the building is com- FO plete in 2016. See Terry Boyd, “Mayor Fischer: Electrolux is Not Buying GE Appliance Division to Tear It Apart,” Insider Louisville, September 8, 2014; Marty ED Finley, “Another Microfactory is Headed to U of L,” Louisville Business First, December 4, 2014. 140. Assets include woodworking, welding, 3-D printing, computer aided milling, and several other tools. To learn more about the microfactory, visit https://first- O build.com/microfactory/ and see “Innovation Acceleration: GE Selects Louisville for First Micro-Factory,” Business Wire, April 16, 2014; and Lyndsey Gilpin, BA R G “GE Launches ‘Micro-Factory’ to Co-Create the Future of Manufacturing,” Tech Republic, April 16, 2014. 141. Microsoft will provide design and technology expertise to participants and is partnering with American Family Insurance in the endeavor. Deborah Gage, “Microsoft Ventures to Launch Accelerator for Home Automation,” Venture Capital Dispatch (Wall Street Journal blog), June 17, 2014; “Microsoft Ventures EM Accelerator Seattle” website, https://www.microsoftventures.com/accelerators/seattle; For an overview of the Puget Sound’s growing green building and energy efficiency technology cluster, see Metropolitan Business Planning Initiative, “Innovation Meets Demonstration: A Prospectus for Catalyzing Growth in the Puget Sound’s Energy Efficiency Technology Cluster” (Washington: Brookings Institution, 2011). 142. For an excellent survey of the growing embrace of corporate accelerators as a cornerstone of company innovation strategies, see “As Industry Leaders Seek Innovation, Corporate Accelerators Continue to Emerge,” State Science and Technology Institute Weekly Digest, November 19, 2014, http://ssti.org/ blog/industry-leaders-seek-innovation-corporate-accelerators-continue-emerge. Qualcomm and Cisco, for their parts, both have special relationships with 8 0 THE BROOKINGS INSTITUTION | AMERICA’S ADVANCED I N D U ST R I ES nonprofit San Diego incubator EvoNexus to provide seed funding for promising start-ups in selected technology areas such as connected objects, cloud computing, big data, and network infrastructure. EvoNexus’ mission is to strengthen innovation in San Diego, energize the local technology environment, and accelerate the development and deployment of new technologies and business models in their industries. Qualcomm’s involvement reflects a strategic decision to leverage the ecosystem to discover and hone the technologies that will drive its future growth and competitiveness. It also reflects a recognition on behalf of Qualcomm that its own competitiveness stands to be enhanced by a network of innovative, specialized companies operating in the same orbit—creating new applications for Qualcomm’s technologies, demanding new functionalities that the companies can co-develop, and addressing the 15 challenges affecting the industry as a whole. For more on the two programs visit www.commnexus.org/evonexus/strategicfunding/. See also, “Qualcomm 20 Labs Teams with EvoNexus to Expand Innovation in San Diego,” Qualcomm Press Release, May 22, 2012; Bruce Bigelow, “San Diego’s Free EvoNexus Tech Incubator Gains Qualcomm Expertise,” Xconomy, May 22, 2012; Mike Freeman, “Cisco Joins EvoNexus for Incubator Program,” San Diego Union Tribune, .F EB . 3, June 3, 2014. 143. Documented market failures that ensure that private firms invest too little in broader ecosystem health provide a widely recognized rationale for publicsector engagement. See the National Science and Technology Council, “A National Strategic Plan for Advanced Manufacturing” (Washington: Executive A. M Office of the President, 2012). 144. For background on the National Network of Manufacturing (NNMI), the Energy Innovation Hubs, and the Engineering Research Centers (ERCs), see the Advanced Manufacturing Portal http://manufacturing.gov/nnmi.html; the Department of Energy (DOE) hub website at http://energy.gov/science-innova- :0 1 tion/innovation/hubs; and the ERC site at http://erc-assoc.org/. See also, National Science and Technology Council, “National Network for Manufacturing Innovation,” which describes the vision behind the NNMI. Note that the federal government supports a wide variety of regional research institutes and 12 centers that focus on advanced industry-related activities, including the National Science Foundation’s Industry/University Cooperative Research Centers L and Materials Research Science and Engineering Centers; and the Manufacturing Demonstration Facilities sponsored by DOE and the Defense Advanced TI Research Projects Agency (DARPA). Portions of the Department of Defense’s Manufacturing Technology (ManTech) Program employ a Centers of U N Excellence model that frequently concentrates basic or applied research in a particular location. 145. See, for example, Scott Andes, Mark Muro, and Matt Stepp, “Going Local: Connecting the National Labs to their Regions to Maximize Innovation and AS E Growth” (Washington: Brookings Institution and Information Technology and Innovation Foundation, 2014). EL E 146. For an overview of DOE’s National Lab Impact Initiative, see “National Lab Impact Initiative” PowerPoint presentation (Washington, DC: Office of Energy Efficiency and Renewable Energy, April 1, 2014). For a review of the USPTO’s satellite office program and its site selection criteria, which included industry R and Trademark Office, 2014). R alignment; cluster breadth, depth, and diversity; and projected economic impact, see Michelle Lee, “Report on Satellite Offices” (Washington: U.S. Patent FO 147. A number of states have moved to strengthen their manufacturing, innovation, and advanced industry ecosystems in recent years. Illinois’ Innovation Network provides a platform for connecting innovative companies with each other and the resources they need to grow. It provides data on innovation ED trends in the state and maintains a database of resources for firms, including funding and capital sources, physical space such as incubators and co-working spaces, R&D service providers, and industry associations. Washington has embedded industry involvement throughout its workforce training system. O The state maintains 10 industry-specific workforce centers of excellence strategically located throughout the state that work with employers to coordinate G curriculum statewide, serve as central points of contact, monitor industry trends, and offer fast, flexible, and customized training. Colorado is currently BA R conducting a thoroughgoing assessment of its advanced industry base to identify convergence clusters and the cross-cutting technologies underlying the state’s advantages. The exercise will inform an implementation plan or roadmapping exercise to create Colorado’s Advanced Industries Manufacturing Institute, a unifying anchor institution for the state’s diverse AIs. Oregon has set out to deepen its capabilities in emerging cross-cutting technologies with EM the Oregon Nanoscience and Microtechnologies Institute (ONAMI), which coordinates research collaborations among companies, the Pacific Northwest National Laboratory, and the state’s four research universities; facilitates technology commercialization with “gap” grants to bring technologies to market; and manages shared labs and facilities for use by small businesses. 148. In its own work the Metropolitan Policy Program at Brookings has engaged with numerous metropolitan areas that have sought to develop rigorous strategies for developing advanced industry and related export specializations. A number of these strategies have emerged through the program’s T H E B R O O K I N GS I NSTITUTION | ENDNOTES 81 Brookings-Rockefeller Project on State and Metropolitan Innovation, through which Brookings has helped metropolitan leaders adapt the discipline of private-sector business planning to the task of revitalizing regional economic development. “Ecosystem” development plays a central role in several of these plans. For example, Seattle’s business plan led to the establishment of the Smart Buildings Center, a testing and demonstration facility for companies in the building automation and energy efficiency technology arenas to test, evaluate, and fine-tune their products before bringing them to market. In Syracuse and New York’s Center State region, private, public, and civic actors are busy founding the “Data to Decisions Innovation Alliance” to bring together local firms and entrepreneurs in the sector and chart a roadmap for consolidating the region’s burgeoning advantage, especially in defense applications. In 15 Northeast Ohio, MAGNET, a nonprofit organization dedicated to helping local manufacturers compete and grow, delivers an array of consulting services 20 and educational programs to small and mid-sized firms through its PRISM program. PRISM is designed to accelerate innovation and improve productiv- ity in the region while building networks for peer learning and sustainable problem-solving. As of early 2014, PRISM had served more than 20 companies 3, and directly led to more than 100 new jobs. Beyond business planning, a manufacturing strategy in Newark has resulted in the establishment of the New .F EB . Jersey Innovation Institute at the New Jersey Institute of Technology. The institute provides R&D services for local industry and links businesses to the innovation assets in the region. It has also catalyzed initiatives to link small suppliers with Rutgers’ Industrial Solutions Center. The ecosystem also features prominently in several related export-promotion initiatives that cities and metropolitan areas are developing in concert with Brookings. Leaders in the Louisville-Lexington region of Kentucky launched a comprehensive export plan in early 2014 to instill exporting in the business culture of the 22-country A. M region. By the end of June 2014, the economic partnership had registered 445 success stories, defined as instances of new companies exporting, existing exporters expanding sales or expanding to new markets. :0 1 149. This point reflects Michael Porter’s discussion of the proper character of public policy to support regional industry clusters. In “Clusters, Convergence, and Performance,” p. 35, Delgado, Porter, and Stern write: “Effective regional policy should prioritize complementarities across related economic activity rather 12 than seek to attract any [single] type of investment, offer incentives to benefit a small number of firms, or favor particular high-technology fields such as TI L biotechnology or software if the regional has little strength in those areas.” N 150. The federal grant in question was the Economic Development Administration’s i6 Green Challenge Grant, awarded to the Washington Clean Energy U Partnership Project in 2011 to build a facility for energy-efficient building technologies testing and demonstration, among other projects, as initially outlined in the Metropolitan Business Plan developed in collaboration with Brookings. See Metropolitan Business Planning Initiative, “Innovation Meets AS E Demonstration.” For progress on the initiative, see the Puget Sound Regional Council and also the resulting Smart Buildings Center websites at http://www. EL E psrc.org/econdev/programs/smart-buildings/ and http://www.smartbuildingscenter.org/. 151. To learn more about Partners for a Competitive Workforce, see www.competitiveworkforce.org. The National Fund for Workforce Solutions also profiles R PCW and its successes here: http://nfwsolutions.org/regional-collaboratives/partners-for-competitive-workforce. R 152. The Philadelphia Industrial Development Corporation’s “An Industrial Land and Market Strategy for the City of Philadelphia” and “The Lower Schuylkill FO Master Plan” document the dynamics affecting urban real estate markets today and demonstrate how the most forward-thinking cities are reconsidering their zoning and land use patterns to reflect changes in the economy, including the increasing variety of sites that firms demand and their complementary ED activities. O 153. Katz and Wagner, “Innovation Districts.” In Boston, for example, the mayor’s office was instrumental in establishing the Seaport/South Waterfront as an G innovation district and played an active role in establishing District Hall, a dedicated civic space for idea exchange and collaboration at the heart of the BA R district. For more on this trend, see Ania Wieckowski, “Back to the City,” Harvard Business Review (May 2010); Richard Florida, “Startup City: The Urban Shift in Venture Capital and High Technology” (Toronto: Martin Prosperity Institute, 2014). EM 154. Katz and Wagner, “Innovation Districts.” 82 THE BROOKINGS INSTITUTION | AMERICA’S ADVANCED I N D U ST R I ES ABOUT THE AUTHORS Mark Muro is a senior fellow and policy director at the Brookings Metropolitan Policy Program. Jonathan Rothwell is a fellow, Scott Andes and Kenan Fikri are senior policy analysts, and Siddharth Kulkarni is a senior research assistant at the program. ADVANCED INDUSTRIES SERIES 15 This paper is part of the Brookings Metropolitan Policy Program’s Advanced Industries Series, which is aimed at describ 20 ing and advancing the country’s R&D- and knowledge-intensive advanced industries. The series provides groundbreaking research focused on assessing the large role these industries play in delivering regional and national prosperity and provid- 3, ing recommendations to enhance U.S. competitiveness in the sector. The sector’s competitiveness and growth are prerequi- .F EB . sites for any future broadly shared prosperity. IN THE SERIES Launch! Taking Colorado’s Space Economy to the Next Level ●● Drive! Moving Tennessee’s Automotive Sector Up the Value Chain ●● Powering Advanced Industries, State by State ●● Going Local: Connecting the National Labs to their Regions for Innovation and Growth 12 :0 1 A. M ●● TI L ABOUT THE METROPOLITAN POLICY PROGRAM AT THE BROOKINGS INSTITUTION N Created in 1996, the Brookings Institution’s Metropolitan Policy Program provides decision makers with cutting-edge U research and policy ideas for improving the health and prosperity of metropolitan areas including their component cities, BA R G O ED FO R R EL E AS E suburbs, and rural areas. To learn more visit: www.brookings.edu/metro. The Brookings Institution is a private non-profit organization. Its mission is to conduct high-quality, independent research and, based on that research, to provide innovative, practical recommendations for policymakers and the public. The conclu- EM sions and recommendations of any Brookings publication are solely those of its author(s), and do not reflect the views of the Institution, its management, or its scholars. Brookings recognizes that the value it provides to any supporter is in its absolute commitment to quality, independence, and impact. Activities supported by its donors reflect this commitment and the analysis and recommendations are not determined by any donation. T H E B R O O K I N GS I NSTITUTION | ENDNOTES 83 ACKNOWLEDGMENTS The authors would like to thank McKinsey & Co. for its thought leadership on the importance of the nation’s advanced industries. At McKinsey, Dominic Barton, Srikant Inampudi, James Manyika, Daniel Pacthod, and Sree Ramaswamy each deserves a special thanks for their contribution to this work. 15 This paper has benefited from the contributions of thought partners spread far and wide, notably: Will Alexander, Robert 20 Atkinson, Suzanne Berger, Thomas Brewer, Mark Cafferty, Mark Cate, Tom Clark, Emily DeRocco, Stephen Ezell, Michelle Hadwiger, John Hallinan, David Hart, Bill Haslam, Susan Helper, John Hickenlooper, Jesse Jenkins, David Johnson, Mark 3, Johnson, Sridhar Kota, Helmuth Ludwig, Richard Lunak, Ken Lund, Thom Mason, Bill May, Matt Murray, Thomas Rogers, Alice .F EB . Rolli, Willy Shih, Phillip Singerman, Karla Tartz, Ted Townsend, Gregory Tassey, Antoine van Agtmael, and Howard Wial. Closer to home sincere thanks go to: Toms Bernhards, Alan Berube, Allison Courtin, Susan Burnett, Liza Cole, Carolyn Gatz, Alex Jones, Bruce Katz, Jessica Lee, Amy Liu, Nick Marchio, George Mills, Aloka Narayanan, Ellen Ochs, Joe Parilla, Steven A. M Pearson, Martha Ross, Devashree Saha, Heather Simpson, Richard Shearer, Phoebe Silag, Benjamin Sio, Karen Slachetka, Taylor Stewart, Jesus Trujillo, and Jennifer Vey. Special thanks go to David Jackson for his editorial expertise and Maria 1 Sese Paul for design. :0 The Metropolitan Policy Program at Brookings would like to thank Alcoa, Antoine van Agtmael, Lear Corporation, RBC Capital L 12 Markets, and Rob Roy for their generous support of this work. TI Finally, the program would like to thank the Metropolitan Leadership Council, a network of individual, corporate, and philan- FOR MORE INFORMATION Mark Muro EL E Policy Director and Fellow AS E U N thropic investors that provides us financial support but, more importantly, with a true intellectual and strategic partnership. Metropolitan Policy Program at Brookings 202.797.797.6315 FO R R [email protected] FOR GENERAL INFORMATION ED Metropolitan Policy Program at Brookings 202.797.6139 G O www.brookings.edu/metro BA R 1775 Massachusetts Avenue NW Washington, D.C. 20036-2188 telephone 202.797.6139 EM fax 202.797.2965 8 4 THE BROOKINGS INSTITUTION | AMERICA’S ADVANCED I N D U ST R I ES ED O G BA R EM FO R AS E EL E R U L TI N 1 :0 12 .F EB . A. M 3, 20 15 15 20 3, .F EB . A. M 1 :0 12 L TI N U AS E EL E R ED FO R BROOKINGS 1775 Massachusetts Avenue, NW O Washington D.C. 20036-2188 G telephone 202.797.6000 BA R fax 202.797.6004 EM web site www.brookings.edu telephone 202.797.6139 fax 202.797.2965 web site brookings.edu/metro


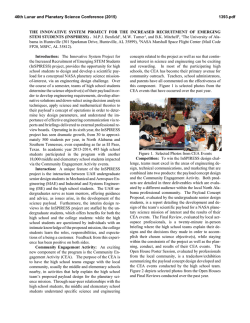


© Copyright 2026