
Cognitive Test Anxiety and Academic Performance
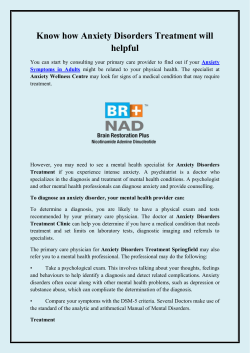
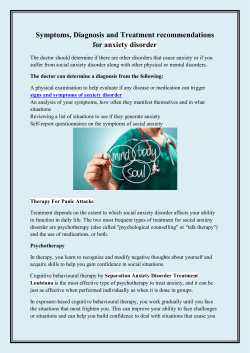
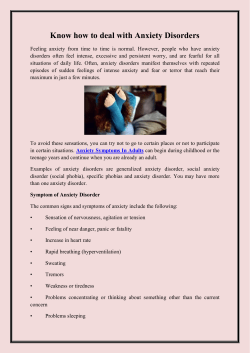
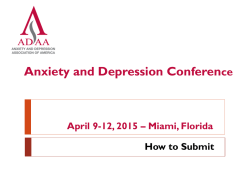
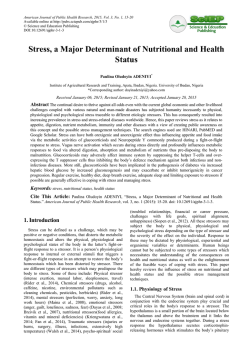
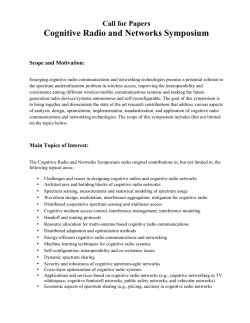
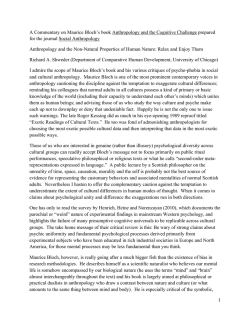
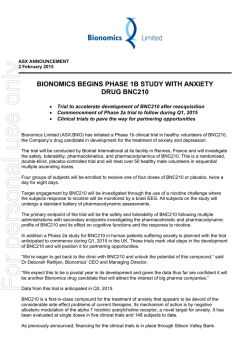
Contemporary Educational Psychology 27, 270–295 (2002) doi:10.1006/ceps.2001.1094, available online at http://www.idealibrary.com on Cognitive Test Anxiety and Academic Performance Jerrell C. Cassady Ball State University and Ronald E. Johnson Purdue University Published online November 29, 2001 A new measure that focused explicitly on the cognitive dimension of test anxiety was introduced and examined for psychometric quality as compared to existing measures of test anxiety. The new scale was found to be a reliable and valid measure of cognitive test anxiety. The impact of cognitive test anxiety as well as emotionality and test procrastination were subsequently evaluated on three course exams and students’ self-reported performance on the Scholastic Aptitude Test for 168 undergraduate students. Higher levels of cognitive test anxiety were associated with significantly lower test scores on each of the three course examinations. High levels of cognitive test anxiety also were associated with significantly lower Scholastic Aptitude Test scores. Procrastination, in contrast, was related to performance only on the course final examination. Gender differences in cognitive test anxiety were documented, but those differences were not related to performance on the course exams. Examination of the relation between the emotionality component of test anxiety and performance revealed that moderate levels of physiological arousal generally were associated with higher exam performance. The results were consistent with cognitive appraisal and information processing models of test anxiety and support the conclusion that cognitive test anxiety exerts a significant stable and negative impact on academic performance measures. 2001 Elsevier Science (USA) Research on test anxiety typically has been focused on appropriate methods of measuring the construct, the impact of test anxiety on academic and standardized test performance, and the underlying locus of the impact of test anxiety. However, despite decades of research into feelings of anxiety during evaluative situations, there is little agreement regarding these central issues of test anxiety. Address correspondence and reprint requests to Dr. Jerrell C. Cassady, Department of Educational Psychology, Ball State University, Muncie, IN 47306. E-mail: [email protected]. 270 0361-476X/01 $35.00 2001 Elsevier Science (USA) All rights reserved. COGNITIVE TEST ANXIETY AND ACADEMIC PERFORMANCE 271 Structure of Test Anxiety Early work defined test anxiety as a singular attribute that could be measured with unidimensional scales (i.e., Sarason, 1961). However, even with early studies employing unidimensional measures of test anxiety, there was a perception that there were at least two manifestations of test anxiety. Sarason (1961) proposed that interfering anxieties encountered in evaluative situations were likely a combination of ‘‘heightened physiological activity’’ and ‘‘self-deprecating ruminations’’ (pp. 201–202). Since the early 1970s there has been wide acceptance of the view that test anxiety is composed of two dimensions (traditionally referred to as emotionality and worry). Subsequently, most research in test anxiety has been directed toward creating better measures of test anxiety (Liebert & Morris, 1967; Spielberger, Gonzalez, Taylor, Algase, & Anton, 1978) and determining the differential impacts of the two factors (Hembree, 1988). Emotionality. High levels of the emotionality dimension of test anxiety are typically evident through physiological responses experienced during evaluative situations. Physiological manifestations include (a) increased galvanic skin response and heart rate, (b) dizziness, (c) nausea, or (d) feelings of panic (Deffenbacher, 1980; Hembree, 1988; Morris, Davis, & Hutchings, 1981). However, emotionality is the individual’s subjective awareness of the heightened autonomic arousal rather than the arousal itself (Schwarzer, 1984). Despite evidence that emotionality is a distinct dimension of test anxiety, there is evidence that high emotionality is associated with declining performance only when the individual is also experiencing high levels of worry (Morris et al., 1981; Schwarzer, 1984). Two conceptualizations of the interdependence of the two test anxiety factors have been advanced. The first explanation built upon research demonstrating that high levels of emotionality negatively influence test performance only under conditions where the individual also experienced high levels of worry, suggesting that worry is the primary performance predictor (Deffenbacher, 1980). Thus, high levels of emotionality were considered to be benign for exams when the individual maintains a high level of self-confidence regarding performance. In contrast, Hembree (1988) suggested that test anxiety was primarily a behavioral phenomenon since behavior modification techniques reduced test anxiety only when the emotionality component was targeted. According to this interpretation, cognitive manifestations (i.e., worry) of test anxiety are experienced after the student perceives heightened levels of physiological arousal. Cognitive test anxiety (worry). Since the previously used label of ‘‘worry’’ insufficiently represents the broad class of cognitive processes we associate with test anxiety, this dimension subsequently will be referred to as ‘‘cogni- 272 CASSADY AND JOHNSON tive test anxiety.’’ Cognitive test anxiety is composed of individuals’ cognitive reactions to evaluative situations, or internal dialogue regarding evaluative situations, in the times prior to, during, and after evaluative tasks. Thoughts commonly entertained by individuals dealing with high levels of cognitive test anxiety center on (a) comparing self-performance to peers, (b) considering the consequences of failure, (c) low levels of confidence in performance, (d) excessive worry over evaluation, (e) causing sorrow for their parents, (f) feeling unprepared for tests, and (g) loss of self-worth (Deffenbacher, 1980; Depreeuw, 1984; Hembree, 1988; Morris et al., 1981). In an investigation of the types of worries most commonly entertained by students with test anxiety, 80% were moderately or intensely concerned about subsequent confrontations with similar examinations, loss of self-worth, and causing sorrow in parents (Depreeuw, 1984). The cognitive component of test anxiety is the factor most consistently found to be associated with declines in performance (Hembree, 1988). In addition to evidence available from traditional correlational studies and meta-analyses, path analyses have confirmed that cognitive test anxiety has the strongest connection with performance. Whereas path analyses have not shown significant influence for the emotionality component, the path from worry to academic achievement has been found to be significant for adolescents (Williams, 1991) and postsecondary students (Bandalos, Yates, & Thorndike-Christ, 1995). Additional factors. Most analyses of the structure of test anxiety have demonstrated two distinct factors: emotionality and cognitive test anxiety (Everson, Millsap, & Rodriguez, 1991; Hembree, 1988). However, several attempts have been made to establish additional factors, based on the notion that segmenting test anxiety would lead to a more accurate understanding of the effects of test anxiety on performance. The primary focus in these attempts to restructure the construct of test anxiety has been the cognitive dimension. Using factor analyses, researchers have proposed that the cognitive component may be composed of (a) worry and fear of failure (Covington, 1985); (b) worry about coping, failure anticipation, self-concern, escape cognitions, and irrelevant thinking (Schwarzer & Quast, 1985); or (c) test-irrelevant thinking and worry (Sarason, 1984). Sarason (1984) claimed the presence of additional factors in a scale of test anxiety allowed for ‘‘fine-grained analyses of the components of test anxiety’’ (p. 937). However, subsequent work with multidimensional scales provided evidence that the total scale has high internal consistency and the various subscales are highly intercorrelated (Kalechstein, Hocevar, Zimmer, & Kalechstein, 1989; Sarason, 1986), limiting the argument that there are more than two distinct factors of test anxiety (Asher, 1997; Nunnally & Bernstein, 1994). COGNITIVE TEST ANXIETY AND ACADEMIC PERFORMANCE 273 Performance in Evaluative Situations The primary impetus for interest in research on test anxiety has been its relationship with performance measures. High levels of test anxiety have been shown to be negatively correlated with (a) IQ; (b) aptitude; (c) academic achievement in reading, English, math, natural sciences, foreign language, psychology, and mechanical knowledge; (d) problem solving; (e) memory; and (f) grades (see Hembree, 1988, for full review). These effects were identified in students ranging from third grade through graduate school. As stated above, the cognitive component of test anxiety is typically identified as the primary factor associated with these performance decrements (Hembree, 1988; Sapp, Durand, & Farrell, 1995; Sapp, Farrell, & Durand, 1995). The cognitive interference model suggests that individuals with high levels of test anxiety perform poorly in large part due to an inability to suppress competing thoughts during the exam. This theory was derived from findings that individuals with high levels of test anxiety are more likely to worry about the outcome of the test, compare their abilities to others, or dwell on the notion that they are not fully prepared for the exam (Sarason, 1984; Schwarzer & Jerusalem, 1992). The interference explanation is consistent with Easterbrook’s (1959) classic work on cue utilization. Easterbrook’s (1959) work revealed that conditions that promote high levels of arousal lead to a reduction in the range of cues available to the individual in the situation. Effective cue utilization helps learners by constraining attention to only relevant cues, promoting performance (Easterbrook, 1959). However, it appears that individuals with high levels of test anxiety are either constraining their attention to inappropriate cues for the task or are incapable of restricting the range of cues, allowing competing thoughts to enter conscious awareness and interfere with performance (Schwarzer & Jerusalem, 1992). The model of test anxiety developed through an information processing view extends the traditional cognitive interference model by examining the full range of cognitive functions that may interfere with optimal performance (i.e., poor encoding and storage skills; Naveh-Benjamin, McKeachie, & Lin, 1987). For these students, declines in performance have been attributed to a combination of (a) an inability to effectively process or retrieve necessary information and (b) heightened anxiety brought upon by metacognitive awareness of a lack of preparation or ability (Desiderato & Koskinen, 1969; McKeachie, 1984; Naveh-Benjamin, 1991). Supporting data for this model have demonstrated that the traditional conception of test failure by high test anxious students is not merely due to ‘‘freezing up’’ during a test situation and suggest that a bulk of test information is not adequately processed (Naveh-Benjamin, 1991). The additive model of test anxiety asserts that the impact of test anxiety is an additive function of two factors: the individual’s trait test anxiety and 274 CASSADY AND JOHNSON situation-specific variables (Zohar, 1998). Thus, individuals with high levels of test anxiety will experience severe performance declines only in situations that activate the state test anxiety factor. Common situational factors include low self-confidence for the specific task, perception of the exam as posing a high level of threat, or an awareness of being underprepared for the exam (Schwarzer & Jerusalem, 1992; Zohar, 1998). Kurosawa and Harackiewicz (1995) provided empirical evidence supporting both the interference and additive models of test anxiety. Their study induced various levels of self-awareness during a performance task to stimulate salient cognitive interference. Test anxious students reported high levels of concern about performance across all conditions of the task (Kurosawa & Harackiewicz, 1995), revealing the stable trait component of test anxiety. However, elevated levels of concern were accompanied by performance decrements only in conditions where cognitive interference was induced by high levels of self-awareness (i.e., being videotaped) during the evaluative task (Kurosawa & Harackiewicz, 1995). Therefore, the results demonstrated that interference leads to decreased performance in test anxious students, but the impact of interference is prevalent primarily in specific conditions where the level of self-awareness during evaluation is high. Gender Females have repeatedly been found to report higher levels of overall test anxiety than males (Bandalos et al., 1995; Hembree, 1988; Volkmer & Feather, 1991; Zeidner, 1990). However, there has been little agreement among researchers regarding the locus of these gender differences. Three explanations have dominated thinking on this issue. One explanation for the gender differences in test anxiety is that males and females experience similar levels of test worry, but females have higher levels of the emotionality component, producing higher general test anxiety scores (Deffenbacher, 1980; Mueller, 1980). This proposition received limited support from research revealing that differences between males’ and females’ reported anxiety levels were greatest in the emotionality component. However, females also consistently report higher levels of cognitive test anxiety than males (Hembree, 1988; Zeidner; 1990). Zeidner (1990) found that when statistically controlling for the influence of academic aptitude (as measured by a composite Scholastic Aptitude Test given to Israeli college students), the influence of gender on test anxiety was minimal. This led to the assertion that the demonstrated differences between males and females in test anxiety were ‘‘due, in large part, to gender differences in scholastic ability’’ (Zeidner, 1990, p. 156). However, Hembree’s (1988) meta-analysis revealed that the heightened levels of test anxiety reported by females are not generally accompanied by lower performance scores. COGNITIVE TEST ANXIETY AND ACADEMIC PERFORMANCE 275 A third explanation for gender differences in test anxiety is based on the perceptions of threat in evaluative situations. Arch (1987) reported that gender differences in self-reported efficacy, esteem, discomfort, and task avoidance were a function of the level of performance evaluation. When performance evaluation was salient, females were more likely to rate themselves as less capable and confident in their abilities, more uncomfortable with the experimental setting, and less willing to perform the task again. However, when the experimental condition did not have a salient evaluative component, females had more positive feelings on all perceptions of the event and their abilities (Arch, 1987). Thus, the pronounced test anxiety levels in females may reflect a tendency to perceive evaluative situations as threatening rather than challenging, which in turn heightens the likelihood of cognitive interference (Arch, 1987; Kurosawa & Harachiewicz, 1995; Lay, Edwards, Parker, & Endler, 1989; Schwarzer & Jerusalem, 1992). PRESENT INVESTIGATION There were two related goals for the present investigation. The first goal was to establish the reliability and validity of a new test anxiety measure, designed to assess only the cognitive component of test anxiety. To determine psychometric adequacy, the new Cognitive Test Anxiety scale was evaluated for internal consistency and compared to established measures of test anxiety. The second goal of this study was to examine the relationships among cognitive test anxiety and (a) gender, (b) procrastination, (c) emotionality, and (d) student performance. Based on the contradictory conclusions reported in the literature, no predictions were made regarding gender and cognitive test anxiety. Students reporting high levels of procrastination were anticipated to have heightened levels of cognitive test anxiety and lower scores on classroom exams. The interaction between test anxiety and procrastination was anticipated to provide a strong prediction of test performance. This expectation was based on the seeming comorbid condition embodied in the cognitive interferences brought upon by test anxiety and the behavioral tendencies to delay preparation for exams (Kalechstein et al., 1989). However, no differences were anticipated for analysis of the impact of procrastination on performance on standardized aptitude exams [i.e., Scholastic Aptitude Test (SAT)]. Participants with high levels of cognitive test anxiety were also anticipated to perform significantly more poorly on all measures of performance than participants with low levels of cognitive test anxiety. Furthermore, the final analyses were anticipated to demonstrate that the Cognitive Test Anxiety scale produced a better predictive model for student achievement than multifactor models of test anxiety (i.e., Sarason, 1984). Similarly, cognitive test anxiety was expected to account for a significant amount of variance in 276 CASSADY AND JOHNSON test performance, with a greater contribution than other affective and behavioral measures, including the standard emotional factor of test anxiety and the tendency to procrastinate over tests. In these prediction analyses, prior performance on achievement measures were also expected to be significant indicators of test performance over and above test anxiety and procrastination. These predictions were anticipated to support a cognitive model of test anxiety as related to course examination performance. This investigaion is unique to test anxiety research in three primary ways. First, this study directly tests the power of a single-factor cognitive test anxiety model as compared to a multiple factors model. Second, the test anxiety results are provided in the context of typical undergraduate testing situations, in conditions where a test is no more than 48 h removed from the task of completing the test anxiety measures. Third, the students’ patterns of performance on previous course tests and established tests of achievement are entered into the models of anxiety and performance as covariates. This omission in previous studies has left the results open to misinterpretation and extreme overestimation of the influence of test anxiety on performance. Method Participants Students participating in this investigation were volunteers from an undergraduate educational psychology course at a large Midwestern university. The course that the participants were taking was required for all education majors, and participation in the study was one option for fulfillment of a course requirement. In total, 168 students participated in the project. The students in this study were primarily traditional sophomore and junior education majors, with a mean age of 21 (SD ⫽ 2.58). There were 114 females and 53 males involved in the study, with 1 student leaving the gender response blank. Partial data were reported by several of the students, reducing the sample size of select analyses. Materials The materials for this study include data gathered regarding test anxiety, study habits, undergraduate course examination performance, and performance on the SAT. Procrastination. The Test Procrastination Questionnaire (TPQ) is a 10-item Likert-type scale assessing the student’s self-reported likelihood of procrastinating over tests. The students respond to the 10 items on a 4-point scale (1 ⫽ Not at all typical of me, 2 ⫽ Only somewhat typical of me, 3 ⫽ Quite typical of me, and 4 ⫽ Very typical of me). A total score for the TPQ is obtained by adding the individual item scores, with high scores indicating high levels of procrastination over tests. The authors of the scale (Kalechstein et al., 1989) report a high internal reliability of the TPQ (α ⫽ .92), which was confirmed in our study (α ⫽ .95). Test anxiety. Two measures of test anxiety were used in the main study. The first scale was the Reactions to Tests, which is composed of four 10-item subscales, measuring Tension, Test Irrelevant Thinking, Bodily Symptoms, and Worry (Sarason, 1984). Participants respond to a 4-point Likert-type scale, using the same judgments as with the Test Procrastination Questionnaire. One item is reverse coded after data collection in order to make the high scores on each item indicate high levels of test anxious behavior. The reported coefficient alpha ratings of the four subscales ranged from .68 to .81, with a total scale reliability of .78 (Sarason, COGNITIVE TEST ANXIETY AND ACADEMIC PERFORMANCE 277 1984). With our sample, the RTT total scale internal consistency was .95. The high internal consistency of the total scale again indicates that the use of factor analysis to reduce the scale into multiple categories may be unwarranted (Asher, 1997; Nunnally & Bernstein, 1994). The Cognitive Test Anxiety scale was developed through multiple pilot tests. Whereas the Reactions to Tests was intended to be a broad measure of multiple domains of test anxiety, the Cognitive Test Anxiety scale was developed to measure only the cognitive component of test anxiety. The Cognitive Test Anxiety scale was further revised for this study to follow the 4-point rating scale used in the Reactions to Tests and the Test Procrastination Questionnaire. Because the Cognitive Test Anxiety scale contains items indicating both high and low levels of test anxious behavior, items were recoded so that high scores indicated high levels of cognitive test anxiety. In pilot studies testing the reliability of earlier versions of the scale, the Cognitive Test Anxiety scale was found to have high internal consistency (α ⫽ .86). The pilot studies used to develop the Cognitive Test Anxiety scale spanned 2 years and relied on data gathered from over 400 participants. The process of deriving the final scale of the Cognitive Test Anxiety scale began with the examination and creation of 96 total items. The bulk of these items were developed in the late 1960s, but were not revisited until the mid-1990s. The revisitation was prompted by the recognition that the two-factor model of test anxiety was viable, but the cognitive dimension was of primary interest and utility when determining the underlying performance on examinations. Thus, all emotionality or bodily symptoms items were deleted from the Cognitive Test Anxiety pilot measure, and additional items for the cognitive dimension were created. The focus of the new scale was on the tendency to engage in task-irrelevant thinking during test taking and preparation periods, the tendency to draw comparisons to others during test taking and preparation periods, and the likelihood to have either intruding thoughts during exams and study sessions or relevant cues escape the learner’s attention during testing. In addition to comparison with the Sarason (1984) Reactions to Tests, two other established scales for test anxiety research were compared with the Cognitive Test Anxiety scale. Spielberger’s Test Anxiety Inventory (1980) and Benson’s Revised Test Anxiety scale (Benson, Moulin-Julian, Schwarzer, Seipp, & El-Zahhar, 1992) were also administered to subjects in pilot work to determine the benefit of creating a new scale. Benson et al.’s (1992) scale is an 18item revision of the 40-item Reactions to Tests (Sarason, 1984) and the 20-item Test Anxiety Inventory (Spielberger, 1980), with the selection of the 18 items driven by factor weights, following the four-factor structure of the RTT. Our analyses of the data gathered in the pilot studies identified high correlations between all test anxiety scales; however, the existing measures were limited in their coverage of events prior to testing events. The shortness of the Test Anxiety Inventory and the Revised Test Anxiety scale, while still attempting to address multiple factors was also considered to be a limitation to internal consistency (Nunnally & Bernstein, 1994). After determining that the Cognitive Test Anxiety scale was measuring the same basic construct as the existing scales, and identifying that no preexisting scale met the needs of the desired research agenda, scale revision for the Cognitive Test Anxiety scale was undertaken. A 44-item version of the scale was administered to 72 undergraduate students. Total scale internal consistency for the 44-item version was strong (α ⫽ .92). Factor analyses revealed four distinct factors in the 44-item version, with a dominant first factor (Cognitive). The remaining three factors were composed of less than 4 items each, with weak eigenvalues. The decision was made to focus on the single cognitive factor, and create a short, unidimensional scale with high internal consistency. Identification of the correlations between the cognitive factor and each item restricted the scale to 33 items, with all items maintaining a part–whole correlation of r ⫽ .35 or greater. However, 6 items were identified in a subsequent analysis to deviate from the central factor represented by the Cognitive Test Anxiety scale and were removed from the final version. No significant differences in scale means or internal consistency were noted when reducing the scale from 44 to 27 items. 278 CASSADY AND JOHNSON TABLE 1 Intercorrelations between Test Anxiety and Procrastination Scales Scale 1. 2. 3. 4. 5. 6. 7. CTAa RTTb RTT-BSc RTT-Td RTT-TIe RTT-Wf TPQg 1 2 3 4 5 6 — .78*** .61*** .82*** .26*** .81*** .23** — .82*** .85*** .63*** .90*** .36*** — .74*** .31*** .62*** .13 — .20** .78*** .17* — .47*** .53*** — .31*** Note. n ⫽ 168. a Cognitive Test Anxiety Scale. b Reactions to Tests, Total Scale. c Reactions to Tests, Bodily Symptoms. d Reactions to Tests, Tension. e Reactions to Tests, Test Irrelevant Thinking. f Reactions to Tests, Worry. g Test Procrastination Questionnaire. The revised 27-item version of the Cognitive Test Anxiety scale used for this study had a high level of internal consistency, α ⫽ .91 (see the Appendix for the full list of items). Furthermore, evidence of concurrent validity was attained in comparison to the Reactions to Tests. Despite the different theoretical rationales used in developing the two measures of test anxiety, the Cognitive Test Anxiety scale and the RTT were significantly correlated (see Table 1). Therefore, the results of this study focus primarily on the participants’ scores produced with the Cognitive Test Anxiety scale. Test performance. Participants took three multiple-choice exams in their educational psychology course. The exams ranged in length from 65 to 75 items, which measured basic knowledge, comprehension, and application of the material covered in the textbook and course lectures. The exams were administered to groups of 40 to 45 students at a time. The method of evaluation of all exams was norm-referenced, and results were reported to students as T scores. Test 1 was taken by 164 students, 5 weeks before the test anxiety and procrastination measures were administered. Test 2 was taken by 163 participants, 2 days after the completion of the study instruments. Test 3 was a noncumulative examination taken by 157 of the students during the university finals week, 5 weeks after test 2. The variations in number of participants for each test were due to student illnesses or absences that led to a missed exam or having to take an alternate exam at a different time. Students also reported their scores on the Scholastic Aptitude Test verbal, math, and total scores.1 In cases where the student did not take the SAT, the students were instructed to insert the verbal, math, and total scores from the American College Test (ACT). For the few students reporting ACT scores, the scores were transformed to a scale equivalent to the SAT (M ⫽ 500, SD ⫽ 100), using information provided by ACT, Inc. 1 The self-reported SAT scores were deemed valid, as the data from a related sample demonstrated high correlations (r ⫽ .88) between actual and reported SAT values using the same procedures (see Cassady, 2001). COGNITIVE TEST ANXIETY AND ACADEMIC PERFORMANCE 279 Procedures Two days before the participants took the second course exam, students completed the (a) two test anxiety measures, (b) Test Procrastination Questionnaire, and (c) self-report sheet that requested their identification number, age, sex, and scores on the Scholastic Aptitude Test. The data collection procedures took 20–30 min and were conducted in the course testing location in groups of 20 to 40 students. Reading service was provided for one student with a visual impairment. During the group data collection sessions, students also granted permission for access to their course exam scores. To evaluate differences between students with high and low levels of cognitive test anxiety, the sample was split into three groups. The students reporting the top 33% of scores on the Cognitive Test Anxiety scale formed the high cognitive test anxiety group, and those students reporting the lowest 33% of scores on the Cognitive Test Anxiety scale were classified as the low test anxiety group. Students in the middle 33% were considered as reporting average levels of test anxiety. The same procedure was used to select high, average, and low levels of emotionality, using the Bodily Symptoms subscale of the Reactions to Tests as the grouping measure. Results The results of the study aimed to identify the strength of the Cognitive Test Anxiety scale as compared to the four-factor Reactions to Tests as well as to test the unique influence of cognitive test anxiety on test performance. The results of correlational analyses are presented initially, followed by analyses of variance examining differences between students with high and low levels of emotionality and cognitive test anxiety as well as a test of the gender differences on test anxiety and performance. Finally, the models of test anxiety are tested with regression analyses and independent structural equation modeling (Schumacker & Lomar, 1996). Correlational Analyses Correlational analyses on the primary measures are displayed in Table 2. The results reveal consistently strong correlations between performance and TABLE 2 Means and Standard Deviations for Level of Cognitive Test Anxiety and Emotionality Level of emotionality Level of cognitive test anxiety High Average Low Total emotionality High M (SD) Average M (SD) Low M (SD) Total anxiety M (SD) 44.91 (8.54) n ⫽ 37 51.86 (8.62) n ⫽ 18 55.35 (9.57) n⫽4 47.74 (9.28) n ⫽ 59 50.96 (11.01) n ⫽ 17 53.07 (11.32) n ⫽ 15 54.42 (9.00) n ⫽ 18 52.84 (10.31) n ⫽ 50 45.16 (7.80) n⫽5 46.41 (8.33) n ⫽ 21 53.26 (10.49) n ⫽ 28 49.84 (9.99) n ⫽ 54 46.67 (9.51) n ⫽ 59 50.07 (9.64) n ⫽ 54 53.84 (9.73) n ⫽ 50 n ⫽ 163 280 CASSADY AND JOHNSON the scores on the Cognitive Test Anxiety scale, with weak or inconsistent correlations between performance and the other measures of test anxiety or procrastination. In addition, the magnitude of the correlational coefficients between scores on the Cognitive Test Anxiety scale and test performance did not appear to be dependent upon the timing of the exams. Interestingly, the study behavior of procrastination was only found to be correlated with performance on the third examination, which was administered during the university final examination period. Group Performance Differences Using the grouping method described in the procedures section, a multivariate analysis of variance on the effect of level of cognitive test anxiety on performance on the Scholastic Aptitude Test was significant, F(4, 212) ⫽ 3.97, p ⬍ .005. Between-subjects analyses of the SAT subscores revealed differences for the verbal subscale, F(2, 106) ⫽ 3.60, MSE ⫽ 8758.38, p ⬍ .03; and the math subscale, F(2, 106) ⫽ 5.53, MSE ⫽ 9202.73, p ⬍ .005 (see Table 3 for group means). Post hoc analyses using Fisher’s LSD revealed that the high test anxiety group scored significantly lower on the verbal portion of the SAT than the average (p ⬍ .02) and low (p ⬍ .05) test anxiety groups (see Fig. 1). On the math portion of the SAT, the high test anxiety group scored significantly lower than the low test anxiety group (p ⬍ .001). A repeated-measures analysis of variance evaluating group differences in performance on the three course exams revealed significant differences among the three levels of cognitive test anxiety, F(2, 150) ⫽ 15.24, MSE ⫽ 2750.95, p ⬍ .001 (see Table 2 for means). Univariate analyses of variance TABLE 3 Mean Academic Performances as a Function of Levels of Cognitive Test Anxiety SAT scoresa Level of test anxiety n Verbal Math Low 31 Average 38 High 40 527.74 (92.87) 535.26 (85.42) 482.44 (102.56) 590.16 (86.72) 553.16 (101.61) 514.23 (8.39) a The Scholastic Aptitude Test (SAT) Total score is not presented, as it is a combination of the verbal and math subscales. Students reporting ACT scores were transformed to equivalent SAT standardized score levels. COGNITIVE TEST ANXIETY AND ACADEMIC PERFORMANCE 281 FIG. 1. Cognitive test anxiety group differences on SAT scores. revealed there were significant group differences for each of the three exams. Following up the significant group difference for the first exam, F(2, 150) ⫽ 16.29, MSE ⫽ 85.18, p ⬍ .001, Fisher’s LSD post hoc analyses revealed that the high test anxiety group scored significantly lower than the average and low test anxiety groups (p ⬍ .001; see Fig. 2). Follow-up analyses of the significant group differences for the second exam, F(2, 150) ⫽ 7.24, MSE ⫽ 96.22, p ⬍ .001, revealed that both the high and average test anxiety groups scored lower than the low test anxiety group (p ⬍ .001 and p ⬍ FIG. 2. Cognitive test anxiety group differences on course examinations. 282 CASSADY AND JOHNSON FIG. 3. Percentage of students earning A, B, C, D, and F grades on cumulative exam performance as a function of levels of Cognitive Test Anxiety. .03, respectively). Performances on the final examination also differed as a function of the level of cognitive test anxiety, F(2, 150) ⫽ 9.08, MSE ⫽ 91.57, p ⬍ .001. Fisher’s LSD post hoc analyses revealed that the high test anxiety group again performed significantly worse than the average (p ⬍ .003) and low (p ⬍ .001) test anxiety groups. Finally, the cumulative effect of the impact of cognitive test anxiety on performance across an entire semester may be seen in the relationship between test anxiety and the final grades that students received from their total points earned on all three objective exams. Figure 3 shows the percentages of students at each of the three anxiety levels attaining A, B, C, D, or F grades based on their cumulative point totals for the three objective tests. Note the positive skewness of the curve toward A and B grades for the low anxiety students and the negative skewness toward the C and D grades for the high anxiety students. To examine the emotionality component of the two-factor model of test anxiety, the Bodily Symptoms subscale of the Reactions to Tests was employed. Analysis of varying levels of emotionality revealed no effect on Scholastic Aptitude Test scores (p ⬎ .05). However, a repeated-measures analysis of variance revealed that emotionality was a significant factor in performance across the three course examinations, F(2, 150) ⫽ 4.15, MSE ⫽ 853.59, p ⬍ .02. Univariate analyses of the effects of level of emotionality on each exam revealed significant performance differences for the second exam, F(2, 150) ⫽ 3.98, MSE ⫽ 3.98, p ⬍ .02; and the third exam, F(2, 150) ⫽ 3.34, MSE ⫽ 98.28, p ⬍ .04. Fisher’s LSD post hoc analyses revealed that students reporting average levels of emotionality performed significantly better than the high emotionality group for both exams (p ⬍ .01; see Table COGNITIVE TEST ANXIETY AND ACADEMIC PERFORMANCE 283 2 for group means). There were no effects of emotionality on performance for the first examination. Gender differences in cognitive test anxiety and emotionality were analyzed using analyses of variance.2 Consistent with previous findings, females (M ⫽ 17.71; SD ⫽ 6.42) reported higher levels of emotionality than males (M ⫽ 15.62; SD ⫽ 4.62), F(1, 165) ⫽ 4.50, MSE ⫽ 35.03, p ⬍ .04. However, in this study, females (M ⫽ 70.33; SD ⫽ 13.17) also reported higher levels of cognitive test anxiety than males (M ⫽ 60.28; SD ⫽ 13.27), F(1, 165) ⫽ 20.98, MSE ⫽ 174.23, p ⬍ .001. The pattern of gender differences in test anxiety from this population contradicts the proposition that heightened test anxiety in females is simply attributable to level of emotionality (Deffenbacher, 1980; Mueller, 1980). Despite the heightened level of emotionality and cognitive test anxiety reported by females, a repeated-measures analysis of variance revealed no gender differences in course examination performance across the three examinations, F(1, 150) ⫽ .39, MSE ⫽ 216.53. Prediction of Exam Performance Stepwise regression analyses were used to identify effective predictor variables for performance on course examinations. For these analyses, the second course exam was chosen as the dependent factor because it was taken 2 days after the test anxiety and procrastination questionnaires were completed. Therefore, any situational factors that may have entered into the levels of reported test anxiety and procrastination would be most applicable to that exam. Several regression models were employed to demonstrate the power of the Cognitive Test Anxiety scale to account for a portion of test performance variance, particularly as compared to the four-factor Reactions to Tests and as compared to a measure of the emotionality component. The initial regression design contained the students’ scores on the first exam taken in the course, performance on the Scholastic Aptitude Test, both test anxiety measures, and the Test Procrastination Questionnaire. The regression analyses with this full model produced only one predictor variable, performance on the first exam, B ⫽ .504, p ⬍ .001, which accounted for 25% of the variance. When prior course examination performance was removed from the list of potential predictor variables, two predictor variables were significant, performance on the verbal subscale of the SAT and cognitive test anxiety (see Table 4). The combined power of verbal SAT and cognitive test anxiety accounted for 13% of the variance. A final regression analysis was conducted to compare the predictive power of the Cognitive Test Anxiety scale and the Reactions to Tests measure. 2 The gender means for emotionality are based on the RTT Bodily Symptoms subtest score, which has a possible range from 10 to 40. The Cognitive Test Anxiety scale produced the cognitive test anxiety rating, which has a possible range from 27 to 112. 284 CASSADY AND JOHNSON TABLE 4 Stepwise Regression Analyses Predicting Exam Performance with Test Anxiety, SAT Performance, and Procrastinationa Variable Step 1 SAT-Verbal Step 2 SAT-Verbal Cognitive Test Anxiety B SE B β .022 .007 .29 .018 ⫺.114 .007 .049 .23 ⫺.22 Note. R2 ⫽ .08 in step 1, ∆R2 ⫽ .05 in step 2 (ps ⬍ .003). a Predictor variables included cognitive test anxiety, Reactions to Tests total score, Test Procrastination Questionnaire value, SATTotal, SAT-Verbal, and SAT-Math. To accomplish this comparison, a regression analysis that forced the RTT subscales to be entered into the model first was conducted (see Table 5). In this analysis, the four RTT subscales were entered into the regression model first. At this step, the subscales combined to account for only 5% of the variance in test performance, B ⫽ .23, and this increment was not statistically significant, F(4, 158) ⫽ 2.24, MSE ⫽ 97.03, p ⬎ .05. In the second step of the model, the Cognitive Test Anxiety score was allowed to enter the regression model. With the addition of the Cognitive Test Anxiety measure, 15% of the variance in test performance was explained, B ⫽ .38. Moreover, the change in R2 was significant when the Cognitive Test Anxiety scale was TABLE 5 Regression Analyses Predicting Exam Performance with RTT Subscales Followed by Cognitive Test Anxiety B SE B β Step 1 RTT-Bodily Symptoms RTT-Worry RTT-Tension RTT-Test Irrelevant Thinking ⫺.011 ⫺.087 ⫺.080 ⫺.222 .201 .201 .202 .126 ⫺.006 ⫺.060 ⫺.059 ⫺.164 Step 2 RTT-Bodily Symptoms RTT-Worry RTT-Tension RTT-Test Irrelevant Thinking Cognitive Test Anxiety Scale ⫺.035 .321 .292 ⫺.263 ⫺.430 .192 .215 .213 .120 .104 ⫺.020 .223 .217 ⫺.194 ⫺.591 Variable Note. R2 ⫽ .054 in step 1 (ns), ∆R2 ⫽ .092 in step 2 (p ⬍ .001). Cognitive test anxiety in this analysis was forced to enter in the second step after the RTT subscales. COGNITIVE TEST ANXIETY AND ACADEMIC PERFORMANCE 285 permitted to enter the regression model after the RTT subscales, producing an overall significant F value, F(5, 157) ⫽ 5.37, MSE ⫽ 88.10, p ⬍ .001. Test Anxiety Model Evaluation A variation to the regression analyses provides further evidence for the superiority of the Cognitive Test Anxiety scale and lends strong support to a cognitive test anxiety model. Using independent linear structural equation modeling, standardized path weights for the two test anxiety measures were compared. The model in Fig. 4 demonstrates that the Cognitive Test Anxiety scale’s partial regression coefficient is significantly stronger than the path from the RTT scales. A second structural equation model (Fig. 5) tested the additive model of test anxiety, using the Bodily Symptoms subscale from the RTT as the measure of emotionality. However, in this model, students’ FIG. 4. Structural equation model examining relative weights of Cognitive Test Anxiety and Reactions to Tests, with procrastination and performance controlled. 286 CASSADY AND JOHNSON FIG. 5. Structural equation model testing standard two-factor model of test anxiety, with procrastination and performance controlled. performance on the SAT was entered to account for aptitude in the model. It is evident in this model that the cognitive test anxiety factor greatly outweighs the emotionality component with respect to resultant impact on performance. As anticipated, a related model that did not account for aptitude (as measured by SAT performance) overestimated the level of influence of cognitive test anxiety, with a partial regression coefficient of .34 (as compared to the weight reported in Fig. 5). The omission of performance from the model had no impact on the partial regression coefficients observed for emotionality and procrastination. Discussion The two principle goals for this investigatioin were to establish a new measure of test anxiety that targets only the cognitive domain and to identify that the cognitive domain is the primary test anxiety component with respect COGNITIVE TEST ANXIETY AND ACADEMIC PERFORMANCE 287 to impact on student performance. The advances noted in this investigation include a greater level of ecological validity than permitted in most test anxiety studies, as the measures were integrated into the semester and taken in close proximity to a shared evaluative event. Second, the inclusion of data from prior performances in realistic learning and assessment events allows for greater confidence in the approximation of the relative impact of cognitive test anxiety, emotionality, and procrastination on undergraduate student performance levels. Thus, the data from this investigation are more credible to the reality of test anxiety than in contrived experimental settings that attempt to induce anxiety over artificial tests. Validation of the Cognitive Test Anxiety Scale The evidence gathered from a variety of analyses provides credible data that the Cognitive Test Anxiety scale is a reliable and valid measure of cognitive test anxiety for undergraduate students. Reliability estimates in pilot and final versions of the scale demonstrated high levels of internal consistency, and factor analyses supported the unidimensional nature of the cognitive test anxiety construct measured by the scale. The scale also had strong predictive validity, as it predicted course examination performance better than the multifactor Reactions to Tests (Sarason, 1984) measure. Though emotionality and procrastination were reliably related to course exam performance under limited contextual circumstances, higher levels of cognitive test anxiety were consistently associated with performance decrements on classroom examinations and the Scholastic Aptitude Test. Finally, the scale provides researchers with an efficient alternative to preexisting test anxiety measures. The 27-item scale is generally completed by undergraduate students in 8 to 15 min, while providing a reliable and valid measure of the primary factor of test anxiety related to performance. Thus, the Cognitive Test Anxiety scale provides a reliable, valid, and quick measure of test anxiety that can be used to identify individuals with high or low levels of anxiety. This speed of measurement allows for the use of the scale in repeated measures designs, or as an additional variable in a complex research design, without unduly taxing researchers’ resources. Cognitive Test Anxiety Clear and persistent data were available to provide support for models of test anxiety that focus on the cognitive domain as the locus of performance deficits. In this study, students with high, medium, and low levels of cognitive test anxiety clearly differed in their performance levels on course exams and the SAT. As illustrated in Fig. 1, students with high levels of test anxiety were significantly outperformed by those with lower levels of test anxiety on the SAT. Differences in SAT performances among the low, medium, and high test anxiety groups were appreciable, ranging from mean total SAT 288 CASSADY AND JOHNSON scores of 1109 for the low anxiety group to 1001 for the high anxiety group. These differences reveal a distinct disadvantage on high stakes testing for students with cognitive test anxiety. The SAT score differences are significant as they may hinder attempts by students with test anxiety to gain entry into colleges and universities that place a high premium on SAT scores. Furthermore, to the extent that students with high test anxiety believe their test scores accurately represent their ability levels, the repetition of such experiences might well result in students having less favorable expectations for successful performance on future learning tasks (Covington, 1985). Differences in course examination performances were also considerable. As illustrated in Fig. 2, the low cognitive test anxiety group outperformed the high anxiety group by nearly 1 standard deviation. Furthermore, students with moderate levels of cognitive test anxiety outperformed the high anxiety group in several conditions. The long-term consequences of test anxiety on course performance is also evident in an examination of cumulative course grades (see Fig. 3). The distribution of grades demonstrated differential distribution patterns that favor students with low and average levels of cognitive test anxiety, with the curve representing grades earned by students with high test anxiety being skewed toward the C and D grade ranges. The explanation for the negative relationship between high cognitive test anxiety and test performance is not as obvious as it may appear at first glance. Some researchers have argued that test anxiety might be a consequence of poor test performance as well as a cause, with a perpetuating cycle of failure being established (e.g., Covington, 1985). Other researchers have suggested that the relationship between anxiety and test performance might be a consequence of a third variable, such as lower ability levels of individuals with high test anxiety, rather than evidence of a causal relationship (e.g., Liebert & Morris, 1967). A variety of evidences, however, suggest that high test anxiety is a causative determinant of test performance. One type of evidence is the everpresent assertions by students that high levels of test anxiety caused them to perform poorly on a test. These testimonials sometimes appear to be post hoc rationalizations for poor performance, but the pervasiveness of such reports, as well as the seriousness with which such reports are delivered, lend credence to the existence of a causative relationship. Furthermore, path analyses conducted in this study (see Figs. 4 and 5) as well as previous investigations (Bandalos et al., 1995; Williams, 1991) have confirmed these students’ perceptions, demonstrating the significance of causal pathways from cognitive test anxiety to performance measures (with no associated pathways from other measures of test anxiety). Reliance on these statistical manipulations to provide causal evidence is limiting, as the design and analyses rely on correlational data. COGNITIVE TEST ANXIETY AND ACADEMIC PERFORMANCE 289 However, there are experimental data that validate the conclusions available from the path analyses (Kurosawa & Harackiewicz, 1995). These results demonstrated that in experimental manipulations that induced evaluative stress, test anxious students displayed far more performance errors than their low anxiety counterparts. Interestingly, in experimental conditions with no induced stress or self-awareness (i.e., a neutral control condition), the high test anxiety group outperformed the low test anxiety students. Hence, when stress was induced in these artificial testing conditions, self-awareness (or cognitive test anxiety) was a causal agent in determining performances. Again, the limitation in these data is the absence of ecological validity, reducing the generalizability to course performance levels. The test anxiety measure in the present study was predicated on the assumption that the debilitating influence of anxiety is primarily due to cognitive interference with the students’ processing of test content prior to, and during, the exam condition. This interpretation of the influence of test anxiety is consistent with Schwarzer and Jerusalem’s (1992) cognitive interference explanation and Naveh-Benjamin’s (1991) information processing models of test anxiety. The traditional interpretation of cognitive interference suggests that the performance decrement is due to the learner being unable to retrieve previously learned information during the testing situation due to intruding thoughts (Sarason, 1984). Intruding, or interfering, thoughts may include becoming distracted by thoughts centering on ability comparisons with other students, worry over the consequences of poor performance, fixation on task-irrelevant thoughts, or the inability to restrict thought processes to relevant cues and topics (Deffenbacher, 1980; Easterbrook, 1959; Hembree, 1988; Morris et al., 1981). However, the cognitive interference need not be restricted to the retrieval efforts during the examination. Interference may also occur during encoding and storage efforts during test preparation periods. The Cognitive Test Anxiety scale goes beyond preexisting measures of test anxiety by also targeting the interfering thoughts that arise during sessions prior to taking the test. The focus on the impact of anxiety during both time periods relevant to successful test performance (preparation and execution) may explain the enhanced predictive power of the Cognitive Test Anxiety scale and suggests that all investigations of test anxiety need to take into consideration the impact of test anxiety on events outside the testing event itself (see Covington, 1985, for related discussion). In support of this assertion, Naveh-Benjamin (1991) provided evidence that students with test anxiety encounter difficulty in all stages of information processing, showing deficits in encoding, organization, and retrieval (see also NavehBenjamin et al., 1987). Thus, the traditional practice of focusing primarily on the testing session for information regarding the relationship between test anxiety and performance is unnecessarily restrictive. 290 CASSADY AND JOHNSON Procrastination over Tests The incorporation of procrastination into this investigation’s model of test anxiety was an attempt to identify one situational or contextual variable that interacted with test anxiety to provide a meaningful impact on performance. The hypotheses regarding impact of procrastination were not supported in this study. The weak, but significant, relationship between test procrastination and performance on the final examination is likely due to the situational factors that are unique to final examinations. The final examination period required the students to prepare for multiple exams simultaneously. These conditions likely limited the recovery strategies that the procrastinating students use to overcome the debilitating effects of procrastination (i.e., ‘‘cramming’’ or ‘‘pulling all-nighters’’) and do not appear to be directly related to cognitive test anxiety. Gender Effects The results from this investigation contradicted the assertion that gender differences in test anxiety are merely due to heightened levels of emotionality experienced by females (Deffenbacher, 1980; Mueller, 1980). Our results demonstrated that females reported higher levels of test anxiety in both emotionality and cognitive test anxiety. Furthermore, the results from this study do not support Zeidner’s (1990) proposition that females’ heightened reports of test anxiety are simply due to lower levels of academic ability, as there were no observed gender differences in course examination performance. Our results are consistent with the cognitive appraisal model of test anxiety (Schwarzer & Jerusalem, 1992), and the applications of that model that predict females rate evaluative situations as more threatening than males do (Arch, 1987). These perceptions of threat by females have been proposed to arise from self-doubt regarding the ability to cope with an exam or perform in an evaluative setting (Arch, 1987; Zohar, 1998). Emotionality and Test Performance The Bodily Symptoms subscale of the Reactions to Tests (Sarason, 1984) was used in these analyses to provide a method for investigating the relationship between emotionality and performance. The results revealed that participants reporting an average level of emotionality performed better than those reporting high emotionality. Previous research has suggested a linear relationship between emotionality and performance, where high emotionality was debilitating and the absence of emotional test anxiety was optimal (Deffenbacher, 1980; Hembree, 1988; Sarason, 1984). However, the present results demonstrate that a moderate level of anxious physiological arousal may be desirable. These results may be interpreted in the context of an arousal theory. Too much arousal may lead to an inability to focus on the task at COGNITIVE TEST ANXIETY AND ACADEMIC PERFORMANCE 291 hand because the physiological distractions are salient (Geen, 1980). Too little arousal could have a negative impact on performance because the individual fails to recognize the evaluative event as challenging or significant (Schwarzer, 1986), thereby reducing the chance that the individual will adequately prepare. Regardless, the results also supported the hypothesis that the cognitive domain of test anxiety was far more influential with respect to test performance than emotionality. CONCLUSION The results provide support for cognitive explanations of performance deficits encountered by students with heightened levels of test anxiety. Specifically, it appears that students may experience cognitive interference while preparing for examinations, taking examinations, or both. Interference during preparation may lead to a poor conceptualization or organization of the content, limiting the ability to retrieve key information during the test (Naveh-Benjamin, 1991). Thus, the cognitive interference and information processing models of test anxiety seem to best account for the influence of cognitive test anxiety on academic performance observed in these data. A primary concern in test anxiety research was highlighted by this investigation, regarding the contextual nature of the performance measures used in studies examining the impact of test anxiety on performance. Artificial tasks developed for laboratory sessions examining test anxiety do not provide optimal conditions to examine the function of test anxiety on realistic evaluative events. In this study, two design features arose as desirable components when evaluating the impact of test anxiety on performance. First, the use of actual course performance measures as the dependent measure increases the validity of the proposed relationship with the test anxiety variable (which is further supported when the anxiety measures are taken in close temporal proximity). Second, the incorporation of an established measure of test-based performance is essential when developing models of test anxiety’s influence on performance. The disparity between the percentage of variation explained by test anxiety in two models that differed only in the presence of prior performance on the SAT demonstrated the fallacy in many previous estimates of the impact of test anxiety on performance. In all, it appears that cognitive test anxiety accounts for approximately 7 to 8% of the variance in student performance on actual course examinations. This percentage may seem slight, and insignificant, until examined in light of the complex behavior being predicted. A student’s performance on a course examination involves a wide array of factors that influence overall performance, ranging from intelligence and preparation to test-taking skill and luck. To account for 8% of the variance in test scores with cognitive test anxiety is indeed significant. This result is even more noteworthy when comparing the percentage of variance explained by other variables in the pro- 292 CASSADY AND JOHNSON posed models (recall performance on an earlier exam in the class accounted for 25% of the variance, while performance on the SAT accounted for approximately the same amount as cognitive test anxiety). Additive models of test anxiety have been proposed, relying on the notion that test anxiety is a combinatory function of a stable cognitive dimension and a situation-specific emotional dimension (Zohar, 1998). The data in this study did not provide support for an additive model of test anxiety, but did not adequately refute such models either. The use of situation-specific measures of emotionality and procrastination would likely provide a better method of evaluating the additive nature of test anxiety asserted both in this investigation and in Zohar’s (1998) work. To more effectively measure the specific effects of study skills and habits, perceptions of a particular testing event, or level of emotional arousal surrounding an isolated evaluative event, it is desirable to collect data after inducing the participant to consider their feelings about a specific, imminent examination. APPENDIX Cognitive Test Anxiety Scale (A ⫽ Not at all typical of me, B ⫽ Only somewhat typical of me, C ⫽ Quite typical of me, and D ⫽ Very typical of me.) 1. I lose sleep over worrying about examinations. 2. While taking an important examination, I find myself wondering whether the other students are doing better than I am. 3. I have less difficulty than the average college student in getting test instructions straight. 4. I tend to freeze up on things like intelligence tests and final exams. 5. I am less nervous about tests than the average college student. 6. During tests, I find myself thinking of the consequences of failing. 7. At the beginning of a test, I am so nervous that I often can’t think straight. 8. The prospect of taking a test in one of my courses would not cause me to worry. 9. I am more calm in test situations than the average college student. 10. I have less difficulty than the average college student in learning assigned chapters in textbooks. 11. My mind goes blank when I am pressured for an answer on a test. 12. During tests, the thought frequently occurs to me that I may not be too bright. 13. I do well in speed tests in which there are time limits. 14. During a course examination, I get so nervous that I forget facts I really know. 15. After taking a test, I feel I could have done better than I actually did. COGNITIVE TEST ANXIETY AND ACADEMIC PERFORMANCE 16. 17. 18. 19. 20. 21. 22. 23. 24. 25. 26. 27. 293 I worry more about doing well on tests than I should. Before taking a test, I feel confident and relaxed. While taking a test, I feel confident and relaxed. During tests, I have the feeling that I am not doing well. When I take a test that is difficult, I feel defeated before I even start. Finding unexpected questions on a test causes me to feel challenged rather than panicky. I am a poor test taker in the sense that my performance on a test does not show how much I really know about a topic. I am not good at taking tests. When I first get my copy of a test, it takes me a while to calm down to the point where I can begin to think straight. I feel under a lot of pressure to get good grades on tests. I do not perform well on tests. When I take a test, my nervousness causes me to make careless errors. REFERENCES Arch, E. (1987). Differential responses of females and males to evaluative stress: Anxiety, self-esteem, efficacy and willingness to participate. In R. Schwarzer, H. M. van der Ploeg, & C. D. Spielberger (Eds.), Advances in test anxiety research (Vol. 5, pp. 97– 106). Lisse, The Netherlands: Swets & Zeitlinger. Asher, J. W. (1997). The role of measurement, some statistics, and some factor analysis in family psychology research. Journal of Family Psychology, 11, 351–360. Bandalos, D. L., Yates, K., & Thorndike-Christ, T. (1995). Effects of math self-concept, perceived self-efficacy, and attributions for failure and success on test anxiety. Journal of Educational Psychology, 87, 611–623. Benson, J., Moulin-Julian, M., Schwarzer, C., Seipp, B., & El-Zahhar, N. (1992). Cross validation of a revised test anxiety scale using multi-national samples. In K. A. Hagtvet & T. B. Johnsen (Eds.), Advances in test anxiety research (Vol. 7, pp. 62–83). Lisse, The Netherlands: Swetts & Zeitlinger. Cassady, J. C. (2001). Self-reported GPA and SAT: A methodological note. Practical Assessment, Research, and Evaluation 7(12). Available online: http://ericae.net/pare/getvn. asp?v⫽7&n⫽12. Covington, M. V. (1985). Test anxiety: Causes and effects over time. In H. M. van der Ploeg, R. Schwarzer, & C. D. Spielberger (Eds.), Advances in test anxiety research (Vol. 4, pp. 55–68). Lisse, The Netherlands: Swets & Zeitlinger. Culler, R. E., & Holohan, C. J. (1980). Test anxiety and academic performance: The effects of study-related behaviors. Journal of Educational Psychology, 72, 16–26. Deffenbacher, J. L. (1980). Worry and emotionality in test anxiety. In I. G. Sarason, (Ed.), Test anxiety: Theory, research, and applications (pp. 111–124). Hillsdale, NJ: Erlbaum. Depreeuw, E. A. M. (1984). A profile of the test-anxious student. International Review of Applied Psychology, 33, 221–232. Desiderato, O., & Koskinen, P. (1969). Anxiety, study habits, and academic achievement. Journal of Counseling Psychology, 16, 162–165. Easterbrook, J. A. (1959). The effect of emotion and cue utilization and the organization of behavior. Psychological Reports, 66, 183–201. 294 CASSADY AND JOHNSON Everson, H. T., Millsap, R. E., & Rodriguez, C. M. (1991). Isolating gender differences in test anxiety: A confirmatory factor analysis of the test anxiety inventory. Educational and Psychology Measurement, 51, 243–251. Geen, R. G. (1980). Test anxiety and cue utilization. In I. G. Sarason (Ed.), Test anxiety: Theory, research, and applications (pp. 43–61). Hillsdale, NJ: Erlbaum. Hembree, R. (1988). Correlates, causes, and treatment of test anxiety. Review of Educational Research, 58, 47–77. Kalechstein, P., Hocevar, D., Zimmer, J. W., & Kalechstein, M. (1989). Procrastination over test preparation and test anxiety. In R. Schwarzer, H. M. van der Ploeg, & G. D. Spielberger (Eds.), Advances in test anxiety research (Vol. 6, pp. 63–76). Lisse, The Netherlands: Swets & Zeitlinger. Kleijn, W. C., van der Ploeg, H. M., & Topman, R. M. (1994). Cognition, study habits, test anxiety, and academic performance. Psychological Reports, 75, 1219–1226. Kurosawa, K., & Harackiewicz, J. M. (1995). Test anxiety, self-awareness, and cognitive interference: A process analysis. Journal of Personality, 63, 931–951. Lay, C. H., Edwards, J. M., Parker, J. D. A., & Endler, N. A. (1989). An assessment of appraisal, anxiety, coping, and procrastination during an examination period. European Journal of Personality, 3, 195–208. Liebert, R. M., & Morris, L. W. (1967). Cognitive and emotional components of test anxiety: A distinction and some initial data. Psychological Reports, 20, 975–978. McKeachie, W. J. (1984). Does anxiety disrupt information processing or does poor information processing lead to anxiety? International Review of Applied Psychology, 33, 187– 203. Milgram, N. A., Dangour, W., & Raviv, A. (1992). Situational and personal determinants of academic procrastination. The Journal of General Psychology, 119, 123–133. Morris, L. W., Davis, M. A., & Hutchings, C. H. (1981). Cognitive and emotional components of anxiety: Literature review and a revised worry-emotionality scale. Journal of Educational Psychology, 73, 541–555. Mueller, J. H. (1980). Test anxiety and the encoding and retrieval of information. In I. G. Sarason (Ed.), Test anxiety: Theory, research, and applications (pp. 63–86). Hillsdale, NJ: Erlbaum. Naveh-Benjamin, M. (1991). A comparison of training programs intended for different types of test-anxious students: Further support for an information-processing model. Journal of Educational Psychology, 83, 134–139. Naveh-Benjamin, M., McKeachie, W. J., & Lin, Y. (1987). Two types of test-anxious students: Support for an information processing model. Journal of Educational Psychology, 79, 131–136. Nunnally, J. C., & Bernstein, I. H. (1994). Psychometric theory (3rd ed.). New York: McGraw–Hill. Rothblum, E. D., Solomon, L. J., & Murakami, J. (1986). Affective, cognitive, and behavioral differences between high and low procrastinators. Journal of Counseling Psychology, 33, 387–394. Sapp, M., Durand, H., & Farrell, W. (1995). Measures of actual test anxiety in educationally and economically disadvantaged students. College Student Journal, 29, 65–72. Sapp, M., Farrell, W., & Durand, H. (1995). The effect of mathematics, reading, and writing tests in producing worry and emotionality test anxiety with economically and educationally disadvantaged college students. College Student Journal, 29, 122–125. COGNITIVE TEST ANXIETY AND ACADEMIC PERFORMANCE 295 Sarason, I. G. (1961). Test anxiety and the intellectual performance of college students. Journal of Educational Psychology, 52, 201–206. Sarason, I. G. (1984). Stress, anxiety, and cognitive interference: Reactions to Tests. Journal of Personality and Social Psychology, 46, 929–938. Sarason, I. G. (1986). Test anxiety, worry, and cognitive interference. In R. Schwarzer (Ed.), Self-related cognitions in anxiety and motivation (pp. 19–34). Hillsdale, NJ: Erlbaum. Schwarzer, R. (1984). Worry and emotionality as separate components in test anxiety. International Review of Applied Psychology, 33, 205–220. Schwarzer, R. (1986). Self-related cognitions in anxiety and motivation: An introduction. In R. Schwarzer (Ed.), Self-related cognitions in anxiety and motivation (pp. 1–18). Hillsdale, NJ: Erlbaum. Schwarzer, R., & Jerusalem, M. (1992). Advances in anxiety theory: A cognitive process approach. In K. A. Hagtvet & T. B. Johnsen (Eds.), Advances in test anxiety research (Vol. 7, pp. 2–31). Lisse, The Netherlands: Swets & Zeitlinger. Schwarzer, R., & Quast, H. (1985). Multidimensionality of the anxiety experience: Evidence for additional components. In H. M. van der Ploeg, R. Schwarzer, & C. D. Spielberger (Eds.), Advances in test anxiety research (Vol. 4, pp. 3–14). Lisse, The Netherlands: Swets & Zeitlinger. Schumacker, R. E., & Lomax, R. G. (1996). A beginner’s guide to structural equation modeling. Mahwah, NJ: Erlbaum. Silver, M., & Sabini, J. (1981). Procrastinating. Journal for the Theory of Social Behavior, 11, 207–221. Solomon, L. J., & Rothblum, E. D. (1984). Academic procrastination: Frequency and cognitive behavioral correlates. Journal of Counseling Psychology, 31, 503–509. Spielberger, C. D. (1980). Test anxiety inventory. Palo Alto, CA: Consulting Psychologists Press. Spielberger, C. D., Gonzalez, H. P., Taylor, C. J., Algaze, B., & Anton, W. D. (1978). Examination stress and test anxiety. In C. D. Spielberger & I. G. Sarason (Eds.), Stress and anxiety (Vol. 5, pp. 167–191). New York: Wiley. Tice, D. M., & Baumeister, R. F. (1997). Longitudinal study of procrastination, performance, stress, and health: The costs and benefits of dawdling. Psychological Science, 8, 454– 458. Volkmer, R. E., & Feather, N. T. (1991). Relations between Type A scores, internal locus of control and test anxiety. Personality and Individual Differences, 12, 205–209. Williams, J. E. (1991). Modeling test anxiety, self concept and high school students’ academic achievement. Journal of Research and Development in Education, 25, 51–57. Wittmaier, B. C. (1972). Test anxiety and study habits. The Journal of Educational Research, 65, 352–354. Zeidner, M. (1990). Does test anxiety bias scholastic aptitude test performance by gender and sociocultural group? Journal of Personality Assessment, 55, 145–160. Zohar, D. (1998). An additive model of test anxiety: Role of exam-specific expectations. Journal of Educational Psychology, 90, 330–340.
© Copyright 2026