
Hong Kong REITs
Asia Pacific Equity Research 31 January 2015 Hong Kong REITs Rates and REITs – Two can tango In this primer on HK REITs, we’ve analyzed the historical performance of US REITs during interest rate cycles and put to the test the perception that REITs perform poorly when rates are rising. We’ve also compared the HK REIT Code and valuations with other developed markets and summarize the features of each REIT/property-related trust listed in HK. REITs often suffer a correction on initial expectations for rate increases, but they can yield positive returns as the cycle proceeds. Stock-specific attributes are usually the differentiator: our preferred plays are Fortune REIT, Champion REIT, followed by Link REIT. Historical data show low correlation between REITs and 10-year bond yield: Our US REITs team finds that the correlation statistics between REIT stocks and Treasury yields in most time periods largely hover around zero. But as REITs have been beneficiaries of yield-seeking investors, a reversal in rates may unwind some of the benefits. Our regression shows that US REITs have a stronger correlation with GDP than 10-year bond yield, implying that as economy improves, expectation on rental growth gets higher, driving share price performance. Yield spread of certain HK REITs may narrow: Comparing the yield spread of HK REITs with other developed markets including Australia, Japan, Singapore and the US, HK REITs trade at a higher spread most of the time (HK: 4.4%; Singapore: 4.2%, Japan: 2.7%, Australia: 2.4% and US: 1.7%). While liquidity would be a reason for the valuation gap, we think that financial engineering tied with some REITs is another reason. For those HK REITs with clean yield and growth potential in DPU, we expect yield spread to narrow. We regard Fortune as the name for potential yield spread narrowing within our coverage. The stock is now trading at 3.6% yield spread compared with 2.2% before global financial crisis. Hong Kong, Singapore, China REITs Amy Luk, CFA AC (852) 2800 8524 [email protected] Bloomberg JPMA LUK <GO> Leo Ng (852) 2800-8522 [email protected] Cusson Leung (852) 2800-8526 [email protected] J.P. Morgan Securities (Asia Pacific) Limited Figure 1: Yield spread over 10-year government bond yield 5% 4.4% 4.2% 4% 2.7% 3% 2.4% 1.7% 2% 1% 0% HK SingaporeJapan Aus US Source: Bloomberg Prefer Fortune REIT over Link REIT: Given the market cap and liquidity of Link REIT, the stock is usually a core holding for income-fund investors. However, we prefer Fortune REIT over Link REIT given the valuation gap between the two and the higher impact of acquisition growth of Fortune. With Fortune REIT trading at 5.1% 12-month forward yield compared with Link REIT at 3.6%, we expect the valuation gap to narrow given the business risk of Link has increased after entering into property development. Besides, we also like Champion REIT for the potential absorption of upcoming Central office demand. Equity Ratings and Price Targets Company Champion REIT Fortune Real Estate Investment Trust Jinmao Investments Link REIT Ticker 2778 HK FRT SP 6139 HK 823 HK Mkt Cap (HK$ mn) 22,002.78 16,417.54 11,200.00 122,246.10 Rating Price (HK$) 3.83 8.75 5.60 52.90 Cur OW OW N N Prev n/c n/c n/c n/c Price Target Cur Prev 4.15 3.95 9.80 8.60 6.10 n/c 49.50 47.50 Source: Company data, Bloomberg, J.P. Morgan estimates. n/c = no change. All prices as of 29 Jan 15. See page 77 for analyst certification and important disclosures, including non-US analyst disclosures. J.P. Morgan does and seeks to do business with companies covered in its research reports. As a result, investors should be aware that the firm may have a conflict of interest that could affect the objectivity of this report. Investors should consider this report as only a single factor in making their investment decision. www.jpmorganmarkets.com Amy Luk, CFA (852) 2800 8524 [email protected] Asia Pacific Equity Research 31 January 2015 Table of Contents REITs and Rates – Two can tango ..........................................4 US REITs outperformed market in last two rate hike cycles .....................................4 US REITs have a higher correlation with GDP than LT rates ...................................6 HK yield spread higher than other markets ...........................8 Why invest in REITs? .............................................................10 Total return investments ........................................................................................10 Investment risks ....................................................................................................13 Code on REITs ........................................................................14 Amendments to HK REIT Code ............................................................................14 Comparison between REIT regulations across countries.........................................15 Comparison of stapled structure & REITs ...........................19 Components of stapled structure............................................................................19 Advantages and risks of stapled structure...............................................................19 List of REITs and stapled structure in HK............................21 Trustee and REIT Manager....................................................................................21 Link REIT vs Fortune REIT ....................................................23 Non-discretionary as major tenants mix .................................................................23 Solid rental growth since listing.............................................................................24 Prefer Fortune over Link .......................................................................................24 Valuation .................................................................................25 Valuation assumptions ..........................................................................................25 2 Amy Luk, CFA (852) 2800 8524 [email protected] Asia Pacific Equity Research 31 January 2015 Companies ..............................................................................32 Champion REIT.......................................................................33 Fortune Real Estate Investment Trust ..................................37 Jinmao Investments ...............................................................41 Link REIT .................................................................................46 Non-covered companies........................................................52 Langham Hospitality Investment ..........................................53 Langham Hospitality Investment: Summary of Financials ..................55 Mapletree Greater China Commercial Trust.........................56 Mapletree Greater China Commercial Trust: Summary of Financials ....58 New Century REIT ..................................................................59 New Century REIT: Summary of Financials ......................................61 Prosperity REIT.......................................................................62 Prosperity REIT: Summary of Financials..........................................64 Regal REIT ..............................................................................65 Regal REIT: Summary of Financials ................................................67 Spring REIT .............................................................................68 Spring REIT: Summary of Financials...............................................70 Sunlight REIT ..........................................................................71 Sunlight REIT: Summary of Financials ............................................73 Yuexiu REIT ............................................................................74 Yuexiu REIT: Summary of Financials ..............................................76 3 Amy Luk, CFA (852) 2800 8524 [email protected] Asia Pacific Equity Research 31 January 2015 REITs and Rates – Two can tango In this primer report on Hong Kong Real Estate Investment Trusts (REITs), we studied the performance of US REITs performance in the last two Fed funds rate cycles, valuation and REIT Code comparison between HK and other developed markets and a company section summarizing the properties of each REIT and property-related trust structure listed in Hong Kong. It is a general market perception that interest rate-sensitive instruments like Real Estate Investment Trusts (REITs) are not the preferred investment in an interest rate hike cycle. As long-term interest rates increase, the required return for investing in yield products like REITs will be higher, causing negative impact on the equity performance. An interest rate upcycle will also drive up the borrowing cost of REITs which, in turn, may dilute distributable income. Our study on the last two US Fed funds rate hike cycles showed that right after rate hike, US REITs stayed flattish. In the Jun-99 to Jan-01 cycle, REITs underperformed for a few months before rebounding (Table 2). In the Jun-04 to Sep-07 cycle, REITs were flattish one month after rate hike and then outperformed in one year after hike. Currently JP Morgan US economist forecasts a 25 bps increase in fed fund rate in 2Q15 to 0.5%. And for 10-year US Treasury yield, JP Morgan rate strategy team forecasts a 2.4% rise in 4Q15. Table 1: JPM US 10-Year Treasury Yield forecast 1Q15E 2Q15E 3Q15E 4Q15E 2.10% 2.25% 2.30% 2.40% Source: J.P. Morgan estimates as of 23 January 2015 While potential rate hike will impact the investment appetite for property stocks and REITs, we think that HK REITs with company-specific drivers can still generate stable performance this year. In particular, we like stocks with DPU growth potential with undemanding valuation: Fortune REIT fits into this. Champion REIT is our next preferred name where DPU growth is expected to come in 2016. US REITs outperformed towards end of rate hike cycles Since the history of HK REITs is relatively short (the first one, Link REIT, listed in November 2005), and the sector has not passed through a full interest rate hike cycle, we studied the US REITs’ performance in a rising rate environment. When the economy is in expansion mode, the market expects rental incomes to rise, which can lead to DPU increases. In the last two rounds of Fed funds rate hikes, from Jun-99 to Jan-01 and from Jun-04 to Sep-07 where Fed funds rate increased by 175 bps and 425 bps, respectively, we found that the FTSE NAREIT Equity REITs Index initially stayed flattish but outperformed both the Dow Jones Index and S&P 500 Index towards the end of the cycles. 4 Amy Luk, CFA (852) 2800 8524 [email protected] Asia Pacific Equity Research 31 January 2015 Figure 2: REITs outperforming market near the end of Fed funds rate hike cycle in 1999-2000 115 % 110 6.5 105 6 100 5.5 95 5 90 4.5 85 80 Jun-99 7 Sep-99 Dec-99 Mar-00 FTSE NAREIT Equity REITs Index S&P 500 Index Jun-00 Sep-00 Dow Jones Index Fed funds rate (RHS) 4 Dec-00 Source: Bloomberg, J.P. Morgan estimates Figure 3: REITs outperforming general market most of the time in last Fed funds rate hike cycle 200 % 6 180 5 160 4 140 3 120 2 100 1 80 Jun-04 0 Dec-04 Jun-05 Dec-05 FTSE NAREIT Equity REITs Index S&P 500 Index Jun-06 Dec-06 Dow Jones Index Fed funds rate (RHS) Jun-07 Source: Bloomberg, J.P. Morgan estimates During the last Fed funds rate hike cycle in Jun-04 to Sep-07, where rates increased by 425 bps, FTSE NAREIT Equity REITs Index initially stayed flat and went up 53% for the entire rate hike cycle, significantly outperforming Dow Jones Index and S&P500 Index, which increased 29% and 30%, respectively. In the rate hike cycle in Jun-99 to Jan-01, where rates rose to a lesser extent of 175 bps, REITs initially underperformed the general market and finally outperformed towards the end of the rate hike cycle. During that period, REITs Index went up 1% compared with a 2% drop in Dow Jones and a 5% drop in the S&P500. Table 2: REITs outperforming general market in recent two US Fed funds rate hike 30 Jun 99 – 2 Jan 01: Fed funds rate increased 175 bps 1 day 1 month 3 month 1 year REITs 0% -4% -10% -2% entire period 1% Dow Jones 1% 0% -5% -3% -2% S&P500 2% -1% -5% 8% -5% 30 Jun 04 – 17 Sep 07: Fed funds rate increased 425 bps 1 day 1 month 3 month 1 year entire period REITs 1% 1% 7% 27% 53% Dow Jones 0% -3% -4% 0% 29% S&P500 0% -3% -3% 6% 30% Source: Bloomberg, J.P. Morgan estimates 5 Amy Luk, CFA (852) 2800 8524 [email protected] Asia Pacific Equity Research 31 January 2015 Mixed performance before rate hike Regarding performance of REITs before fed funds rate hike, we found that the pattern was mixed. We look at the performance of US REITs 6 months, 3 months and 1 month before rate hike in the last 2 rate hike cycles. In both cases, REITs stayed flattish from 6 months before rate hike to the time of rate hike. In 1 month before hike, the performance was mixed. In Jun-99 to Jan-01 cycle, REITs underperformed while in Jun-04 to Sep-07 cycle, REITs Index was in-line with the general equity market. Table 3: REITs performance before US Fed funds rate hike 30 Jun 99 – 2 Jan 01: Fed funds rate increased 175 bps 6 month before 3 month before 1 month before 1% 8% -3% Dow Jones 18% 11% 2% S&P500 10% 5% 4% REITs 30 Jun 04 – 17 Sep 07: Fed funds rate increased 425 bps 6 month before 3 month before 1 month before REITs 1% -8% 1% Dow Jones 0% 1% 2% S&P500 2% 1% 1% Source: Bloomberg, J.P. Morgan estimates US REITs have a higher correlation with GDP than LT rates In the report 2015 REIT Outlook: We Are Constructive Given Strong Set-Up Going into the Year, JPM US REITs team mentioned that the correlation statistics between REIT stocks and Treasury yields in most time periods and for most bond durations largely hover around zero, suggesting the securities don’t relate much to each other. Yet they also mentioned that the REIT space has been a beneficiary of yield-seeking investors around the globe, and thus a reversal in rates may unwind some of that benefit that has accrued to the space. They forecast REITs to put up a 10-15% total return in 2015. Based on our regression analysis, we found that US REITs have a higher correlation with US GDP than long-term interest rate. Combining the results of impact of US Fed funds rate hike on REITs, we believe the underlying economy matters more with regards to REITs’ performance than rate changes. LT rates not necessarily driving REITs performance Looking at the historical performance of US REITs versus long-term interest rate (10-year bond yield), the correlation between the two was not high. Our US REITs team has similar findings of low correlation between the two. Detailed correlation results are on P.35 of their 2015 REIT Outlook research report. The low correlation implies that rising interest rate may have small impact on US REITs performance. For example, 10-year US bond yield increased from 1.6% in Jun-12 to 3.0% in Dec13, FTSE NAREIT Equity REITs Index was at similar level at the beginning and end of this period. 6 Asia Pacific Equity Research 31 January 2015 FNRE Index Y/Y chg Figure 4: US REITs performance and long-term interest rate not highly correlated 40% 30% 20% 10% 0% -10% -20% -30% -40% -2.50 -2.00 -1.50 -1.00 -0.50 0.00 0.50 1.00 USGG10YR Index Y/Y abs chg FNRE Index Y/Y chg 1.50 2.00 2.50 Predicted FNRE Index Y/Y chg Source: Bloomberg, CEIC, J.P. Morgan estimates GDP has stronger correlation On the other hand, we found that US GDP has a stronger correlation with US REITs performance. When the economy is improving, demand for office and retail spaces are usually higher which, in turn, offers higher bargaining power for the landlords and commercial REITs to raise rental. We think the expectation of DPU growth is driving share prices. Figure 5: US GDP positively driving US REITs performance 40% FNRE Index Y/Y chg Amy Luk, CFA (852) 2800 8524 [email protected] 20% 0% -20% -40% -6.00 -4.00 FNRE Index Y/Y chg -2.00 0.00 2.00 4.00 6.00 US GDP Y/Y Predicted FNRE Index Y/Y chg Linear (FNRE Index Y/Y chg) Source: Bloomberg, CEIC, J.P. Morgan estimates 7 Asia Pacific Equity Research 31 January 2015 US 10-year bond yield -4.0 FTSE NAREIT Equity REITs Index (RHS) Source: Bloomberg, CEIC US GDP Y/Y Mar-14 Mar-12 Mar-10 Mar-08 -6.0 Mar-06 Mar-14 Mar-12 Mar-10 Mar-08 Mar-06 Mar-04 Mar-02 Mar-00 Mar-98 Mar-96 Mar-94 Mar-92 Mar-90 0 -2.0 Mar-04 2 0.0 Mar-02 4 2.0 Mar-00 6 700 600 500 400 300 200 100 0 % 4.0 Mar-98 8 6.0 Mar-96 700 600 500 400 300 200 100 0 % Mar-90 10 Figure 7: US REITs vs US GDP Mar-94 Figure 6: US REITs vs US 10-year bond yield Mar-92 Amy Luk, CFA (852) 2800 8524 [email protected] FTSE NAREIT Equity REITs Index (RHS) Source: Bloomberg, CEIC Both GDP and LT interest rates impacting HK REITs performance We also ran a regression for HK REITs to see the impact of GDP and long-term interest rate (10-year HK Exchange Fund Note yield) changes on REITs’ performance. Given the relatively short listing history, the results of the regression are not totally consistent with the US REITs market. For HK, we found that both long-term interest rates and GDP are positively correlated with HK REITs. Overall, both US and HK markets show that the economy is a factor driving REITs’ performance. Figure 9: HK REITs also positively correlated with LT interest rates 50.0% HSREIT Index Y/Y chg HSREIT Index Y/Y chg Figure 8: HK REITs positively correlated with HK GDP 30.0% 10.0% -10.0% -30.0% -50.0% -10.0 -5.0 0.0 HK GDP Y/Y HSREIT Index Y/Y chg Linear (HSREIT Index Y/Y chg) Source: Bloomberg 5.0 10.0 50.0% 30.0% 10.0% -10.0% -30.0% -50.0% -3.00 -2.00 -1.00 0.00 1.00 2.00 HKGG10Y Index Y/Y abs chg Predicted HSREIT Index Y/Y chg HSREIT Index Y/Y chg Linear (HSREIT Index Y/Y chg) Predicted HSREIT Index Y/Y chg Source: Bloomberg HK yield spread higher than other markets Comparing the yield spread of HK REITs with other developed markets including Australia, Japan, Singapore and US, HK REITs trade at a higher spread most of the time. On a price-to-book perspective, HK REITs trade at a discount to book where most other developed countries are trading above book. 8 Asia Pacific Equity Research 31 January 2015 Amy Luk, CFA (852) 2800 8524 [email protected] Figure 10: REITs – yield spread over 10-year bond 5% Figure 11: REITs – P/B 2.50 4.4% 4.2% 4% 2.13 2.00 1.57 2.7% 3% 2.4% 1.06 1.7% 2% 1% 0% 1.32 1.50 1.00 0.69 0.50 HK Singapore Japan Aus Source: Bloomberg US 0.00 US Japan Australia Singapore Hong Kong Source: Bloomberg We think the valuation gap between HK and other developed markets is attributable to a few factors: Financial engineering: Other than Link REIT, most of the REITs have some sort of financial engineering to boost up the face yield when they had an initial public offering to make it more attractive. Typical examples of financial engineering include dividend waivers and rental guarantees by the sponsors. Using IPO proceeds to fund interest rate swaps to boost yield were quite common in the past. Table 4: Examples of dividend waivers and revenue guarantee of HK REITs and stapled structure REIT / Stapled Structure Dividend waivers Champion REIT Sunlight REIT Yuexiu REIT Langham Hospitality Details Remarks Great Eagle, Wing Tai, and Kerry Properties to waive 100%, 60% and 50% of their dividends in the first three financial years of listing. Dividend waivers by sponsors up till June 2011 (100% share of dividends in FY09, 60% in FY10, and 50% in FY11); minimum rental guarantee of HK$405mn, HK$429mn and HK$455mn for FY07-09, respectively. Great Eagle terminated the dividend waiver upon the purchase of Langham Place. The waivers expired in June 2011. Yue Xiu Property Company and related parties agreed to waive their rights to receive their pro-rata portion of special distribution in FY12 Great Eagle Group to waive to receive distribution in respect of a portion of share stapled units in FY13-FY17. The number of distribution waiver units is 150mn, 150mn, 100mn, 100mn and 50 mn in FY13-17, respectively Expired. In 2012, Yuexiu REIT acquired Guangzhou IFC from Yuexiu Property Company ("YXP") and YXP agreed to provide income support for the REIT from 1 July 2012 to 31 December 2016 for the hotel and serviced apartment business. The top-up payment is the shortfall of actual gross operating profits ("GOP") and the guaranteed GOP of hotel and serviced apartments. Franshion Properties has agreed to provide an annualized distrib+B36ution guarantee amount of not less than HK$960 mn for FY14 and Shortfall Payments for maximum aggregate amount of HK$300 mn for FY15-17 to minimize exposure to the initial start-up risks of Hyatt Regency Chongming, Renaissance Beijing Wangfujing Hotel and Grand Hyatt Lijiang. For FY13, cash received and/or receivable according to the Deed of top-up payments amounted to HK$165.8 mn. For FY13, DPU before and after distribution waiver is HK$0.174 and HK$0.188 respectively. DPU and revenue guarantee Yuexiu REIT Jinmao Investments n/a Source: Company data. Capital recycling is less active: In general, HK REITs are not active in recycling their assets after listing. It is more common for HK REITs to acquire assets than to dispose of assets. As the capital value of the portfolio may not 9 Amy Luk, CFA (852) 2800 8524 [email protected] Asia Pacific Equity Research 31 January 2015 materialize, the stocks normally trade at a discount to book, similar to HK landlords. Liquidity: Both the market capitalization and average trading value of Hang Seng REIT Index are lower than other developed markets, which should be partly due to the smaller number of constituents in the REIT Index (10 members in HSREIT Index vs 156 members in the FNER Index). Within Asia, the average turnover of Japan and Singapore REIT is 6.2x and 1.7x of HK, respectively. Some international investors might prefer a more liquid market. Table 5: Comparison of market cap and liquidity Cur. mkt cap 3M avg turnover (US$MM) (US$MM) No. of constituents 903,892 1,502 155 48,881 89 32 Japan 89,141 324 49 AS52PROP Index Australia 87,477 198 27 HSREIT Index Hong Kong 28,222 52 10 Index Country FNER Index US FSTREI Index Singapore TSEREIT Index Source: Bloomberg. Why invest in REITs? A REIT is a collective investment scheme constituted as a trust that invests primarily in real estate with the aim to provide returns to holders derived from the rental income of real estate. In HK, REITs are required to distribute at least 90% of audited annual net income after tax. It provides an opportunity for investors to own real estate without large amounts of capital commitments. As a REIT usually holds a portfolio of different properties, it provides diversification of real estate portfolio that an individual investor would not be able to buy alone. Total return investments In general, investors investing in REITs are looking for stable recurring income, high-dividend payout and long-term growth potential. REITs are considered total return investments which provide relatively high dividends compared with other property developers and landlords, and provide capital appreciation opportunity as the assets’ values appreciate via organic growth and acquisition growth. US REITs outperformed nine times in past 15 years Comparing the performance of US REITs, US corporate bonds and US equities in the past 15 years, we found that US REITs have outperformed bonds and equities in nine out of the past 15 years. We use JPM US Liquid Index (JULI) as a reference for bonds performance, which measures the performance of investment grade dollar denominated corporate bond market. The US REITs Index was the worst performer in 2007 and 2008 since the physical property sector experienced some downturn during the Global Financial Crisis (GFC). 10 Asia Pacific Equity Research 31 January 2015 Table 6: Performance of US REITs vs bonds and equity from 2000 to 2014 REITs Bonds Dow Jones S&P 500 2000 17% 5% -6% -10% 2001 6% 3% -7% -13% 2002 -3% 6% -17% -23% 2003 28% 1% 25% 26% 2004 24% -1% 3% 9% 2005 7% -3% -1% 3% 2006 30% -2% 16% 14% 2007 -19% -1% 6% 4% 2008 -41% -6% -34% -38% 2009 21% 11% 19% 23% 2010 23% 2% 11% 13% 2011 4% 2% 6% 0% 2012 14% 2% 7% 13% 2013 -1% -7% 26% 30% 2014 25% 2% 8% 11% Source: Bloomberg, J.P. Morgan estimates. From Dec-99 to Dec-14, FTSE NAREIT Equity REITs Index went up 175%, more than bonds index and equity indexes. Yet during the GFC period the REIT index experienced significant correction. Bonds index is less volatile than REITs and general equity over the long run. For the same period from Dec-99 to Dec-14, JPM JULI Index went up 13%. Figure 12: US REITs vs Equity and Bonds 300 130 250 120 200 110 150 100 100 FTSE NAREIT Equity REITs Index ("RHS") Dow Jones Index Dec-14 Dec-13 Dec-12 Dec-11 Dec-10 Dec-09 Dec-08 Dec-07 Dec-06 Dec-05 Dec-04 Dec-03 80 Dec-02 0 Dec-01 90 Dec-00 50 Dec-99 Amy Luk, CFA (852) 2800 8524 [email protected] JPM US Liquid Index (RHS) Source: Bloomberg, J.P. Morgan estimates. HK REITs outperforming four times in the past six years The Hang Seng REIT Index was launched in October 2008 so the history for performance comparison is relatively short. We use JPM Asia Credit Index (JACI Index Hong Kong) to track bond market performance. In the past six years, HK REITs have outperformed the Hang Seng Index and JPM HK bond index four times. While the low interest rate environment has attracted investors to look for yield projects, we think that DPU growth for some REITs, like Link REIT and Prosperity REIT, supported the share price growth. 11 Amy Luk, CFA (852) 2800 8524 [email protected] Asia Pacific Equity Research 31 January 2015 Table 7: Performance of HK REITs vs Bonds and Equities from 2009 to 2014 REITs Equity Bonds 2009 54% 52% 13% 2010 37% 5% 4% 2011 -13% -20% -1% 2012 36% 23% 7% 2013 -3% 3% -4% 2014 10% 1% 3% Source: Bloomberg, J.P. Morgan estimates Figure 13: HK REITs vs Bonds and Equities 150 140 130 120 110 100 Oct-08 Jan-09 Apr-09 Jul-09 Oct-09 Jan-10 Apr-10 Jul-10 Oct-10 Jan-11 Apr-11 Jul-11 Oct-11 Jan-12 Apr-12 Jul-12 Oct-12 Jan-13 Apr-13 Jul-13 Oct-13 Jan-14 Apr-14 Jul-14 Oct-14 350 300 250 200 150 100 50 0 Hang Seng REIT Index Hang Seng Index 90 JPM HK bond index (RHS) Source: Bloomberg, J.P. Morgan estimates HK$ HK$ 0.30 0.25 0.20 0.15 0.10 Champion REIT share price Source: Bloomberg 12 0.40 0.35 Jun-06 Dec-06 Jun-07 Dec-07 Jun-08 Dec-08 Jun-09 Dec-09 Jun-10 Dec-10 Jun-11 Dec-11 Jun-12 Dec-12 Jun-13 Dec-13 Jun-14 Dec-14 5.0 4.5 4.0 3.5 3.0 2.5 2.0 1.5 1.0 0.5 Figure 15: Fortune REIT – share price vs DPU 8.5 7.5 6.5 5.5 4.5 3.5 2.5 1.5 0.5 HK$ HK$ Sep-03 May-04 Jan-05 Sep-05 May-06 Jan-07 Sep-07 May-08 Jan-09 Sep-09 May-10 Jan-11 Sep-11 May-12 Jan-13 Sep-13 May-14 Figure 14: Champion REIT – share price vs DPU DPU (RHS) Fortune REIT share price Source: Bloomberg DPU (RHS) 0.40 0.35 0.30 0.25 0.20 0.15 0.10 0.05 0.00 Amy Luk, CFA (852) 2800 8524 [email protected] Asia Pacific Equity Research 31 January 2015 Figure 16: Link REIT – share price vs DPU 60 HK$ Figure 17: Prosperity REIT – share price vs DPU HK$ 50 2.00 3.0 1.75 2.5 1.50 40 HK$ 0.14 0.13 1.5 1.00 0.16 0.15 2.0 1.25 30 HK$ 0.12 1.0 0.11 10 0.50 0.5 0.1 Link REIT share price Source: Bloomberg Mar-06 Sep-06 Mar-07 Sep-07 Mar-08 Sep-08 Mar-09 Sep-09 Mar-10 Sep-10 Mar-11 Sep-11 Mar-12 Sep-12 Mar-13 Sep-13 Mar-14 Sep-14 0.75 Mar-06 Sep-06 Mar-07 Sep-07 Mar-08 Sep-08 Mar-09 Sep-09 Mar-10 Sep-10 Mar-11 Sep-11 Mar-12 Sep-12 Mar-13 Sep-13 Mar-14 Sep-14 20 DPU (RHS) Prosperity REIT share price DPU (RHS) Source: Bloomberg Investment risks Acquisitions may cause dilution As most of the REITs listed in Hong Kong pay out 100% of their distributable income, the acquisition of new assets usually requires new capital financing of equity and debt. Since most of the REITs are trading below book value, equity financing may cause NAV and DPU dilution. The acquisition of Langham Place in 2008 was an example of dilution as Champion REIT issued equity to fund the acquisition. That said, acquisitions may not always lead to DPU dilution. For instance, Fortune REIT funded the acquisition of Fortune Kingswood in 4Q13 mainly by debt and partly by equity and achieved strong DPU growth in 2014. For the NPI growth of 25.1% in FY14, 18.4% was brought by Fortune Kingswood. DPU therefore grew by 15.8% Y/Y in FY14. Higher interest cost may affect distribution growth Given that REITs investors are usually seeking yield, it is generally perceived that the performance of REITs will be affected by rising interest rates. As most of the REITs or Trust Structures have gearing (total debt to total assets) of over 20%, their interest expenses will increase in a rising rate environment which, in turn, will affect earnings and distribution growth. HK economic cycle may not follow US In the case of interest rate hikes in HK, due to the fact that the HKD is pegged to the USD, interest rate cycles in HK may not be fully following economic cycles. In an environment of interest rate hikes in a sluggish economy, HK REITs performance may get affected. Looking at the historical correlation between HK economy and US and China, we found that the correlation between HK and China has been quite steady over the long-term. After GFC, the correlation between HK and US has jumped which we think was due to the correlation of the financial markets in HK and US. Given that HK economy appears to be affected by both China and US and JPM China economist is forecasting a moderation in China GDP to 7.2% in 2015, there is a possibility that HK economic growth will lag HK interest rate hike. 13 Asia Pacific Equity Research 31 January 2015 Amy Luk, CFA (852) 2800 8524 [email protected] Figure 18: Correlation between US and HK and China GDP growth Figure 19: China, HK and US GDP growth (%) 1.00 20.00 15.00 0.50 10.00 5.00 0.00 0.00 -5.00 Source: IMF, CEIC, J.P. Morgan estimates. Note: correlation estimated on 10 year rolling basis. HK China 2013 2011 2009 2007 2005 2003 2001 1999 1997 1995 1993 Corr. of HK and China real GDP growth Corr. of HK and US real GDP growth Corr. of China and US real GDP growth 1991 -10.00 1989 2013 2011 2009 2007 2005 2003 2001 1999 1997 1995 1993 1991 1989 -0.50 US Source: IMF, CEIC. Potential drop in market value impacting gearing levels The potential drop in market value of properties in the case of a market downturn may cause gearing to exceed 45%, breaching regulatory limits. In case the limit is exceeded, the REIT may not be required to dispose of assets to pay off part of the borrowings. But no further borrowing is permitted. Code on REITs Compared with other developed financial markets in Asia, HK is relatively late in setting up the Code on Real Estate Investment Trusts (REIT Code). The Securities and Futures Commission (SFC) introduced the HK REIT Code in 2003. The first REIT listed in HK was Link REIT (823 HK), which issued its IPO in November 2005. Prior to that, another REIT with assets exposure in HK, Fortune REIT, chose to first list in Singapore in December 2003 and then become dual listed in both Hong Kong and Singapore. Amendments to HK REIT Code The HK REIT Code was amended in August 2014 to expand the scope of investment of a REIT. Investments in properties under development and investments in financial instruments are now allowed. Key amendments include: At least 75% of the gross asset value (GAV) shall be invested in real estate that generates recurring rental income at all times; Investments in properties under development and property development activities should not exceed 10% of GAV at time of acquisition; A REIT may invest in the following financial instruments (Relevant Investments) where the holding of Relevant Investments issued by any single group of companies may not exceed 5% of GAV: a) securities listed on the Stock Exchange of Hong Kong Limited or other internationally recognized stock exchanges b) unlisted debt securities 14 Amy Luk, CFA (852) 2800 8524 [email protected] Asia Pacific Equity Research 31 January 2015 c) government and other public securities d) local or overseas property funds The combined value of the Relevant Investments, property development costs and aggregate contract value of uncompleted units of real estate shall not exceed 25% of GAV. Link REIT is key beneficiary of amendments The amendments will provide more flexibility for HK REITs, in our view. For REITs looking for potential acquisition opportunities, previously they could only look for completed properties. With the introduction of the amendments, they can now invest in greenfield projects and be involved in designing the layout they prefer. We think that Link REIT is the key beneficiary from this perspective as they do not have a sponsor. Other than investing in new development properties, Link REIT can also consider redeveloping aged properties in its portfolio for rental uplift potential. However, we viewed the first property development project of Link REIT as unattractive on an estimated initial yield of cost of 2.6-3.0%. Most other REITs listed in Hong Kong have sponsors where they normally acquire properties from sponsors on a completed basis where sponsors are involved in the design and development of the properties. Pros and cons of investment in properties under development While the amendments provide flexibility for REITs, there are also some risks associated with property development. Below is the summary of key positives and negatives of investment in development properties for REITs: Positives For acquiring properties under development, REITs can be involved in the floor plan they prefer, which may generate a higher yield upon completion. Allowance of redevelopment may generate a higher yield than assets enhancement. Negatives REITs without a property developer sponsor may not have extended experience in property development. Properties under development are not income-generating and not contributing to dividends until completion. Comparison between REIT regulations across countries As investors look into different REIT markets, we believe it is worth comparing the REIT regulations across markets. The REIT regulations can help protect investors' interests to various extents and assess the potential investment risks. Also, they allow us to take into account the financial impacts from different tax policies. We provide below a summary of REIT regulations in some key Asian markets as well as the US in terms of: 1) tax policies, 2) investment scope, and 3) leverage limit. 15 Amy Luk, CFA (852) 2800 8524 [email protected] Asia Pacific Equity Research 31 January 2015 Tax policies on REITs and investors When we look at tax policies concerning REITs, it is split into two levels: 1) REIT level and 2) investor level. For the seven markets in our study, all of them only levy tax from either the REIT (on income) or investor (on distribution) except the Philippines so as to avoid double taxation. Regarding tax to be paid by REITs, it is indeed fairly common for countries such as Australia, Singapore, Japan and the US to exempt tax if taxable income is distributed. That said, these countries will levy tax from investors (e.g., withholding or income tax) on the distributions received. In contrast, Hong Kong charges tax at the REIT level (e.g., profit tax of 16.5% if the REIT holds real estate indirectly via SPV) but none at the investor level. However, the Philippines charges both income tax and dividend tax even though preferential withholding tax rate will be applied if the investing entities satisfy certain conditions. Hence, the Philippines may look less attractive from a tax perspective compared to other markets. Investments scope: Can REITs invest in development properties? After amendments on the HK REIT Code, Japan became the only market prohibiting investments in property developments among the seven countries. That said, Hong Kong, the Philippines, Singapore and Thailand all set a cap of 10% of GAV or total portfolio size on these investments. On the other hand, some markets also set restrictions on the types of assets that can be invested. For instance, some require at least 75% of GAV to be invested in real estate assets or real estate that generates recurrent income. Certain markets are also allowed to invest in financial instruments but also with a cap. Gearing limits In terms of restrictions on leverage, Singapore, Thailand and the Philippines set the limit at 35% of gross borrowings to total assets or total property value. That said, the gearing limit will be raised to 60-70% if the REIT obtains a credit rating. For Hong Kong, the universal limit of 45% is still in place. In contrast, Japan, the US and Australia do not have any specific limit on leverage. However, individual REITs in Japan tend to establish leverage caps as a best practice announcement to investors. 16 Amy Luk, CFA (852) 2800 8524 [email protected] Asia Pacific Equity Research 31 January 2015 Table 8: Comparison of REIT regulations across countries (part 1) Do Investors in REITs Pay Tax on Distributions? Yes; Withholding tax on distributions: Domestic: None; Foreign: 30% or reduced amount of 15% if invest via certain countries. Can REITs Invest in Development Properties? Yes, REITs can invest in properties under development. However, the REIT cannot be the developer otherwise tax flow-through treatment will not apply, but a stapled corporation can be the developer Is there a Maximum % of Assets that Invested in Development Properties? No Country Australia Do REITs Pay Tax? No, not on taxable income that is distributed Hong Kong Yes. Applicable taxes: - Property tax (15% on net assessable value which is computed based on rental income) if the REIT holds real estate in HK directly and derives rental income - Profit tax (16.5%) if the REIT holds real estate indirectly via SPV - Exempted from property tax and profit tax if income derived from real estate located outside HK - Stamp duty for lease of property (0.25% to 1% of average yearly rent depending on lease term) No Yes 10% of gross asset value Philippines Yes. A REIT shall be subject to income tax (30%) and also 12% VAT on gross sales from any disposal of real property or gross receipts from rental revenues. Yes. Cash or property dividends paid by a REIT shall be subject to a final tax of 10%, unless (a) the dividends are received by a non-resident foreign individual or corporation entitled to claim a preferential withholding tax rate of less than 10% pursuant to an applicable tax treaty; or (b) the dividends are received by a domestic corporation or resident foreign corporation. Overseas Filipino investors are exempt from the dividends tax for 7 years from the date the tax regulations implementing the Act takes effect. Yes. A REIT may invest in real estate located in the Philippines, whether freehold or leasehold. However, a REIT shall not undertake property development activities whether on its own, in a JV with others, or by investing in unlisted property development companies, unless certain conditions are met. Yes. The total contract value of property development activities undertaken and investments in uncompleted property developments should not exceed 10% of the Deposited Property of the REIT (allowed only if the REIT intends to hold the developed property upon completion). Singapore No if payout ratio is a min 90% Depending on status: no taxation for individual investors; prevailing corporate tax rate (currently 17%) for local corporate investors and 17% withholding tax for foreign corporate investors (reduced to 10% for distributions made during the period from 18 Feb 2005 to 31 Mar 2015). Yes Capped at 10% of total portfolio size. Thailand* No Yes (10% for personal, 23% corp) Yes 10% Japan No; as long as 90%+ of earnings are distributed as dividends, JREITs are not required to pay taxes. Yes; total tax on distribution (income tax + special corporate tax for reconstruction + residents tax) is 10.147% until 12 Dec 2013 and increased to 20.315% from 2014 No; JREITs are forbidden by law to invest in development properties. - US No; as long as 90%+ of taxable net income is distributed as dividends. However, the REITs may have to pay taxes on non-rental related income though this tends to be small. Companies can have a TRS (taxable REIT subsidiary) up to 25% of income on which they do pay taxes Yes, based on their federal ordinary income tax rate Yes No Source: PwC Worldwide REIT Regimes (May 2013), KPMG Taxation of REIT (Dec 2013), Asia Pacific REIT Survey (April 2011), APREA's Asia Pacific REITs: a comparative regulatory & tax study (Jun 2014), local regulatory authorities, J.P. Morgan. 17 Amy Luk, CFA (852) 2800 8524 [email protected] Asia Pacific Equity Research 31 January 2015 Table 9: Comparison of REIT regulations across countries (part 2) Country Australia Hong Kong Are there Restrictions on the Type of Assets in which REITs can Invest? No - At least 75% of GAV shall be invested in real estate that generates recurrent rental income at all times What is the Definition of Leverage? NA What is the Maximum Permissible Leverage? Unrestricted Does the Maximum Permissible Leverage Change if the REIT is Rated? NA Gross borrowings / total assets 45% NA - May invest in the following financial instruments provided that holdings in any single group of companies would not exceed 5%: (a) listed securities, (b) unlisted debt securities, (c) government and other public securities and (d) local or overseas property funds. - The combined value of financial instruments, property development costs and aggregate contract value of uncompleted units of real estate shall not exceed 25% of GAV Philippines Yes. At least 75% of the deposited property of the REIT must be invested in income generating real estate. Not more than 15% of investible funds may be invested in any one issuer’s securities or any one managed fund, except with respect to government securities where the limit is 25%. Not more than 5% of its investible funds may be invested in synthetic investment products (subject to the receipt of special authority from the SEC) The definition is not explicit but the implementing rules and regulations mentioned that "borrowings and deferred payments" form part of leverage. Total borrowings and deferred payments should not exceed 35% of deposited property. Yes. If rated by a duly accredited or internationally recognized rating agency, total borrowings and deferred payments may exceed 35% to a maximum of 70% of deposited property. Singapore No restrictions on asset class, but min 75% of portfolio must be in realestate/real-estate related assets Gross borrowings / total assets 35% of deposited property for non credit-rated REITs Yes (up to 60% if REIT is credit-rated) Thailand* No Gross borrowings / total assets not higher than 35% 60% in case having investment grade rating Japan None; but individual REITs establish boundaries on their statutes The employing of borrowed capital to increase profitability (ratio) of owned capital None by law; individual REITs tend to establish leverage caps as safe practice announcement to investors. - US 75% of assets must be real estate related (can also be loan secured by property), and 75% of income must be derived from real estate income (rents or mortgages) Investment community looks at Debt to Total Market Cap and Net Debt/EBITDA, also coverage ratios None specifically - Note: Proposals on regulatory changes in Singapore was released and changes can potentially take place in 1H15. Also, Thailand is still in the process of setting regulations by the SEC and details provided here are preliminary and not finalized yet. Source: PwC Worldwide REIT Regimes (May 2013), KPMG Taxation of REIT (Dec 2013), Asia Pacific REIT Survey (April 2011), APREA's Asia Pacific REITs: a comparative regulatory & tax study (Jun 2014), local regulatory authorities, J.P. Morgan. 18 Amy Luk, CFA (852) 2800 8524 [email protected] Asia Pacific Equity Research 31 January 2015 Comparison of stapled structure & REITs In 2013, a property-related trust was listed in the form of shared stapled units structure (“stapled structure”), which was the spin-off of three Hong Kong hotels from Great Eagle to Langham Hospitality Investment (1270 HK). In 2014, another stapled structure Jinmao Investments (6139 HK) was listed. Components of stapled structure In the case of Jinmao, each share stapled unit comprises three components. They can only be dealt with together in Share Stapled Units and may not be dealt with individually. There is only a single price quotation for the structure. The components are: Units; A beneficial interest in a specifically identified Ordinary Shares held by the Trustee-manager, which is “Linked” to the Unit; and A specifically identified Preference Share which is “Stapled” to the Unit. For a detailed description of the structure, please refer to p.12-13 of our initiation report “Jinmao Investments – Diversified portfolio capturing growing domestic travel; Initiate with Neutral” published on 25 August 2014. Advantages and risks of stapled structure The stapled structure is more flexible in terms of type of investment, percentage of ownership of assets, etc. even after the amendments of the REIT Code. For example, there is no limit on percentage of GAV invested in any type of assets for stapled structure. In addition, dividend policy and gearing levels are also more flexible than in REITs. The structure is relatively new to the Hong Kong market. The risk is that the HK courts may not interpret the relevant investor protection provisions applicable to holders of stapled structure in the same manner as those enjoyed by shareholders of companies listed on the Stock Exchange of Hong Kong. 19 Amy Luk, CFA (852) 2800 8524 [email protected] Asia Pacific Equity Research 31 January 2015 Table 10: Key differences between Jinmao Investments and REITs Jinmao Investments A fixed single investment trust and may only invest in securities and other interests in Jinmao (China) Investments Holdings Limited (“the Company”). The Trustee-Manager has a specific and limited role, which is to administer Jinmao Investments REITs Trustees or managers typically have wider powers of investment and would typically invest in and manage a portfolio of securities issued by different entities and/or other assets Type of investments Flexible to undertake development projects and to invest in other types of assets A REIT is permitted to invest in income generating real estate, property under developments and financial instruments Distribution Policy 100% of Distributable Income for period 31 December 2014 and FY15 and not less than 90% thereafter but the Company has the flexibility to distribute a lesser % A REIT in HK is required to distribute not less than 90% of its audited annual net income after tax under the REIT Code Share buyback Share Stapled Units cannot be repurchased or redeemed by Jinmao Investments or the Company unless and until specific regulations are introduced by the Securities and Futures Commission Allowed Issue of new Units Any issue by Jinmao Investments and the Company of new Share Stapled Units on a non-pro rata basis requires prior approval by an Ordinary Resolution Allowed Gearing limit Jinmao Investments is not permitted to incur any debt but no limit on the Company to incur debt 45% (aggregate borrowings to total gross asset value) Ownership of assets No restriction on ownership and control level A REIT should have majority (more than 50%) ownership and control in each property at all times Role of trustee Source: Company data, Securities and Futures Commission. 20 Asia Pacific Equity Research 31 January 2015 Amy Luk, CFA (852) 2800 8524 [email protected] List of REITs and stapled structure in HK There are currently ten REITs listed in Hong Kong with assets located in Hong Kong and China. Including the two stapled structure trusts, there are altogether 12 property related trusts listed in HK. On the other hand, there are two REITs listed in Singapore with assets and rental income generated in Hong Kong and China, namely Fortune REIT and Mapletree Greater China Commercial Trust. The types of assets that HK REITs and stapled structure trusts are exposed to are mainly office, retail and hotel. In general, the valuation of the properties held by REITs and trusts are revalued every six months and reflected in the financial statements. However, hotels are usually recognized as cost less depreciation in the balance sheet unless there are master lease arrangements so that the hotels are classified as investment properties. Table 11: Summary of HK REITs – financial positions as at Jun-14 / Sep-14 Company Sponsor No. of prop Property valuation HK$mn Total debt HK$mn Total assets HK$mn Gearing % of fixed rate / hedged debt Champion REIT Great Eagle 2 Fortune REIT Cheung Kong 17 Office / Retail 61,150 14,704 62,497 23.5% 21% Retail 30,880 9,923 31,798 31.2% Jinmao Investments Franshion Properties 55% 9 Hotel / Office 10,092 5,344 21,371 37.0% Langham Hospitality Great Eagle n/a 3 Hotel 16,719 6,800 17,527 38.8% 0% Link REIT n/a Mapletree Greater China (in SGD) Mapletree 2 Retail / Office 125,486 14,293 129,932 11.0% 80% 4,722 1,821 4,825 37.7% 77% New Century REIT (in Rmb) New Century Group/Carlyle 5 Prosperity REIT Cheung Kong 8 Hotel 4,190 1,257 4,413 28.5% 93% Office / I/O / Retail 9,609 2,774 9,679 28.9% Regal REIT Regal Hotels 7 Hotel 50% 22,749 7,594 23,897 31.8% Spring REIT (in USD) n/a 1 51% Office / Retail 1,276 458 1,367 33.5% 100% Sunlight REIT Henderson Land Yuexiu REIT (in Rmb) Yuexiu Property 19 Office / Retail 15,391 3,872 16,152 24.3% 66% 6 Office / Retail 22,987 7,704 24,412 31.6% 28% 174 Type Retail / Carpark Source: Company data, J.P. Morgan estimates Trustee and REIT Manager Every REIT in HK should be structured as a trust and appoint a trustee which has the fiduciary duty to hold the assets of a REIT. The trustee is usually a bank or a subsidiary of a bank. Trustee’s fees are paid to the trustee as a percentage of property value. Internal and External Manager In addition, every REIT in HK is required to appoint a management company to manage the portfolio, including formulating the investment strategy, managing cash flows, planning the tenant mix, etc. Other than Link REIT, which is internally managed, the assets of other REITs and real estate trust structure listed in HK are managed externally by REIT Managers where manager fees are paid based on asset size and property income. For internally managed REIT, the manager’s fee is paid on cost recovery basis. 21 Amy Luk, CFA (852) 2800 8524 [email protected] Asia Pacific Equity Research 31 January 2015 REIT Managers fee payable in units and cash REIT Managers in HK are usually subsidiaries of the sponsors. REIT managers’ fees are paid in the form of cash and units. After receiving units as managers’ fees, the REIT managers normally sell the units in the market. For the case of stapled structure, they are considered as internally managed as the Trustee-Manager will not receive any fee for administrating the stapled structure. The costs and expenses of administering the stapled structure are deducted from the trust property. Table 12: Summary of REIT Manager fee structure REIT REIT managers' fee structure Champion REIT Fortune REIT Link REIT Mapletree Greater China 12% of NPI 0.3% of property values + 3% of NPI None 10% of distributable income + 25% of DPU change New Century REIT Prosperity REIT Regal REIT Spring REIT Sunlight REIT Yuexiu REIT 0.3% of property values + 4% of NPI 0.4% of property values + 3% of NPI 0.3% of property values + 3% of NPI 0.4% of property values + 3% of NPI 0.4% of property values + 3% of NPI 0.3% of property values + 3% of NPI Source: Company data 22 Trustee's fee (% of prop value) 0.03% 0.035% 0.008% 0.02% 0.015-0.025% 0.03% 0.015-0.025% 0.025% 0.02-0.03% 0.03% Remark REIT Manager to receive 50% of manager's fee in units and 50% in cash for 1H14 Internally managed REIT Manager to receive 80% of fee in units and 20% in cash for FY15 REIT Manager to receive 100% of fee in cash for FY15 REIT Manager to receive 80% of fee in units and 20% in cash for FY14 REIT Manager to receive 50% of manager's fee in units and 50% in cash for FY15 REIT Manager to receive 95% of manager's fee in units and 5% in cash for 1H14 Amy Luk, CFA (852) 2800 8524 [email protected] Asia Pacific Equity Research 31 January 2015 Link REIT vs Fortune REIT Non-discretionary as major tenants mix Given the similar types of tenants mix exposure of Link REIT and Fortune REIT, investors are interested in comparing these two retail REITs. Both of the REITs hold retail malls located in decentralized areas servicing mainly the residents living nearby. Malls of Link REIT are located close to public estates, whereas malls of Fortune REIT are near private estates. Since target customers are mainly residents staying near the malls, non-discretionary consumer categories account for a major portion of tenants mix. Food and beverage accounts for 25% and 23% of tenants mix of Link and Fortune, respectively. Table 13: Link REIT and Fortune REIT – summary of portfolio No. of properties Fortune REIT Link REIT 18 (including Laguna Plaza) 175 (including Kwun Tong office project) Passing rents (HK$psf) 36.4 43.6 34,800 125,486 Retail: 4.70% Retail: 4.76%; Carpark: 5.09% 16,455 120,433 5.1% 3.6% Property valuation (HK$mn) Cap rate Market cap (HK$mn) 12-month forward yield (%) Source: Company data, J.P. Morgan estimates Figure 20: Link REIT – retail trade mix by rent as at 30 Sep 2014 Others 17% Personal Care, Medicine, Optical, Books & Stationery 8% Services 11% Markets/Cooked Food Stalls 15% Food and Beverage 25% Education/Welfare, Office and Ancillary 1% Supermarkets and Foodstuff 23% Source: Company data Figure 21: Fortune REIT – tenant mix by gross rental income as at 31 Dec 2014 Wet Markets Others 4% Supermarkets 1% 8% Services & Education 21% Leisure & Entertainment, Sports & Fitness 3% Gifts & Speciality, Hobbies, Toys, Jewellery 5% Banking & Real Estate Services 21% Community Services 1% Electronics & IT 2% Fashion & Shoes 8% Homewares & Home Furnishings 3% Food & Beverages 23% Source: Company data 23 Asia Pacific Equity Research 31 January 2015 Amy Luk, CFA (852) 2800 8524 [email protected] Solid rental growth since listing Both REITs recorded solid growth in average rents since listing, mainly driven by assets enhancements and tenants mix rebranding. Average passing rent of Fortune went up 143% from HK$15 psf as at Dec-03 (on gross rentable area) to HK$36.4 psf as at Sep-14. For Link REIT, it went up 90% from HK$23 psf as at Mar-06 (on internal floor area) to HK$43.6 psf as at Sep-14. Fortune experienced a big jump in average passing rent in 2005 after the acquisition of six malls as the new malls had a higher average passing rent than the original five malls in the portfolio. The passing rent of Link is higher than that of Fortune, which is mainly due to a different basis. Rent of Link is measured on an internal floor area basis where Fortune is measured on gross rentable area (GRA) basis. We found that for some properties of Fortune, the GRA is the same as GFA. Assuming GRA and GFA is the same for Fortune and assuming 50% efficiency of Link's malls, the average passing rent of Fortune would be more than 60% higher than Link. Figure 23: Fortune REIT – passing rent Link REIT - passing rent (HK$ psf) Fortune REIT - passing rent (HK$ psf) Passing rent - Y/Y change (RHS) Passing rent - Y/Y change (RHS) Source: Company data, J.P. Morgan estimates Jun-14 Sep-13 Dec-12 Jun-11 Mar-12 Sep-10 Dec-09 Mar-06 Sep-06 Mar-07 Sep-07 Mar-08 Sep-08 Mar-09 Sep-09 Mar-10 Sep-10 Mar-11 Sep-11 Mar-12 Sep-12 Mar-13 Sep-13 Mar-14 Sep-14 20.0 Jun-08 25.0 Mar-09 30.0 Sep-07 35.0 45% 40% 35% 30% 25% 20% 15% 10% 5% 0% -5% HK$ psf Dec-06 40.0 40.00 35.00 30.00 25.00 20.00 15.00 10.00 Jun-05 HK$ psf Mar-06 14% 12% 10% 8% 6% 4% 2% 0% Sep-04 45.0 Dec-03 Figure 22: Link REIT – passing rent Source: Company data, J.P. Morgan estimates Prefer Fortune over Link For 2015, we expect retail rent to be flattish. But some malls of Link and Fortune can still have rental growth potential in 2015 for mall-specific reasons e.g. malls after assets enhancement. Among the two, we prefer Fortune REIT over Link REIT for a few reasons: 24 Valuation of Fortune REIT is more attractive with higher dividend yield than Link REIT (12-month forward yield: Fortune: 5.1%, Link: 3.6%). Impact of each acquisition for Fortune is higher than Link given Fortune’s size is smaller, e.g., Fortune Kingswood in Tin Shui Wai contributed to 18% growth in NPI in FY14. Amy Luk, CFA (852) 2800 8524 [email protected] Asia Pacific Equity Research 31 January 2015 Valuation As the objectives of HK REITs and Share Stapled Units Structure are to focus on the payment of distributions to unit holders and to provide unit holders with the potential for sustainable long-term growth, we believe a dividend discount valuation model (DDM) is a fair method to value REITs and Share Stapled Units Structure. Valuation assumptions For REITs and stapled structure under our coverage, we apply a risk-free rate of 2.75% versus current 10-year bond yield of 1.4% to incorporate potential volatility in interest rate movement. The beta that we apply in our valuation ranges from 0.53 to 1.24 and the discount rate that we apply ranges from 5.2 to 9.8%. Within our coverage, we apply the highest discount rate for Jinmao Investments (9.8%) as their assets are located in China and the hospitality sector is cyclical in nature. The HK REITs sector (including stapled structures) trades on a long-term average of 6.1% dividend yield and 3.5% yield spread over the 10-year bond. This average includes the period of GFC, when the average dividend yield peaked at 10.9% in November 2008. During the GFC, there were concerns that some of the REITs might breach the regulatory limit of 45%. The sector is now trading at a range of CY15E dividend yield of 3.5% to 8.9% based on our and consensus estimates, with the largest market cap Link REIT trading at the lowest yield of 3.5% and New Century REIT with China hospitality exposure at the highest-end at 8.9%. The market weighted average CY15E and CY16E yield is 5.0% and 5.3%, respectively. Change in price target We have adjusted up the PT of Champion REIT, Fortune REIT and Link REIT following the application of a lower risk-free rate assumption (from 3% to 2.75%) in our DDM calculation. Our adjustment has taken into account the movement in HK 10-year bond yield and JPM US interest rate forecasts. JPM US Fixed Income Strategy forecasts 10-year US treasury yield to be 2.4% in 4Q15 as at 23 January 2015, compared with a 2.8% as at 25 November 2014. Given the recent acquisition of office property development by Link REIT, we think the business risk is increased and hence beta assumption for Link is adjusted up from 0.51 to 0.53 accordingly. Table 14: Summary of PT change Old (HK$) New (HK$) % change Key reasons for change Champion REIT 3.95 4.15 5.1% Change in risk-free rate assumption Fortune REIT 8.60 9.80 14.0% Change in risk-free rate assumption, update on financial position after FY14 results Link REIT 47.50 49.50 4.2% Change in risk-free rate assumption, higher business risk Source: J.P. Morgan estimates. 25 Amy Luk, CFA (852) 2800 8524 [email protected] Asia Pacific Equity Research 31 January 2015 Table 15: US 10-year treasury rate forecasts Date 1Q15 2Q15 3Q15 4Q15 23-Jan-15 2.10 2.25 2.30 2.40 09-Jan-15 2.10 2.25 2.30 2.40 19-Dec-14 2.35 2.50 2.60 2.70 12-Dec-14 2.55 2.70 2.75 2.80 25-Nov-14 2.55 2.70 2.75 2.80 21-Nov-14 2.60 2.75 2.95 n/a 07-Nov-14 2.60 2.75 2.95 n/a 31-Oct-14 2.60 2.75 2.95 n/a 24-Oct-14 2.60 2.75 2.95 n/a 17-Oct-14 2.60 2.75 2.95 n/a 03-Oct-14 2.85 3.00 3.10 n/a 26-Sep-14 2.85 3.00 3.10 n/a 19-Sep-14 2.85 3.00 3.10 n/a 12-Sep-14 2.85 3.00 3.10 n/a 05-Sep-14 2.85 3.00 3.10 n/a Source: JPM US Fixed Income Strategy team forecasts. Table 16: HK listed REITs and stapled structure valuation summary FY Ending (month) Champion REIT Dec Fortune REIT Dec GZI REIT Dec Jinmao Dec Langham Hospitality Dec Link REIT Mar New Century REIT Dec Prosperity REIT Dec Regal REIT Dec Spring REIT Dec Sunlight REIT Jun Total/Market weighted average Share price 29-Jan-15 (HK$) 3.83 8.83 4.09 5.60 3.55 52.90 3.24 2.87 2.16 3.75 3.93 Current Mkt Cap (HK$ MM) 22,003 16,568 11,451 11,200 7,179 121,235 3,017 4,074 7,036 4,161 6,417 237,348 Rating OW OW NC N NC N NC NC NC NC NC NPV Forward (HK$) 4.13 9.82 N/A 6.13 N/A 49.6 N/A N/A N/A N/A N/A Source: Bloomberg, Bloomberg consensus for stocks Not Covered (NC), Company data, J.P. Morgan estimates 26 Prem/(disc) to Fwd NPV (%) -7% -10% N/A -9% N/A 7% N/A N/A N/A N/A N/A 2.3% CY14E (%) 5.1% 4.7% 7.0% 8.6% 8.1% 3.3% 9.7% 5.7% N/A 8.3% 5.2% 4.8% Div. yield CY15E (%) 4.8% 5.1% 7.5% 8.6% 8.1% 3.5% 8.9% 6.1% N/A 8.3% 5.6% 5.0% CY16E (%) 5.1% 5.3% 7.5% 9.0% 8.1% 3.8% 8.1% 6.1% N/A 7.9% 5.9% 5.3% P/B ratio FY14E (x) 0.48 0.74 0.73 1.29 0.69 1.27 0.84 0.64 N/A 0.63 0.56 1.00 Gearing FY13 (%) 23.3% 32.4% 31.9% 27.1% 38.2% 13.6% 26.3% 20.7% 29.8% 36.0% 24.0% 19.0% Asia Pacific Equity Research 31 January 2015 Figure 24: HK and China REITs - 2014 share price performance Link REIT Fortune REIT Prosperity REIT Sunlight REIT Spring REIT Property Developers Mapletree GCCT Hang Seng REIT Index Jinmao Investments Hang Seng Property Champion REIT Yuexiu REIT Property Investors Hang Seng Index Regal REIT -8.1% New Century REIT -9.3% Langham Hospitalit y -9.7% -9.8% Hui Xian REIT -20% Figure 25: HK and China REITs – 2015 YTD share price performance Fortune REIT Sunlight REIT Link REIT Prosperity REIT Property Investors Property Developers Hang Seng Property Mapletree GCCT Hang Seng REIT Index Champion REIT Langham Hospitalit y Regal REIT Yuexiu REIT Hang Seng Index Spring REIT Hui Xian REIT New Century REIT Jinmao Investments 29.1% 24.4% 16.8% 16.7% 15.5% 14.7% 13.1% 9.7% 9.3% 7.2% 5.0% 2.9% 1.5% 1.3% -10% 0% 10% 20% 30% 40% 12.8% 12.3% 9.0% 8.7% 7.9% 7.1% 6.9% 6.8% 6.7% 6.4% 5.7% 5.4% 5.1% 4.2% 2.5% -0.3% -1.8% -4.3% -10% -5% 0% 5% 10% 15% Source: Bloomberg, company data, J.P. Morgan estimates Note: Prices as of 29 Jan 2015. Source: Bloomberg, company data, J.P. Morgan estimates Figure 26: HK REITs and stapled structures – yield Figure 27: HK REITs and stapled structure – yield spread +2 s.d. +1 s.d. mean -1 s.d. % 8.0 +2 s.d. 6.0 +1 s.d. 4.0 mean -1 s.d. 2.0 -2 s.d. -2 s.d. -2.0 Dec-05 Jun-06 Dec-06 Jun-07 Dec-07 Jun-08 Dec-08 Jun-09 Dec-09 Jun-10 Dec-10 Jun-11 Dec-11 Jun-12 Dec-12 Jun-13 Dec-13 Jun-14 Dec-14 0.0 Source: Bloomberg, company data, J.P. Morgan estimates Source: Bloomberg, company data, J.P. Morgan estimates Figure 28: HK REITs and stapled structures – CY15E yield Figure 29: HK REITs and stapled structure – CY16E yield % % Source: Bloomberg, company data, J.P. Morgan estimates Spring REIT Prosperity REIT New Century REIT CY16E Avg Link REIT Langham Hospitality Jinmao GZI REIT CY16E Fortune REIT 10.0% 9.0% 8.0% 7.0% 6.0% 5.0% 4.0% 3.0% 2.0% 1.0% 0.0% Champion REIT Hui Xian REIT Sunlight REIT Spring REIT Prosperity REIT New Century REIT CY15E Avg Link REIT Langham Hospitality Jinmao GZI REIT Fortune REIT CY15E Champion REIT 10.0% 9.0% 8.0% 7.0% 6.0% 5.0% 4.0% 3.0% 2.0% 1.0% 0.0% Sunlight REIT 10.0 % Dec-05 Jun-06 Dec-06 Jun-07 Dec-07 Jun-08 Dec-08 Jun-09 Dec-09 Jun-10 Dec-10 Jun-11 Dec-11 Jun-12 Dec-12 Jun-13 Dec-13 Jun-14 Dec-14 12.0 11.0 10.0 9.0 8.0 7.0 6.0 5.0 4.0 3.0 2.0 Hui Xian REIT Amy Luk, CFA (852) 2800 8524 [email protected] Source: Bloomberg, company data, J.P. Morgan estimates 27 Asia Pacific Equity Research 31 January 2015 Amy Luk, CFA (852) 2800 8524 [email protected] Figure 30: Champion REIT yield spread Figure 31: Champion REIT dividend yield % % 25 20 18 20 16 14 15 12 10 8 10 Long-term yield spread =458 bps Long-term yield =7.03% 6 5 4 Avg yield before financial crisis: 7.92% 2 0 May-06 May-07 May-08 May-09 May-10 May-11 May-12 May-13 0 May-06 May-14 May-07 May-08 May-09 May-10 May-11 Source: Bloomberg, company data, J.P. Morgan estimates Source: Bloomberg, company, J.P. Morgan estimates Figure 32: Fortune REIT yield spread Figure 33: Fortune REIT dividend yield % % 25.0 25 20.0 20 15.0 15 10.0 5.0 May-12 May-13 May-14 10 Avg yield before financial crisis: 6.10% Avg yield spread before financial crisis: 217 bps 5 Long-term yield spread =444 bps Long-term yield =7.2% 358bps 0.0 Jan-04 Jan-05 Jan-06 Jan-07 Jan-08 Jan-09 Jan-10 Jan-11 Jan-12 Jan-13 Jan-14 Jan-15 0 Jan-04 Jan-05 Jan-06 Jan-07 Jan-08 Jan-09 Jan-10 Source: Bloomberg, company data, J.P. Morgan estimates Source: Bloomberg, company data, J.P. Morgan estimates Figure 34: Link REIT yield spread Figure 35: Link REIT dividend yield % % 7.0 Jan-11 Jan-12 Jan-13 Jan-14 Jan-15 9 6.0 8 5.0 7 4.0 3.0 Long-term yield spread =233 bps 207 bps 2.0 6 Long-term yield =4.89% 5 1.0 4 0.0 -1.0 -2.0 Jan-06 3 Jan-07 Jan-08 Jan-09 Jan-10 Jan-11 Source: Bloomberg, company data, J.P. Morgan estimates 28 Jan-12 Jan-13 Jan-14 Jan-15 Avg yield before financial crisis: 4.45% 2 Nov-05 Nov-06 Nov-07 Nov-08 Nov-09 Nov-10 Source: Bloomberg, company data, J.P. Morgan estimates Nov-11 Nov-12 Nov-13 Nov-14 Asia Pacific Equity Research 31 January 2015 Amy Luk, CFA (852) 2800 8524 [email protected] Figure 36: Jinmao Investments yield spread Figure 37: Jinmao Investments dividend yield % % 8 9.5 9.0 Long-term yield =8.56% Long-term yield spread =668 bps 7 8.5 8.0 6 Jun-14 Jul-14 Aug-14 Sep-14 Oct-14 Nov-14 7.5 Jun-14 Dec-14 Jul-14 Aug-14 Sep-14 Sep-14 Oct-14 Nov-14 Nov-14 Source: Bloomberg, company data, J.P. Morgan estimates Source: Bloomberg, company, J.P. Morgan estimates Figure 38: Langham Hospitality yield spread Figure 39: Langham Hospitality dividend yield % % 8 Dec-14 Jan-15 Jan-15 10.0 9.5 9.0 7 8.5 8.0 6 Long-term yield spread =578 bps Long-term yield =7.85% 7.5 7.0 6.5 5 6.0 5.5 4 May-13 Jul-13 Sep-13 Nov-13 Source: Bloomberg, company data Jan-14 Mar-14 May-14 Jul-14 Sep-14 Nov-14 Jan-15 5.0 May-13 Jul-13 Sep-13 Nov-13 Jan-14 Mar-14 May-14 Jul-14 Sep-14 Nov-14 Jan-15 Source: Bloomberg, company data 29 Asia Pacific Equity Research 31 January 2015 Amy Luk, CFA (852) 2800 8524 [email protected] Figure 40: Mapletree Greater China Commercial Trust yield spread Figure 41: Mapletree Greater China Commercial Trust dividend yield % % 6 8.0 7.0 Long-term yield spread =501 bps Long-term yield =6.95% 5 6.0 4 Mar-13 May-13 Jul-13 Sep-13 Nov-13 Jan-14 Mar-14 May-14 Jul-14 Sep-14 Nov-14 Jan-15 5.0 Mar-13 May-13 Jul-13 Sep-13 Nov-13 Jan-14 Mar-14 May-14 Jul-14 Source: Bloomberg, company data Source: Bloomberg, company data Figure 42: New Century REIT yield spread Figure 43: New Century REIT dividend yield % % 8 Sep-14 Nov-14 Jan-15 10.0 7 9.0 Long-term yield spread =666 bps 6 Long-term yield =8.75% 5 Jul-13 Sep-13 Nov-13 Jan-14 Mar-14 May-14 Jul-14 Sep-14 Nov-14 Jan-15 8.0 Jul-13 Sep-13 Nov-13 Jan-14 Mar-14 May-14 Source: Bloomberg, company data Source: Bloomberg, company data Figure 44: Prosperity REIT yield spread Figure 45: Prosperity REIT dividend yield % % 18 21 16 19 14 17 12 15 10 13 8 9 4 7 2 5 Source: Bloomberg, company data 30 Apr-09 Feb-10 Dec-10 Oct-11 Aug-12 Jun-13 Sep-14 Dec-11 Dec-12 Nov-14 Jan-15 11 Long-term yield spread =513 bps 6 0 Dec-05 Oct-06 Aug-07 Jun-08 Jul-14 Apr-14 3 Dec-05 Long-term yield =7.68% Dec-06 Dec-07 Dec-08 Source: Bloomberg, company data Dec-09 Dec-10 Dec-13 Dec-14 Asia Pacific Equity Research 31 January 2015 Amy Luk, CFA (852) 2800 8524 [email protected] Figure 46: Spring REIT yield spread Figure 47: Spring REIT dividend yield % % 10 12 11 9 10 Long-term yield =9.35% 8 9 Long-term yield spread =730 bps 7 8 6 7 5 Dec-13 Feb-14 Apr-14 Jun-14 Aug-14 Oct-14 6 Dec-13 Dec-14 Feb-14 Apr-14 Jun-14 Aug-14 Source: Bloomberg, company data Source: Bloomberg, company data Figure 48: Sunlight REIT yield spread Figure 49: Sunlight REIT dividend yield % % 25 28 20 23 15 18 10 Long-term yield spread =633 bps Oct-14 Dec-14 13 Long-term yield =8.65% 8 5 0 Dec-06 Sep-07 Jun-08 Mar-09 Dec-09 Sep-10 Jun-11 3 Dec-06 Mar-12 Dec-12 Sep-13 Jun-14 Dec-07 Dec-08 Dec-09 Dec-10 Source: Bloomberg, company data Source: Bloomberg, company data Figure 50: Yuexiu REIT yield spread Figure 51: Yuexiu REIT dividend yield % % 20 Dec-11 Dec-12 Dec-13 Dec-14 25 18 16 20 14 15 12 10 8 Long-term yield =7.93% 10 Long-term yield spread =538 bps 6 5 4 2 0 Dec-05 Dec-06 Dec-07 Dec-08 Source: Bloomberg, company data Dec-09 Dec-10 Dec-11 Dec-12 Dec-13 Dec-14 Avg yield before financial crisis: 7.66% 0 Dec-05 Dec-06 Dec-07 Dec-08 Dec-09 Dec-10 Dec-11 Dec-12 Dec-13 Dec-14 Source: Bloomberg, company data 31 Asia Pacific Equity Research 31 January 2015 Companies Amy Luk, CFA (852) 2800 8524 [email protected] 32 Asia Pacific Equity Research 31 January 2015 Amy Luk, CFA (852) 2800 8524 [email protected] Champion REIT Overweight Multi-floors take-up mitigating move out of major tenants 2778.HK,2778 HK Price: HK$3.83 Occupancy getting some support: In November 2014, Citibank Plaza recorded leasing transactions for three whole floors at decent rentals. In particular, the 3/F and 4/F (14K sf for each floor) acquired from the Government last year were leased to a medical centre at HK$80 psf. Also, the 36/F (17K sf) was taken up by a Chinese institution at HK$85 psf. The take-up of 45K sf space of the building accounts for some 2.8% of total GFA of Citibank Plaza, which mitigates the impact of Bank of America Merrill Lynch (~14.3% of area) moving out to Cheung Kong Centre. Flexible strategy in attracting tenants: The take-up of 45K sf indicated that there is demand for the building at HK$80-85 psf. Effective rent may be lower but this set a reference point for future leasing transactions. Other than competitive pricing, we think the landlord would be flexible in lease terms to attract tenants such that longer lease terms can attract tenants looking for a stable long-term stay. Expanded investment scope recently approved: After the amendments of the HK REIT Code, Champion REIT is the first REIT to change the Trust Deed to expand the investment scope to include investment in property development and investment in financial instruments. We think that it is more likely for Champion to invest in financial instruments that are yield-enhancing rather than invest in property development projects at this stage. Alternative choice for Central office exposure: Given that the overall Central market is facing tight supply with market vacancy at only 3.7% (as of endNovember 2014), we expect Citibank Plaza will be able to absorb some of the gradual increasing demand. We believe the drop in FY15E DPU is already factored into the share price and we expect FY16E DPU to rebound on an improvement in occupancy next year. We believe Champion REIT is an alternative choice to play Central office rental growth. ▲ Price Target: HK$4.15 Previous: HK$3.95 Hong Kong REITs Amy Luk, CFA AC (852) 2800 8524 [email protected] Bloomberg JPMA LUK <GO> J.P. Morgan Securities (Asia Pacific) Limited Price Performance 3.9 3.7 HK$ 3.5 3.3 3.1 Jan-14 Apr-14 Jul-14 Oct-14 Jan-15 2778.HK share price (HK$) HSI (rebased) Abs Rel YTD 6.4% 2.2% 1m 6.4% 2.9% Company Data Shares O/S (mn) Market Cap (HK$ mn) Market Cap ($ mn) Price (HK$) Date Of Price Free Float(%) 3M - Avg daily vol (mn) 3M - Avg daily val (HK$ mn) 3M - Avg daily val ($ mn) HSI Exchange Rate Price Target End Date 3m 13.3% 10.0% 12m 15.4% 4.3% 5,745 22,003 2,838 3.83 29 Jan 15 36.3% 3.91 13.86 1.8 24,595.85 7.75 31-Dec-15 Champion REIT (Reuters: 2778.HK, Bloomberg: 2778 HK) HK$ in mn, year-end Dec FY12A FY13A Revenue (HK$ mn) 2,059 2,179 Net Property Income (HK$ 1,666 1,748 mn) Core Profit (HK$ mn) 963 1,075 Distributable Profit (HK$ mn) 1,254 1,271 EPU (HK$) 0.18 0.19 DPU (HK$) 0.21 0.21 Revenue growth (%) 6.1% 5.8% Distribution growth 7.1% 1.4% Dividend Yield 5.5% 5.5% NPV per Share (HK$) - FY14E 2,195 1,742 FY15E 2,239 1,794 FY16E 2,365 1,919 1,057 1,183 0.18 0.19 0.7% (7.0%) 5.1% 3.90 1,023 1,131 0.18 0.19 2.0% (4.4%) 4.8% 4.13 1,092 1,207 0.19 0.20 5.6% 6.7% 5.1% - Source: Company data, Bloomberg, J.P. Morgan estimates. 33 Asia Pacific Equity Research 31 January 2015 Amy Luk, CFA (852) 2800 8524 [email protected] Table 17: Champion REIT's property portfolio in Hong Kong Name of Property Location GFA (sf) Valuation as of 31 Dec 2013 (HK$ mn) Cap rate (%) Revenue (HK$ mn) Net property income (HK$ mn) Occupancy Passing rent (HK$ psf) Citibank Plaza Central 1,637,600 37,900 Office: 3.30%; Retail: 4.25% 1,202.0 990.0 85.3% 84.60 Langham Place Mongkok 1,292,700 23,609 4.00% 977.3 757.8 n/a n/a 702,900 7,381 4.00% 288.9 231.9 99.0% 32.86 589,800 15,723 4.00% 688.3 525.9 100.0% 144.26 2,930,300 61,509 2,179 1,748 Office Retail Total Note: Operating data refers to FY13. Source: Company data Figure 52: FY13 net property income breakdown Figure 53: Property valuation breakdown (as of 31 Dec 2013) LP Others 1% LP Retail 25% LP Retail 30% CBP 57% LP Office 13% Note: CBP = Citibank Plaza, LP = Langham Place. Source: Company data 34 LP Office 12% CBP Others 1% CBP Retail 1% Source: Company data CBP Office 60% Amy Luk, CFA (852) 2800 8524 [email protected] Asia Pacific Equity Research 31 January 2015 Investment Thesis, Valuation and Risks Champion REIT (Overweight; Price Target: HK$4.15) Investment Thesis Given that the overall Central market is facing tight supply with market vacancy at only 3.6%, we expect Citibank Plaza will be able to absorb some of the gradual increasing demand. We believe the drop in FY15E DPU is already factored into the share price and we expect FY16E DPU to rebound on improvement in occupancy next year. Champion REIT is an alternative choice to play Central office rental growth. Valuation Our Dec-15 price target of HK$4.15 is on par with our NPV estimate, which assumes a discount rate of 5.9%. Key assumptions Bond Rate Beta 2.8% 0.69 Market risk premium 4.5% Discount Rate 5.9% LT Grow th 1.0% Terminal Cap Rate 4.9% Risks to Rating and Price Target Downside risks to our rating and price target include slower-than-expected improvement of Central office market as well as vacancy rate of Citibank Plaza and weaker-than-expected retail sales growth at Langham Place. 35 Asia Pacific Equity Research 31 January 2015 Amy Luk, CFA (852) 2800 8524 [email protected] Champion REIT: Summary of Financials Income Statement HK$ in millions, year end Dec Revenues % change Y/Y EBIT % change Y/Y EBIT Margin Net Interest Earnings before tax % change Y/Y Tax as % of EBT Core net profit % change Y/Y Distributable income % change Y/Y Shares outstanding EPS (reported) (HK$) % change Y/Y Core EPS (HK$) % change Y/Y Balance sheet HK$ in millions, year end Dec Cash and cash equivalents Accounts receivable Inventories Others Current assets FY13 2,179 5.8% 1,517 (1.1%) 69.6% (329) 1,526 61.5% (113) 7.4% 1,075 11.6% 1,271 1.4% 5,714 0.25 71.2% 0.19 4.2% FY14E 2,195 0.7% 1,512 (0.3%) 68.9% (299) 1,213 (20.5%) (156) 12.9% 1,057 (1.7%) 1,183 (7.0%) 5,744 0.18 (25.7%) 0.18 (2.3%) FY15E 2,239 2.0% 1,557 3.0% 69.6% (341) 1,216 0.3% (193) 15.9% 1,023 (3.1%) 1,131 (4.4%) 5,774 0.18 (3.7%) 0.18 (3.7%) FY16E 2,365 5.6% 1,668 7.1% 70.5% (370) 1,298 6.7% (206) 15.9% 1,092 6.7% 1,207 6.7% 5,807 0.19 6.1% 0.19 6.1% FY13 1,066 185 64 1,315 FY14E 911 197 4 1,112 FY15E 919 208 4 1,131 FY16E 954 219 4 1,177 62,217 63,329 62,947 64,077 0 1,300 1,035 2,335 14,582 521 17,439 45,891 7.99 2,200 1,271 986 4,457 12,326 642 17,425 46,653 8.08 LT investments Net fixed assets 61,509 Total Assets 62,824 Liabilities ST loans 6,993 Payables 1,328 Others 1,106 Total current liabilities 9,427 Long-term debt 7,629 Other liabilities 405 Total Liabilities 17,460 Shareholder's equity 45,364 BVPS 7.94 Source: Company reports and J.P. Morgan estimates. 36 Cash flow statement HK$ in millions, year end Dec EBIT Depr. & amortization Change in working capital Others Cash flow from operations FY13 1,517 0 40 448 1,414 FY14E 1,512 0 40 475 1,571 FY15E 1,557 0 40 464 1,527 FY16E 1,668 0 40 500 1,632 Capex Disposal/(purchase) Net Interest Free cash flow (2,311) (193) 1,712 0 (307) 1,832 0 (339) 1,814 0 (432) 1,943 Equity raised/(repaid) Debt raised/(repaid) Other Dividends paid Beginning cash Ending cash DPS (HK$) 0 1,939 0 (1,179) 1,397 1,066 0.21 0 (40) 0 (1,379) 1,066 911 0.19 0 (56) 0 (1,124) 911 919 0.19 0 (51) 0 (1,113) 919 954 0.20 FY13 69.6% 49.3% - FY14E 68.9% 48.1% - FY15E 69.6% 45.7% - FY16E 70.5% 46.2% - (1.2%) 5.8% 11.6% 4.2% 4.6 23.0% 29.9% 0.0 1.4 2.8% 2.3% 0.1% 0.7% (1.7%) (2.3%) 5.1 23.0% 29.8% 0.0 1.4 2.6% 2.2% 1.5% 2.0% (3.1%) (3.7%) 4.6 22.6% 29.2% 0.0 1.4 2.4% 2.2% 5.0% 5.6% 6.7% 6.1% 4.5 22.2% 28.5% 0.0 1.4 2.6% 2.3% Ratio Analysis %, year end Dec EBIT margin Net margin SG&A/Sales Sales per share growth - Sales growth 63,698 Net profit growth 64,876 EPS growth Interest coverage (x) 4,000 Net debt to total capital 1,242 Net debt to equity 1,029 Sales/assets 6,271 Assets/equity 10,475 ROE 766 ROCE 17,512 47,364 8.16 Asia Pacific Equity Research 31 January 2015 Amy Luk, CFA (852) 2800 8524 [email protected] Fortune Real Estate Investment Trust Overweight Solid growth from acquisitions FORT.SI,FRT SP Price: HK$8.75 Fortune Kingswood driving NPI growth: In addition to organic growth, acquisition is a key growth driver for Fortune REIT. Fortune Kingswood acquired in October 2013 from parent company Cheung Kong contributed to 18% growth of FY14 Net Property Income (NPI). The potential asset enhancement of the mall can further enhance DPU in the longer term. Acquisition of Laguna Plaza enhancing DPU in FY15E: The acquisition of Laguna Plaza in Kwun Tong was completed on 9 January 2015, funded by debt. The initial yield is 4.7% on acquisition price. As at 31 Dec 20014, gearing levels stood at 29.4%. Post acquisition gearing level will increase to around 33%, still within regulatory limits of 35%. We estimate that the acquisition will enhance FY15 gross revenue by close to HK$90 mn. Potential change in Singapore REIT code: The Monetary Authority of Singapore has published a consultation paper in October 2014 with the proposal of changing the gearing limit for SREITs. Since Fortune has a dual listing in Singapore and Hong Kong and it has not obtained a credit rating, it has been following the Singapore regulatory limit of 35%. The proposal of changing the gearing limit of 45% for all SREITs (with or without a credit rating) should give more flexibility for Fortune to choose between debt and equity financing for future potential acquisitions. Room for potential yield spread narrowing: The stock is trading at a 12month forward yield of 5.1% and yield spread over 10-year HK Exchange Fund Note at 3.6%. Though the current yield spread is below the long-term average of 446 bps, it is still far above the average yield spread of 217 bps before the global financial crisis. On a P/B basis, valuation is also undemanding at 0.73x FY14 P/B. ▲ Price Target: HK$9.80 Previous: HK$8.60 Singapore REITs Amy Luk, CFA AC (852) 2800 8524 [email protected] Bloomberg JPMA LUK <GO> J.P. Morgan Securities (Asia Pacific) Limited Price Performance 8.5 HK$ 7.5 6.5 5.5 Jan-14 Apr-14 Jul-14 Oct-14 Jan-15 FORT.SI share price (HK$) FTSTI (rebased) Abs Rel YTD 12.8% 11.2% 1m 13.8% 12.3% Company Data Shares O/S (mn) Market Cap (HK$ mn) Market Cap ($ mn) Price (HK$) Date Of Price Free Float(%) 3M - Avg daily vol (mn) 3M - Avg daily val (HK$ mn) 3M - Avg daily val ($ mn) FTSTI Exchange Rate Price Target End Date Price Target (HK$) 3m 23.8% 17.8% 12m 45.6% 33.4% 1,876 16,418 2,118 8.75 29 Jan 15 68.7% 0.49 3.81 0.5 3419.05 7.75 31-Dec-15 9.80 Fortune Real Estate Investment Trust (Reuters: FORT.SI, Bloomberg: FRT SP) HK$ in mn, year-end Dec FY12A FY13A FY14A FY15E Revenue (HK$ mn) 1,114 1,317 1,656 1,880 Net Property Income (HK$ 788 928 1,161 1,322 mn) Core Profit (HK$ mn) 441 439 629 703 Distributable Profit (HK$ mn) 549 642 781 856 EPU (HK$) 0.26 0.25 0.34 0.37 DPU (HK$) 0.32 0.36 0.42 0.45 Revenue growth (%) 22.5% 18.3% 25.7% 13.6% Distribution growth 24.2% 16.9% 21.5% 9.6% Dividend Yield 3.7% 4.1% 4.8% 5.2% NPV per Share (HK$) 9.82 FY16E 1,956 1,384 738 895 0.39 0.47 4.0% 4.6% 5.4% - Source: Company data, Bloomberg, J.P. Morgan estimates. 37 Asia Pacific Equity Research 31 January 2015 Amy Luk, CFA (852) 2800 8524 [email protected] Table 18: Fortune REIT's property portfolio in Hong Kong As at 31 Dec 2014 Location GRA (sf) Occupancy Valuation (HK$ mn) FY13 NPI (HK$ mn) FY13 net property yield (%) Fortune City One Shatin 414,469 99.5% 7,124 208.6 4.4% Fortune Kingswood Tin Shui Wai 665,244 100.0% 6,652 47.3* 3.9% Ma On Shan Plaza Shatin 310,084 100.0% 4,896 173.5 4.6% Metro Town Tseung Kwan O 180,822 100.0% 3,026 100.1 4.3% Fortune Metropolis Hung Hom 332,168 98.2% 2,311 81.4 4.4% Laguna Plaza^ Kwun Tong 163,203 96.7% 2,080 90.4 4.3% Belvedere Square Tsuen Wan 276,862 79.5% 1,914 69.5 4.7% Waldorf Avenue Tuen Mun 80,842 100.0% 1,582 55.6 4.5% Caribbean Square Tung Chung 63,018 100.0% 943 36.3 4.8% Provident Square North Point 180,238 90.3% 922 36.4 4.8% Jubilee Square Shatin 170,616 100.0% 863 27.6 4.6% Smartland Tsuen Wan 123,544 99.9% 658 22.2 4.9% Tsing Yi Square Tsing Yi 78,836 100.0% 574 21.1 4.9% Nob Hill Square Kwai Chung 91,779 99.7% 438 17.3 4.8% Hampton Loft West Kowloon 74,734 100.0% 258 10.6 4.9% Centre de Laguna Kwun Tong 43,000 99.4% 264 9.5 4.8% Lido Avenue Tsuen Wan 9,836 100.0% 182 7.1 4.9% Rhine Avenue Tsuen Wan 14,604 100.0% 113 4.2 4.2% 34,800 1,018.7 Total 3,273,899 *Acquired on 9 Oct 2013. ^Acquired on 9 January 2015; operating and financial data as at 31 Oct 2014; NPI refers to estimated FY14 income by JPM. Source: Company data, J.P. Morgan estimates Figure 54: Tenant trade mix by gross rental income (as at 31 Dec 2014) Wet Markets Others 4% Supermarkets 1% 8% Services & Education 21% Leisure & Entertainment, Sports & Fitness 3% Gifts & Speciality, Hobbies, Toys, Jewellery 5% Source: Company data 38 Banking & Real Estate Services 21% Community Services 1% Electronics & IT 2% Fashion & Shoes 8% Homewares & Home Furnishings 3% Food & Beverages 23% Amy Luk, CFA (852) 2800 8524 [email protected] Asia Pacific Equity Research 31 January 2015 Investment Thesis, Valuation and Risks Fortune Real Estate Investment Trust (Overweight; Price Target: HK$9.80) Investment Thesis In addition to organic growth, acquisition is also a key growth driver for Fortune REIT. Fortune Kingswood acquired in October 2013 from parent company Cheung Kong contributed to meaningful growth of FY14 Net Property Income (NPI). Of the strong NPI Y/Y growth of 25.1% in 2014, Kingswood accounted for 18.4%. Given the mall has 31.3% of leases expiring this year and the mall is relatively under-rented, we expect the rental uplift to continue in 2015. Moreover, the potential asset enhancement of the mall can further enhance DPU in the longer term. The new acquisition of Laguna Plaza should also contribute to rental growth in 2015. Valuation Our Dec-15 price target of HK$9.8 is based on par with NPV, where we adopt a discount rate of 6.19% and a long-term growth rate of 1%. Key assumptions Bond Rate Beta Index Ratio Discount Rate LT Growth Terminal Cap Rate 2.75% 0.77 4.50% 6.19% 1.00% 5.19% Risks to Rating and Price Target Downside risks to our rating and price target include lower-than-expected upside of Fortune Kingswood after AEI, lower-than-expected rental reversions and a delay in the completion of asset enhancement. 39 Asia Pacific Equity Research 31 January 2015 Amy Luk, CFA (852) 2800 8524 [email protected] Fortune Real Estate Investment Trust: Summary of Financials Income Statement HK$ in millions, year end Dec Revenues % change Y/Y EBIT % change Y/Y EBIT Margin Net Interest Earnings before tax % change Y/Y Tax as % of EBT Core net profit % change Y/Y Distributable income % change Y/Y Shares outstanding EPS (reported) (HK$) % change Y/Y Core EPS (HK$) % change Y/Y Balance sheet HK$ in millions, year end Dec Cash and cash equivalents Accounts receivable Inventories Others Current assets FY14 1,656 25.7% 1,015 39.7% 61.3% (215) 809 39.6% (170) 21.1% 629 43.5% 781 21.5% 1,876 0.34 36.7% 0.34 36.7% FY15E 1,880 13.6% 1,175 15.8% 62.5% (299) 883 9.2% (174) 19.7% 703 11.6% 856 9.6% 1,893 0.38 10.3% 0.37 10.8% FY16E 1,956 4.0% 1,235 5.1% 63.1% (315) 928 5.0% (182) 19.6% 738 5.1% 895 4.6% 1,909 0.39 4.2% 0.39 4.2% FY17E 2,017 3.1% 1,313 6.3% 65.1% (320) 1,001 7.9% (195) 19.5% 798 8.1% 958 7.1% 1,926 0.42 7.1% 0.42 7.2% FY14 688 61 0 128 877 FY15E 827 69 0 128 1,024 FY16E 881 72 0 128 1,081 FY17E 932 74 0 128 1,134 35,300 36,324 36,026 37,107 955 1,112 10 2,077 9,845 438 12,359 23,965 12.66 948 1,157 10 2,114 8,927 465 11,506 25,600 13.41 LT investments Net fixed assets 32,720 Total Assets 33,597 Liabilities ST loans 940 Payables 979 Others 10 Total current liabilities 1,929 Long-term debt 8,881 Other liabilities 412 Total Liabilities 11,222 Shareholder's equity 22,376 BVPS 11.93 Source: Company reports and J.P. Morgan estimates. 40 Cash flow statement HK$ in millions, year end Dec EBIT Depr. & amortization Change in working capital Others Cash flow from operations FY14 1,015 0 56 343 1,037 FY15E 1,175 0 141 424 1,275 FY16E 1,235 0 48 443 1,236 FY17E 1,313 0 38 452 1,296 Capex Disposal/(purchase) Net Interest Free cash flow (226) 0 (225) 980 (1,926) 0 (292) (411) (20) 0 (308) 1,469 (20) 0 (312) 1,533 Equity raised/(repaid) Debt raised/(repaid) Other Dividends paid Beginning cash Ending cash DPS (HK$) 0 (30) (235) (726) 858 688 0.42 0 1,919 (299) (837) 688 827 0.45 0 30 (315) (885) 827 881 0.47 0 30 (320) (942) 881 932 0.50 FY14 61.3% 38.0% - FY15E 62.5% 37.4% - FY16E 63.1% 37.8% - FY17E 65.1% 39.6% - 19.8% 25.7% 43.5% 36.7% 4.7 29.0% 40.8% 0.1 1.5 3.8% 2.6% 12.7% 13.6% 11.6% 10.8% 3.9 29.4% 41.6% 0.1 1.5 3.7% 2.8% 3.1% 4.0% 5.1% 4.2% 3.9 26.0% 35.1% 0.1 1.5 3.6% 2.8% 2.2% 3.1% 8.1% 7.2% 4.1 22.8% 29.5% 0.1 1.4 3.6% 2.9% Ratio Analysis %, year end Dec EBIT margin Net margin SG&A/Sales Sales per share growth - Sales growth 36,766 Net profit growth 37,901 EPS growth Interest coverage (x) 951 Net debt to total capital 1,192 Net debt to equity 10 Sales/assets 2,154 Assets/equity 8,006 ROE 494 ROCE 10,654 27,247 14.15 Asia Pacific Equity Research 31 January 2015 Amy Luk, CFA (852) 2800 8524 [email protected] Jinmao Investments Neutral Diversified portfolio capturing growing domestic travel 6139.HK,6139 HK Price: HK$5.60 Focus on Shanghai office and China hotel sector: Jinmao is a fixed single investment trust listed in Hong Kong in July 2014 with an initial focus on the hospitality industry in China. The initial properties are located in prime cities in China, including a mixed-use project Jin Mao Tower (with Grand Hyatt Shanghai on the top floors) in Shanghai and 7 standalone completed hotels. Diversified and balanced portfolio to capture both business and leisure travelers: The properties in the initial portfolio are located in prime locations in top-tier cities or tourist hot spots in China, including Beijing, Shanghai, Shenzhen and Sanya. The two hotels in Sanya and the new hotel in Lijiang are well-positioned to capture the growth of the domestic travel market. The income stream is diversified with revenue split between rental, hotel room, hotel F&B and other revenue was 20%/48%/28%/4% in FY13. The inclusion of flagship property, Jin Mao Tower in Shanghai, provides a stable growing income source that helped to mitigate the volatility in hotel revenue in the last few years. Two new hotels opened in 2H14: Renaissance Beijing Wangfujing Hotel and Grand Hyatt Lijiang commenced operations in 2H14. Both hotels are located in prime locations and we expect them to turn EBITDA positive in 2015. Despite the minimal initial earnings contributions of these hotels, Franshion agreed to provide an annualized distribution guarantee of not less than HK$960 mn for FY14 and shortfall payments for FY15-17 if EBITDA of the three new hotels is less than HK$220 mn (subject to a maximum aggregate amount of HK$300 mn for the entire period). We believe this will help mitigate the initial start-up risks of the hotels and provide a cushion to distribution payments. Attractive yield similar to Langham but lower than New Century: Even though the stock is trading at a 12-month forward yield of 8.7%, which looks attractive, it is slightly higher than Langham (trading at forward yield of 8.1%) which has a pure exposure in HK hotel market and similar to New Century REIT (trading at forward yield of 8.8%) which runs its own domestic hotel brand in China. Price Target: HK$6.10 China Property Amy Luk, CFA AC (852) 2800 8524 [email protected] Bloomberg JPMA LUK <GO> J.P. Morgan Securities (Asia Pacific) Limited Price Performance 6.2 5.8 HK$ 5.4 5.0 Jan-14 Apr-14 Jul-14 Oct-14 Jan-15 6139.HK share price (HK$) HSI (rebased) Abs Rel YTD -3.4% -7.6% 1m -2.8% -6.3% Company Data Shares O/S (mn) Market Cap (HK$ mn) Market Cap ($ mn) Price (HK$) Date Of Price Free Float(%) 3M - Avg daily vol (mn) 3M - Avg daily val (HK$ mn) 3M - Avg daily val ($ mn) HSI Exchange Rate Price Target End Date 3m 0.0% -3.3% 12m 4.7% -6.4% 2,000 11,200 1,445 5.60 29 Jan 15 21.3% 0.27 1.54 0.2 2,4861.81 7.75 30-Jun-15 Jinmao Investments (Reuters: 6139.HK, Bloomberg: 6139 HK) HK$ in mn, year-end Dec FY12A FY13A FY14E Revenue (HK$ mn) 2,649 2,634 2,849 Core Profit (HK$ mn) 639 1,013 312 Distributable Profit (HK$ mn) 560 708 903 EPU (HK$) 0.16 DPU (HK$) 0.48 Revenue growth (%) (1.4%) (0.6%) 8.2% Distribution growth (16.1%) 26.4% 27.5% Dividend Yield 8.6% NPV per Share (HK$) 5.58 FY15E 3,177 462 818 0.23 0.48 11.5% (9.4%) 8.6% 6.13 FY16E 3,369 518 889 0.26 0.50 6.1% 8.6% 9.0% - Source: Company data, Bloomberg, J.P. Morgan estimates. 41 Asia Pacific Equity Research 31 January 2015 Amy Luk, CFA (852) 2800 8524 [email protected] Table 19: Summary of initial property portfolio Investment properties Leasable area (sqm) for FY2013 111,292 10,605 670 carparking spaces No. of rooms 555 550 411 450 501 235 329 400 3,431 Jin Mao Tower – office Jin Mao Tower – retail Jin Mao Tower –CP and observation deck Completed Hotels Grand Hyatt Shanghai Westin Beijing JW Marriott Hotel Shenzhen Ritz Carlton, Sanya Hilton Sanya Resort and Spa Hyatt Regency Chongming Renaissance Beijing Wangfujing Hotel Grand Hyatt Lijiang Total no. of completed rooms Total market value DTZ valuation (HK$mn) as at 31 Mar 2014 8,368 1,418 346 3,980 3,433 2,517 3,812 3,428 1,043 1,304 1,286 30,935 Note: Based on exchange rate of RMB1.00: HK$1.2719. Source: Company, DTZ, J.P. Morgan calculation. Table 20: Summary of Jinmao Investments' hotel portfolio Location Year of commencement of operations Development status Hotel Brand Total GFA (sqm) Number of rooms Average room rate for FY13 (HK$) Occupancy Rate for FY13 RevPAR for FY13 (HK$) Revenue for FY13 (HK$'000) Hotel management fee for FY13 (HK$'000) Estimate total expenditure for development (Rmb mn) Valuation of Hotel as at 31 Mar 2014 by DTZ (Rmb mn) Valuation of Hotel as at 31 Mar 2014 by DTZ (HK$ mn) RitzCarlton, Sanya Sanya Hilton Sanya Resort and Spa Sanya Hyatt Regency Chongming Chongming Renaissance Beijing Wangfujing Hotel Beijing Grand Hyatt Lijiang Lijiang Total - Grand Hyatt Shanghai Shanghai Westin Beijing Beijing JW Marriott Hotel Shenzhen Shenzhen 1999 2008 2009 2008 2006 2014 Aug-14 end-2014 - Completed Completed Completed Completed Completed Completed Completed - Grand Hyatt Westin JW Marriott Ritz-Carlton Hilton Renaissance Grand Hyatt - 76,013 77,945 51,730 83,772 75,208 Completed Hyatt Regency 48,992 44,435 82,063 540,158 555 550 411 450 501 235 329 312 3,343 2,053 1,709 1,301 3,471 2,085 n/a n/a n/a - 58.6% 71.7% 75.0% 69.1% 65.8% n/a n/a n/a - 1,203 1,225 975 2,398 1,372 n/a n/a n/a - 529,131 382,551 219,529 511,179 319,275 n/a n/a n/a 1,961,665 18,146 24,373 9,823 29,034 15,292 n/a n/a n/a 96,668 n/a n/a n/a n/a n/a n/a 673 1,304 1,977 3,129 2,699 1,979 2,997 2,695 820 1,025 1,011 16,355 3,980 3,433 2,517 3,812 3,428 1,043 1,304 1,286 20,803 Note: Based on an exchange rate of RMB1.00: HK$1.2719. Source: Company data, DTZ. Table 21: Jin Mao Tower – average rent on the uptrend Office Average occupancy (%) Retail 2011 97.2% Average effective rent (HK$/sqm/mth) 306 97% Average effective rent (HK$/sqm/mth) 435 2012 97.0% 342 100% 498 2013 98.7% 372 100% 537 Source: Company data, J.P. Morgan estimates 42 Average occupancy (%) Asia Pacific Equity Research 31 January 2015 Amy Luk, CFA (852) 2800 8524 [email protected] Figure 55: Historical performance of average room rate (HKD) 4,500 4,000 3,500 3,000 2,500 2,000 1,500 1,000 500 0 Grand Hyatt The Westin JW Marriott Shanghai Beijing Hotel Chaoyang Shenzhen 2011 2012 2013 The RitzCarlton, Sanya Hilton Sanya Resort and Spa Figure 56: Historical performance of occupancy rate (%) 90% 80% 70% 60% 50% 40% 30% 20% 10% 0% Grand Hyatt The Westin JW Marriott The Ritz- Hilton Sanya Shanghai Beijing Hotel Carlton, Sanya Resort and Chaoyang Shenzhen Spa 1H14 2011 2012 2013 1H14 Source: Company data Source: Company data Figure 57: Historical performance of RevPAR (HKD) Figure 58: Historical performance of EBITDA margin (%) 3,000 50% 2,500 40% 2,000 30% 1,500 20% 1,000 10% 500 0 0% Grand Hyatt The Westin JW Marriott Shanghai Beijing Hotel Chaoyang Shenzhen 2011 2012 2013 The RitzCarlton, Sanya Hilton Sanya Resort and Spa Grand Hyatt The Westin JW Marriott The Ritz- Hilton Sanya Shanghai Beijing Hotel Carlton, Sanya Resort and Chaoyang Shenzhen Spa 1H14 2011 2012 2013 1H14 Source: Company data Source: Company data Figure 59: FY13 revenue breakdown by type Figure 60: Valuation composition of Jinmao Investments (as of endMarch 2014) Others 4% Gross rental income 20% Hotel rooms 48% Hotel F&B 28% Source: Company. Note: Revenue after business tax. Grand Hyatt Shanghai, 13% Jin Mao Tower (excl. hotel), 33% Grand Hyatt Lijiang, 4% Renaissance Beijing Wangfujing Hyatt Hotel, 4% Regency Chongming, 3% Westin Beijing, 11% JW Marriott Hotel Shenzhen, 8% Ritz-Carlton, Sanya, 12% Hilton Sanya Resort and Spa, 11% Source: Company data, DTZ. 43 Amy Luk, CFA (852) 2800 8524 [email protected] Asia Pacific Equity Research 31 January 2015 Investment Thesis, Valuation and Risks Jinmao Investments (Neutral; Price Target: HK$6.10) Investment Thesis The properties in the initial portfolio are located in prime locations in top-tier cities or tourist hot spots in China, including Beijing, Shanghai, Shenzhen and Sanya. The two hotels in Sanya and the new hotel in Lijiang are well-positioned to capture the growth of the domestic travel market. The income stream is diversified with the revenue split between rental, hotel room, hotel F&B and other revenue at 20%/48%/28%/4% in FY13. The inclusion of flagship property, Jin Mao Tower in Shanghai, provides a stable growing income source that helped to mitigate the volatility in hotel revenue in the last few years. We believe the diversified and balanced portfolio in prime locations will allow Jinmao to capture both business and leisure travelers and deliver steady performance and distributions. Valuation Our Jun-15 price target of HK$6.1 is based on par with NPV, where a discount rate of 9.82% and long-term growth rate of 1% is adopted. Bond Rate Beta Index Ratio Discount Rate LT Growth Terminal Cap Rate 3.00% 1.24 5.50% 9.82% 1.00% 8.82% Risks to Rating and Price Target Downside risks to our rating and price target include lower-than-expected rental reversion for Jin Mao Tower, higher-than-expected hotel and office vacancies, interest rate hike and a sharp slowdown in China economy. Upside risks to our rating and price target include better-than-expected performance of the two new hotels, faster-than-expected recovery in occupancy and room rates as well as high-than-expected rental growth from Jin Mao Tower and less impact from Shanghai Tower. 44 Asia Pacific Equity Research 31 January 2015 Amy Luk, CFA (852) 2800 8524 [email protected] Jinmao Investments: Summary of Financials Income Statement HK$ in millions, year end Dec Revenues % change Y/Y EBIT % change Y/Y EBIT Margin Net Interest Earnings before tax % change Y/Y Tax as % of EBT Core net profit % change Y/Y Distributable income % change Y/Y Shares outstanding EPS (reported) (HK$) % change Y/Y Core EPS (HK$) % change Y/Y Balance sheet HK$ in millions, year end Dec Cash and cash equivalents Accounts receivable Inventories Others Current assets FY13 2,634 (0.6%) 1,646 30.2% 62.5% (280) 1,368 72.1% (354) 25.9% 1,013 58.7% 708 26.4% - FY14E 2,849 8.2% 773 (53.0%) 27.1% (360) 415 (69.6%) (103) 24.9% 312 (69.2%) 903 27.5% 2,000 0.16 0.16 - FY15E 3,177 11.5% 1,050 35.8% 33.0% (437) 615 48.2% (153) 24.9% 462 48.1% 818 (9.4%) 2,000 0.23 48.1% 0.23 48.1% FY16E 3,369 6.1% 1,127 7.3% 33.4% (439) 690 12.1% (172) 24.9% 518 12.1% 889 8.6% 2,000 0.26 12.1% 0.26 12.1% FY13 1,183 186 25 397 1,791 FY14E 1,042 195 26 0 1,263 FY15E 1,132 205 28 0 1,365 FY16E 1,230 215 29 0 1,474 LT investments Net fixed assets 7,858 9,326 Total Assets 20,511 21,462 Liabilities ST loans 3,470 231 Payables 1,198 1,258 Others 236 45 Total current liabilities 4,904 1,535 Long-term debt 2,099 9,685 Other liabilities 1,578 1,578 Total Liabilities 8,580 12,798 Shareholder's equity 11,931 8,665 BVPS 4.33 Source: Company reports and J.P. Morgan estimates. 9,461 21,710 295 1,384 45 1,724 10,018 1,578 13,320 8,391 4.20 Cash flow statement HK$ in millions, year end Dec EBIT Depr. & amortization Change in working capital Others Cash flow from operations FY13 1,646 222 405 (97) 1,106 FY14E 773 253 256 (106) 818 FY15E 1,050 261 115 (156) 836 FY16E 1,127 265 127 (174) 908 Capex Disposal/(purchase) Net Interest Free cash flow (743) 86 (251) 669 (1,721) (9) (360) (632) (396) (9) (437) 768 (185) (9) (439) 1,052 Equity raised/(repaid) Debt raised/(repaid) Other Dividends paid Beginning cash Ending cash DPS (HK$) 0 150 (606) 0 1,360 1,183 - 3,052 4,348 (6,524) (503) 1,183 1,042 0.48 0 396 82 (818) 1,042 1,132 0.48 0 185 87 (889) 1,132 1,230 0.50 Ratio Analysis %, year end Dec EBIT margin Net margin SG&A/Sales FY13 62.5% 38.5% - FY14E 27.1% 10.9% - FY15E 33.0% 14.5% - FY16E 33.4% 15.4% - (0.6%) 58.7% 6.7 26.9% 36.8% 0.1 1.9 9.2% 7.4% 8.2% (69.2%) 2.8 50.6% 102.4% 0.1 2.0 3.0% 3.2% 11.5% 11.5% 48.1% 48.1% 3.0 52.2% 109.4% 0.1 2.5 5.4% 4.2% 6.1% 6.1% 12.1% 12.1% 3.2 53.3% 114.3% 0.2 2.6 6.3% 4.5% Sales per share growth - Sales growth 9,381 Net profit growth 21,750 EPS growth Interest coverage (x) 295 Net debt to total capital 1,522 Net debt to equity 45 Sales/assets 1,863 Assets/equity 10,203 ROE 1,578 ROCE 13,643 8,107 4.05 45 Asia Pacific Equity Research 31 January 2015 Amy Luk, CFA (852) 2800 8524 [email protected] Link REIT Neutral Increasing risk 0823.HK,823 HK Price: HK$52.90 Unattractive initial yield on first property development: Shortly after obtaining approval from unitholders on the expansion to property development, Link REIT acquired a site jointly with non-listed property company Nan Fung in Kowloon East for developing 2 Grade-A office towers with retail elements and car parks. Attributable development costs for Link's 60% stake in the project is about HK$6,325 mn. We estimate the initial yield on cost for the development is unattractive at 2.6-3.0%. Limited potential rental uplift of Longgang Vanke Mall in the near term: Link REIT has entered into a Letter of Intent with China Vanke for proposed acquisition of Longgang Vanke Mall in Shenzhen, China. The mall has GFA of about 100,000 sqm. The mall is quite new (opened in Dec-13) and is fully occupied. We have paid a visit to the mall recently and found that quite a number of mid-end brands are already in the mall, e.g., Zara, H&M and Uniqlo. Hence, we think that there is not much potential rental growth upside through tenants mix rebranding in the first few years after acquisition. New malls taking time to grow: Looking at the recent acquisition of Lions Rise Mall and this potential acquisition of Longgang Vanke Mall, we think Link REIT has a preference for buying relatively new malls. The initial yields of these new malls are usually low and it will take one or two leasing cycles for the yield to move up to a satisfactory yield. For example, Lions Rise Mall was acquired at 2.4% yield, which may take two to three years to rise to 4-5%. Increasing risk premium: Though we expect the recent land acquisition has neutral impact on DPU in the next 2-3 years, we believe the expansion to property development will increase the business risk. We have adjusted up our beta assumption for the stock from 0.51 to 0.53. The stock has been holding up quite well since acquisition due to the current low interest rate situation, the market cap of the stock and there is a cap of property development (10%), in our view. ▲ Price Target: HK$49.50 Previous: HK$47.50 Hong Kong REITs Amy Luk, CFA AC (852) 2800 8524 [email protected] Bloomberg JPMA LUK <GO> J.P. Morgan Securities (Asia Pacific) Limited Price Performance 55 50 HK$ 45 40 35 30 Jan-14 Apr-14 Jul-14 Oct-14 Jan-15 0823.HK share price (HK$) HSI (rebased) Abs Rel YTD 9.0% 4.8% 1m 9.1% 5.6% Company Data Shares O/S (mn) Market Cap (HK$ mn) Market Cap ($ mn) Price (HK$) Date Of Price Free Float(%) 3M - Avg daily vol (mn) 3M - Avg daily val (HK$ mn) 3M - Avg daily val ($ mn) HSI Exchange Rate Price Target End Date Price Target (HK$) 46 3m 14.1% 10.8% 12m 50.1% 39.0% 2,311 122,246 15,770 52.90 29 Jan 15 99.9% 6.72 329.68 42.5 24,595.85 7.75 31-Dec-15 49.50 Link REIT (Reuters: 0823.HK, Bloomberg: 823 HK) HK$ in mn, year-end Mar FY13A FY14A Revenue (HK$ mn) 6,506 7,155 Net Property Income (HK$ 4,616 5,202 mn) Core Profit (HK$ mn) 3,357 3,860 Distributable Profit (HK$ mn) 3,349 3,830 EPU (HK$) 1.47 1.68 DPU (HK$) 1.46 1.66 Revenue growth (%) 9.7% 10.0% Distribution growth 14.6% 14.4% Dividend Yield 2.8% 3.1% NPV per Share (HK$) Source: Company data, Bloomberg, J.P. Morgan estimates. FY15E 7,579 5,541 FY16E 7,949 5,838 FY17E 8,469 6,251 3,992 4,120 1.73 1.80 5.9% 7.6% 3.4% - 4,344 4,344 1.89 1.89 4.9% 5.4% 3.6% 49.59 4,680 4,680 2.04 2.04 6.5% 7.7% 3.9% - Amy Luk, CFA (852) 2800 8524 [email protected] Asia Pacific Equity Research 31 January 2015 Table 22: Link REIT's retail portfolio breakdown Properties Retail properties valuation FY14 retail rentals Avg mthly unit rent per leased IFA Occupancy HK$ mn HK$ mn HK$ psf % 1-10 25,636 1,393 60.5 98.7 11-50 42,303 2,417 45.1 95.6 51-100 19,267 1,245 32.4 91.8 101-153 4,039 271 23.2 89.3 91,245 5,326 42.1 94.4 As at 31 Mar 2014 Total Note: Properties ranked by retail valuation as at 31 Mar 2014. Source: Company data Table 23: Key car park performance indicators FY14 Utilisation of car park spaces (%) 88.1 Car park income per space per month (HK$) 1,566 Net property income margin (%) 69.1 Average valuation per space (HK$’000) 235 Source: Company data Table 24: Capitalisation rates for valuation As at 31 Mar 2014 Retail properties 4.40 – 6.60% Retail properties: weighted average 5.09% Car parks 4.80 – 7.60% Car parks: weighted average 6.16% Overall weighted average 5.27% Source: Company data Figure 61: Retail rental performance 45 40 35 30 25 20 15 10 5 0 94.1% 94.4% 92.9% 90.6% 30.6 95.0% 93.0% 91.5% 91.0% 32.8 35.8 38.4 42.1 89.0% 87.0% 85.0% Mar-10 Mar-11 Mar-12 Average monthly unit rent (HK$ psf) Mar-13 Mar-14 Occupancy (%) Source: Company data 47 Amy Luk, CFA (852) 2800 8524 [email protected] Asia Pacific Equity Research 31 January 2015 Figure 62: FY14 revenue breakdown Other property related revenue Car park rentals 5% (hourly) 5% Education/Welfare, Office and Ancillary 2% Car park rentals (monthly) 15% Mall Merchandising 2% Markets/Cooked Food Stalls 10% Shops* 61% *Includes base and turnover rents. Source: Company data Figure 63: Tenant trade mix by monthly rent (as at 30 Sep 2014) Others 17% Personal Care, Medicine, Optical, Books & Stationery 8% Services 11% Markets/Cooked Food Stalls 15% Source: Company data Figure 64: Longgang Vanke Mall Atrium Figure 65: Longgang Vanke Mall Source: J.P. Morgan. Source: J.P. Morgan. 48 Food and Beverage 25% Education/Welfare, Office and Ancillary 1% Supermarkets and Foodstuff 23% Asia Pacific Equity Research 31 January 2015 Amy Luk, CFA (852) 2800 8524 [email protected] Figure 66: Kowloon East map MegaBox Link REIT / Nan Fung: HK$6,630 psf Monorail Station (proposed) Octa Tower (Nan Fung) One Bay East Wheelock: HK$3,856 psf Ngau Tau Kok MTR Station Kowloon Godown Wharf T&T Plaza Millennium City Ph II Source: Lands Department, J.P. Morgan. Figure 67: Site in Kowloon East for office development with retail elements Source: J.P. Morgan. 49 Amy Luk, CFA (852) 2800 8524 [email protected] Asia Pacific Equity Research 31 January 2015 Investment Thesis, Valuation and Risks Link REIT (Neutral; Price Target: HK$49.50) Investment Thesis Though we expect the recent land acquisition has neutral impact on DPU in the next 2-3 years, we believe the expansion to property development will increase the business risk. We have adjusted up our beta assumption for the stock from 0.51 to 0.53. The stock has been holding up quite well since acquisition due to the current low interest rate situation, the market cap of the stock and there is a cap of property development (10%), in our view. Valuation Our Dec-15 price target of HK$49.5 is based on par with NPV, where a discount rate of 5.15% and long-term growth rate of 1% is adopted. Bond Rate Beta 2.75% 0.53 Risk premium 4.50% Discount Rate 5.15% LT Grow th 1.00% Terminal Cap Rate 4.15% Risks to Rating and Price Target Downside risks to our price target and rating include a sudden rise in interest rates/ long bond yields, higher-than-expected vacancy, lower-than-expected rental reversions, delay in the completion of AEIs and a sharp slowdown in the Hong Kong economy. Upside risks to our price target and rating include highly yield accretive acquisitions in Hong Kong or China as well as faster-than-expected rental growth. 50 Asia Pacific Equity Research 31 January 2015 Amy Luk, CFA (852) 2800 8524 [email protected] Link REIT: Summary of Financials Income Statement HK$ in millions, year end Mar Revenues % change Y/Y EBIT % change Y/Y EBIT Margin Net Interest Earnings before tax % change Y/Y Tax as % of EBT Core net profit % change Y/Y Distributable income % change Y/Y Shares outstanding EPS (reported) (HK$) % change Y/Y Core EPS (HK$) % change Y/Y Balance sheet HK$ in millions, year end Mar Cash and cash equivalents Accounts receivable Inventories Others Current assets FY14 7,155 10.0% 4,980 13.4% 69.6% (365) 4,615 15.6% (755) 16.4% 3,860 15.0% 3,830 14.4% 2,311 1.68 13.7% 1.68 13.7% FY15E 7,579 5.9% 5,138 3.2% 67.8% (357) 4,781 3.6% (789) 16.5% 3,992 3.4% 4,120 7.6% 2,293 1.73 3.5% 1.73 3.5% FY16E 7,949 4.9% 5,568 8.4% 70.0% (365) 5,202 8.8% (858) 16.5% 4,344 8.8% 4,344 5.4% 2,293 1.89 9.2% 1.89 9.2% FY17E 8,469 6.5% 5,973 7.3% 70.5% (368) 5,605 7.7% (925) 16.5% 4,680 7.7% 4,680 7.7% 2,293 2.04 7.7% 2.04 7.7% FY14 2,794 237 66 3,097 FY15E 1,027 131 35 1,194 FY16E 1,323 138 37 1,497 FY17E 1,734 147 39 1,920 127,756 129,281 129,387 131,215 2,825 1,516 660 5,001 9,399 3,454 17,854 111,427 48.59 2,825 1,590 693 5,107 9,599 3,823 18,530 112,685 49.14 LT investments Net fixed assets 110,038 Total Assets 113,466 Liabilities ST loans 2,825 Payables 1,606 Others 1,101 Total current liabilities 5,532 Long-term debt 9,699 Other liabilities 1,884 Total Liabilities 17,115 Shareholder's equity 96,351 BVPS 41.69 Source: Company reports and J.P. Morgan estimates. Cash flow statement HK$ in millions, year end Mar EBIT Depr. & amortization Change in working capital Others Cash flow from operations FY14 4,980 27 96 (13,413) 4,659 FY15E 5,138 27 (394) (485) 3,735 FY16E 5,568 27 98 (365) 4,728 FY17E 5,973 27 138 (368) 5,123 Capex Disposal/(purchase) Net Interest Free cash flow (1,023) 0 3,941 (1,780) (357) 2,252 (400) (365) 4,632 (400) (368) 5,031 Equity raised/(repaid) Debt raised/(repaid) Other Dividends paid Beginning cash Ending cash DPS (HK$) 0 (1,220) (2,800) 1,657 560 1.66 (890) (300) (3,975) 560 305 1.80 0 200 (4,232) 305 601 1.89 0 200 (4,512) 601 1,012 2.04 FY14 69.6% 53.9% - FY15E 67.8% 52.7% - FY16E 70.0% 54.6% - FY17E 70.5% 55.3% - 8.8% 10.0% 15.0% 13.7% 13.7 9.2% 10.1% 0.1 1.2 4.3% 4.1% 6.0% 5.9% 3.4% 3.5% 14.5 9.1% 10.0% 0.1 1.2 4.0% 3.7% 5.3% 4.9% 8.8% 9.2% 15.3 9.0% 9.9% 0.1 1.2 3.9% 3.7% 6.5% 6.5% 7.7% 7.7% 16.3 8.7% 9.6% 0.1 1.2 4.1% 4.0% Ratio Analysis %, year end Mar EBIT margin Net margin SG&A/Sales Sales per share growth - Sales growth 131,030 Net profit growth 133,281 EPS growth Interest coverage (x) 2,825 Net debt to total capital 1,694 Net debt to equity 738 Sales/assets 5,257 Assets/equity 9,799 ROE 4,269 ROCE 19,324 113,957 49.69 51 Asia Pacific Equity Research 31 January 2015 Non-covered companies Amy Luk, CFA (852) 2800 8524 [email protected] 52 Asia Pacific Equity Research 31 January 2015 Amy Luk, CFA (852) 2800 8524 [email protected] Not Covered Langham Hospitality Investment Price: HK$3.55 Date: 29 Jan 2015 www.langhamhospitality.com Hong Kong REITs Company description Langham Hospitality Investments is the first fixed single investment trust in HK property sector with an initial focus to invest in completed hotels in Asia. The initial asset portfolio comprises of 3 hotels in HK, namely The Langham, Langham Place Hotel and Eaton, which are spun off from sponsor Great Eagle. Amy LukAC (852) 2800 8524 [email protected] J.P. Morgan Securities (Asia Pacific) Limited Price performance 110 100 90 80 Jan-14 May-14 Sep-14 1270 HK Equity Jan-15 HSI Index Positives The three hotels are located in Tsim Sha Tsui, Mong Kok and Yau Ma Tei which can be conveniently accessed by both business and leisure travelers. Average hotels occupancy of 92.1% in 1H14, higher than HK hotel markets where High Tariff A and High Tariff B occupancy was at 86% and 91%, respectively, in 1H14. To provide some support on revenue, parent company Great Eagle (“GE”) has entered into master leave arrangements with Langham for a term of 14 years from 30 May 2013, where GE has agreed to pay fixed annual base rent of HK$225 mn and a variable rent. Source: Bloomberg Performance 1M 3M 12M Absolute (%) 5.3 9.6 -3.8 Relative (%) 0.7 5.6 -13.8 Source: Bloomberg Company data 52-wk range (HK$) Mkt cap. (HK$ MM) Mkt cap. (US$ MM) Avg daily value (US$MM) Avg. daily volume (MM) Shares O/S (MM) Date of price Index: HSI Free float (%) Exchange rate (HK$/US$) 3.17 - 3.94 7,179 926 0.402 0.927 2,022 29-Jan-15 24,595.85 35.9% 7.752 Negatives The hospitality sector is cyclical in nature and vulnerable to any economic slowdown and outbreak of epidemics. There is some sort of financial engineering tied to the distribution of Langham where GE has agreed to wave its entitlement to receive distributions of some share stapled units until FY17. In general, investors prefer companies with clean yield. Valuation The stock is currently trading at 0.67x FY13 P/B and 9.0% FY13 annualized dividend yield. NOTE: THIS DOCUMENT IS BASED SOLELY ON PUBLICLY AVAILABLE INFORMATION. THIS REPORT IS INTENDED AS INFORMATION ONLY AND NOT AS RECOMMENDATION FOR ANY STOCK. J.P. MORGAN EQUITY RESEARCH DOES NOT PROVIDE RESEARCH COVERAGE OR RATING FOR THIS COMPANY. Source: Bloomberg Bloomberg: 1270 HK; Reuters: 1270.HK HK$ in millions, year-end Dec Revenue (HK$ mn) EBIT (HK$ mn) Net Income (HK$ mn) Total distribution (HK$ mn) EPU (HK$) DPU (HK$) Revenue Growth (%) Distribution Growth (%) P/B (x) Dividend Yield (%) FY13 472 394 445 349 0.27 0.19 n/a n/a 0.67 9.0% Source: Bloomberg Note: Share price and valuations are as of 29 Jan 2015. 53 Asia Pacific Equity Research 31 January 2015 Amy Luk, CFA (852) 2800 8524 [email protected] Table 25: Langham's hotel portfolio in Hong Kong Name of Property Location The Langham Tsim Sha Tsui Langham Place Hotel Eaton Total No. of rooms 495 GFA (sqm) Average daily room rate (HK$) 2,266 Occupancy 375,000 Valuation as of 31 Dec 2013 (HK$ mn) 6,080 Mong Kok 652 Yau Ma Tei 88.9% RevPAR (HK$) 2,013 Revenue (HK$ mn) 170 580,000 7,030 1,883 452 339,000 3,586 1,208 90.7% 1,707 202 95.1% 1,149 1,599 1,294,000 16,696 99 472 Note: Operating data refers to FY13. Source: Company data Figure 68: Operating performance of the three hotels in 2013 2,500 95.1% 2,000 1,000 2,266 95.0% 90.7% 88.9% 1,500 90.0% 2,013 1,883 85.0% 1,707 1,208 500 1,149 0 80.0% 75.0% The Langham Langham Place Hotel Average daily room rate (HK$) Eaton RevPAR (HK$) Source: Company data Figure 69: Revenue contribution by hotel in 2013 Eaton 21% The Langham 36% Langham Place Hotel 43% Source: Company data 54 100.0% Occupancy Amy Luk, CFA (852) 2800 8524 [email protected] Asia Pacific Equity Research 31 January 2015 Langham Hospitality Investment: Summary of Financials Profit and loss statement Cash flow statement HK$ in millions, year-end Dec Revenues % change Y/Y EBIT % change Y/Y EBIT margin (%) Net interest Earnings before tax % change Y/Y Tax as % of EBT Net income (reported) % change Y/Y Total distribution % change Y/Y Shares outstanding EPS (reported) (HK$) % change Y/Y HK$ in millions, year-end Dec FY13 472 n/a 394 n/a 83.6% 77 310 n/a 38 12.1% 445 n/a 349 n/a 2,001 0.27 n/a EBIT Depreciation & amortisation Change in working capital Taxes Cash flow from operations FY13 394 84 1,446 38 310 Cashflow from investing (10) Cashflow from financing 420 Net changes in cash 720 Dividends paid DPS (HK$) (10,296) 0.1880 Source: Company data, Bloomberg Source: Company data, Bloomberg Balance sheet Ratio analysis HK$ in millions, year-end Dec Cash and cash equivalents Accounts receivable Inventories Others Current assets LT investments Net fixed assets Total assets Liabilities ST loans Payables Others Total current liabilities Long-term debt Other liabilities Total liabilities Shareholders’ equity BVPS (HK$) FY13 752 129 0 6 887 0 16,696 17,583 0 46 24 69 6,718 125 6,913 10,669 5.33 Source: Company data, Bloomberg %, year-end Dec EBIT margin Sales growth Net profit growth EPS growth Interest coverage (x) Net debt to total capital Net debt to equity Sales/assets Assets/equity ROE ROCE FY13 83.6% n/a n/a n/a 5.0 34.3% 55.9% 2.7% 1.6 n/a 4.7% Source: Company data, Bloomberg Note: Financial performance for FY13 refers to the period from and including the listing date (30 May 2013) to 31 December 2013. 55 Asia Pacific Equity Research 31 January 2015 Amy Luk, CFA (852) 2800 8524 [email protected] Not Covered Mapletree Greater China Commercial Trust Price: S$1.015 Date: 29 Jan 2015 www.mapletreegreaterchinacommercialtrust.com Hong Kong / China / Singapore REITs Amy LukAC (852) 2800 8524 [email protected] J.P. Morgan Securities (Asia Pacific) Limited Price performance 120 110 100 90 Jan-14 May-14 Sep-14 MAGIC SP Equity Jan-15 HSI Index Source: Bloomberg Performance 1M 3M 12M Absolute (%) 6.8 9.1 24.5 Relative (%) 5.2 3.2 10.3 Source: Bloomberg Company data 52-wk range (S$) Mkt cap. (S$ MM) Mkt cap. (US$ MM) Avg daily value (US$MM) Avg. daily volume (MM) Shares O/S (MM) Date of price Index: STI Free float (%) Exchange rate (S$/US$) 0.78 - 1.04 2,754 2,034 2.771 3.898 2,713 29-Jan-15 3,419.05 55.6% 1.354 Company description Mapletree Greater China Commercial Trust (“MGCCT”) is listed in Singapore with an aim to invest in the Greater China region. MGCCT has two commercial assets, retail mall Festival Walk (“FW”) in Kowloon Tong with mid to high-end positioning and Grade A office Gateway Plaza (“GP”) in Beijing. The portfolio has total lettable area of 1.9 mn sf. Positives Solid rental reversions at both FW and GP. In 1HFY15, rental uplifts of 21% and 32% were achieved in FW and GP, respectively. Portfolio occupancy stayed high at 99.2% in Sep-14. MGCCT has been optimizing the lettable area at FW through leasing common and ancillary area for events and introducing kiosks and carts to defined rental areas to enhance rental income. Negatives MGCCT is subject to currency risk as rental income from Festival Walk is in HKD and Gateway Plaza in Rmb while DPU is denominated in SGD. We expect overall HK retail sales to be flattish in 2015, which may impact the rental reversions of FW. On the other hand, future office supply in Beijing may impact office demand for GP. Valuation The stock is currently trading at 0.96x FY14 P/B and 6.2% FY14 dividend yield (for distribution from listing date of 7 Mar 2013 to 31 Mar 2014) based on Bloomberg consensus estimates. NOTE: THIS DOCUMENT IS BASED SOLELY ON PUBLICLY AVAILABLE INFORMATION. THIS REPORT IS INTENDED AS INFORMATION ONLY AND NOT AS RECOMMENDATION FOR ANY STOCK. J.P. MORGAN EQUITY RESEARCH DOES NOT PROVIDE RESEARCH COVERAGE OR RATING FOR THIS COMPANY. Source: Bloomberg Bloomberg: MAGIC SP; Reuters: MAPE.SI S$ in millions, year-end Mar Revenue (HK$ mn) EBIT (HK$ mn) Net Income (HK$ mn) Total distribution (HK$ mn) EPU (HK$) DPU (HK$) Revenue Growth (%) Distribution Growth (%) P/B (x) Dividend Yield (%) Source: Bloomberg Note: Share price and valuations are as of 29 Jan 2015. 56 Mar-14 268 192 119 168 0.04 0.06 n/a n/a 0.96 6.2% Amy Luk, CFA (852) 2800 8524 [email protected] Asia Pacific Equity Research 31 January 2015 Table 26: Mapletree's property portfolio Name of Property Location Completion date GFA (sf) Valuation as of 31 Mar 2014 (S$ mn) Gross cap rate Gross revenue (S$ mn) Net property income (S$ mn) Occupancy Festival Walk Gateway Plaza Kowloon Tong, Hong Kong Nov-98 1,208,754 3,609 4.5% 201 158 100.0% Lufthansa Area, Beijing Aug-05 1,145,882 1,113 6.5% 67 58 97.5% 2,354,636 4,722 268 216 Total Note: Operating data refers to FY13. Source: Company data Figure 70: Operating performance of the two properties in FY13 180 160 140 120 100 80 60 40 20 0 101.0% 100.0% 100.0% 99.0% 158 97.5% 98.0% 58 97.0% 96.0% Festival Walk Net property income (S$ mn) Gateway Plaza Occupancy Source: Company data 57 Amy Luk, CFA (852) 2800 8524 [email protected] Asia Pacific Equity Research 31 January 2015 Mapletree Greater China Commercial Trust: Summary of Financials Profit and loss statement Cash flow statement S$ in millions, year-end Mar Revenues % change Y/Y EBIT % change Y/Y EBIT margin (%) Net interest Earnings before tax % change Y/Y Tax as % of EBT Net income (reported) % change Y/Y Total distribution % change Y/Y Shares outstanding EPS (reported) (S$) % change Y/Y S$ in millions, year-end Mar FY14 268 n/a 192 n/a 71.7% 42 150 n/a 30 20.3% 119 n/a 168 n/a 2,684 0.04 n/a EBIT Depreciation & amortisation Change in working capital Taxes Cash flow from operations FY14 192 (1) (34) 26 142 Cash flow from investing (2,034) Cash flow from financing 2,021 Net changes in cash 129 Dividends paid (85) DPS (S$) 0.0627 Source: Company data, Bloomberg Source: Company data, Bloomberg Balance sheet Ratio analysis S$ in millions, year-end Mar Cash and cash equivalents Accounts receivable Inventories Others Current assets LT investments Net fixed assets Total assets Liabilities ST loans Payables Others Total current liabilities Long-term debt Other liabilities Total liabilities Shareholders’ equity BVPS (S$) Source: Company data, Bloomberg 58 FY14 133 1 1 8 143 0 4,722 4,873 0 7 95 102 1,853 79 2,033 2,840 1.06 %, year-end Mar EBIT margin Sales growth Net profit growth EPS growth Interest coverage (x) Net debt to total capital Net debt to equity Sales/assets Assets/equity ROE ROCE Source: Company data, Bloomberg FY14 71.7% n/a n/a n/a 4.5 36.6% 60.6% 5.5% 1.7 n/a n/a Asia Pacific Equity Research 31 January 2015 Amy Luk, CFA (852) 2800 8524 [email protected] Not Covered New Century REIT Price: HK$3.24 Date: 29 Jan 2015 www.ncreit.com China REITs Company description New Century REIT is the first China-based hotel REIT holding with 5-star hotels and one 4-star hotel. The portfolio has approximately 2,500 hotel rooms located in Hangzhou, Ningbo, Changchun and Shanghai. The hotels are operated under New Century, which is a domestic brand. New Century Group and Carlyle Group are the sponsors of New Century REIT. Amy LukAC (852) 2800 8524 [email protected] J.P. Morgan Securities (Asia Pacific) Limited Price performance Positives New Century has some downside protection from base rent amounting to Rmb264 mn p.a. guaranteed by New Century Tourism and Bank of China. New Century Hotel Group operates over 50 hotels in China, which could be potentially injected to New Century REIT for potential acquisition growth. 110 100 90 80 Jan-14 May-14 Sep-14 1275 HK Equity Jan-15 Negatives The hospitality sector is cyclical in nature. The industry may be adversely affected by any global economic downturn, which may affect the willingness of both business and leisure travelers to spend in China. While potential acquisitions might enhance New Century's revenue, the type of funding to finance the acquisitions might also dilute book value and dividends per share. HSI Index Source: Bloomberg Performance 1M 3M Absolute (%) 12M -2.4 -2.7 -9.5 Relative (%) -6.8 -6.2 -18.9 Valuation The stock is currently trading at 0.83x FY13 P/B and 10.1% FY13 dividend yield (based on annualized distribution). Source: Bloomberg Company data 52-wk range (HK$) Mkt cap. (HK$ MM) Mkt cap. (US$ MM) Avg daily value (US$MM) Avg. daily volume (MM) Shares O/S (MM) Date of price Index: HSI Free float (%) Exchange rate (HK$/US$) 3.16 - 3.90 3,017 389 0.233 0.545 931 29-Jan-15 24,595.85 21.1% 7.752 NOTE: THIS DOCUMENT IS BASED SOLELY ON PUBLICLY AVAILABLE INFORMATION. THIS REPORT IS INTENDED AS INFORMATION ONLY AND NOT AS RECOMMENDATION FOR ANY STOCK. J.P. MORGAN EQUITY RESEARCH DOES NOT PROVIDE RESEARCH COVERAGE OR RATING FOR THIS COMPANY. Source: Bloomberg Bloomberg: 1275 HK; Reuters: 1275.HK Rmb in millions, year-end Dec Revenue (Rmb mn) EBIT (Rmb mn) Net Income (Rmb mn) Total distribution (Rmb mn) EPU (Rmb) DPU (Rmb) Revenue Growth (%) Distribution Growth (%) P/B (x) Dividend Yield (%) FY10 706 112 29 n/a n/a 0.00 n/a n/a n/a n/a FY11 794 154 74 n/a n/a 0.00 12.5% n/a n/a n/a FY12 804 158 76 n/a n/a 0.00 1.2% n/a n/a n/a FY13 469 105 -131 81 -0.19 0.12 (41.7%) n/a 0.83 10.1% Source: Bloomberg Note: Share price and valuations are as of 29 Jan 2015 59 Asia Pacific Equity Research 31 January 2015 Amy Luk, CFA (852) 2800 8524 [email protected] Table 27: New Century REIT's hotel portfolio Name of Property Location No. of rooms GFA (sqm) Valuation as of 31 Dec 2013 (Rmb mn) Net property yield Avg daily room rate (Rmb) Occupancy RevPAR (Rmb) New Century Grand Hotel Hangzhou Hangzhou 699 130,105 1,900 5.0% 576 59.5% 342 New Century Hotel Xiaoshan Zhejiang Xiaoshan 375 39,851 580 6.7% 341 59.8% 204 New Century Resort Qiandao Lake Hangzhou Hangzhou 227 39,402 300 7.1% 870 57.1% 496 Shanghai Songjiang New Century Grand Hotel Shanghai 446 71,027 810* n/a n/a n/a n/a New Century Grand Hotel Ningbo Ningbo 392 66,107 770 5.4% 534 54.9% 293 New Century Grand Hotel Changchun Changchun 4.9% 642 64.2% 412 Total 328 45,625 640 2,467 392,117 5,000 *Valuation disclosed in 2014 interim report. Note: Operating data refers to FY13. Source: Company data Figure 71: FY13 revenue breakdown Ancillary services 3% Rental income 31% Food & beverage 41% Hotel room revenue 25% Source: Company data 60 Asia Pacific Equity Research 31 January 2015 Amy Luk, CFA (852) 2800 8524 [email protected] New Century REIT: Summary of Financials Profit and loss statement Cash flow statement Rmb in millions, year-end Dec Revenues % change Y/Y EBIT % change Y/Y EBIT margin (%) Net interest Earnings before tax % change Y/Y Tax as % of EBT Net income (reported) % change Y/Y Total distribution % change Y/Y Shares outstanding EPS (reported) (Rmb) % change Y/Y Rmb in millions, year-end Dec FY10 706 n/a 112 n/a 15.9% 67 50 n/a 20 39.5% 29 n/a n/a n/a n/a n/a n/a FY11 794 12.5% 154 36.6% 19.3% 76 99 97.6% 24 24.3% 74 152.8% n/a n/a n/a n/a n/a FY12 804 1.2% 158 3.1% 19.7% 105 114 14.8% 36 32.1% 76 3.0% n/a n/a n/a n/a n/a FY13 469 (41.7%) 105 (33.6%) 22.4% 52 -158 (238.3%) -27 17.1% -131 (271.3%) 81 n/a 772 -0.19 n/a FY10 112 99 15 16 130 FY11 154 92 2 23 176 FY12 158 94 114 28 317 FY13 105 51 (149) 30 (29) Cashflow from investing 357 (712) (198) 1,171 Cashflow from financing (467) 563 189 (1,407) 21 27 309 (264) 0 0 0 (388) 0.0000 0.0000 0.0000 0.1225 FY10 15.9% FY11 19.3% FY12 19.7% FY13 22.4% n/a n/a n/a 12.5% 152.8% n/a 1.2% 3.0% n/a (41.7%) (271.3%) n/a 1.7 51.8% 120.0% 34.8% 2.8 n/a n/a 2.3 59.2% 165.3% 30.0% 3.3 9.8% 3.9% 2.1 41.5% 97.3% 26.5% 2.7 7.9% 3.2% -2.0 28.5% 42.8% 10.6% 1.9 (7.5%) (4.2%) EBIT Depreciation & amortisation Change in working capital Taxes Cash flow from operations Net changes in cash Dividends paid DPS (Rmb) Source: Company data, Bloomberg Source: Company data, Bloomberg Balance sheet Ratio analysis Rmb in millions, year-end Dec Cash and cash equivalents Accounts receivable Inventories Others Current assets LT investments Net fixed assets Total assets Liabilities ST loans Payables Others Total current liabilities Long-term debt Other liabilities Total liabilities Shareholders’ equity BVPS (Rmb) Source: Company data, Bloomberg FY10 74 10 0 540 624 0 0 2,026 FY11 101 12 0 1,177 1,290 0 0 2,644 FY12 410 13 0 1,325 1,747 0 0 3,031 FY13 146 4 0 49 199 0 4,190 4,404 228 98 266 591 705 6 1,302 716 n/a 577 73 341 991 842 6 1,838 797 n/a 425 68 311 803 1,080 13 1,896 1,126 n/a 250 10 92 352 909 750 2,011 2,368 3.07 %, year-end Dec EBIT margin Sales growth Net profit growth EPS growth Interest coverage (x) Net debt to total capital Net debt to equity Sales/assets Assets/equity ROE ROCE Source: Company data, Bloomberg 61 Asia Pacific Equity Research 31 January 2015 Amy Luk, CFA (852) 2800 8524 [email protected] Not Covered Prosperity REIT Price: HK$2.87 Date: 29 Jan 2015 www.prosperityreit.com Hong Kong REITs Company description Prosperity REIT owns a portfolio of 8 properties in decentralized districts like Island East and Kowloon East, mainly offices and industrial/office (“I/O”). The total gross rentable area (“GRA”) is 1,35 mn sf. Cheung Kong together with Hutchison own around 20% stake in Prosperity. Amy LukAC (852) 2800 8524 [email protected] J.P. Morgan Securities (Asia Pacific) Limited Positives In 2012, approval was obtained from the government to convert the use of Prosperity Place from I/O to commercial use under the industrial buildings revitalization scheme. Assets enhancement and alteration works on the building upgraded the building image and attracted more high-quality commercial tenants. New retail/service trade tenants accounted for over 20% of GRA as at 30 Jun 14. There is still potential conversion in Prosperity existing portfolio such as Trendy Centre. On the other hand, refinancing of debt amounted to HK$2.2 bn maturing in August 2015 was arranged in November 2014 at Hibor + 135 bps. The REIT will not have any major refinancing needs until 2019. Price performance 130 120 110 100 90 80 Jan-14 May-14 Sep-14 808 HK Equity Jan-15 HSI Index Source: Bloomberg Performance 1M 3M 12M Absolute (%) 8.7 12.5 29.3 Relative (%) 3.9 8.5 15.8 Negatives Grade A office supply in Kowloon East amounts to 1.3 mn sf and 0.6 mn sf in 2015 and 2016, respectively, according to Jones Lang LaSalle. This will create potential competition on tenants to offices of Prosperity in that area, such as 9 Chong Yip Street in Kwun Tong. Source: Bloomberg Company data 52-wk range (HK$) Mkt cap. (HK$ MM) Mkt cap. (US$ MM) Avg daily value (US$MM) Avg. daily volume (MM) Shares O/S (MM) Date of price Index: HSI Free float (%) Exchange rate (HK$/US$) Valuation The stock is currently trading at 0.63x FY13 P/B and 5.2% FY13 dividend yield. 2.16 - 2.95 4,074 526 0.472 1.355 1,420 29-Jan-15 24,595.85 87.6% 7.752 NOTE: THIS DOCUMENT IS BASED SOLELY ON PUBLICLY AVAILABLE INFORMATION. THIS REPORT IS INTENDED AS INFORMATION ONLY AND NOT AS RECOMMENDATION FOR ANY STOCK. J.P. MORGAN EQUITY RESEARCH DOES NOT PROVIDE RESEARCH COVERAGE OR RATING FOR THIS COMPANY. Source: Bloomberg Bloomberg: 808 HK; Reuters: 0808.HK HK$ in millions, year-end Dec Revenue (HK$ mn) EBIT (HK$ mn) Net Income (HK$ mn) Total distribution (HK$ mn) EPU (HK$) DPU (HK$) Revenue Growth (%) Distribution Growth (%) P/B (x) Dividend Yield (%) FY10 270 177 653 148 0.49 0.11 2.4% 1.7% 1.07 3.8% FY11 278 175 1,151 164 0.85 0.12 3.1% 10.6% 0.80 4.2% Source: Bloomberg Note: Share price and valuations are as of 29 Jan 2015 62 FY12 308 196 1,075 187 0.78 0.14 10.8% 14.3% 0.68 4.7% FY13 342 216 696 209 0.50 0.15 10.8% 11.9% 0.63 5.2% Asia Pacific Equity Research 31 January 2015 Amy Luk, CFA (852) 2800 8524 [email protected] Table 28: Prosperity REIT's property portfolio Name of Property Location GRA (sf) Valuation as of 31 Dec 2013 (HK$ mn) Net property yield (%) Revenue (HK$'000) Net property income (HK$'000) Occupancy as at 31 Dec 2013 The Metropolis Tower Hung Hom 271,418 2,943 3.4 113,754 91,409 97.6% Prosperity Millennia Plaza North Point 217,955 1,725 3.7 72,787 58,363 99.1% 9 Chong Yip Street Kwun Tong 136,595 1,064* n/a 31,246# 24,302# 95.8%* Grade A Office Commercial Harbourfront Landmark (portion) Hung Hom 77,021 461 3.8 22,194 16,942 100.0% Prosperity Place Kwun Tong 240,000 1,402 3.3 49,661 37,254 99.3% Trendy Centre Lai Chi Kok 173,764 912 3.9 39,909 30,103 99.2% Prosperity Center (portion) Kwun Tong 149,253 786 3.5 30,981 23,431 99.2% 86,168 289 4.0 12,597 9,429 100.0% 1,352,174 9,582 373,129 291,233 Industrial/Office Industrial New Treasure Centre (portion) San Po Kong Total *As at 30 Jun 2014. #Annualised figures for 1H14 income. Note: Operating data refers to FY13. Source: Company data, J.P. Morgan estimates Figure 72: FY13 net property income breakdown Industrial/Office 18% Figure 73: Property valuation breakdown (as of 31 Dec 2013) Industrial 3% Commercial 19% Source: Company data, J.P. Morgan estimates Industrial/Office 18% Grade A Office 60% Industrial 3% Commercial 19% Grade A Office 60% Source: Company data, J.P. Morgan estimates 63 Asia Pacific Equity Research 31 January 2015 Amy Luk, CFA (852) 2800 8524 [email protected] Prosperity REIT: Summary of Financials Profit and loss statement Cash flow statement HK$ in millions, year-end Dec Revenues % change Y/Y EBIT % change Y/Y EBIT margin (%) Net interest Earnings before tax % change Y/Y Tax as % of EBT Net income (reported) % change Y/Y Total distribution % change Y/Y Shares outstanding EPS (reported) (HK$) % change Y/Y HK$ in millions, year-end Dec FY10 270 2.4% 177 2.0% 65.6% 65 782 57.2% 129 16.5% 653 54.7% 148 1.7% 1,343 0.49 53.1% FY11 278 3.1% 175 (1.2%) 62.9% 46 1,173 50.0% 21 1.8% 1,151 76.5% 164 10.6% 1,360 0.85 73.5% FY12 308 10.8% 196 11.8% 63.4% 44 1,100 (6.2%) 25 2.3% 1,075 (6.7%) 187 14.3% 1,380 0.78 (8.2%) FY13 342 10.8% 216 10.3% 63.1% 42 724 (34.1%) 29 4.0% 696 (35.3%) 209 11.9% 1,396 0.50 (35.9%) FY10 177 0 2 4 151 FY11 175 0 21 10 182 FY12 196 0 4 9 193 FY13 216 0 14 16 224 Cash flow from investing (8) (13) (13) (15) Cash flow from financing (167) (146) (189) (195) (24) 23 (9) 14 (147) (154) (174) (200) 0.1101 0.1202 0.1354 0.1495 EBIT Depreciation & amortisation Change in working capital Taxes Cash flow from operations Net changes in cash Dividends paid DPS (HK$) Source: Company data, Bloomberg Source: Company data, Bloomberg Balance sheet Ratio analysis HK$ in millions, year-end Dec Cash and cash equivalents Accounts receivable Inventories Others Current assets LT investments Net fixed assets Total assets Liabilities ST loans Payables Others Total current liabilities Long-term debt Other liabilities Total liabilities Shareholders’ equity BVPS (HK$) Source: Company data, Bloomberg 64 FY10 30 0 0 8 38 0 5,934 5,972 FY11 53 0 0 8 61 0 6,991 7,052 FY12 44 0 0 7 52 0 7,952 8,004 FY13 58 1 0 8 67 0 8,518 8,585 0 1 233 233 1,750 395 2,378 3,594 2.68 0 2 269 271 1,768 106 2,146 4,907 3.61 0 1 276 277 1,763 145 2,185 5,819 4.22 0 1 307 308 1,779 137 2,223 6,361 4.56 %, year-end Dec EBIT margin FY10 65.6% FY11 62.9% FY12 63.4% FY13 63.1% Sales growth Net profit growth EPS growth 2.4% 54.7% 53.1% 3.1% 76.5% 73.5% 10.8% (6.7%) (8.2%) 10.8% (35.3%) (35.9%) Interest coverage (x) Net debt to total capital Net debt to equity Sales/assets Assets/equity ROE ROCE 12.9 32.2% 47.9% 4.5% 1.7 19.6% 12.8% 26.4 25.7% 35.0% 3.9% 1.4 27.1% 19.2% 26.2 22.7% 29.5% 3.9% 1.4 20.0% 15.1% 18.3 21.1% 27.0% 4.0% 1.3 11.4% 8.9% Source: Company data, Bloomberg Asia Pacific Equity Research 31 January 2015 Amy Luk, CFA (852) 2800 8524 [email protected] Not Covered Regal REIT Price: HK$2.16 Date: 29 Jan 2015 www.regalreit.com Hong Kong REITs Company description Regal REIT holds a portfolio of eight hotels with 4,570 rooms across Hong Kong Island, Kowloon, New Territories and Lantau Island. The hotels are operated under “Regal” brand. The five initial hotels are leased to Regal Hotels International Holdings (“RHIHL”) which is the major unit holder of Regal REIT. Amy LukAC (852) 2800 8524 [email protected] J.P. Morgan Securities (Asia Pacific) Limited Positives Under the lease agreement with RHIHL, Regal REIT will receive an annual base rent determined by an independent professional property valuer on an annual basis and variable rent for the five initial hotels. This provides some support for the REIT income. The REIT has a right of first refusal to purchase from RHIHL’s majority interest in the hotel that it may wish to dispose of in the future, providing an acquisition pipeline. Price performance 110 100 90 80 Jan-14 May-14 Sep-14 1881 HK Equity Jan-15 HSI Index Negatives The hospitality sector is cyclical in nature and vulnerable to any economic slowdown and outbreak of epidemics. In FY13, 45% of the customers were originally from China. Potential slowdown in mainland visitors may affect occupancy and room rate. Source: Bloomberg Performance 1M 3M 12M Absolute (%) 5.4 10.8 3.8 Relative (%) 0.7 6.7 -7.0 Valuation The stock is currently trading at 0.45x FY13 P/B and 6.9% FY13 dividend yield. Source: Bloomberg Company data 52-wk range (HK$) Mkt cap. (HK$ MM) Mkt cap. (US$ MM) Avg daily value (US$MM) Avg. daily volume (MM) Shares O/S (MM) Date of price Index: HSI Free float (%) Exchange rate (HK$/US$) NOTE: THIS DOCUMENT IS BASED SOLELY ON PUBLICLY AVAILABLE 1.92 - 2.32 7,036 908 0.220 0.832 3,257 29-Jan-15 24,595.85 25.0% 7.752 INFORMATION. THIS REPORT IS INTENDED AS INFORMATION ONLY AND NOT AS RECOMMENDATION FOR ANY STOCK. J.P. MORGAN EQUITY RESEARCH DOES NOT PROVIDE RESEARCH COVERAGE OR RATING FOR THIS COMPANY. Source: Bloomberg Bloomberg: 1881 HK; Reuters: 1881.HK HK$ in millions, year-end Dec Revenue (HK$ mn) EBIT (HK$ mn) Net Income (HK$ mn) Total distribution (HK$ mn) EPU (HK$) DPU (HK$) Revenue Growth (%) Distribution Growth (%) P/B (x) Dividend Yield (%) FY10 910 810 997 617 0.31 0.19 19.2% 15.8% 0.71 8.8% FY11 743 624 2,997 391 0.92 0.12 (18.3%) (36.6%) 0.56 5.6% FY12 845 708 3,549 456 1.09 0.14 13.6% 16.7% 0.44 6.5% FY13 867 713 343 489 0.11 0.15 2.7% 7.1% 0.45 6.9% Source: Bloomberg Note: Share price and valuations are as of 29 Jan 2015 65 Asia Pacific Equity Research 31 January 2015 Amy Luk, CFA (852) 2800 8524 [email protected] Table 29 Regal REIT's hotel portfolio in HK Name of Property Location Opening year No. of rooms GFA (sqm) Valuation as of 31 Dec 2013 (HK$ mn) Net property yield (%) Regal Airport Hotel Chek Lap Kok 1999 1171 71,988 3,440 7.2 Regal Hongkong Hotel Causeway Bay 1993 482 25,091 4,290 3.4 Regal Kowloon Hotel Tsim Sha Tsui 1982 600 31,746 5,480 3.1 Regal Oriental Hotel Kowloon City 1982 494 22,601 2,230 Regal Riverside Hotel Shatin 1986 1138 59,668 Regal iClub Hotel Wanchai 2009 99 iclub Sheung Wan Hotel Sheung Wan 2014 iclub Fortress Hill Hotel North Point 2014 Total Average room rate (HK$) Occupancy 1,142 89% 1,413 91% 1,216 92% 3.4 830 94% 4,760 3.6 778 89% 5,326 880 3.4 49.0 1,208 100% 248 7,197 1,580^ n/a 79.0# n/a n/a 338 n/a 1,650* n/a 82.5# n/a n/a 4,570 24,310 Gross rental & hotel revenue (HK$ mn) 817.9 1,028 *Valuation as of 30 Apr 2014. ^Valuation as of 30 Jun 2014. #Annual rent for the first lease year. Note: Operating data refers to FY13. Source: Company data, J.P. Morgan estimates 66 Asia Pacific Equity Research 31 January 2015 Amy Luk, CFA (852) 2800 8524 [email protected] Regal REIT: Summary of Financials Profit and loss statement Cash flow statement HK$ in millions, year-end Dec Revenues % change Y/Y EBIT % change Y/Y EBIT margin (%) Net interest Earnings before tax % change Y/Y Tax as % of EBT Net income (reported) % change Y/Y Total distribution % change Y/Y Shares outstanding EPS (reported) (HK$) % change Y/Y HK$ in millions, year-end Dec FY10 910 19.2% 810 20.3% 89.0% 41 1,120 42.2% 103 9.2% 997 46.1% 617 15.8% 3,242 0.31 43.7% FY11 743 (18.3%) 624 (22.9%) 84.0% 44 3,071 174.1% 73 2.4% 2,997 200.6% 391 (36.6%) 3,257 0.92 198.1% FY12 845 13.6% 708 13.4% 83.8% 103 3,644 18.7% 95 2.6% 3,549 18.4% 456 16.7% 3,257 1.09 18.2% FY13 867 2.7% 713 0.7% 82.2% 162 436 (88.0%) 94 21.5% 343 (90.3%) 489 7.1% 3,257 0.11 (90.4%) EBIT Depreciation & amortisation Change in working capital Taxes Cash flow from operations FY10 810 0 (81) 21 669 FY11 624 5 120 42 535 FY12 708 7 (67) 35 471 FY13 713 8 101 75 628 Cash flow from investing (120) (83) (45) (2,137) Cash flow from financing (590) (455) (424) 1,533 (41) (3) 2 23 (552) (524) (410) (469) 0.1900 0.1200 0.1400 0.1500 Net changes in cash Dividends paid DPS (HK$) Source: Company data, Bloomberg Source: Company data, Bloomberg Balance sheet Ratio analysis HK$ in millions, year-end Dec Cash and cash equivalents Accounts receivable Inventories Others Current assets LT investments Net fixed assets Total assets Liabilities ST loans Payables Others Total current liabilities Long-term debt Other liabilities Total liabilities Shareholders’ equity BVPS (HK$) Source: Company data, Bloomberg FY10 27 121 0 79 227 0 14,880 15,107 FY11 24 53 0 77 153 0 17,154 17,922 FY12 25 98 0 46 170 0 20,292 21,202 FY13 48 55 0 1,072 1,175 0 20,380 23,203 75 10 103 188 4,617 383 5,188 9,920 3.06 4,563 88 91 4,742 209 320 5,270 12,652 3.88 5 73 40 118 4,776 377 5,271 15,931 4.89 155 132 49 336 4,763 2,331 7,429 15,774 4.84 %, year-end Dec EBIT margin FY10 89.0% FY11 84.0% FY12 83.8% FY13 82.2% Sales growth Net profit growth EPS growth 19.2% 46.1% 43.7% (18.3%) 200.6% 198.1% 13.6% 18.4% 18.2% 2.7% (90.3%) (90.4%) Interest coverage (x) Net debt to total capital Net debt to equity Sales/assets Assets/equity ROE ROCE 28.3 31.9% 47.0% 6.0% 1.5 10.4% 7.1% 70.4 27.3% 37.5% 4.1% 1.4 26.6% 18.7% 36.4 23.0% 29.9% 4.0% 1.3 24.8% 18.6% 3.7 23.5% 30.9% 3.7% 1.5 2.2% 1.7% Source: Company data, Bloomberg 67 Asia Pacific Equity Research 31 January 2015 Amy Luk, CFA (852) 2800 8524 [email protected] Not Covered Spring REIT Price: HK$3.75 Date: 29 Jan 2015 www.springreit.com China REITs Company description Spring REIT owns two Premium Grade office buildings with a total GFA of 120,245 sqm and approximately 600 car parking spaces in the CBD of Beijing, to the west of East 4th Ring Road and at the intersection of Jianguo Road and West Dawang Road, which is part of China Central Place (“CCP”), a mixed-use complex with hotels and shopping centres. Amy LukAC (852) 2800 8524 [email protected] J.P. Morgan Securities (Asia Pacific) Limited Price performance Positives Despite average monthly passing rental increasing meaningfully to Rmb359psm in 3Q14 from Rmb288 psm in 2013, it is still lower than the spot rent at around Rmb380 psm. There is still positive rental reversion potential. Occupancy remained at a high level of 95% in 3Q14. 120 110 100 90 80 Jan-14 May-14 Sep-14 1426 HK Equity Jan-15 Negatives Spring REIT is subject to concentration risk in the Beijing office market as it is essentially as single asset REIT. The future office supply in Beijing may impact the demand for CCP offices. Under the distribution policy, the payout ratio is 100% for FY14 and at least 90% thereafter. There is a potential for a drop in payout ratio in FY15 or after. HSI Index Source: Bloomberg Performance 1M 3M 12M Absolute (%) 2.2 5.3 23.0 Relative (%) -2.4 1.5 10.2 Valuation The stock is currently trading at 0.61x FY13 P/B and 1.9% FY13 dividend yield (based on special distribution in FY13 for surplus cash held as the REIT was listed on December 5, 2013). Source: Bloomberg Company data 52-wk range (HK$) Mkt cap. (HK$ MM) Mkt cap. (US$ MM) Avg daily value (US$MM) Avg. daily volume (MM) Shares O/S (MM) Date of price Index: HSI Free float (%) Exchange rate (HK$/US$) 2.67 - 3.91 4,161 537 0.377 0.814 1,109 29-Jan-15 24,595.85 62.3% 7.752 NOTE: THIS DOCUMENT IS BASED SOLELY ON PUBLICLY AVAILABLE INFORMATION. THIS REPORT IS INTENDED AS INFORMATION ONLY AND NOT AS RECOMMENDATION FOR ANY STOCK. J.P. MORGAN EQUITY RESEARCH DOES NOT PROVIDE RESEARCH COVERAGE OR RATING FOR THIS COMPANY. Source: Bloomberg Bloomberg: 1426 HK; Reuters: 1426.HK US$ in millions, year-end Dec Revenue (US$ mn) EBIT (US$ mn) Net Income (US$ mn) Total distribution (US$ mn) EPU (US$) DPU (US$) Revenue Growth (%) Distribution Growth (%) P/B (x) Dividend Yield (%) FY10 37 25 99 n/a n/a n/a n/a n/a n/a n/a FY11 47 34 184 n/a n/a n/a 25.2% n/a n/a n/a FY12 53 39 194 n/a n/a n/a 13.8% n/a n/a n/a FY13 71 49 70 10 0.06 0.01 33.1% n/a 0.61 1.9% Source: Bloomberg Note: Share price and valuations are as of 29 Jan 2015. FY13 dividend yield based on special distribution only as the REIT was listed on December 5, 2013. 68 Asia Pacific Equity Research 31 January 2015 Amy Luk, CFA (852) 2800 8524 [email protected] Table 30: Spring REIT's property portfolio Name of Property Location China Central Place Beijing Completion date GFA (sqm) Valuation (Rmb mn) Net property yield (%) Rental revenue (USD '000) 2006 145,373 7,760 5.1 66,240 n/a 120,245 n/a n/a 65,746 96% 25,127 n/a n/a 494 n/a Office (Tower 1 & 2) Car park (600 spaces) Average occupancy Note: Operating data refers to FY13. Source: Company data Figure 74: Average monthly spot rental vs average monthly passing rental 400 350 300 250 200 150 100 50 0 332 198 188 375 288 372 400 300 241 201 Figure 75: Lease expiring profile and expiring rental 357 251 200 44% Source: Company data 2012 2013 20% 32% 13% 2011 50% 30% 226 100 60% 40% 11% 0 2010 323 2014 2015 2016 10% 0% 2017 & beyond Average monthly spot rental (Rmb/sqm) Expiring leases as a % of leased office GFA (RHS) Average monthly passing rental (Rmb/sqm) Average monthly rental for expiring leases (Rmb/sqm) Source: Company data 69 Asia Pacific Equity Research 31 January 2015 Amy Luk, CFA (852) 2800 8524 [email protected] Spring REIT: Summary of Financials Profit and loss statement Cash flow statement US$ in millions, year-end Dec Revenues % change Y/Y EBIT % change Y/Y EBIT margin (%) Net interest Earnings before tax % change Y/Y Tax as % of EBT Net income (reported) % change Y/Y Total distribution % change Y/Y Shares outstanding EPS (reported) (US$) % change Y/Y US$ in millions, year-end Dec FY10 37 n/a 25 n/a 67.9% 31 99 n/a 0 0.0% 99 n/a n/a n/a n/a n/a n/a FY11 47 25.2% 34 34.2% 72.7% 30 184 85.2% 0 0.0% 184 85.2% n/a n/a n/a n/a n/a FY12 53 13.8% 39 15.6% 73.9% 29 194 5.9% 0 0.0% 194 5.9% n/a n/a n/a n/a n/a FY13 71 33.1% 49 24.6% 69.2% 29 70 (64.1%) 0 0.0% 70 (64.1%) 10 n/a 1,098 0.06 n/a FY10 25 0 3 0 10 FY11 34 0 3 0 12 FY12 39 0 3 0 16 FY13 49 0 11 0 54 Cashflow from investing 16 (15) (6) (25) Cashflow from financing (20) 0 0 26 Net changes in cash 6 (4) 10 55 Dividends paid 0 0 0 (15) n/a n/a n/a 0.0090 EBIT Depreciation & amortisation Change in working capital Taxes Cash flow from operations DPS (US$) Source: Company data, Bloomberg Source: Company data, Bloomberg Balance sheet Ratio analysis US$ in millions, year-end Dec Cash and Cash Equivalents Accounts receivable Inventories Others Current assets LT investments Net fixed assets Total Assets Liabilities ST bank loans Payables Others Total current liabilities Long term debt Other liabilities Total liabilities Shareholder's equity BVPS (US$) Source: Company data, Bloomberg 70 FY10 6 0 0 45 51 0 791 848 FY11 2 0 0 62 64 0 994 1,062 FY12 12 0 0 68 80 0 1,187 1,267 FY13 67 0 0 63 130 0 1,273 1,404 0 0 20 20 466 0 486 363 n/a 0 0 20 20 472 0 492 569 n/a 477 0 24 501 0 0 501 766 n/a 0 0 37 37 505 0 541 862 0.79 %, year-end Dec EBIT margin Sales growth Net profit growth EPS growth Interest coverage (x) Net debt to total capital Net debt to equity Sales/assets Assets/equity ROE ROCE Source: Company data, Bloomberg FY10 67.9% FY11 72.7% FY12 73.9% FY13 69.2% n/a n/a n/a 25.2% 85.2% n/a 13.8% 5.9% n/a 33.1% (64.1%) n/a 4.2 55.5% 126.9% 4.4% 2.3 n/a n/a 7.2 45.1% 82.6% 4.4% 1.9 39.4% 19.6% 7.7 37.4% 60.7% 4.2% 1.7 29.1% 17.0% 3.4 32.0% 50.7% 5.0% 1.6 8.6% 5.3% Asia Pacific Equity Research 31 January 2015 Amy Luk, CFA (852) 2800 8524 [email protected] Not Covered Sunlight REIT Price: HK$3.93 Date: 29 Jan 2015 www.sunlightreit.com Hong Kong REITs Company description Sunlight REIT has a diversified portfolio of 12 office and 7 retail properties in HK with an aggregate gross rentable area (“GRA”) of approximately 1.3 mn sf. The properties are mainly located in decentralized locations and the split between office and retail is balanced in terms of property valuation. Henderson Land is the sponsor of Sunlight REIT. Amy LukAC (852) 2800 8524 [email protected] J.P. Morgan Securities (Asia Pacific) Limited Price performance Positives The only Grade A office building in the portfolio, 248 Queen’s Road East, will have 47.8% of expiring GRA in FY15. Net property income (“NPI”) Given the average rent of expiring leases at HK$29.4 psf is lower than market rent, we expect the building could achieve positive rental reversion in FY15. In 1QFY15, the property achieved rental reversion of 21.6% for about 23.2% of GRA. 120 110 100 90 Jan-14 May-14 Sep-14 435 HK Equity Jan-15 HSI Index Negatives Sheung Shui Centre Shopping Arcade, accounting for 24.5% of FY14 NPI, is facing the risks of potential drop in same day visitors from mainland as the mall is located close to the border in New Territories. Tenants sales in this mall may get negatively impacted in case there is any change in the multiple entry scheme to Shenzhen residents of the Individual Visit Scheme. Source: Bloomberg Performance 1M 3M 12M Absolute (%) 12.6 18.7 38.9 Relative (%) 7.6 14.4 24.4 Valuation The stock is currently trading at 0.56x FY14 P/B and 5.1% FY14 dividend yield. Source: Bloomberg Company data 52-wk range (HK$) Mkt cap. (HK$ MM) Mkt cap. (US$ MM) Avg daily value (US$MM) Avg. daily volume (MM) Shares O/S (MM) Date of price Index: HSI Free float (%) Exchange rate (HK$/US$) 2.71 - 4.05 6,417 828 0.661 1.435 1,633 29-Jan-15 24,595.85 68.1% 7.752 NOTE: THIS DOCUMENT IS BASED SOLELY ON PUBLICLY AVAILABLE INFORMATION. THIS REPORT IS INTENDED AS INFORMATION ONLY AND NOT AS RECOMMENDATION FOR ANY STOCK. J.P. MORGAN EQUITY RESEARCH DOES NOT PROVIDE RESEARCH COVERAGE OR RATING FOR THIS COMPANY. Source: Bloomberg Bloomberg: 435 HK; Reuters: 0435.HK HK$ in millions, year-end Jun Revenue (HK$ mn) EBIT (HK$ mn) Net Income (HK$ mn) Total distribution (HK$ mn) EPU (HK$) DPU (HK$) Revenue Growth (%) Distribution Growth (%) P/B (x) Dividend Yield (%) FY11 532 337 1,655 239 1.05 0.18 9.0% 28.3% 0.75 4.5% FY12 582 369 1,027 272 0.64 0.17 9.2% 13.8% 0.70 4.3% FY13 630 408 1,675 286 1.04 0.18 8.3% 4.9% 0.60 4.5% FY14 689 440 1,230 325 0.76 0.20 9.3% 13.7% 0.56 5.1% Source: Bloomberg Note: Share price and valuations are as of 29 Jan 2015. 71 Asia Pacific Equity Research 31 January 2015 Amy Luk, CFA (852) 2800 8524 [email protected] Table 31: Sunlight REIT's property portfolio Total Valuation at 30 Jun 14 (HK$ mn) 6,490 376,381 3,986.0 3.85 108,506 9,403 117,909 867.2 41,004 10,763 51,767 611.6 Central 37,937 2,177 40,114 Sheung Wan 60,844 3,071 63,915 235 Wing Lok Street Trade Centre Property Sheung Wan 47,481 4,804 Java Road 108 Commercial Centre Property North Point 35,694 2,229 Yue Fai Commercial Centre Property Aberdeen 41,272 On Loong Commercial Building Property Wan Chai 23,856 Everglory Centre Property TST Sun Fai Commercial Centre Property Mong Kok Wai Ching Commercial Building Property Yau Ma Tei Name of Property Avg rent at 30 Jun 14 (HK$ psf) NPI (HK$'000) Occ. rate (%) 3.75 32.1 135,346 98.5 3.85 4.20 24.1 28,617 97.4 3.95 3.60 36.2 20,239 100.0 490.3 3.85 4.00 38.0 16,349 97.2 439.3 3.85 4.20 22.3 14,610 100.0 52,285 269.8 3.85 4.25 16.9 8,994 98.9 37,923 242.2 3.95 4.20 20.5 7,394 100.0 1,479 42,751 236.3 4.10 4.10 18.8 7,631 99.4 1,708 25,564 216.1 3.95 4.00 27.3 7,368 100.0 25,896 3,906 29,802 186.0 3.85 4.15 19.7 6,184 100.0 23,817 2,334 26,151 154.5 4.10 4.35 20.6 5,516 98.1 14,239 2,082 16,321 58.7 3.85 4.20 10.7 1,621 100.0 830,437 50,446 880,883 7,758.0 Location Office Wan Chai 369,891 Bonham Trade Centre Property Sheung Wan Righteous Centre Property Mong Kok Winsome House Property 135 Bonham Strand Trade Centre Property GRA (sf) Retail Cap rate (%) Office Retail Grade A Office 248 Queen’s Road East Property Grade B Office Sub-total 259,869 New Town Retail Sheung Shui Centre Property Sheung Shui 0 122,339 122,339 3,670.8 n/a 4.40 102.9 131,034 97.4 Metro City Phase I Property TKO 0 188,889 188,889 2,678.8 n/a 4.50 44.9 102,373 98.3 Kwong Wah Plaza Property Yuen Long 39,101 25,741 64,842 906.1 3.85 3.80 43.8 28,484 99.3 Royal Terrace Property North Point 0 9,565 9,565 156.5 n/a 4.25 47.6 6,097 100.0 Beverley Commercial Centre Property TST 0 7,934 7,934 125.5 n/a 4.30 51.8 4,436 94.5 Supernova Stand Property North Point 0 4,226 4,226 57.2 n/a 4.00 47.6 1,948 100.0 Palatial Stand Property Hung Hom n/a 4.35 13.2 824 100.0 Urban Retail Sub-total Total 3,566 5,059 8,625 37.7 42,667 363,753 406,420 7,632.6 275,196 873,104 414,199 1,287,303 15,390.6 535,065 Note: Operating data refers to FY14. Source: Company data Figure 76: Property valuation breakdown (as at 30 Jun 2014) Urban Retail 2% Figure 77: FY14 net property income breakdown Urban Retail 3% Grade A Office 26% New Town Retail 47% New Town Retail 49% Grade B Office 23% Grade B Office 25% Source: Company data 72 Grade A Office 25% Source: Company data Asia Pacific Equity Research 31 January 2015 Amy Luk, CFA (852) 2800 8524 [email protected] Sunlight REIT: Summary of Financials Profit and loss statement Cash flow statement HK$ in millions, year-end Jun Revenues % change Y/Y EBIT % change Y/Y EBIT margin (%) Net interest Earnings before tax % change Y/Y Tax as % of EBT Net income (reported) % change Y/Y Total distribution % change Y/Y Shares outstanding EPS (reported) (HK$) % change Y/Y HK$ in millions, year-end Jun FY11 532 9.0% 337 9.9% 63.2% 118 1,685 18.9% 30 1.8% 1,655 19.1% 239 28.3% 1,586 1.05 18.0% FY12 582 9.2% 369 9.6% 63.4% 96 1,070 (36.5%) 43 4.0% 1,027 (37.9%) 272 13.8% 1,606 0.64 (39.0%) FY13 630 8.3% 408 10.6% 64.7% 103 1,726 61.2% 51 3.0% 1,675 63.0% 286 4.9% 1,616 1.04 62.5% FY14 689 9.3% 440 8.0% 63.9% 95 1,290 (25.2%) 60 4.7% 1,230 (26.5%) 325 13.7% 1,628 0.76 (26.9%) FY11 337 0 129 141 270 FY12 369 0 3 6 320 FY13 408 0 21 20 345 FY14 440 0 24 28 383 Cash flow from investing (43) (41) 108 (131) Cash flow from financing (228) (312) (349) (331) 0 (33) 103 (80) (213) (257) (277) (304) 0.1760 0.1700 0.1770 0.2000 EBIT Depreciation & amortisation Change in working capital Taxes Cash flow from operations Net changes in cash Dividends paid DPS (HK$) Source: Company data, Bloomberg Source: Company data, Bloomberg Balance sheet Ratio analysis HK$ in millions, year-end Jun Cash and cash equivalents Accounts receivable Inventories Others Current assets LT investments Net fixed assets Total assets Liabilities ST loans Payables Others Total current liabilities Long-term debt Other liabilities Total liabilities Shareholders’ equity BVPS (HK$) Source: Company data, Bloomberg FY11 0 18 0 438 456 0 12,222 12,888 FY12 1 17 0 427 445 0 13,039 13,692 FY13 329 12 0 174 515 0 14,409 15,156 FY14 345 13 0 161 519 0 15,391 16,152 3,948 32 350 4,329 0 297 4,626 8,262 5.21 0 28 405 433 3,916 321 4,671 9,022 5.62 0 27 423 450 3,875 300 4,625 10,532 6.52 0 36 451 487 3,872 297 4,657 11,495 7.06 %, year-end Jun EBIT margin FY11 63.2% FY12 63.4% FY13 64.7% FY14 63.9% Sales growth Net profit growth EPS growth 9.0% 19.1% 18.0% 9.2% (37.9%) (39.0%) 8.3% 63.0% 62.5% 9.3% (26.5%) (26.9%) Interest coverage (x) Net debt to total capital Net debt to equity Sales/assets Assets/equity ROE ROCE 15.3 32.3% 47.8% 4.1% 1.6 22.1% 14.5% 12.1 30.3% 43.4% 4.2% 1.5 11.9% 8.2% 17.7 24.6% 33.7% 4.2% 1.4 17.1% 12.2% 14.6 23.0% 30.7% 4.3% 1.4 11.2% 8.3% Source: Company data, Bloomberg 73 Asia Pacific Equity Research 31 January 2015 Amy Luk, CFA (852) 2800 8524 [email protected] Not Covered Yuexiu REIT Price: HK$4.09 Date: 29 Jan 2015 www.yuexiureit.com China REITs Company description Yuexiu REIT is 36% owned by Yuexiu Property (123 HK), which is a Guangzhou government-backed property enterprise. Yuexiu REIT has a portfolio of six commercial properties located in Guangzhou, China with a total area of about 680,000 sqm. The portfolio includes a CBD complex Guangzhou IFC in Zhujiang New Town CBD acquired in 2012. Amy LukAC (852) 2800 8524 [email protected] J.P. Morgan Securities (Asia Pacific) Limited Price performance Positives The revenue stream is diversified where office segment contributing to 41% of 1H14 revenue, followed by 27% from hotel and serviced apartment, 24% from wholesale mall and 8% from retail mall. The portfolio recorded stable revenue growth where revenue from Guangzhou IFC acquired in 2012 went up 23.6% in 1H14 vs 1H13 on higher occupancy (88.8% vs 74.1%). Asset enhancement in White Horse Building and Victory Plaza may enhance rental level. 110 100 90 Jan-14 May-14 Sep-14 405 HK Equity Jan-15 HSI Index Negatives Commencing from 31 Dec 2016, a number of deferred units will be issued at HK$4 to sponsor Yuexiu Property (“YXP”) which may dilute DPU of Yuexiu REIT. In addition, after 2016, the income support from YXP for Guangzhou IFC hotel and serviced apartment will expire. Source: Bloomberg Performance 1M 3M 12M Absolute (%) 5.4 7.1 12.1 Relative (%) 0.7 3.2 0.4 Valuation The stock is currently trading at 0.70x FY13 P/B and 6.7% FY13 dividend yield. Source: Bloomberg Company data 52-wk range (HK$) Mkt cap. (HK$ MM) Mkt cap. (US$ MM) Avg daily value (US$MM) Avg. daily volume (MM) Shares O/S (MM) Date of price Index: HSI Free float (%) Exchange rate (HK$/US$) 3.59 - 4.11 11,451 1,477 1.517 2.997 2,800 29-Jan-15 24,595.85 37.0% 7.752 NOTE: THIS DOCUMENT IS BASED SOLELY ON PUBLICLY AVAILABLE INFORMATION. THIS REPORT IS INTENDED AS INFORMATION ONLY AND NOT AS RECOMMENDATION FOR ANY STOCK. J.P. MORGAN EQUITY RESEARCH DOES NOT PROVIDE RESEARCH COVERAGE OR RATING FOR THIS COMPANY. Source: Bloomberg Bloomberg: 405 HK; Reuters: 0405.HK Rmb in millions, year-end Dec Revenue (Rmb mn) EBIT (Rmb mn) Net Income (Rmb mn) Total distribution (Rmb mn) EPU (Rmb) DPU (Rmb) Revenue Growth (%) Distribution Growth (%) P/B (x) Dividend Yield (%) FY10 485 293 636 220 0.60 0.21 3.3% 0.1% 0.93 5.9% FY11 522 308 1,337 231 1.25 0.22 7.8% 5.1% 0.69 6.5% Source: Bloomberg Note: Share price and valuations are as of 29 Jan 2015. 74 FY12 712 364 688 403 0.48 0.22 36.4% 74.3% 0.73 6.5% FY13 1,371 452 524 599 0.19 0.22 92.5% 48.4% 0.70 6.7% Asia Pacific Equity Research 31 January 2015 Amy Luk, CFA (852) 2800 8524 [email protected] Table 32: Yuexiu REIT's property portfolio in Guangzhou Name of Property Type Location Guangzhou IFC Commercial complex Cap rate (%) NPI (Rmb mn) 457,357 Valuation as at 31 Dec 2013 (Rmb mn) 15,715 Yuexiu District n/a 267,804 n/a 4.50-5.00% Retails 46,989 n/a 4.75-5.25% Hotel 91,461 n/a Serviced Apartments 51,102 Grade A Office GFA (sqm) 417.7 Occupancy as at 31 Dec 2013 88.0%* Unit rent as at 31 Dec 2013 (Rmb psm) 203 n/a 85.4% 221 n/a 98.4% 140 n/a n/a n/a n/a n/a 4.50% n/a n/a n/a White Horse Building Wholesale shopping mall Tianhe District 50,199 3,980 7.75-8.25% 268.7 100.0% 554 Fortune Plaza Grade A office Tianhe District 41,355 806 7.00-8.00% 53.9 99.3% 138 City Development Plaza Grade A office Tianhe District 42,397 672 7.50-8.50% 43.9 96.6% 120 Victory Plaza Retail shopping mall Yuexiu District 27,698 804 7.50-8.00% 28.9 92.2% 192 Yue Xiu Neo Metropolis Plaza Commercial complex Tianhe District 61,964 772 6.50-8.00% 47.3 97.6% 100 680,971 22,749 Total 860.4 Note: Operating data refers to FY13. Source: Company data, J.P. Morgan estimates Figure 78: FY13 net property income breakdown Hotel and serviced apartments 6% Retail 11% Office 52% Wholesales 31% Source: Company data 75 Asia Pacific Equity Research 31 January 2015 Amy Luk, CFA (852) 2800 8524 [email protected] Yuexiu REIT: Summary of Financials Profit and loss statement Cash flow statement Rmb in millions, year-end Dec Revenues % change Y/Y EBIT % change Y/Y EBIT margin (%) Net interest Earnings before tax % change Y/Y Tax as % of EBT Net income (reported) % change Y/Y Total distribution % change Y/Y Shares outstanding EPS (reported) (Rmb) % change Y/Y Rmb in millions, year-end Dec FY10 485 3.3% 293 (2.7%) 60.5% 36 650 134.8% 14 2.2% 636 140.1% 220 0.1% 1,066 0.60 143.1% FY11 522 7.8% 308 5.2% 59.0% 37 1,371 111.0% 34 2.5% 1,337 110.4% 231 5.1% 1,066 1.25 108.3% FY12 712 36.4% 364 17.9% 51.1% 145 738 (46.2%) 50 6.8% 688 (48.6%) 403 74.3% 2,743 0.48 (61.6%) FY13 1,371 92.5% 452 24.2% 33.0% 441 673 (8.9%) 149 22.1% 524 (23.8%) 599 48.4% 2,767 0.19 (60.4%) FY10 293 2 11 9 265 FY11 308 1 12 9 278 FY12 364 35 21 7 103 FY13 452 144 49 10 656 Cash flow from investing (5) (187) (4,643) 116 Cash flow from financing (241) 51 4,793 (907) 18 142 253 (134) (241) (223) (275) (563) 0.2070 0.2171 0.2151 0.2164 FY10 60.5% FY11 59.0% FY12 51.1% FY13 33.0% 3.3% 140.1% 143.1% 7.8% 110.4% 108.3% 36.4% (48.6%) (61.6%) 92.5% (23.8%) (60.4%) 19.2 24.3% 35.1% 8.0% 1.5 16.8% 11.4% 38.1 20.6% 28.6% 7.1% 1.4 29.5% 20.8% 6.1 36.2% 60.6% 2.9% 2.0 7.8% 4.9% 2.5 35.0% 56.8% 5.6% 1.9 4.2% 2.5% EBIT Depreciation & amortisation Change in working capital Taxes Cash flow from operations Net changes in cash Dividends paid DPS (Rmb) Source: Company data, Bloomberg Source: Company data, Bloomberg Balance sheet Ratio analysis Rmb in millions, year-end Dec Cash and cash equivalents Accounts receivable Inventories Others Current assets LT investments Net fixed assets Total assets Liabilities ST loans Payables Others Total current liabilities Long-term debt Other liabilities Total liabilities Shareholders’ equity BVPS (Rmb) Source: Company data, Bloomberg 76 FY10 379 0 0 9 388 0 5,433 6,024 FY11 521 0 0 184 705 175 6,471 7,375 FY12 774 11 0 1,353 2,138 125 18,264 24,874 FY13 640 11 0 912 1,563 0 18,605 24,550 1,775 0 110 1,884 0 159 2,043 3,981 3.73 0 0 129 129 1,978 173 2,280 5,095 4.78 300 9 1,553 1,862 8,058 2,348 12,267 12,524 4.57 300 13 1,420 1,733 7,542 2,522 11,797 12,669 4.58 %, year-end Dec EBIT margin Sales growth Net profit growth EPS growth Interest coverage (x) Net debt to total capital Net debt to equity Sales/assets Assets/equity ROE ROCE Source: Company data, Bloomberg Asia Pacific Equity Research 31 January 2015 Amy Luk, CFA (852) 2800 8524 [email protected] Analyst Certification: The research analyst(s) denoted by an “AC” on the cover of this report certifies (or, where multiple research analysts are primarily responsible for this report, the research analyst denoted by an “AC” on the cover or within the document individually certifies, with respect to each security or issuer that the research analyst covers in this research) that: (1) all of the views expressed in this report accurately reflect his or her personal views about any and all of the subject securities or issuers; and (2) no part of any of the research analyst's compensation was, is, or will be directly or indirectly related to the specific recommendations or views expressed by the research analyst(s) in this report. For all Korea-based research analysts listed on the front cover, they also certify, as per KOFIA requirements, that their analysis was made in good faith and that the views reflect their own opinion, without undue influence or intervention. Important Disclosures Lead or Co-manager: J.P. Morgan acted as lead or co-manager in a public offering of equity and/or debt securities for Jinmao Investments within the past 12 months. Client: J.P. Morgan currently has, or had within the past 12 months, the following company(ies) as clients: Jinmao Investments, Link REIT, Regal REIT, Yuexiu Real Estate Investment Trust. Client/Investment Banking: J.P. Morgan currently has, or had within the past 12 months, the following company(ies) as investment banking clients: Jinmao Investments. Client/Non-Securities-Related: J.P. Morgan currently has, or had within the past 12 months, the following company(ies) as clients, and the services provided were non-securities-related: Jinmao Investments. Investment Banking (past 12 months): J.P. Morgan received in the past 12 months compensation from investment banking Jinmao Investments. Investment Banking (next 3 months): J.P. Morgan expects to receive, or intends to seek, compensation for investment banking services in the next three months from Jinmao Investments. Company-Specific Disclosures: Important disclosures, including price charts and credit opinion history tables, are available for compendium reports and all J.P. Morgan–covered companies by visiting https://jpmm.com/research/disclosures, calling 1-800-477-0406, or e-mailing [email protected] with your request. J.P. Morgan’s Strategy, Technical, and Quantitative Research teams may screen companies not covered by J.P. Morgan. For important disclosures for these companies, please call 1-800-4770406 or e-mail [email protected]. Date Champion REIT (2778.HK, 2778 HK) Price Chart 8 26-Nov-08 UW N HK$4.3 UW HK$0.99 N HK$2.83 N HK$3.18N HK$4.1 N HK$3 N HK$3.5 N HK$3.5 6 UW HK$0.85 UW HK$2.85 N HK$3.29 N HK$3.74 N HK$4 N HK$3.35 N HK$3.25 N HK$3.8 N HK$3.7 UW HK$3.1 N HK$3.4 5 Price(HK$) 4 3 2 1 0 Apr 08 Oct 09 Apr 11 Source: Bloomberg and J.P. Morgan; price data adjusted for stock splits and dividends. Initiated coverage Nov 26, 2008. Oct 12 Apr 14 Price Target (HK$) 1.56 0.85 UW 1.90 0.99 07-Aug-09 UW 3.02 2.85 18-Aug-09 N 2.84 2.83 01-Dec-09 N 3.18 3.29 22-Feb-10 N 3.37 3.18 17-Aug-10 N 3.86 3.74 21-Nov-10 N 4.50 4.10 22-Feb-11 N 4.62 4.30 12-Aug-11 N 3.89 4.00 07-Oct-11 N 2.78 3.00 21-Feb-12 N 3.44 3.35 21-Aug-12 N 3.26 3.25 17-Jan-13 N 4.05 3.80 22-Jul-13 N 3.45 3.70 26-Nov-13 UW 3.49 3.10 25-Feb-14 N 3.37 3.50 14-Jul-14 N 3.64 3.40 12-Aug-14 N 3.58 3.50 30-Oct-14 3.38 3.95 OW HK$3.95 16-Feb-09 7 Oct 06 Rating Share Price (HK$) OW 77 Asia Pacific Equity Research 31 January 2015 Amy Luk, CFA (852) 2800 8524 [email protected] Date Fortune Real Estate Investment Trust (FORT.SI, FRT SP) Price Chart 18 OW HK$4.9 N HK$6.7 OW HK$4 OW HK$3.6 OW HK$4.3 OW HK$5.7 OW HK$6.9 OW HK$8.2 OW HK$7.9 OW HK$8.3 12 OW HK$6.7 Price(HK$) OW HK$2.7 OW HK$3.4 OW HK$4 OW HK$4.9 OW HK$5 OW HK$4.88 OW HK$5 OW HK$6.4 OW HK$8.1 OW HK$8 OW HK$8.4 6 0 Oct 06 Apr 08 Oct 09 Apr 11 Oct 12 Apr 14 Source: Bloomberg and J.P. Morgan; price data adjusted for stock splits and dividends. Initiated coverage May 09, 2007. Price Target (HK$) 09-May-07 OW 4.70 6.70 01-Aug-07 N 5.06 6.70 29-Jan-09 OW 1.96 2.70 07-May-09 OW 2.52 4.00 OW 3.30 4.90 25-Aug-09 OW 3.09 3.40 04-Nov-09 OW 2.75 3.60 05-May-10 OW 3.59 4.00 09-Nov-10 OW 4.08 4.90 24-Jul-11 OW 4.00 5.00 07-Oct-11 OW 3.29 4.30 13-Nov-11 OW 3.65 4.45 31-Jan-12 OW 3.89 4.88 10-May-12 OW 4.17 5.00 20-Jul-12 OW 4.90 5.70 31-Oct-12 OW 6.12 6.40 25-Jan-13 OW 6.60 6.90 09-May-13 OW 7.83 8.10 22-Jul-13 OW 7.22 8.20 11-Nov-13 OW 6.35 8.00 26-Jan-14 OW 5.88 7.90 24-Jul-14 OW 7.23 8.40 30-Oct-14 OW 7.07 8.30 08-Dec-14 OW 7.44 8.60 OW HK$8.6 29-Jul-09 OW HK$4.45 Rating Share Price (HK$) Jinmao Investments (6139.HK, 6139 HK) Price Chart N HK$6.1 5 Price(HK$) Date Rating Share Price (HK$) 25-Aug-14 N 0 Jun 14 Jun 14 Jul 14 Aug 14 Sep 14 Oct 14 Source: Bloomberg and J.P. Morgan; price data adjusted for stock splits and dividends. Initiated coverage Aug 25, 2014. 78 Nov 14 Dec 14 Jan 15 5.75 Price Target (HK$) 6.10 Asia Pacific Equity Research 31 January 2015 Amy Luk, CFA (852) 2800 8524 [email protected] Link REIT (0823.HK, 823 HK) Price Chart OW HK$19.3 85 OW HK$43 N HK$18.6 N HK$29 OW HK$38.5 OW HK$44.2 68 Price(HK$) Rating Share Price Price Target (HK$) (HK$) 11-Jun-07 OW 17.70 20.00 10-Jun-08 OW 19.40 21.50 13-Nov-08 OW 13.88 15.70 18-Jun-09 N 17.40 18.50 18-Aug-09 N 17.28 18.60 24-Sep-09 OW 16.42 19.30 OW HK$20OW HK$21.5 OW HK$15.7 N HK$18.5 OW HK$21 OW HK$20.9 N HK$27 N HK$27.9 N HK$26 N HK$32.3 OW HK$45 OW HK$44.8 OW HK$48 N HK$47.5 20-Nov-09 OW 17.56 21.00 03-Jun-10 OW 19.08 20.90 11-Nov-10 N 24.95 27.00 02-Jun-11 N 26.45 27.90 07-Oct-11 N 24.40 26.00 10-Nov-11 N 27.30 29.00 07-Jun-12 30.85 32.30 28-Aug-12 OW 33.95 38.50 08-Nov-12 OW 39.60 43.00 06-Jun-13 OW 39.60 45.00 22-Jul-13 OW 37.60 44.20 13-Nov-13 OW 38.65 44.80 05-Jun-14 OW 42.35 48.00 30-Oct-14 N 46.35 47.50 51 34 17 0 Oct 06 Date Apr 08 Oct 09 Apr 11 Oct 12 Apr 14 Source: Bloomberg and J.P. Morgan; price data adjusted for stock splits and dividends. Initiated coverage Jun 11, 2007. N The chart(s) show J.P. Morgan's continuing coverage of the stocks; the current analysts may or may not have covered it over the entire period. J.P. Morgan ratings or designations: OW = Overweight, N= Neutral, UW = Underweight, NR = Not Rated Explanation of Equity Research Ratings, Designations and Analyst(s) Coverage Universe: J.P. Morgan uses the following rating system: Overweight [Over the next six to twelve months, we expect this stock will outperform the average total return of the stocks in the analyst’s (or the analyst’s team’s) coverage universe.] Neutral [Over the next six to twelve months, we expect this stock will perform in line with the average total return of the stocks in the analyst’s (or the analyst’s team’s) coverage universe.] Underweight [Over the next six to twelve months, we expect this stock will underperform the average total return of the stocks in the analyst’s (or the analyst’s team’s) coverage universe.] Not Rated (NR): J.P. Morgan has removed the rating and, if applicable, the price target, for this stock because of either a lack of a sufficient fundamental basis or for legal, regulatory or policy reasons. The previous rating and, if applicable, the price target, no longer should be relied upon. An NR designation is not a recommendation or a rating. In our Asia (ex-Australia) and U.K. small- and mid-cap equity research, each stock’s expected total return is compared to the expected total return of a benchmark country market index, not to those analysts’ coverage universe. If it does not appear in the Important Disclosures section of this report, the certifying analyst’s coverage universe can be found on J.P. Morgan’s research website, www.jpmorganmarkets.com. Coverage Universe: Luk, Amy Ka Ping: Champion REIT (2778.HK), Fortune Real Estate Investment Trust (FORT.SI), Great Eagle (0041.HK), Hang Lung Group (0010.HK), Hang Lung Properties (0101.HK), Hongkong Land (HKLD.SI), Hysan Development Co (0014.HK), Jinmao Investments (6139.HK), Link REIT (0823.HK), New World Development (0017.HK), Swire Properties (1972.HK), The Wharf (Holdings) Limited (0004.HK) J.P. Morgan Equity Research Ratings Distribution, as of January 1, 2015 J.P. Morgan Global Equity Research Coverage IB clients* JPMS Equity Research Coverage IB clients* Overweight (buy) 45% 56% 45% 75% Neutral (hold) 43% 49% 48% 67% Underweight (sell) 12% 33% 7% 52% *Percentage of investment banking clients in each rating category. For purposes only of FINRA/NYSE ratings distribution rules, our Overweight rating falls into a buy rating category; our Neutral rating falls into a hold rating category; and our Underweight rating falls into a sell rating category. Please note that stocks with an NR designation are not included in the table above. 79 Amy Luk, CFA (852) 2800 8524 [email protected] Asia Pacific Equity Research 31 January 2015 Equity Valuation and Risks: For valuation methodology and risks associated with covered companies or price targets for covered companies, please see the most recent company-specific research report at http://www.jpmorganmarkets.com, contact the primary analyst or your J.P. Morgan representative, or email [email protected]. Equity Analysts' Compensation: The equity research analysts responsible for the preparation of this report receive compensation based upon various factors, including the quality and accuracy of research, client feedback, competitive factors, and overall firm revenues. Registration of non-US Analysts: Unless otherwise noted, the non-US analysts listed on the front of this report are employees of non-US affiliates of JPMS, are not registered/qualified as research analysts under NASD/NYSE rules, may not be associated persons of JPMS, and may not be subject to FINRA Rule 2711 and NYSE Rule 472 restrictions on communications with covered companies, public appearances, and trading securities held by a research analyst account. Other Disclosures J.P. Morgan ("JPM") is the global brand name for J.P. Morgan Securities LLC ("JPMS") and its affiliates worldwide. J.P. Morgan Cazenove is a marketing name for the U.K. investment banking businesses and EMEA cash equities and equity research businesses of JPMorgan Chase & Co. and its subsidiaries. All research reports made available to clients are simultaneously available on our client website, J.P. Morgan Markets. Not all research content is redistributed, e-mailed or made available to third-party aggregators. For all research reports available on a particular stock, please contact your sales representative. Options related research: If the information contained herein regards options related research, such information is available only to persons who have received the proper option risk disclosure documents. For a copy of the Option Clearing Corporation's Characteristics and Risks of Standardized Options, please contact your J.P. Morgan Representative or visit the OCC's website at http://www.optionsclearing.com/publications/risks/riskstoc.pdf Legal Entities Disclosures U.S.: JPMS is a member of NYSE, FINRA, SIPC and the NFA. JPMorgan Chase Bank, N.A. is a member of FDIC. U.K.: JPMorgan Chase N.A., London Branch, is authorised by the Prudential Regulation Authority and is subject to regulation by the Financial Conduct Authority and to limited regulation by the Prudential Regulation Authority. Details about the extent of our regulation by the Prudential Regulation Authority are available from J.P. Morgan on request. J.P. Morgan Securities plc (JPMS plc) is a member of the London Stock Exchange and is authorised by the Prudential Regulation Authority and regulated by the Financial Conduct Authority and the Prudential Regulation Authority. Registered in England & Wales No. 2711006. Registered Office 25 Bank Street, London, E14 5JP. South Africa: J.P. Morgan Equities South Africa Proprietary Limited is a member of the Johannesburg Securities Exchange and is regulated by the Financial Services Board. Hong Kong: J.P. Morgan Securities (Asia Pacific) Limited (CE number AAJ321) is regulated by the Hong Kong Monetary Authority and the Securities and Futures Commission in Hong Kong and/or J.P. Morgan Broking (Hong Kong) Limited (CE number AAB027) is regulated by the Securities and Futures Commission in Hong Kong. Korea: J.P. Morgan Securities (Far East) Ltd, Seoul Branch, is regulated by the Korea Financial Supervisory Service. Australia: J.P. Morgan Australia Limited (JPMAL) (ABN 52 002 888 011/AFS Licence No: 238188) is regulated by ASIC and J.P. Morgan Securities Australia Limited (JPMSAL) (ABN 61 003 245 234/AFS Licence No: 238066) is regulated by ASIC and is a Market, Clearing and Settlement Participant of ASX Limited and CHI-X. Taiwan: J.P.Morgan Securities (Taiwan) Limited is a participant of the Taiwan Stock Exchange (company-type) and regulated by the Taiwan Securities and Futures Bureau. India: J.P. Morgan India Private Limited (Corporate Identity Number - U67120MH1992FTC068724), having its registered office at J.P. Morgan Tower, Off. C.S.T. Road, Kalina, Santacruz - East, Mumbai – 400098, is a member of the National Stock Exchange of India Limited (SEBI Registration Number - INB 230675231/INF 230675231/INE 230675231) and Bombay Stock Exchange Limited (SEBI Registration Number - INB 010675237/INF 010675237) and is regulated by Securities and Exchange Board of India. Telephone: 91-22-6157 3000, Facsimile: 91-22-6157 3990 and Website: www.jpmipl.com. For non local research reports, this material is not distributed in India by J.P. Morgan India Private Limited. Thailand: This material is issued and distributed in Thailand by JPMorgan Securities (Thailand) Ltd., which is a member of the Stock Exchange of Thailand and is regulated by the Ministry of Finance and the Securities and Exchange Commission and its registered address is 3rd Floor, 20 North Sathorn Road, Silom, Bangrak, Bangkok 10500. Indonesia: PT J.P. Morgan Securities Indonesia is a member of the Indonesia Stock Exchange and is regulated by the OJK a.k.a. BAPEPAM LK. Philippines: J.P. Morgan Securities Philippines Inc. is a Trading Participant of the Philippine Stock Exchange and a member of the Securities Clearing Corporation of the Philippines and the Securities Investor Protection Fund. It is regulated by the Securities and Exchange Commission. Brazil: Banco J.P. Morgan S.A. is regulated by the Comissao de Valores Mobiliarios (CVM) and by the Central Bank of Brazil. Mexico: J.P. Morgan Casa de Bolsa, S.A. de C.V., J.P. Morgan Grupo Financiero is a member of the Mexican Stock Exchange and authorized to act as a broker dealer by the National Banking and Securities Exchange Commission. Singapore: This material is issued and distributed in Singapore by or through J.P. Morgan Securities Singapore Private Limited (JPMSS) [MCI (P) 199/03/2014 and Co. Reg. No.: 199405335R] which is a member of the Singapore Exchange Securities Trading Limited and is regulated by the Monetary Authority of Singapore (MAS) and/or JPMorgan Chase Bank, N.A., Singapore branch (JPMCB Singapore) which is regulated by the MAS. This material is provided in Singapore only to accredited investors, expert investors and institutional investors, as defined in Section 4A of the Securities and Futures Act, Cap. 289. Recipients of this document are to contact JPMSS or JPMCB Singapore in respect of any matters arising from, or in connection with, the document. Japan: JPMorgan Securities Japan Co., Ltd. is regulated by the Financial Services Agency in Japan. Malaysia: This material is issued and distributed in Malaysia by JPMorgan Securities (Malaysia) Sdn Bhd (18146-X) which is a Participating Organization of Bursa Malaysia Berhad and a holder of Capital Markets Services License issued by the Securities Commission in Malaysia. Pakistan: J. P. Morgan Pakistan Broking (Pvt.) Ltd is a member of the Karachi Stock Exchange and regulated by the Securities and Exchange Commission of Pakistan. Saudi Arabia: J.P. Morgan Saudi Arabia Ltd. is authorized by the Capital Market Authority of the Kingdom of Saudi Arabia (CMA) to carry out dealing as an agent, arranging, advising and custody, with respect to securities business under licence number 35-07079 and its registered address is at 8th Floor, Al-Faisaliyah Tower, King Fahad Road, P.O. Box 51907, Riyadh 11553, Kingdom of Saudi Arabia. Dubai: JPMorgan Chase Bank, N.A., Dubai Branch is regulated by the Dubai Financial Services Authority (DFSA) and its registered address is Dubai International Financial Centre - Building 3, Level 7, PO Box 506551, Dubai, UAE. Country and Region Specific Disclosures U.K. and European Economic Area (EEA): Unless specified to the contrary, issued and approved for distribution in the U.K. and the EEA by JPMS plc. Investment research issued by JPMS plc has been prepared in accordance with JPMS plc's policies for managing conflicts of interest arising as a result of 80 Amy Luk, CFA (852) 2800 8524 [email protected] Asia Pacific Equity Research 31 January 2015 publication and distribution of investment research. Many European regulators require a firm to establish, implement and maintain such a policy. This report has been issued in the U.K. only to persons of a kind described in Article 19 (5), 38, 47 and 49 of the Financial Services and Markets Act 2000 (Financial Promotion) Order 2005 (all such persons being referred to as "relevant persons"). This document must not be acted on or relied on by persons who are not relevant persons. Any investment or investment activity to which this document relates is only available to relevant persons and will be engaged in only with relevant persons. In other EEA countries, the report has been issued to persons regarded as professional investors (or equivalent) in their home jurisdiction. Australia: This material is issued and distributed by JPMSAL in Australia to "wholesale clients" only. This material does not take into account the specific investment objectives, financial situation or particular needs of the recipient. The recipient of this material must not distribute it to any third party or outside Australia without the prior written consent of JPMSAL. For the purposes of this paragraph the term "wholesale client" has the meaning given in section 761G of the Corporations Act 2001. Germany: This material is distributed in Germany by J.P. Morgan Securities plc, Frankfurt Branch and J.P.Morgan Chase Bank, N.A., Frankfurt Branch which are regulated by the Bundesanstalt für Finanzdienstleistungsaufsicht. Hong Kong: The 1% ownership disclosure as of the previous month end satisfies the requirements under Paragraph 16.5(a) of the Hong Kong Code of Conduct for Persons Licensed by or Registered with the Securities and Futures Commission. (For research published within the first ten days of the month, the disclosure may be based on the month end data from two months prior.) J.P. Morgan Broking (Hong Kong) Limited is the liquidity provider/market maker for derivative warrants, callable bull bear contracts and stock options listed on the Stock Exchange of Hong Kong Limited. An updated list can be found on HKEx website: http://www.hkex.com.hk. Japan: There is a risk that a loss may occur due to a change in the price of the shares in the case of share trading, and that a loss may occur due to the exchange rate in the case of foreign share trading. In the case of share trading, JPMorgan Securities Japan Co., Ltd., will be receiving a brokerage fee and consumption tax (shouhizei) calculated by multiplying the executed price by the commission rate which was individually agreed between JPMorgan Securities Japan Co., Ltd., and the customer in advance. Financial Instruments Firms: JPMorgan Securities Japan Co., Ltd., Kanto Local Finance Bureau (kinsho) No. 82 Participating Association / Japan Securities Dealers Association, The Financial Futures Association of Japan, Type II Financial Instruments Firms Association and Japan Investment Advisers Association. Korea: This report may have been edited or contributed to from time to time by affiliates of J.P. Morgan Securities (Far East) Ltd, Seoul Branch. Singapore: JPMSS and/or its affiliates may have a holding in any of the securities discussed in this report; for securities where the holding is 1% or greater, the specific holding is disclosed in the Important Disclosures section above. Taiwan: This material is issued and distributed in Taiwan by J.P. Morgan Securities (Taiwan Limited). India: For private circulation only, not for sale. Pakistan: For private circulation only, not for sale. New Zealand: This material is issued and distributed by JPMSAL in New Zealand only to persons whose principal business is the investment of money or who, in the course of and for the purposes of their business, habitually invest money. JPMSAL does not issue or distribute this material to members of "the public" as determined in accordance with section 3 of the Securities Act 1978. The recipient of this material must not distribute it to any third party or outside New Zealand without the prior written consent of JPMSAL. Canada: The information contained herein is not, and under no circumstances is to be construed as, a prospectus, an advertisement, a public offering, an offer to sell securities described herein, or solicitation of an offer to buy securities described herein, in Canada or any province or territory thereof. Any offer or sale of the securities described herein in Canada will be made only under an exemption from the requirements to file a prospectus with the relevant Canadian securities regulators and only by a dealer properly registered under applicable securities laws or, alternatively, pursuant to an exemption from the dealer registration requirement in the relevant province or territory of Canada in which such offer or sale is made. The information contained herein is under no circumstances to be construed as investment advice in any province or territory of Canada and is not tailored to the needs of the recipient. To the extent that the information contained herein references securities of an issuer incorporated, formed or created under the laws of Canada or a province or territory of Canada, any trades in such securities must be conducted through a dealer registered in Canada. No securities commission or similar regulatory authority in Canada has reviewed or in any way passed judgment upon these materials, the information contained herein or the merits of the securities described herein, and any representation to the contrary is an offence. Dubai: This report has been issued to persons regarded as professional clients as defined under the DFSA rules. Brazil: Ombudsman J.P. Morgan: 0800-7700847 / [email protected]. General: Additional information is available upon request. Information has been obtained from sources believed to be reliable but JPMorgan Chase & Co. or its affiliates and/or subsidiaries (collectively J.P. Morgan) do not warrant its completeness or accuracy except with respect to any disclosures relative to JPMS and/or its affiliates and the analyst's involvement with the issuer that is the subject of the research. All pricing is as of the close of market for the securities discussed, unless otherwise stated. Opinions and estimates constitute our judgment as of the date of this material and are subject to change without notice. Past performance is not indicative of future results. This material is not intended as an offer or solicitation for the purchase or sale of any financial instrument. The opinions and recommendations herein do not take into account individual client circumstances, objectives, or needs and are not intended as recommendations of particular securities, financial instruments or strategies to particular clients. The recipient of this report must make its own independent decisions regarding any securities or financial instruments mentioned herein. JPMS distributes in the U.S. research published by non-U.S. affiliates and accepts responsibility for its contents. Periodic updates may be provided on companies/industries based on company specific developments or announcements, market conditions or any other publicly available information. Clients should contact analysts and execute transactions through a J.P. Morgan subsidiary or affiliate in their home jurisdiction unless governing law permits otherwise. "Other Disclosures" last revised November 29, 2014. Copyright 2015 JPMorgan Chase & Co. All rights reserved. This report or any portion hereof may not be reprinted, sold or redistributed without the written consent of J.P. Morgan. #$J&098$#*P 81

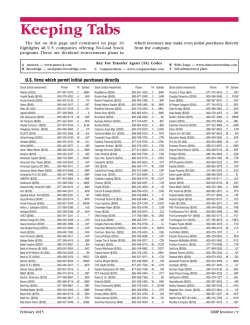
© Copyright 2024