
Download (374kB) - Munich Personal RePEc Archive
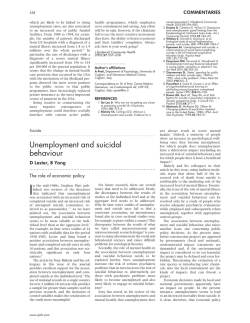
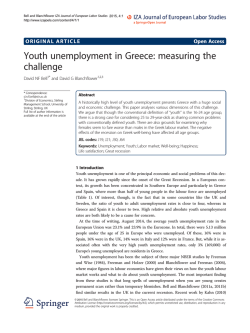
M PRA Munich Personal RePEc Archive Unemployment and Labor Force Participation in Turkey Aysit Tansel and Zeynel / A. Ozdemir and Emre Aksoy Middle East Technical University, Institute for Study of Labor (IZA), Economic Research Forum, Gazi University, Economic Research Forum, Kirikkale University 25. January 2015 Online at http://mpra.ub.uni-muenchen.de/61680/ MPRA Paper No. 61680, posted 30. January 2015 01:29 UTC Unemployment and Labor Force Participation in Turkey Aysit Tansel Department of Economics, Middle East Technical University, 06531, Ankara, Turkey. Institute for Study of Labor (IZA), Bonn, Germany Economic Research Form, Cairo, Egypt e-mail: [email protected], Phone: +(90) 312 210 20 73, Fax: +(90) 312 210 79 64 and Zeynel Abidin Ozdemir Department of Economics, Gazi University, Besevler, 06500, Ankara, Turkey Economic Research Form, Cairo, Egypt e-mail: [email protected], Phone: +(90) 312 212 11 15, Fax: +(90) 312 213 20 36 and Emre Aksoy Department of Economics, Kirikkale University, Kirikkale, Turkey e-mail: [email protected], Phone: +90 318 357 42 42, Fax: +90 318 357 38 00 January 25, 2015 Abstract: This paper investigates the relationship between labor force participation rate and unemployment rate in Turkey a developing country. Cointegration analysis is carried out for the aggregate and gender and age specific series. The findings indicate that there is no long-run relationship between labor force participation and unemployment rates in Turkey. Thus, unlike in the case of the developed countries the unemployment invariance hypothesis is supported in Turkey. Keywords: Unemployment Invariance Hypothesis, Cointegration, Turkey JEL Codes: E24 Corresponding author. 1 I. Introduction This paper investigates the long-run relationship between unemployment and labor force participation in Turkey which is a developing country. The nature of the relationship between unemployment and labor force participation is an important issue. It has wide implications for macroeconomic theory, modelling in applications and labor market policy. There are several examples on the importance of this association. For instance, labor force participation may change over time over the business cycle due to discouraged worker effect. As a result the informational value of the unemployment rate as an indicator of labor market conditions may not be reliable. Several authors refer to this example such as Murphy and Topel (1997), Gustavsson and Österholm (2006) and Ozdemir et al. (2013). A second example often cited is unemployment invariance hypothesis. The unemployment invariance hypothesis suggests that the long-run unemployment rate is independent of the labor force, capital stock and total factor productivity. This hypothesis is supported in the works of authors such as Layard et al. (1991) and Kögel (2005) while Karanassou and Snower (2004) criticized this hypothesis. Therefore it is also important from this point of view to provide evidence on whether or not there is a long-run relationship between unemployment and labor force participation rates. Recently, Österholm (2010) in Sweden and Emerson (2011) in United States investigate whether or not there is a long-run relationship between participation and unemployment rates. They both find a robust long-run relationship between them. These results do not support the unemployment invariance hypothesis in Sweden and in the United States. Further their results imply discouraged worker effects in Sweden and only for the male sample in the United States. Our findings show that there is no long-run relationship between labor force participation and unemployment rates in Turkey. Thus, unlike in the case of Sweden and the United States the unemployment invariance hypothesis is supported in Turkey. This result may be due to differences in the labor market institutions in these countries. The rest of the paper is organized as follows. The next section describes data used. The third section presents the empirical results. The final section concludes. 2 2. Data We use quarterly data on labor force participation rates and unemployment rates for Turkey by gender and for two age groups: 15 and over and 15-24. The data are taken from State Institute of Statistics for the period before 2005 and from TURKSTAT sources for the period 2005 and after. These data are based on the Household Labor Force Survey results. These surveys are conducted once in 1988, semiannually during 1989-1999 (April and October), quarterly during 2000-2004 and monthly since 2005. We first convert the semi-annual data of the 1988-1999 period into quarterly data using an interpolation method. It is called Chow-Lin technique based on the GDP series. The GDP series use the production of the national income accounting interpolation. We next check for seasonality and perform seasonal adjustment of the labor force participation rates and unemployment series using the TRAMO/SEATS procedure (Gomez and Maravall 1996). Thus, our analysis is based on quarterly data for the period from 1988:Q3 to 2013:Q4 including over 100 observations. The data are shown in Figure 1 and 2 for the age 15+ and 15-24 groups respectively. ≠ Figure 1 insert here ≠ ≠ Figure 2 insert here ≠ Turkish labor market is characterized by low and declining labor force participation rates and high unemployment rates. Labor force participation rate of women is in particular low by international standards. In Figure 1 for the 15+ age group we note the downward trend in the aggregate, female and male labor force participation rates with a recent increasing trend in the aggregate and the female series and a stagnation in the male series. The aggregate, female and male unemployment series reach a higher plateau after the 2001 crisis and exhibits a peak in 2009 during the global crisis. In Figure 2 for the 15-24 age group the trends in the labor force participation rate and the unemployment rate are all similar to those for the 15+ age group in Figure 1. Comparing the two figures we note that the labor force participation is higher for the 15+ age group than for the 15-24 age group due to the school participation of the latter group. In contrast the unemployment rate for the young (15-24 age group) is much higher than for the 15+ age group as it is the case in many countries. 3 3. Empirical Analysis We first examine the time series properties of the labor force participation rates and unemployment rates using Augmented Dickey-Fuller (ADF) unit root test of Dickey and Fuller (1979) and Said and Dickey (1984) as well as the KPSS test of Kwiatkowski, Phillips, Schmidt and Shin (1992). The ADF test has nonstationarity under the null hypothesis whereas KPSS test assumes stationarity under the null hypothesis. The test results are reported in Table 1 for both the levels and the first differences of the series. ADF tests indicate that the null hypothesis of nonstationarity cannot be rejected for all of the series but rejected for all of the series in first differences at 5 % level of significance or better. KPSS tests indicate that the null hypothesis of stationarity is rejected for all of the series in levels but not rejected for all of the series in first differences at 5% level of significance or better. ≠ Table 1 insert here ≠ After establishing that all of the series considered are unit root processes and integrated of order one, we can now test if there is a long run relationship between labor force participation and unemployment rates in a cointegration framework. The finding of cointegration between labor force participation and unemployment rates implies that there is a long run relationship between them. We begin by considering a Vector Error Correction (VEC) model of the participation rates and unemployment rates. We emphasize that a VEC model is cointegrated VAR model that has the cointegrating relationship(s) specified in the model. This specification allows the endogenous variables to converge to the long-run equilibrium as well as considering short-run adjustment dynamics to be included in the analysis. We avoid presenting a cointegrated VAR model equation since there is a standard representation the literature (see for example Österholm, 2010). In the standard notation α represents the adjustment parameters in the VEC model and β is the cointegrating vector. Cointegration is tested by employing Johansen’s methodology (1988, 1991) which includes two complementary tests: the trace and maximum eigenvalue tests. These test results are reported in Table 2. ≠ Table 2 insert here ≠ The trace test results indicate that the null hypothesis of no cointegration is rejected and there is one and only one cointegrated vector in all the cases considered. However, the maximum 4 eigen value test results indicate cointegration only in the aggregate series for age 15+ and in the aggregate and male series for age 15-24. A recent study by Hjalmarsson and Österholm (2010) suggest that the two cointegration tests must be in agreement for a robust conclusion on cointegation. Therefore, we can conclude that there is cointegration for the aggregate series in the age 15+ sample and for both the aggregate and the male series in the age 15-24 sample. These results indicate that there is a long–run relationship between aggregate labor force participation and unemployment rates in the age 15+ sample and in the age 15-24 sample as well as in the male, age 15-24 sample. Hjalmarsson and Österholm (2010) further caution that Johansen’s trace and maximum eigen value tests have size distortions in the cases where the series have near unit roots. Thus they suggest further testing of the two restrictions on the cointegrating vector β such that β = (1 0)′ and β = (0 1)′. If these restrictions are rejected then cointegration is supported. If both of them or either of them cannot be rejected then cointegration is not supported and it may be due to a single stationary variable. In our case, it is possible that the labor force participation and unemployment rates series may not have exact unit roots and the results of trace and maximum eigen values tests may be misleading. In order to allow for this possibility we further test for the above restrictions. The results are reported in Table 3. ≠ Table 3 insert here ≠ In this table we review only the three cases where we found cointegration both by the trace and maximum eigen value tests above. Considering the aggregate series in the age 15+ sample we observe that the former restriction is rejected while the latter is not. This indicates that there is no cointegration between aggregate labor force participation and unemployment rates in the age 15+ sample but it is due to a single stationary variable that is the labor force participation rate in this case. Similar results are obtained in the case of the aggregate series in the age 15-24 sample. Therefore, there is no cointegration between aggregate labor force participation and unemployment rates in the age 15-24 sample also. Finally in the case of the male series in the age15-24 sample the results indicate that the former restriction is rejected while the latter is not. These imply that there is no cointegration between male labor force participation and unemployment rates in the age 15-24 sample but it is due to a single stationary variable that is the unemployment rate in this case. 5 4. Conclusions This paper provides evidence that there is no long-run equilibrium relationship between labor force participation and unemployment rates in Turkey which is a developing country. These results are robust and continue to hold when using gender specific data and data for two age groups. This result is in contrast to the findings of Österholm (2010) for Sweden and the findings of Emerson (2011) for the United States both of which are developed countries. Thus while the evidence does not support the unemployment invariance hypothesis in both Sweden and the United States our findings support the unemployment invariance hypothesis in Turkey. This may be due to differences in the labor market institutions in these countries. More clearly, the long-run unemployment rate is independent of the labor force in Turkey. One of the implications of this result is that policies that increase the labor force participation such as recent social security tax reductions and active labor market policies (which are put into effect in particular to increase the labor force participation and employment of women and the young men in Turkey) will have negligible influence on unemployment rates. Turkey also introduced a number of institutional changes that affected the labor force participation rates during the period under study such as introduction of the early retirement scheme in the early 1990s and its abolition in the first half of 2000 which may not have influenced the unemployment rates. These findings should be useful to applied researchers and policy makers. They contribute to our understanding of the how labor market functions in Turkey and the long-run potentials of labor market policy in Turkey. References Dickey, D.A. and Fuller, W.A. (1979) Distribution of the estimators for autoregressive time series with a unit root, Journal of the American Statistical Association, 74, 427–431. Emerson, J. (2011) Unemployment and labor force participation in the United States, Economics Letters, 111, 203–206. Gustavsson, M. and Österholm, P. (2006) The informational value of unemployment statistics: a note on the time series properties of participation rates. Economics Letters 92, 428–433. Gomez, Z., and Maravall, A. (1996) Program tramo and seats: instructions for the users. Working Paper 9628, Bank of Spain. Hjalmarsson, E. and Österholm, P. (2010), “Testing for cointegration using the Johansen methodology when variables are near-integrated: Size distortions and partial remedies”, Empirical Economcis, 39, 51–76. Johansen, S. (1988) Statistical analysis of cointegration vectors, Journal of Economic Dynamics and Control, 12, 231–254. Johansen, S. (1991) Estimation and hypothesis testing of cointegration vectors in Gaussian vector autoregression models, Econometrica, 59, 1551–1580. Karanassou, M. and Snower, D. J. (2004) Unemployment invariance, German Economic Review, 5, 297–317. 6 Kögel, T. (2005) Trendless unemployment in a model with endogenous technical progress, Economic Research Paper, no.05-05, Loughborough University, Leicestershire, UK. Kwiatkowski, D., Phillips, P. C. B, Schmidt, P. and Shin, Y. (1992) Testing the null hypothesis of stationarity against the alternative of a unit root, Journal of Econometrics, 54, 159–178. Layard, R., Nickell, S. J. and Jackman, R. (1991) Unemployment: Macroeconomic Performance and the Labour Market, Oxford University Press, Oxford. Murphy, K.M., and Topel, R., (1997) Unemployment and nonemployment. The American Economic Review 87, 295–300. Osterwald-Lenum, M. (1992) Practioners corner a note with quartiles of the asymptotic distribution of the maximum likelihood cointegration rank test statistics, Oxford Bulletin of Economics and Statistics, 54, 461–472. Österholm, P. (2010) Unemployment and labour-force participation in Sweden. Economics Letters, 106, 205–208. Ozdemir, Z. A., Balcilar, M. and Tansel, A. (2013) International labor force participation rates by gender: Unit roots or structural breaks? Bulletin of Economic Research, 65(S1): s142-s164. Said, S. and Dickey, D.A. (1984) Testing for unit roots in autoregressive-moving average models of unknown order, Biometrika, 71 599–607. 7 Figure 1. Labor-Force Participation Rates (LFPR) and Unemployment (UN) Rates, Age 15+, Turkey, 1988:Q3-2013:Q4 (a) Total LFPR (b) Total UN 60 16 58 14 54 Percent Percent 56 52 50 12 10 8 48 6 46 44 4 88 90 92 94 96 98 00 02 04 06 08 10 12 Year 88 90 92 94 96 98 00 02 04 06 08 10 12 Year (d) Female UN (c) Female LFPR 38 16 36 14 12 32 Percent Percent 34 30 28 10 8 26 6 24 22 4 88 90 92 94 96 98 00 02 04 06 08 10 12 Year 88 90 92 94 96 98 00 02 04 06 08 10 12 Year (e) Male LFPR (f) Male UN 82 15 80 14 13 12 76 Percent Percent 78 74 11 10 9 72 8 70 7 68 6 88 90 92 94 96 98 00 02 04 06 08 10 12 Year 88 90 92 94 96 98 00 02 04 06 08 10 12 Year 8 Figure 2. Labor-Force Participation Rates (LFPR) and Unemployment (UN) Rates, Age 15-24, Turkey, 1988:Q3-2013:Q4 (a) Total LFPR (b) Total UN 60 28 26 56 24 22 Percent Percent 52 48 44 20 18 16 40 14 36 12 88 90 92 94 96 98 00 02 04 06 08 10 12 Year 88 90 92 94 96 98 00 02 04 06 08 10 12 Year (c) Female LFPR (d) Female UN 44 28 40 24 Percent Percent 36 32 20 16 28 12 24 20 8 88 90 92 94 96 98 00 02 04 06 08 10 12 Year 88 90 92 94 96 98 00 02 04 06 08 10 12 Year (e) Male LFPR (f) Male UN 75 28 26 70 24 22 Percent Percent 65 60 55 20 18 16 50 14 45 12 88 90 92 94 96 98 00 02 04 06 08 10 12 Year 88 90 92 94 96 98 00 02 04 06 08 10 12 Year 9 Table 1. Univariate Unit Root Tests, Turkey, 1988:Q3-2013:Q4 Level ADFa First Difference KPSSb ADF KPSS Age: 15+ Labor force participation rate -2.07 (4) 0.994* -6.61* (3) 0.283 Total * -2.02 (8) 0.728 -4.48* (4) 0.279 Female -1.68 (4) 1.133* -7.37* (3) 0.224 Male Unemployment rate -2.11 (1) 0.673* -7.68* (0) 0.055 Total * -0.17 (12) 0.806 -4.94* (11) 0.199 Female -1.81 (8) 0.543* -4.28* (7) 0.083 Male Age: 15-24 Labor force participation rate -1.93 (4) 1.137* -8.64* (3) 0.288 Total * -2.01 (8) 1.091 -4.65* (7) 0.315 Female -1.67 (4) 1.153* -8.11* (3) 0.268 Male Unemployment rate -1.15 (12) 0.653* -4.29* (11) 0.076 Total * -0.30 (12) 0.924 -4.54* (11) 0.249 Female -2.66 (1) 0.547* -5.91* (3) 0.060 Male Notes: †,*,** indicate significance at the 10, 5, and 1 percent levels, respectively. The numbers in parentheses indicate the lag lengths which are established using the Akaike’s Information Criteria. a Test allows for a constant; one-sided test of the null hypothesis that the variable has a unit root; 10, 5, 1 percent significance critical values equal -2.59, -2.87, and -3.44, respectively. b Test allows for a constant; one-sided test of the null hypothesis that the variable is stationary; 10, 5, 1 percent significance critical values equal 0.347, 0.463, and 0.739, respectively. 10 Table 2. Multivariate Cointegration Tests between Unemployment Rates, Turkey, 1988:Q3-2013:Q4 Labor Force Participation and Null Hypothesis TraceTesta Maximum Eigen Value Testb r=0 r1 r=0 r1 r=0 r1 18.51** 7.15 14.42* 6.75 13.65* 5.09 12.11* 7.62 9.51 6.31 8.72 5.23 Age: 15+ Total (6) Female (5) Male (2) Age: 15-24 r=0 18.37** 12.81* r1 6.14 6.41 r=0 17.72** 10.86 Female (5) r1 7.44 7.84 r=0 19.65** 15.26** Male (5) r1 5.17 5.44 * Notes: Lag lengths (shown in parenthesis) in the VAR (in levels) are selected using the Akaike’s Information Criterion. Statistically significant at the 10% level. *, ** and *** indicate significance at 10, 5 and 1 percent levels. a One-sided test of the null hypothesis that the variables are not cointegrated; 10 , 5 and 1 percent Osterwald-Lenum (1992) critical values for r = 0 are 13.33, 15.41 and 20.04, respectively. b One-sided test of the null hypothesis that the variables are not cointegrated; 10, 5 and 1 percent Osterwald-Lenum (1992) critical values for r = 0 are 12.07, 14.07 and 18.63 for, respectively. Total (5) 11 Table 3. Tests of Restrictions in Cointegrated VAR, Turkey, 1988:Q3-2013Q4 Restriction Total Female Male Age: 15+ β = (1 0)′ β = (0 1)′ α = (α1 0)′ α = (0 α2)′ 5.02 (0.02) 1.91 (0.16) 4.85 (0.02) 0.80 (0.37) 0.49 (0.47) 0.74 (0.38) (0.78) (0.37) 0.003 (0.95) 5.99 (0.01) 1.76 (0.18) 5.88 (0.01) 0.12 (0.73) 2.80 (0.09) 0.62 (0.43) 2.48 (0.11) 0.87 (0.35) 2.72 (0.09) (6.03) (0.01) 3.74 (0.05) 0.59 (0.44) 4.34 (0.03) 0.04 (0.84) 3.13 (0.07) 2.28 (0.13) Age: 15-24 β = (1 0)′ β = (0 1)′ α = (α1 0)′ α = (0 α2)′ Notes: The numbers in the table are results of likelihood ratio tests for the restrictions. The pvalues of the likelihood ratio tests are reported in the parenthesis. 12


© Copyright 2026