
An Overview of Lightning Induced Whistler
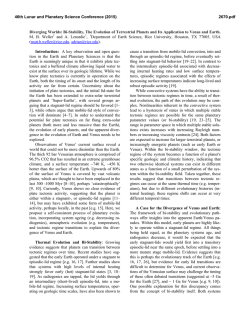
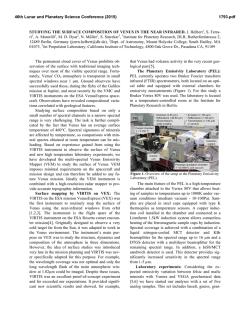
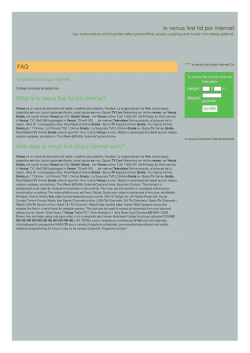
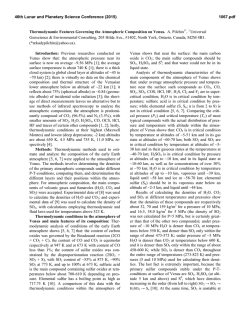
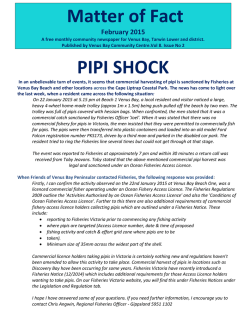
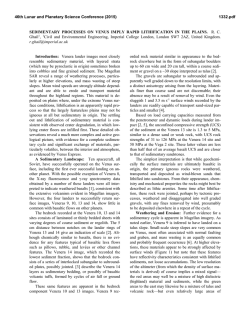
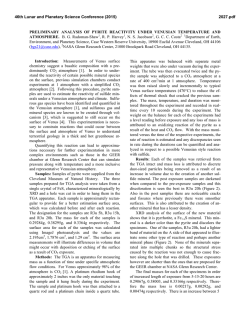
46th Lunar and Planetary Science Conference (2015)
2341.pdf
AN OVERVIEW OF LIGHTNING INDUCED WHISTLER-MODE WAVES OBSERVED BY VENUS
EXPRESS. R. A. Hart1, C. T. Russell1, T. L. Zhang2 ,1Department of Earth, Planetary, and Space Sciences, University of California, Los Angeles, USA ([email protected]), 2Space Research Institute, Austrian Academy of Sciences,
Graz, Austria.
Introduction: Venus is a strange world when compared with Earth. It has a dense CO2 atmosphere, low
water content, and lacks plate tectonics and an intrinsic
magnetic field. The surface of Venus has a temperature
of 700 K and a pressure of 90 bar. Cloud layers composed mainly of sulfuric acid exist at an altitude of
about 45 to 65 km in contrast to Earth’s water-rich
clouds, which form in the troposphere at 1 to 10 km.
Despite the many differences, it is sometimes referred
to as “Earth’s twin” due to its similar size, mass, and
interior structure. Venus also exhibits familiar terrestrial processes including volcanism and lightning. Due to
the high altitude of the Venus cloud layers and the extreme surface pressure, it is not likely that there would
be any cloud to ground lightning as this would require
an unrealistic amount of charge build up. However, the
conditions within the cloud layers of Venus are not
unlike those on Earth. The sulfuric acid in the clouds
can carry charge similarly to the water in Earth’s
clouds and they exist at altitudes where the pressure is
similar to that of Earth’s. Therefore, the cloud layer is
where the majority of lightning is expected to occur on
Venus. Lightning produces an extremely low frequency
(ELF) radio wave that can propagate along magnetic
field lines to reach a spacecraft, such as Venus Express, at much higher altitudes.
Venus Express has now completed its more than
8.5 year tenure in orbit around Venus. Throughout the
mission it was in a 24 hour elliptical polar orbit with
periapsis at ~80° latitude at orbital insertion in 2006. It
then precessed near the pole in 2009 and ultimately
finished its mission with periapsis at ~72° latitude
(Figure 1). For the first few years the altitude of periapsis reached ~250 km above the surface, but later it
commonly descended to ~165 km. In mid-2014 the
spacecraft performed an aerobraking maneuver in
which it descended further into the atmosphere down to
~130 km at its lowest point.
Measurements: The onboard dual fluxgate magnetometer was able to detect ELF signals up to 64 Hz at
various altitudes thoughout the mission [1]. We analyzed 10 minutes of data about periapsis for each available orbit. An average of ~700 seconds of ELF wave
activity was observed for each Venus year (225 days).
The average signal length is 6 seconds with some
spanning nearly 1 minute. The longer signals are most
likely multiple overlapping bursts when the spacecraft
was above an electrical storm. These signals, also re-
ferred to as whistler-mode waves, were most frequently
seen when the spacecraft was at ~250 km altitude. Figure 2 shows the number of seconds per thousand of
ELF signals detected at various altitudes. More than
70% were observed within 200-350 km altitude with a
rate of ~1% of the time the spacecraft spent at these
altitudes. The maximum detection rate at this altitude is
expected due to the slower wave speed here that results
in a larger magnetic amplitude for the same electromagnetic energy flux.
Figure 1. The periapsis of Venus Express has been
decreasing in latitude ~3° per year since 2009.
Figure 2. Per mil of time of ELF wave activity observed by Venus Express at various altitudes calculated
over all local times and latitudes.
Signal Analysis: The Venus Express magnetometer can observe lightning-generated signals up to 64
Hz. Whistler-mode (ELF and VLF in the Earth’s ionosphere, but only ELF at Venus) are guided well up to
about ¼ of the local electron gyrofrequency. Venus
Express should be able to study atmospheric lightning
emissions as long as the background magnetic field in
46th Lunar and Planetary Science Conference (2015)
the ionosphere is greater than 10 nT thus providing a
magnetic pathway through the lower ionosphere. This
happens frequently, and Figure 4 illustrates some recent examples of the waves seen. We show first the
power in the waves as a function of frequency. (The
white line shows the magnetic field strength.) Note the
increase in power at 01:49:47. Next is the ellipticity of
the waves. Whistler-mode waves should be righthanded, giving a red color to the dynamic spectrum.
The third panel is the direction of the wave propagation
relative to the magnetic field. Dark blue indicates the
waves are propagating parallel to the magnetic field.
The time series is given in Figure 3 indicating that the
field is aligned with the north component. The radial
and east components shift in the middle of this observation allowing the wave to propagate to the spacecraft
more efficiently, which is illustrated by the corresponding power increase in Figure 4. This event is just one
example of ~100 per Venus year, each confirmed as a
whistler-mode wave by the same analysis.
Discussion: Venus Express marks the end of the
current era of exploration at Venus and currently there
are no future approved missions besides the Japanese
Akatsuki mission which will attempt a second try at
orbital insertion in late 2015. Although Venus Express
provided a wealth of data to advance the study of lightning on Venus there is still much to learn, such as temporal and spatial mapping of the actual storms from
which these signals are detected. The majority of the
lightning generated whistler-mode waves in the Venus
ionosphere were observed at ~250 km altitude. As well
as being the most effective location for a spacecraft to
detect these ELF waves on Venus, this altitude is ideal
for radar mapping. A joint radar-lightning mapping
mission could be a prime candidate for the next mission to our sister planet.
2341.pdf
Figure 4. Dynamic spectra of transverse power, ellipticity, and propagation angle for event in mid-2012. The
white line is the total magnetic field strength in nT.
References: [1] Russell, C.T. et al. (2006) Planet.
& Space Sci., 54, 1344–1351.
Figure 3. Time series of magnetic field along radial,
east, and north directions for event in mid-2012. The
spacecraft altitude, latitude, and local time are given
above the plot.


© Copyright 2026