
Adsorption studies on the removal of chromium onto chitosan-g
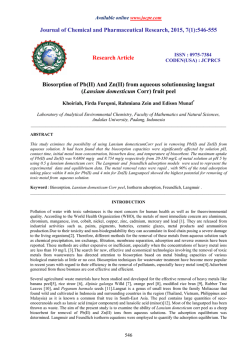
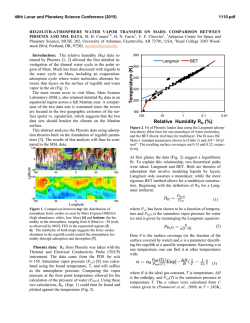
Available online www.jocpr.com
Journal of Chemical and Pharmaceutical Research, 2015, 7(1):467-476
Research Article
ISSN : 0975-7384
CODEN(USA) : JCPRC5
Adsorption studies on the removal of chromium onto chitosan-g-maliec
anhydride-g-ethylene dimethacrylate
M. R. Gopal Reddi1, C. Govindharajan1, P. N. Sudha2* and T. Gomathi2
1
Department of Chemistry, Bharathiar University, Coimbatore, Tamilnadu, India
PG and Research Department of Chemistry, D. K. M College for Women, Vellore, Tamilnadu, India
_____________________________________________________________________________________
2
ABSTRACT
In the present study the highly toxic metal chromium is removed using Chitosan-g-Maleic anhydride-g-ethylene
dimethacrylate. The graft copolymer is synthesized through chain polymerization reaction using Ceric Ammonium
Nitrate as the initiator. Graft copolymer was prepared by varying parameters such as monomer concentration,
initiator concentration and temperature. The chemical structure and physical properties of prepared Chitosan-gMA-g-ethylene dimethacrylate copolymer were carried out by various analytical techniques such as Fourier
transform resonance spectroscopy (FT-IR), and X-ray diffraction (XRD). Grafting was confirmed by FTIR. X-ray
diffraction showed changes in crystalline pattern. Batch adsorption studies are carried out to find the adsorption
efficiency of the material prepared by varying the parameters such as adsorbent dose, contact time, pH and initial
concentration of the metal solution. The results are fitted with Langmuir and Freundlich isotherm models.
Key words: Polymerization. Chitosan-g-MA, ethylene dimethacrylate, Grafting, Parameters.
_____________________________________________________________________________________
INTRODUCTION
Nowadays, enormous increase in the use of heavy metals has resulted in an increased flux of metallic substances in
the aquatic system [1]. Untreated wastewater from industries constitute the major source of metal ion pollution in
natural water [2]. Aquatic systems are exposed to a number of pollutants that are mainly discharged from tanneries,
industries, sewage treatment plants and drainage from urban and agricultural areas causing damage to aquatic life
[3].
Most of the heavy metal ions are toxic or carcinogenic posing a serious threat to human health and the environment
[4]. The river systems may be excessively contaminated with heavy metals released from domestic, industrial,
mining and agricultural effluents [5]. Chromium exists primarily in Cr (III) and Cr (VI) oxidation states. The later
being hexavalent is considered as more toxic due to its higher solubility and mobility. These species are known to
be associated with a spectrum of DNA lesions occurring during Cr (VI) exposure [6].
Chemical precipitation, filtration, membrane separation, ion exchange, oxidation/reduction, reverse osmosis, solvent
extraction, chelating resins and adsorption are the various methods employed for the removal of heavy metal ions
from waste water. Among these techniques adsorption is quite promising one. Recent developments have shown
high removal efficiencies with much cheaper non-conventional materials which are mostly cheap and abundant
biological matter [7-10]. Removal of heavy metals from solutions by biological materials is recognized as an
extension to adsorption and is named as biosorption [11].
467
P. N. Sudha et al
J. Chem. Pharm. Res., 2015, 7(1):467-476
______________________________________________________________________________
Chitosan, a biopolymer is a low cost adsorbent identified recently with an excellent physicochemical properties
having the highest sorption capacity for the removal of heavy metal ions. Khor has stated that the 21st century can
be the century of chitin and Chitosan taking a place as an extra-ordinary material because chitin and its derivatives
have showed high potential in a wide variety of fields such as medical, pharmaceutical, cosmetics, food industry,
agriculture, environmental protection [12-18].
Chitosan is chemically modified by graft copolymerization [19-22] which would enable a wide variety of molecular
designs to afford tailored made hybrid materials composed of natural polysaccharides [23,24] and synthetic
polymers[25,26]. Chitosan has two reactive groups namely free amino and hydroxyl groups that can be grafted
effectively [27]. Two major types of grafting may be considered: 1. Grafting with single monomer and 2. Grafting
with two monomers.
The first type usually occurs in a single step and the second may occur with either the simultaneous (or) sequential
use of the monomers [28]. In the present study, we have synthesized a novel type of material, namely Chitosan-gMaleic anhydride-g-(ethylene dimethacrylate) using ceric ammonium nitrate as the initiator. The prepared graft
copolymer was subjected to various analytical techniques such as FTIR and XRD to confirm grafting. The graft copolymer prepared under optimum concentration was subjected in treating chromium contining aquesous solution to
study it removal efficiency.
EXPERIMENTAL SECTION
Materials
Chitosan was obtained from India sea foods Cochin, Kerala, India. The monomer maleic anhydride and ethylene
dimethacrylate were of analytical grade and purchased from the company, Merck. All Other chemicals were of
analytical grade and used as such.
Preparation of Chitosan- g- Maleic anhydride
Chitosan (2g) and maleic anhydride (5g) were dissolved in 100 ml of acetic acid and 10ml of ceric ammonium
nitrate (0.5g) dissolved in10ml of Nitric is added. The mixture was stirred constantly at 70°C for 3hrs under
nitrogen atmosphere. The resultant solution was cooled to room temperature and poured into 10% NaOH to
precipitate the product. The product was filtered and washed with diethyl ether for several times and then dried in
vacuum at 40°C. The grayish white powder of N-maleilated Chitosan was obtained.
Preparation of Chitosan-g-Maleic anhydride-g-Ethylene Dimethacrylate
The co-polymer was homogeneously synthesized in aqueous solution using Ceric ammonium nitrate as the initiator.
A mixture of 0.5 g maleilated chitosan was dissolved in150 ml formic acid followed by the addition of ethylene
dimethacrylate (2g) dissolved in ethanol. The reaction was carried out at 70 °C for about 30 minutes. The contents
of the flask were cooled to room temperature and poured into 10% NaOH solution to precipitate the graft copolymer. The parameters such as initiator concentration, monomer concentration and reaction temperature and the
grafting yield and efficiency were investigated.
FTIR Spectroscopy
FTIR spectra of the grafted co-polymer was determined by Perkin Elmer spectrophotometer and in a wide range
wavelength between 400 cm-1 to 4000 cm-1 and in solid state using KBr pellet method.
X – Ray Diffraction
X – Ray diffraction patterns of ungrafted and grafted chitosan were obtained with a D\max - 2200 X ray
diffractometer using graphite-monochromatized Cu Kα radiation (Kα = 1.54178 (Å)
Preparation of stock solution
Cr(IV) stock solution was prepared to get a concentration of 200mg/L of chromium as potassium dichromate. 1:1
Hydrochloric acid and 2N sodium hydroxide solutions were used for pH adjustment. The exact concentration of
each metal ion solution was calculated on mass basis and expressed in terms of mg L-1. The stock solution was
further diluted to the required concentrations. All precautions were taken to minimize the loss due to evaporation
during the preparation of solutions and subsequent measurements. The stock solutions were prepared fresh for each
experiment as the concentration of the stock solution may change on long standing.
468
P. N. Sudha et al
J. Chem. Pharm. Res., 2015, 7(1):467-476
______________________________________________________________________________
Batch adsorption studies
Batch studies were performed with different concentrations of potassium dichromate to investigate the extent of
adsorption using Chitosan-g-Maleic anhydride-g-(Ethylene dimethacrylate). Synthetic solution of Cr(VI) ion taken
in stoppered bottles and agitated with the blend films at 30 °C in orbit shaker at fixed speed of 210rpm. The extent
of heavy metal removal was investigated separately by changing adsorption dose, contact time, initial concentration
and changing pH of the solution. After attaining the equilibrium adsorbent was separated by filtration using filter
paper and aqueous phase concentration of metal was determined with atomic adsorption spectrophotometer (Varian
AAA 220FS).
RESULTS AND DISCUSSION
FTIR studies
FTIR spectrum of pure chitosan, chitosan-g-maleic anhydride and Chitosan-g-Maleic anhydride-g-(Ethylene
dimethacrylate) copolymer are shown in Figure 1a – 1c. FTIR spectrum of pure chitosan (figure.1a) shows a broad
peak around 3454 cm-1 due to -NH stretching and -OH stretching and the peaks around 1628 cm-1 and 1540 cm-1 due
to amide I and amide II groups. The characteristic C-O stretching vibration appears at 1098 cm-1 and the C-N
stretching vibration at 1485 cm-1. The aliphatic (-CH2) stretching vibration shows a peak at 2923 cm-1.
FTIR spectrum of Chitosan-g-Maleic anhydride is shown in Figure 1b. The new strong band present at 1596 cm-1
indicates C=C bond, confirming the grafting of malefic anhydride group onto chitosan. The νas (COO−) band is
observed at around 1643 cm−1 whileνsym (COO−) is observed at 1415 cm−1.
88
86
84
472.23
82
80
66
64
62
776.38
1021.37
68
1151.84
1098.72
1540.02
1628.87
70
3454.75
%T
72
1421.52
1384.01
1322.23
2923.08
74
1740.23
76
674.35
78
60
58
56
54
52
50
3500
3000
2500
2000
Wavenumbers (cm-1)
Figure 1a: FTIR spectrum of chitosan
469
1500
1000
500
P. N. Sudha et al
J. Chem. Pharm. Res., 2015, 7(1):467-476
______________________________________________________________________________
.
Figure 1b: FTIR spectrum of chitosan-g-Maleic anhydride
Figure 1c: FTIR spectrum of Chitosan-g-Maleic anhydride-g-(Ethylene dimethacrylate)
Chitosan-g-Maleic anhydride-g-(Ethylene dimethacrylate) copolymer was formed when maleilated chitosan was
grafted with ethylene dimethacrylate. The FTIR spectrum (Figure 1c) of Chitosan-g-Maleic anhydride-g-(Ethylene
dimethacrylate) copolymer had additional vibration bands at 1643 cm-1 and 1387 cm-1 due to carbonyl stretching.
The symmetrical and asymmetrical peaks of the aliphatic groups (-CH3, -CH2) are obtained around 2826cm-1 and
2898 cm-1. The characteristic ester (-C-O-C-) vibration band appears at region 1267 cm-1 - 1155 cm-1. The formation
of the new peaks and the shift in peak position in the spectrum confirms the formation of the graft copolymer
chitosan-g-maleic anhydride-g-(Ethylene dimethacrylate).
470
P. N. Sudha et al
J. Chem. Pharm. Res., 2015, 7(1):467-476
______________________________________________________________________________
X-ray diffraction studies
The X-ray diffraction spectra of pure chitosan and chitosan -g- maleic anhydride were meseasured. The XRD pattern
of chitosan (Figure 2a) has low crystallinity and the characteristic peaks at 2θ = 11º and 20º. The chitosan-g-Maleic
anhydride (Figure 2b) shows the values at 2θ = 18º, 24º, 26º and 30º. The maleilated chitosan-g-(Ethelene
dimethacrylate) (Figure 2c) does not have the peak at 2θ = 11º, 18º, 24º, 26º and 30º. Hence crystallanity of the
grafted copolymer decreased much when compared with pure chitosan and CS-g-MA.
Figure 2a: XRD of Chitosan
Figure 2b: XRD of CS-g-MA
Figure 2c: XRD of chitosan-g-maleic anhydride-g-(Ethylene dimethacrylate)
Factors influencing the adsorption of Cr (VI) ions
The influences of several operational parameters like dose of adsorbent, pH, initial metal ion concentration and
contact time on the adsorption process were investigated through batch mode. The results are discussed below.
Effect of adsorbent dose
Figure 3 shows the adsorption of chromium ions onto the chitosan-g-maleic anhydride-g-ethylene dimethacrylate
copolymer (adsorbent). The experiment was carried out by taking various adsorbent concentrations ranging from 1g
to 6g separately keeping the other variables (pH and contact time) constant. It was observed that the percentage
removal of Cr6+ ions increases gradually with the increase of adsorbent dosage, this may be due to the fact that more
surface area is available for adsorption process. The maximum percentage removal of Cr(VI) was about 86.9% at the
dosage of 6 g. This was attributed to the fact that after a certain dose of adsorbent the maximum adsorption sets in
and so the minimum surface area is available for further metal ion adsorption. Hence the amount of ions bound to
the adsorbent and the amount of free ions in the solution remains constant even after the adsorbent dose is increased.
471
P. N. Sudha et al
J. Chem. Pharm. Res., 2015, 7(1):467-476
______________________________________________________________________________
Figure 3: Effect of adsorbent dose on the removal of Cr6+ ions
Effect of contact time
Figure 4 shows the effect of contact time on the adsorption of Cr6+ ions onto the graft copolymer. Initially rate of
removal of Cr6+ ions was found to be higher as soon as the metal ions and graft copolymer came into contact.This
was due to the larger surface area being available at the beginning for the adsorption of Cr6+ ions [29]. Further
increase in contact time shows a decrease in the uptake of metal ions which may be due to the decrease in the
number of available active sites for adsorption till the equilibrium is reached. The results indicate that the rate of
removal of metal ions was increased with an increase in the contact time up to 360 mins and remained constant
(86.1%) .Thus the optimum contact time for the maximum removal (86.1%) was 360 mins indicating that it is one
of the important parameters for an economical waste water treatment.
Figure 4: Effect of contact time
Effect of pH
The pH of the solution affects on the surface charge of the adsorbent. A small change in pH influences both the
adsorbent surface as well as inonic species of metal ion in water. At different pH values, the protonation and
deprotonation behaviours of acidic and basic groups would be influenced [30]. Figure 5 shows that the adsorption
increases slowly with an increase in pH of the metal ion solution and then it decreases gradually. The maximum
472
P. N. Sudha et al
J. Chem. Pharm. Res., 2015, 7(1):467-476
______________________________________________________________________________
percentage removal of Cr(VI) was about 87.2% at pH 5.5. This is due to the decrease in competition between the
proton and metal ions for the same functional groups and by the decrease in positive surface charge on the adsorbent
resulting in a lower electrostatic repulsion between surface and metal ions. Decrease in adsorption at higher pH
value was due to the formation of soluble hydroxyl complexes [31]
Figure 5: Effect of pH
Adsorption isotherms
The isotherm models explain the relationship between the adsorbed metal ion concentration and concentration of the
solution at equilibrium. For adsorption studies Langmuir and Freundlich equations are widely used.
Langmuir sorption isotherm.
Langmuir model explains monolayer adsorption on an energetically uniform surface on which there is no
interaction between the adsorbed molecules. [32,33]. Equilibrium is attained once the monolayer formation is
completely saturated [34]. It was assumed that every sorption site is equivalent and the ability of sorbate to get
bound there is independent of whether (or) not the neighboring sites are occupied [35]. The pH value of optimum
adsorption is (pH = 5.5) and with the necessary contact time to reach the adsorption equilibrium of the metal ion.
The Langmuir model is given as follows,
Ceq/Cads = bCeq/KL + 1/KL
(1)
Cmax = KL/b
(2)
where
Cads = amount of metal ions adsorbed (mg g-1)
Ceq = equilibrium concentration of metal ion in solution (mg dm-3)
KL = Langmuir constant (dm3.g-1)
b = Langmuir constant (dm3.g-1)
Cmax = maximum metal ion to adsorb onto 1g adsorbent (mg.g-1)
The constant “b” in the Langmuir equation is related to the energy or the net enthalpy of the sorption process. The
constant KL can be used to determine the enthalpy of adsorption [29]. The constants “b” and “KL” are the
characteristics of the Langmuir equation and can be determined from the linearised form of the Langmuir equation .
473
P. N. Sudha et al
J. Chem. Pharm. Res., 2015, 7(1):467-476
______________________________________________________________________________
Fig 6 : Langmuir isotherm for Chromium (VI)
Table 1. Adsorption isotherm constant, Cmax and correlation coefficient
Langmuir constants
Metal ion
KL
(dm3.g-1)
b
(dm3.mg-1)
Cmax
(mg.g-1)
R2
Cr6+
0.6684
0.004725
141.46
0.7032
The Langmuir equation was used to explain the data obtained from the adsorption of Cr (VI) ions by graft
copolymer adsorbent over the entire concentration range. A plot of Ceq/Cads against Ceq gives a straight line (Fig 6).
The results of the adsorption isotherm in Table 1 shows a good correlation by the graft copolymer. The Cmax value
is 141.46 mg of Cr per gram of copolymer. Value of R2 shows correlation or linear relationship.
The essential features of a Langmuir isotherm can be expressed in terms of a dimensionless constant separation
factor or equilibrium parameter, RL that is used to predict if an adsorption system is favourable or unfavourable.
The separation factor, RL is defined by
RL = 1/1+bCf
where Cf is the final Cr(VI) concentration (mg dm-3) and b is the Langmuir adsorption equilibrium constant (dm3mg1
). The parameter indicates the isotherm shape according to Table 2
Table 2. RL values based on Langmuir adsorption
Metal ions
Cr (VI)
Initial concentration C0
(mg.dm-3)
1000
500
200
100
50
Final concentration Cf
(mg.dm-3)
772
384
194
95
46
RL Values
0.2151
0.3553
0.5217
0.6902
0.8214
The values of RL calculated for Cr(IV) concentration is given in Table 1. Adsorption of Cr(IV) onto chitosan-gmaleicanhydride-g–ethylene dimethacrylate is favourable as the values are in the range of 0<RL<1 indicating the
graft copolymer is an efficient adsorbent.
Freundlich isotherm
The Freundlich isotherm equation is used for the description of multilayer adsorption with the interaction between
adsorbed molecules. The model predicts that the adsorbate concentration in the solution will be increasing. The
474
P. N. Sudha et al
J. Chem. Pharm. Res., 2015, 7(1):467-476
______________________________________________________________________________
model applies to the adsorption onto heterogeneous surfaces with uniform energy distribution and reversible
adsorption. The non-linear form of Freundlich equation may be written as
qe = Kf Ce1/n
(3)
The linearised form of Freundlich isotherm is given by the equation
log qe =log Kf+ 1/n log Ce
(4)
Ce = Equilibrium concentration of adsorbate in solution after adsorption (mg dm3)
Kf = Emprical Freundlich constant or capacity factor (mg g-1)
1/n = Freundlich exponent
Non-linear behaviour of adsorption indicates that adsorption energy barrier increase exponentially with increasing
fraction of filled sites on the adsorbent .
Fig 7: Freundlich isotherm for Chromium (VI)
Kf and n are Freundlich constants. Kf indicates the relative sorption capacity and n is the measure of the nature and
strength of the sorption process and the distribution of active sites. Fig.7 corresponds to the isotherm of chromium
(VI). Mathematical calculations showed that n values are between 1 and 10 representing beneficial sorption [36].
Table 3. Freundlich isotherm parameters for Cr (VI) on graft copolymer
Metal ion
Cr6+
Freundlich parameters
Kf (mg.g-1)
n
R2
0.6931
3.5373 0.9024
The Freundlich parameter 1/n is the adsorption intensity of metal ions on biosorbent. The Freundlich constants Kf
and n are 0.6931 and 3.5373 (Table 3). Other than homogeneous surface, the Freundlich equation is also suitable for
a highly .heterogeneous surface and an adsorption isotherm shows the formation multilayer adsorption. The value
of 1/n is less than unity indicating the significant adsorption at low concentration. In the present study CS-g-MAg-EDMA was used as an adsorbent. The “n” value lies between 1 and 10 which represents beneficial adsorption.
CONCLUSION
Chitosan-g-MA-g-ethylene dimethacrylate was synthesized through graft co-polymerization in aqueous solution
using ceric ammonium nitrate as initiator. FTIR spectroscopy confirmed the introduction of ethylene dimethacrylate
side chain onto the N- maleilated chitosan backbone by graft co-polymerization. The effect of adsorbent dosage,
contact time and pH of the medium on adsorption efficiency of graft co-polymer were studied to find the optium
removal of metal ion. According to regression coefficient the Freundlich adsorption isotherm was better fitted than
475
P. N. Sudha et al
J. Chem. Pharm. Res., 2015, 7(1):467-476
______________________________________________________________________________
the Langmuir. Hence the graft co-polymer Chitosan -g -MA- g-ethylene dimethacrylate act as a good adsorbent and
can be used for wastewater treatment .
REFERENCES
[1] H Yang; NL Rose. Distribution of Hg in the lake sediments across the UK. Sci. Total Environ., 2003, 391–404.
[2] DR Livingstone, Mar. Pollut. Bull., 2001, 42(2), 656–666.
[3] R Karbassi; I Bayati; F Moattar, Int. J. Environ. Sci. Tech., 2006, 3(1), 35–42.
[4] C Damien; VH Chantal; S Pirouz; FH Zerimech; J Laurence; MH Jean, Water, Air, Soil Pollut., 2004, 152(1),
55– 69.
[5] OR Vander; J Beyer; NPE Verneykebm, Toxicol. Pharmacol., 2003, 13(2) 57 – 149.
[6] M Reynolds; E Peterson; G Quievryn; A Zhitkovich, J. Biol. Chem., 2004, 279(29), 30419–30424.
[7] D Mohan; CU Pittman, Hazard. Mater., 2006, 137(2), 762-811.
[8] SM Nomanbhay; K Palanisamy, Elect. J.Biotechnol., 2005, 8(1), 43-53.
[9] S Babel; TA Kurniawan, J. Hazard. Mater., 2003, 97(1-3), 219-243.
[10] Z AnsarAli; V Jeyachandran, Int. J. Environ. Sci., 2011, 1(5), 820-833.
[11] V Boddu; K Abburi; JL Talbott; ED Smith, Environ. Sci. Technol., 2003, 37(19), 4449-4456.
[12] E Khor, Curr. Opin. Solid State. Mater. Sci., 2002, 6(4), 313 – 317.
[13] D Van Luyen, DM Huong. Chitin and Derivatives in Polymeric Materials encyclopedia.1996; Salamone J.C.
(Eds), CRC, Boca Raton (Florida), 1208-1217.
[14] HS Kas, J. Microencapsulation., 1997, 14(6), 689 – 711.
[15] K Kurita; T Kojima; T Munakata; H Akao; T Mori; Y Nishiyama, Chem. Lett., 1998, 27(4), 317–318.
[16] MG. Peter. Chitin and chitosan from animal sources in Biopolymers, (Polysaccharides II).2002; S De Baets; EJ
Vandamme; A Steinbuchel. (Eds) Wiley – VCH, Weinheim, 2, ch. 15.
[17] S Hirano, Polym. Int., 1999, 48(8), 732 -734.
[18] MNV Ravikumar, React. Funct. Polym., 2000, 46(1), 1-27.
[19] H Caner; H Hasipoglu; O Yilmaaz; E Yilmaaz, Eur. Polym.J., 1998, 34(3-4), 493-497.
[20] MY Pedram, J. Retuert. J.Appl. Polym. Sci., 1997, 63(10), 1321-1326.
[21] KL Shantha; U Bala; KP Rao, Eur. Polym. J., 1995, 31(4), 377.
[22] TW Sun; P Xu, Carbohydr. Polym., 2004, 58(4), 379-382.
[23] A Srivastava; J Tripathy; M Mishra; K Behari, J. Appl. Polym. Sci., 2007, 106(2), 1353-1358.
[24] J Tripathy; D.K Mishra; MM Mishra; K Behari, Carbohydr. Polym., 2008, 72, 462.
[25] S Yoshikawa; T Takayama; N Tsubokawa, J. Appl. Polym. Sci., 1998, 68(11), 1883–1889.
[26] MY Pedram; A Lagos; J Retuert; R Guerrero; P Riquelme, J. Macromol Sci., Pure Appl. Chem, 1995, 32 (5),
1037–1047.
[27] NM Alves; JF Mano, Int. J. Biolo. macromol., 2008, 43(5) 401-414.
[28] A Bhattacharya; BN Misra, Progr. Polym. Sci., 2004, 29(8), 767-814.
[29] A Shafaghat; F Salimi; MVJ Salehzadeh; M Shafagha, Afr. J.Biotech., 2012, 11(4), 852-855.
[30] MM El-Toony; M Abdel-Geleei; RO Aly; HF Ali, Nat. Sci., 2011,9(2).
[31] AK Meena; GK Mishra; S Kumar; C Rajagopal; PN Nagar, Adsorption of Ni(II) and Zn(II) fom aqueous
solution by chemically treated activated carbon, National Conference on Carbon,DMSRDE,Kanpur., 2013.
[32] P Baroni; RS Vieira; E Meneghetti; MGC Da Silva; MM Beppu, J. Hazard. Mater., 2008, 152(3),1155-1163.
[33] TS Singh; KK Pant, Sep.Purif.Technol., 2004, 36(2), 139-147.
[34] SP Dubey; K Gopal, J. Hazard. Mater., 2007, 145(3), 465-470.
[35] I Langmuir, J. Am. Chem. Soc., 1918, 40(9), 1361–1403.
[36] J Febrinto; AN Kosasih; J Sunarso; Yi-H Jua, N Indraswati; S Ismadiji, J. Hazard. Mater., 2009, 162(2-3), 616645.
476
© Copyright 2026