
Turbulent Concentration of Millimeter
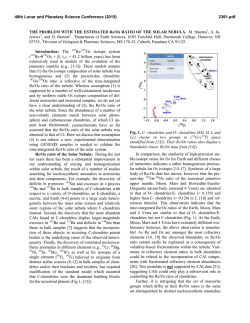
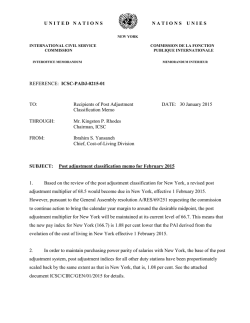
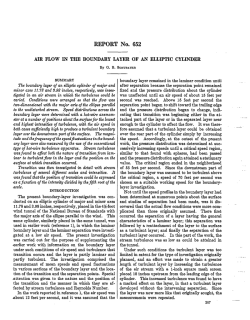
46th Lunar and Planetary Science Conference (2015)
1691.pdf
TURBULENT CONCENTRATION OF MM-SIZE PARTICLES IN THE PROTOPLANETARY NEBULA:
SCALE-DEPENDENT CASCADES. J. N. Cuzzi1 , and T. Hartlep2 , [email protected]; 1 Ames Research Center, NASA,
MS 245-3, Moffett Field, CA, USA; 2 BAERI inc.; Petaluma, CA..
Introduction: The initial accretion of primitive bodies
(here, asteroids in particular) from freely-floating nebula particles remains problematic. Traditional growth-by-sticking
models encounter a formidable “meter-size barrier" [1] (or
even a mm-to-cm-size barrier [2]) in turbulent nebulae, making
the preconditions for so-called “streaming instabilities" difficult to achieve even for so-called “lucky" particles [3]. Even
if growth by sticking could somehow breach the meter size
barrier, turbulent nebulae present further obstacles through the
1-10km size range [4]. On the other hand, nonturbulent nebulae form large asteroids too quickly to explain long spreads in
formation times, or the dearth of melted asteroids [5]. Theoretical understanding of nebula turbulence is itself in flux; recent
models of MRI (magnetically-driven) turbulence favor lowor-no-turbulence environments [6], but purely hydrodynamic
turbulence is making a comeback, with two recently discovered mechanisms generating robust turbulence which do not
rely on magnetic fields at all [7,8].
An important clue regarding planetesimal formation is
an apparent 100km diameter peak in the pre-depletion, preerosion mass distribution of asteroids [9]; scenarios leading
directly from independent nebula particulates to large objects
of this size, which avoid the problematic m-km size range,
could be called “leapfrog" scenarios [10-12]. The leapfrog
scenario we have studied in detail involves formation of dense
clumps of aerodynamically selected, typically mm-size particles in turbulence, which can under certain conditions shrink
inexorably on 100-1000 orbit timescales and form 10-100km
diameter sandpile planetesimals. There is evidence that at least
the ordinary chondrite parent bodies were initially composed
entirely of a homogeneous mix of such particles [4]. Thus,
while they are arcane, turbulent concentration models acting
directly on chondrule size particles are worthy of deeper study.
The typical sizes of planetesimals and the rate of their formation [11,12] can be estimated using a statistical model with
properties inferred from large numerical simulations of turbulence [13]. Nebula turbulence is described by its Reynolds
number Re = (L/η)4/3 , where L = Hα1/2 is the largest
eddy scale, H is the nebula gas vertical scale height, α the
turbulent viscosity parameter, and η is the Kolmogorov or
smallest scale in turbulence (typically about 1km), with eddy
turnover time tη . In the nebula, Re is far larger than any
numerical simulation can handle, so some physical arguments
are needed to extend the results of numerical simulations to
nebula conditions. In this paper, we report new physics to be
incorporated into our statistical models.
Cascade model and multiplier distributions: The spatial distribution of particle concentration can be captured statistically by a cascade model [11,13] which predicts the probability distribution functions (PDFs) for dense particle clumps;
these PDFs are essentially the volume fractions of the nebula
which have the necessary properties (solids mass and local
vorticity) for planetesimal formation. A cascade model presumes that, as energy flows from large eddies to smaller ones,
particles and fluid properties are partitioned unequally at each
“level" of the cascade from “parent" into “daughter" eddies.
Figure 1: The symbols indicate the multiplier pdfs
for turbulent dissipation in high-Re atmospheric turbulence [10], showing scale invariance over 300-3000η. The
red β-functions (β=3, 6, and 48) provide context for β
values in figure 2. In [11] we adopted level-independent
multiplier pdfs with β ∼ 3 based on our own simulations.
The probability distribution functions (pdfs) of the so-called
multipliers by which particle and fluid properties are partitioned have widths that are parameterized by the parameter
β; smaller β means larger width ([13]; see figure 1 above),
or a higher probability of strongly asymmetrical partitioning
which, repeated over a number of levels, leads to clumpier or
more intermittent local values of particle and fluid properties.
The wide range of scales between L and η is loosely
called the inertial range; in this range the equations of motion
are scale-free, and the multiplier pdfs for dissipation of turbulent kinetic energy (which, like the chondrule-size particles
modeled by [11-13], is characterized by Kolmogorov eddy
timescales) are known to be scale-independent in atmospheric
flows from hundreds to thousands of Kolmogorov lengthscales
[14; figure 1]. This fact motivated [11,13] to develop a cascade
model in which the multiplier pdfs for particle concentration
Φ were also independent of turbulent eddy lengthscale. Subsequent disagreement with results of others [15] led us to a more
in-depth study using highly resolved fluid simulations [16,17]
that revealed a scale dependence of multiplier pdfs, which will
affect the formation rate and masses of primary planetesimals
in the scenario of [11,12]. The approach is described in [18].
Here we present further analysis along these lines.
Results: Figure 2 shows our results for the widths of the
multiplier pdfs [18], binned on a wide range of lengthscales r
given in units of η. In this figure, the particle stopping time
ts has been normalized to a scale-dependent value Str using
the inertial range timescale ratio (r/η)−2/3 , and the constant
parameter St ≡ ts /tη where tη is the Kolmogorov eddy time.
In this plot, a value of Str = 1 represents a particle having
stopping time equal to the eddy time for the spatial scale r.
Except at the largest binning scales (r ≥ 128η), this scaling
46th Lunar and Planetary Science Conference (2015)
1691.pdf
Figure 2: β (like inverse width) of multiplier pdfs for
particle concentration, plotted as a function of Str
(stopping time ts normalized by the turnover time of
an eddy with scale r), for a variety of binning scales r
ranging from 12η to 512η ∼ L/2. With this scaling,
the multiplier pdf β values collapse to a universal curve
except at the largest scales r > L/10. The scale-free
β ∼ 3 for dissipation (figure 1) is shown. A universal
curve allows our cascade models to be extended to scales
smaller than resolvable by current numerical models.
Figure 3: Multiplier pdfs for nominally St = 1 particles, at four different scales. The red curves are the
best-fitting overall β-functions, which get narrower for
a given particle size to large scales (in figure 2, points
move up and to the left on the universal collapse curve).
At smaller scales, lying within the universal collapse domain, the β-function itself provides a good (and scaleinvariant) fit to the actual multiplier pdf. However the
actual pdfs (black curves) have broader exponential tails
at large spatial scales.
collapses our previous results [18] into an invariant family of
curves, allowing us to predict the value of β for any combination of lengthscale and particle stopping time. The minimum
near Str = 0.2 suggests that particles with stopping time
somewhat shorter than the eddy time on lengthscale r are most
strongly concentrated within spatial averages over lengthscale
r. This scaling collapses the multipliers much better than an
alternate scaling found by [19] which collapses the normalized concentration pdfs themselves; the concentration pdfs
can be thought of as the cumulative result of multipliers acting
sequentially over all larger scales. After a number of eddy
bifurcations to smaller scale, particles of a small but finite
range of sizes might thus end up concentrated within a single clump, which may be consistent with new determinations
of chondrule size distributions which find them to be broader
than previously believed [20]. Our model will ultimately make
testable predictions along these lines.
However, the curves for the largest lengthscales (r >
L/10 where L ∼ 1000η) diverge from this scale-invariant
curve, probably because, in the top decade of lengthscales,
turbulent stretching and vortex tube formation have not yet
reached their fully developed state (see [8] and references
therein). For these largest scales, multiplier statistics are better
characterized by their scale as a fraction of L rather than as a
multiple of η. Moreover, at the largest scales, where nominal
multiplier β values are large, the β-function itself does not provide a complete description of the cascade properties (figure
3). The scale at which the β-function becomes an adequate fit
to the actual multiplier pdf is close to the scale at which the
β(Str ) curves of figure 2 become universal.
The cascade model for planetesimal formation by turbulent concentration [11] can now be modified to allow for the
observed level-dependence in the particle concentration multiplier pdfs (figures 2 and 3), as well as in the multiplier pdfs for
gas enstrophy (vorticity squared) which also determine the cascade results and, we have found, also differ from values used
in [11,12]. However, the asymptotic β value we determine
for dissipation does not quite match the scale-free value determined by [14] in atmospheric flows. Thus, some effort must
be dedicated to understanding how the results presented here
may change with Re itself, and we are pursuing this. Because
nebula properties such as turbulent intensity and gas density
are unknown to an order of magnitude [11,12], these findings
do not, on the face of it, qualitatively change the outlook for the
scenario, but will lead to quantitative changes in predictions of
planetesimal IMF and chondrule size distributions.
References: [1] Brauer, F. et al 2008 A&A 480, 859;
[2] Zsom A. et al 2010, A&A 513, id.A57; [3] Garaud
P., Meru F., Galvagni M. et al. (2013) Ap.J., 764, 146;
[4] Gressel et al 2012 MNRAS 422, 1140, and references therein; [5] Cuzzi J.N. and Weidenschilling S.J.
2006 in “Meteorites and the Early Solar System II, U.
Ariz. Press; [6] Bai X.-N. and Stone J. M. (2013) Ap.J.,
769, 76; [7] Nelson R. P., Gressel O., and Umurhan
O. M. (2013) MNRAS 435, 2610; [8] Marcus, P. et al
(2014) http://arxiv.org/abs/1410.8143; [9] Bottke W.
et al 2005, Icarus 175, 111; [10] Johansen, A. et al 2007
Nature, 448, 1022; [11] Cuzzi J.N., R.C. Hogan, and
W.F. Bottke 2010 Icarus, 208, 518; [12] Cuzzi J.N. and
R.C. Hogan 2012 43rd LPSC; id. 2536 [13] Hogan, R.C.
and J.N. Cuzzi 2007 Phys. Rev. E 75, id. 056305;
[14] Sreenivasan K.R. and G. Stolovitsky 1995, J. Stat.
Phys. 78, 311; [15] Pan, L. et al 2011, ApJ 740, article id. 6; [16] Bec J. et al. 2010, J. Fluid Mech. 646,
527; [17] Calzavarini E. et al 2008; J. Fluid Mech. 607,
13; [18] Cuzzi, J. N.; Hartlep, T.; Weston, B.; Shariff,
K. (2014) 45th LPSC, p.2764; [19] Bec, J. et al 2007,
Phys. Rev. Lett. 98, 084502-1084502-4; [20] Fisher K.
R., Tait A. W., Simon J. I. et al. (2014) 45th LPSC, p.
2711. We thank E. Calzavarini and F. Toschi for their
help in providing the numerical data, and NASA’s Origins of Solar Systems program for supporting this work.
© Copyright 2026