
Pahrump Soils and Comparisons with Previous Aeolian Deposits
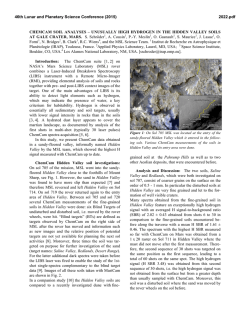
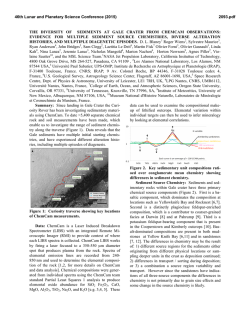
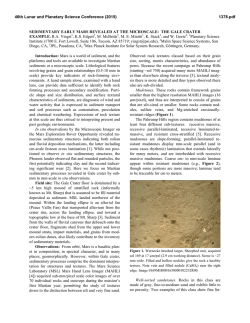
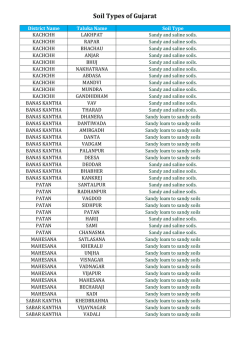
46th Lunar and Planetary Science Conference (2015)
2767.pdf
Pahrump Soils and Comparison with Previous Aeolian Deposits A. Cousin1, S. Schröder2, P.Y. Meslin2, O.
Gasnault2, O. Forni2, B. Clark3, W. Rapin2, J. Lasue2, C. Fressinet4, N. Bridges5, S. Clegg1, A. Fraeman6, J. Blank7,
S. Maurice2, R.C. Wiens1.1LANL, Los Alamos, NM, USA; 2IRAP, Toulouse, France; 3Space Science Institute,
Boulder, CO, USA ; 4NASA Goddard Space Flight Center, Greenbelt, MD, USA; 5Applied Physics Laboratory,
Laurel, MD, USA; 6Caltech, Pasadena, CA, USA ; 7NASA Ames Research Center, CA, USA.
[[email protected]]
Introduction: The ChemCam instrument [1,2]
onboard the Curiosity rover provides for the first time
an opportunity to study martian soils at a submillimeter resolution. In this work, we focus on soil
targets at the Pahrump Hills location (Fig. 1) on sol
801. This location consists of an aeolian deposit, where
fine-grained soils (i.e. with no coarse-grains > 150
microns) have been analyzed. The previous soils targeted by ChemCam from an aeolian deposit before
Pahrump was within Hidden Valley (a partially enclosed topographic basin) that was reached around sol
710. Soils analyzed in this area have shown interesting
results and are discussed in a companion study [3]. The
objective of this study is to compare the Pahrump soils
to previous aeolian deposits, as well as to all the previous fine-grained soils analyzed using the blind sampling mode.
Data: This study focuses on fine-grained soils targeted in the Pahrump area, on the trench made by the
rover on sol 801. Five soils have been sampled: two
1x5 rasters, one 1x10 raster and two depth profiles
with 50 shots each (instead of the 30 shots performed
for typical rasters). Therefore a total of 22 points (700
shots) were used to sample soils in this region. These
are compared to Hidden Valley where 7 soils were
analyzed, with a total of 1650 shots (see [3]). Two
other aeolian deposits were previously sampled by
ChemCam: Rocknest and Dingo Gap. Six soils have
been sampled at Rocknest, with a total of 40 points
sampling fine-grained soils only. Fewer soil samples
have been analyzed at Dingo Gap, with only 10 points
in fine-grained soils. These data obtained in fine soils
are compared to each other but also to the average of
fine-grained soils, obtained using all the data acquired
in fine soils from the blind targets.
The blind targeting mode [4] allows the analysis of
after drives without specifically selecting targets from
survey images. This is very useful on long drives,
where the rover moves every sol, and images of the
after-drive location, normally used for ChemCam
targeting, are frequently not received on the ground
before the next uplink sol. The mast is pointed to -42°
and the observation is taken at the right-side of the
rover. This ensures a good LIBS performance with a
target at a distance of ∼3 m. An RMI image is taken
before and after LIBS for geological context; dark
spectra are also taken before and after LIBS [5]. A
MastCam image is usually also taken for context.
Figure 1: A. Localization map of Pahrump, and other
aeolian deposits visited by Curiosity along the traverse. B.
MCAM mosaic of Pahrump’s trench.
Grain size: At the surface, these four locations
show different grain sizes. The coarsest grains are
observed at Dingo Gap and can be up to gravel in size
(up to 3 mm [6]). Soils encountered in surface at
Rocknest correspond up to very coarse grains (1.5
mm), whereas then at Hidden Valley and Pahrump
soils, grains are at maximum coarse grained (1 mm).
At least one trench was made at each of these aeolian deposits except Hidden Valley. From the images,
we can observe that with depth the grain size seems to
be similar at each location. Soils at depth have finer
grain size than the LIBS diameter (< 500 microns) and
correspond to medium sand and finer particles [6] (Fig.
2).
Chemical analysis
Studies have shown that
some coarser grains are from local inputs whereas
others are from a more global source [7, 8]. Therefore
only fine-grained soils (size < 0.5 mm and thefore
smaller than coarse sand) are taken into account for the
chemical analysis in this study, in order to limit local
inputs.
Table 1 shows the average composition of each fine-grained aeolian deposit. They all have a composition typical of soils, with very low SiO2 content and
low total of major-element oxides. Nevertheless one
difference is noticeable: the CaO content doubles from
46th Lunar and Planetary Science Conference (2015)
Rocknest up to Pahrump (Fig. 3). Dingo Gap and
Rocknest are depleted in CaO compared to all the finegrained soils observed in Blind Targets, whereas Hidden Valley and Pahrump are enriched.
Figure 2 : RMI and MCAM images for some targets
acquired at each aeolian deposit visited by Curiosity
and analyzed by ChemCam.
Table 1: Average composition of each aeolian deposit,
taking into account only fine-grained soils. Composition is
estimated using the PLS technique [9, 10].
Figure 3: Variation of ratio CaO to SiO2 for each aeolian
deposit. The red dashed line corresponds to the average of
all fine-grained soils from the blind targets.
Concerning the minor and trace elements (Fig. 4),
Dingo Gap soils seem to be depleted in these compared
to other soils. Nevertheless this seems consistent, as
this aeolian deposit shows the highest major-element
total. Rocknest soils are the richest in Li and Mn. This
could be explained by local inputs, Rocknest rocks
being enriched in Fe. Hidden Valley and Pahrump soils
are the most enriched in Cl, Sr and Cr, Hidden Valley
showing more Cl and Sr compared to Pahrump. The H
signal is the highest in Hidden Valley soils, and the
next highest in Pahrump soils. A detailed study about
2767.pdf
H in Hidden Valley soils is presented in a companion
study [3]. Pahrump soils are thus distinctive for their
high Ca content (highest in soils so far) and higher Cl
and H signals compared to all the soils (but overall
lower than Hidden Valley).
Figure 4: Cl peak area variations for each aeolian deposit.
Discussion: The sampled aeolian deposit in the
Pahrump area consists of fine-grained (<500 microns)
soils relatively enriched in Cl and H, and the most
enriched in Ca compared to other deposits visited by
the rover. But no obvious correlation has been observed between Ca and Cl, or between Ca and H. Nevertheless a clear one is present between Cl and H.
These observations could lead to several hypothesis;
these soils could be enriched in a) perchlorates, which
could explain the enrichment in Ca, Cl and H, b) in
CaCl2 – this being hygroscopic, the presence of water
is well explained, c) airfall deposits, which would
explain enrichment in Cl and H but maybe not the
higher content of calcium. Nevertheless, SAM revealed that the drilled rock at Confidence Hills (closed
to Pahrump soils) is the poorest in perchlorates compared to Rocknest aeolian deposit [11]. Moreover, it
seems that the aeolian deposits that are the less active
(Rocknest, Dingo Gap) because of their coarser grains
in surface are less enriched in H and therefore in water,
contrary to the finer-grained dunes, more active, that
are richer in water.
Acknowledgement: This work was supported by
NASA’s Mars Exploration Program, the Centre National d’Etudes Spatiales (CNES) in France and by
Mars operations were provided by JPL-Caltech.
References:[1] Wiens et al. 2012, Space Science Reviews 170; [2] Maurice et al. 2012, Space Science
Reviews 170, [3] Schröder et al., 2015, this meeting ;
[4] Cousin et al., 2014, LPSC 45th #1278; [5] Schröder
et al., 2014, Icarus, in press; [6] Wentworth 1922, J.
Geol. 30, 377–392; [7]Meslin et al., 2013, Science
341; [8] Cousin et al., 2014, Icarus in press; [9] Wiens
et al., 2013. Spec. Chem. Acta B. 82, 1; [10] Clegg et
al., 2009. Spectrochim. Acta, B, 64, 79. [11] Archer et
al, this meeting.

© Copyright 2026