
his first fMRI paper - Social Brain in Action Laboratory
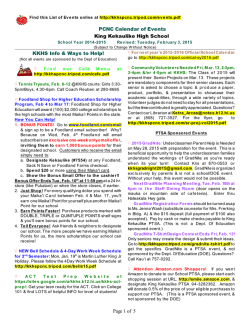
The Journal of Neuroscience, January 28, 2015 • 35(4):1561–1572 • 1561
Behavioral/Cognitive
Dynamic Modulation of the Action Observation Network by
Movement Familiarity
Tom Gardner,1 Nia Goulden,1 and X Emily S. Cross1,2
1School of Psychology, Bangor University, Bangor, Gwynedd, LL57 2AS, United Kingdom, and 2Department of Social and Cultural Psychology, Donders
Institute for Brain, Cognition and Behaviour, Radboud University Nijmegen, Nijmegen, 6500HE, The Netherlands
When watching another person’s actions, a network of sensorimotor brain regions, collectively termed the action observation network
(AON), is engaged. Previous research suggests that the AON is more responsive when watching familiar compared with unfamiliar
actions. However, most research into AON function is premised on comparisons of AON engagement during different types of task using
univariate, magnitude-based approaches. To better understand the relationship between action familiarity and AON engagement, here
we examine how observed movement familiarity modulates AON activity in humans using dynamic causal modeling, a type of effective
connectivity analysis. Twenty-one subjects underwent fMRI scanning while viewing whole-body dance movements that varied in terms
of their familiarity. Participants’ task was to either predict the next posture the dancer’s body would assume or to respond to a non–
action-related attentional control question. To assess individuals’ familiarity with each movement, participants rated each video on a
measure of visual familiarity after being scanned. Parametric analyses showed more activity in left middle temporal gyrus, inferior
parietal lobule, and inferior frontal gyrus as videos were rated as increasingly familiar. These clusters of activity formed the regions of
interest for dynamic causal modeling analyses, which revealed attenuation of effective connectivity bidirectionally between parietal and
temporal AON nodes when participants observed videos they rated as increasingly familiar. As such, the findings provide partial support
for a predictive coding model of the AON, as well as illuminate how action familiarity manipulations can be used to explore simulationbased accounts of action understanding.
Key words: action observation network; action perception; dynamic causal modeling; fMRI; parietal; premotor
Introduction
Perceiving and interacting with others form the foundation of
human social behavior. When watching others in action, we readily extract information about their goals and intentions (Hamilton and Grafton, 2006; Hamilton, 2013) and predict their
subsequent behavior in a rapid, online fashion (Blakemore and
Frith, 2005; Falck-Ytter et al., 2006). Neuroimaging studies identify frontal, parietal, and occipitotemporal regions collectively
termed the Action Observation Network (AON) (Cross et al.,
2009; Grafton, 2009; Keysers and Gazzola, 2009; Caspers et al.,
Received July 17, 2014; revised Nov. 14, 2014; accepted Nov. 18, 2014.
Author contributions: E.S.C. designed research; T.G. and E.S.C. performed research; T.G., N.G., and E.S.C. analyzed
data; T.G. and E.S.C. wrote the paper.
This work was supported by Netherlands Organisation for Scientific Research Veni Award 451-11-002, Marie
Curie Career Integration Grant PCIG11-GA-2012-322256, and Economic and Social Research Council Future Research
Leaders Award ES/K001892/1 to E.S.C. We thank Riley Watts from the Forsythe Company for stimulus construction;
Floris de Lange for discussions about study design; Paul Gaalman for assistance with scanner operation; and
Paul Downing, Richard Ramsey, and two anonymous reviewers for helpful comments on previous versions of
this manuscript.
The authors declare no competing financial interests.
This article is freely available online through the J Neurosci Author Open Choice option.
Correspondence should be addressed to Dr. Emily S. Cross, School of Psychology, Bangor University, Bangor,
Gwynedd, LL57 2AS, UK. E-mail: [email protected].
DOI:10.1523/JNEUROSCI.2942-14.2015
Copyright © 2015 Gardner et al.
This is an Open Access article distributed under the terms of the Creative Commons Attribution License
(http://creativecommons.org/licenses/by/3.0), which permits unrestricted use, distribution and reproduction in any
medium provided that the original work is properly attributed.
2010) as critically involved in processing others’ actions. Previous
research demonstrates greater AON activity when watching visually or physically familiar actions (Buccino et al., 2004; CalvoMerino et al., 2005; Cross et al., 2006; Vogt et al., 2007; Shimada,
2010; Press, 2011). These findings support a theory of action
understanding that posits the AON is tuned to respond most to
actions that are “like me” (Meltzoff, 2007) via experience-driven
simulation mechanisms (Sinigaglia, 2013). However, most studies into how observers’ prior action experience or familiarity impacts AON engagement have used magnitude-based approaches,
investigating which brain regions show increased or decreased
response amplitudes based on familiarity with an observed
action. Some have suggested that such analyses might not be
sufficient to construct a nuanced or complete picture of how
sensorimotor brain regions support action understanding
(Schippers and Keysers, 2011). One promising approach for further characterization of the relationship between familiarity and
AON engagement is to examine functional connectivity between
individual AON nodes during action observation, and ask how a
particular task modulates these connections (Smith, 2012).
Prior theoretical work on the AON can inform predictions
about how familiarity might modulate connectivity when observing others in action. Predictive coding models of AON function
(Keysers and Perrett, 2004; Kilner et al., 2007a,b; Gazzola and
Keysers, 2009; Schippers and Keysers, 2011) are predicated on the
use of perceptuomotor maps to predict and interpret observed
Gardner et al. • Modulation of AON by Movement Familiarity
1562 • J. Neurosci., January 28, 2015 • 35(4):1561–1572
Figure 1. An illustration of the experimental trials. The prompt screen was shown at the beginning of each block (10 trials) to orient participants’ attention to the dots or postures. A fixation cross
was shown at the start of each trial, followed by a video. This was followed by a question about the dot color or which posture should follow, depending on the block type. The response screen was
displayed for 2 s; and if participants responded before the end of the 2 s window, a blank screen would remain until the 2 s window ceased.
actions (Lamm et al., 2007; Schubotz, 2007; Urgesi et al., 2010).
According to this account, forward models facilitate processing
of familiar actions through use of stored action representations
and propagate information in a top-down manner from premotor to parietal to occipitotemporal regions. Unfamiliar actions
are processed via a bottom-up, data-driven approach, where information propagates anteriorly from occipitotemporal to parietal to premotor cortices. To test whether and how action
familiarity modulates effective connectivity among the component regions of the AON, we used dynamic causal modeling to
test hypotheses under a predictive coding model of action observation. Our task involved observing whole-body movements followed by a short occlusion, after which participants chose which
posture should follow in the movement sequence (similar to
Stadler et al., 2011). By using an offline rating task, we examined
how this noncategorical measure of familiarity impacts AON engagement (compare Cross et al., 2013; Liew et al., 2013). According to a predictive coding model, dynamic causal modeling
(DCM) should demonstrate that increasingly familiar movements are associated with decreased feedforward influence from
sensory/posterior nodes, as prediction errors are minimized
when viewing more familiar actions, whereas feedback influence
from anterior to posterior nodes should increase.
Materials and Methods
Participants
Twenty-one adult volunteers (mean age 21.95 years, SD ⫽ 3.02 years)
with normal or corrected to normal vision were recruited from the student population at Radboud University Nijmegen. Of this sample, 13
were female; 17 right-handed, 2 left-handed, and 2 ambidextrous based
on the Edinburgh Handedness Questionnaire (Oldfield, 1971). All participants’ data were used for the GLM analyses, and a subsample of 19
participants was used for the DCM analysis (see Definition of ROIs). All
participants spoke English fluently and had no history of psychiatric or
neurological disorders. All participants provided written informed consent, and the study procedures were approved by local ethics committees
at both Bangor University and the Donders Centre for Cognitive Neuroimaging at Radboud University Nijmegen. Participants were reimbursed
for their time with €15.
Experimental design and stimuli
The paradigm included two task manipulations that fell within a 2 ⫻ 2
factorial design. The two factors were familiarity (levels: familiar and
unfamiliar) and task (levels: posture prediction or dot color tracking).
Action stimuli were consistent across the two tasks (only the instructions
changed).
Stimuli construction and selection
Stimuli were created by filming a professional dancer performing a range
of improvised and choreographed movement in a contemporary dance
style that ranged from extremely simple (and thus relatively predictable)
to much more complex (and much less predictable). To ensure these
stimuli encapsulated a broad range of more and less familiar actions for
dance-naive observers, we first piloted 157 video clips (each with a duration of 6 s) with a separate sample of 23 participants. From this pilot
study, we selected the 30 movement stimuli rated as most familiar, and
the 30 movement stimuli rated most unfamiliar by pilot participants.
This split allowed us make a stimuli set that should subjectively differ
across the familiarity spectrum.
Prediction task
In the Prediction condition, participants were asked to monitor the
movements of the agent in preparation for a two-way forced choice
question asking them to choose which posture should follow on in the
video clip after an occlusion of 0.6 s. The forced choice consisted of one
coherent still frame (chosen from 0.6 s after when the video was occluded) and one that was plausible to the video but not chronological to
the flow based on the occlusion duration (for an example, see Fig. 1).
Attentional control task
A control task was built into paradigm so that, for half the trials, participants were asked to monitor the color of a dot that would randomly
appear on the screen in different locations and in different colors (either
red or green). The size of the dots was 5 mm and appeared at a rate of 1
per second (to clarify, colored dots appeared during all video stimuli in
the experiment, but participants were asked to attend to them during
only half the trials). When participants were performing the attentional
control task, they were asked to monitor the color of the dot throughout
the duration of the video clip. When the video clip ended, a question
appeared asking participants to specify the color of the last dot they saw
on the screen.
Postscanning ratings
After the fMRI experiment, participants rated the videos on a Likert scale
of 1–9 as to how familiar they found the movements within each video
(0 ⫽ very unfamiliar; 5 ⫽ neutral; 9 ⫽ very familiar). The dots were
removed from these videos, and the response window was not fixed. Still,
participants were encouraged to answer as quickly and accurately as they
could. The concept of familiarity was explained by the experimenter as
how easily participants would be able to say what move should come next
in each video, and participants were made explicitly aware that familiar-
Gardner et al. • Modulation of AON by Movement Familiarity
ity did not mean which videos had been recognized or remembered from
the scanning experiment. Each video was displayed only once and in a
randomized order.
To ensure that familiarity ratings and number or speed of movements
were not confounded, we calculated the mean “motion energy” of each
video stimulus based on a previously developed algorithm (Cross et al.,
2012). Once we obtained an objective numeric score for how much pixel
displacement each video contained, we computed a Pearson productmoment correlation coefficient to assess the relationship between the
motion energy of each video and the average familiarity rating given by
participants. The results revealed no correlation between the two variables (r ⫽ ⫺0.06, n ⫽ 60, p ⫽ 0.646). This suggests that the participants
did not rate the stimuli based on how much movement each stimulus
contained; instead, they were rating them on a more holistic, subjective
view of familiarity.
fMRI design and procedure
Each participant completed one fMRI session that followed an eventrelated design. Participants completed two runs, lasting 13 min and containing 60 trials each. Trials were blocked into more familiar and less
familiar stimuli (based on pilot data), and both kinds of stimuli were
presented for both task conditions. At the beginning of the first run and
the end of the second run, a 15 s rest period occurred. At the start of each
block, a prompt (1 s) indicated which task participants were to perform
for the upcoming block of trials ( predicting postures or reporting on the
dot color). The ensuing blocks, consisting of 10 trials, were all from the
same condition. At the start of each trial, a white fixation cross appeared
on the center of the screen for 1.8 s, followed by a video clip (6 s). Based
on the prompt at the start of the block, participants had 2 s to respond to
the task and identify which still frame they thought would follow or
identify the color of the last dot on the screen. This response period lasted
for 2 s. If a button was pressed before 2 s had elapsed, the screen changed
to a blank black screen until the 2 s time limit was reached. The order of
the blocks and the video shown in each trial were pseudo-randomized so
that each video was shown once in each of the conditions.
Stimulus presentation and response collection were performed using
Psychophysics Toolbox (version 3) via MATLAB R2010a (MathWorks).
The stimuli were projected onto a mirror above the head coil from a
projector outside of the scanner. Participants made their responses with
the forefinger and middle finger of the right hand, and responses were
recorded from a custom-made MR-compatible button box.
Data acquisition was conducted at the Donders Centre for Cognitive
Neuroimaging at Radboud University Nijmegen. Functional images
were acquired on a 3.0T Siemens MRI scanner using a 32-channel head
coil. Functional images were acquired covering the whole brain using an
echo-planar imaging (EPI) sequence (35 axial slices, ascending slice acquisition, repetition time ⫽ 2000 ms, echo time ⫽ 30 ms, 90° flip angle,
matrix ⫽ 64 ⫻ 64, slice thickness: 3 ⫻ 3 ⫻ 3 mm, field of view (FOV): 224
mm). Before the functional run, 196 two-dimensional anatomical images (256 ⫻ 256 pixel matrix, T1-weighted) were obtained for normalization purposes.
fMRI data preprocessing and statistical analysis
A total of 338 volumes per participant per run were used in the analysis.
Because of a technical error, two participants’ data were not collected
correctly at the start of the first functional run, resulting in a reduced
number of volumes for these participants (615 volumes in total compared with 676 for all other participants). Data were analyzed using
Statistical Parametric Mapping (SPM8: Wellcome Trust Centre for Neuroimaging, London) (Friston, 2007) implemented using MATLAB
R2010a (MathWorks). The data were first realigned and then slice-time
corrected and preliminarily preorientated within standard stereotaxic
space as defined by the MNI (Friston, 2007). This preorientation allowed
for a better spatial normalization to the MNI template. Participants’ EPI
images were then coregistered to their T1 anatomical scans, which were
then spatially normalized to standard stereotaxic space. The spatially
normalized EPI images were filtered using a Gaussian kernel of 8 mm
full-width at half maximum in the x, y, and z axes. A design matrix was
fitted for each subject with a single regressor for all trials from the pre-
J. Neurosci., January 28, 2015 • 35(4):1561–1572 • 1563
diction task and a single regressor for all trials from the colored dottracking task. A parametric regressor column was added to the design
that included participants’ individual ratings of each video from the
posture prediction task (assigned outside the fMRI session). In modeling
a single parametric effect of familiarity, we are effectively modeling the
main effects of action observation and familiarity but not their interaction. The fixation, prompt, and response were fitted as noise regressors
for each individual and combined into a single regressor of noninterest.
Each trial was then modeled as a boxcar function for the duration of the
video. For the GLM analyses, a cluster threshold of k ⫽ 10 and a p value
of ⬍0.005 (uncorrected) was set to best observe the sensitive effects of the
parametric analysis.
Although participants were encouraged to use the entire scale when
rating the videos, many participants used a reduced range of the 9 point
scale (for example, 2– 8). Because we were interested in using each individual’s ratings as a parametric regressor in the group fMRI model, it was important to equalize the relative rating scales across participants. To achieve
this, participants’ ratings were standardized via a z transformation.
The GLM neuroimaging analyses were designed to achieve two
main objectives
Neural processes engaged during action prediction. The first analysis identified brain regions that responded to the task demands to predict movements
by evaluating the task-based contrast of posture prediction ⬎ attentional
control task. This contrast allowed us to explore the effects of online monitoring of an action while controlling for familiarity of the movements.
Parametric effects of increasing familiarity of an observed action. The
second analysis allowed us to explore the sensitive measure of subjectspecific (standardized) ratings of observed movements on AON activity.
This parametric contrast was used to test the hypothesis that AON regions
should show greater activity as a function of increasing familiarity. Unlike
contrasts that would use segmentation of the stimuli into familiarity categories, our measure allows us to capitalize upon individual differences in familiarity ratings to identify brain regions that become increasingly or
decreasingly active the more familiar a movement is rated by an observer.
DCM
Evaluation. DCM is a method of analyzing effective connectivity that uses
a bilinear model of neural population dynamics, combined with a hemodynamic model, which aims to describe the neural activity in the measured BOLD response (Friston et al., 2003). By modeling feasible
neuronal parameters, DCM aims to make a modeled BOLD response
that is similar to the actual experimentally manipulated BOLD signal.
The neural dynamics model created using DCM is then combined with a
hemodynamic forward model that incorporates a balloon model (Buxton et al., 1998). The hemodynamic model provides a transformation of
how the neural dynamics would propagate as a BOLD response, estimated via a standard Bayesian approach (variational Laplace). The fit of
the combined neural model and hemodynamic forward model is estimated via a Bayesian approach, which uses conservative shrinkage priors
for the coupling parameters.
A model is specified to have the fit to the data estimated by the previously mentioned routine. The input into the estimation procedure is
three matrices (for bilinear DCMs, but see also Nonlinear DCMs)
(Stephan et al., 2008). The first is the endogenous connection strengths
(the A matrix), which represents the connectivity between the regions of
the model, sometimes called the fixed connectivity. The B and C matrices
represent the experimentally manipulated conditions. Matrix B represents the modulation of an external input on a fixed connection, which
describes the change in the value of the effective connectivity for a connection under a particular condition. The C matrix represents the input
into the system, which describes the activity that is perturbing, or creating activity, in the system. This equation models the state changes by
known inputs. By user-created variations of combinations of fixed connectivity, modulatory influences, and inputs, multiple DCMs can be created for the same set of regions and then compared with which fits the
data best (while controlling for complexity).
Hypothesis. The experimental hypothesis tested in the current study is
that differential connectivity will exist between the three core AON re-
Gardner et al. • Modulation of AON by Movement Familiarity
1564 • J. Neurosci., January 28, 2015 • 35(4):1561–1572
gions based on subjective familiarity ratings made by the participants.
Moreover, we expected that more familiar actions would increase the
influence of top-down connections (IFG-IPL-MTG) while decreasing
the corresponding influence of bottom-up connections (MTG-IPLIFG). Mechanistically, this corresponds to increasingly precise or confident top-down predictions afforded by familiar actions that, in our
model, would be encoded by the modulatory effects of familiarity on the
B parameters.
Preprocessing for DCM. To evaluate the effective connectivity of this
network using DCM, volumes from the two separate runs were concatenated to form one single time series per participant. We repeated the
GLM analysis in SPM12b to exploit recent developments in dynamic
causal modeling (see below). The GLM was effectively the same as described above. However, in this case, we adjusted the data for the main
effect of action observation. We then used the effect of stimulus movement as a driving input to the action observation network, whereas familiarity was used to modulate extrinsic (between node) connectivity.
Effectively, this models the effect of familiarity in terms of contextsensitive changes in coupling induced under action observation. Notice
that we effectively removed responses to movement videos during the
attend dots conditions, enabling us to focus on the effect of familiarity
during action observation. These will be subsequently referred to as the
movement effect. The remaining conditions were modeled as a nuisance
variable to ease DCM model specification (Stephan et al., 2010). These
preprocessing steps allowed us to examine the effects of familiarity of
actions on the effective connectivity of the system.
We allowed for stochastic effects within the model to more accurately
model noise (Li et al., 2011). We also centered the input into the node.
This gives the input a mean of zero and means that modulating parameters can increase and decrease the fixed connectivity, as opposed to
simply increasing it as when the input is always positive. To allow for
biological plausibility, we opted for two-state models that allow for both
excitatory and inhibitory connectivity (Marreiros et al., 2008). Because
we used a two-state DCM, we were able to enforce positivity constraints
on the connection strengths and lend our interpretation a greater biological plausibility or validity. This is because all connection strengths and
two-state DCMs are excitatory, where intrinsic (within node) excitatory
connections activate inhibitory neurons to ensure stability of the modeled network. Crucially, the coupling strengths are log scale parameters.
In other words, they represent the log of the scaling of an effective connection, such that a log of zero corresponds to a 100% scaling. This
means that a negative log scaling parameter corresponds to a weaker
connection and a positive parameter corresponds to a stronger connection. We will report the parameter estimates in log space (and perform T
tests on the log scaling parameters). This additional step allowed us to
further examine the proposal by Keysers and Perrett (2004) that the MTG
would exhibit inhibitory responses to familiar stimuli as well as help us
understand how it relates to the predictive coding model proposed by
Kilner et al. (2007b).
To identify the winning model (in this case, the model that best explains the system of interest), we used random-effects Bayesian model
selection (BMS) to account for outliers (Stephan et al., 2009). This Bayesian approach used for DCM gives each model an exceedance probability,
the probability that a model is more likely than any other model tested
(subject to a trade-off between model fit and complexity). The family
comparison technique pools model evidence by the user-defined groups,
where all models within a given group share a common feature (Penny et
al., 2010).
System of interest
Definition of ROIs. The coordinates for the ROIs were identified from the
parametric contrast of increasing familiarity (for coordinates, see Table
1). The time series for the ROIs were taken from the subject level
F-contrast of movement ⬎ implicit baseline as this was the most revealing contrast. This contrast revealed all regions that were active (twotailed) when viewing movement, including the defined coordinates for
MTG, IPL, and IFG in the left hemisphere.
All ROIs were extracted by locating the nearest local maximum voxel
to the coordinates of the group contrast of increasing familiarity. Nine-
Table 1. The coordinates used for the ROIs
x
y
z
Region
BA
Cluster size
⫺48
⫺51
⫺45
⫺31
⫺58
8
34
⫺2
25
Inferior parietal lobule
Middle temporal gyrus
Inferior frontal gyrus
40
39
44
141
60
12
teen of the 21 participants showed significant activity within the search
radius of 16 mm. The 2 remaining participants were excluded from the
connectivity analysis. The ROI time series for each region, for each participant, was extracted by using the eigenvariate (threshold of p ⬍ 0.05),
with sphere radius 8 mm and adjusted for effects of no interest.
Definition of network models. To test our hypothesis, all models were
manipulated with regard to their modulation and direct inputs but not
endogenous connectivity. To counter the problem of expanding model
space, the endogenous connectivity of all models was anatomically informed by the theoretical models from which our hypothesis was based
(Keysers and Perrett, 2004; Kilner et al., 2007b). The connections between the nodes were reciprocal between MTG and IPL and reciprocal
between IPL and IFG (Fig. 2). This limiting of model space allowed us to
examine the modulatory effects of increasing familiarity within a refined
selection of models. These modulatory effects (B parameters) were tested
on all extrinsic (between-node) excitatory connections and all combinations. For the direct inputs to the system, we modeled the movement
effect. We tested the hypothesis of direct input into the system through
MTG as well as direct input into IFG for all variants as well as direct input
into both of these regions, resulting in 45 models per person, with a total
of 855 models overall (Fig. 2).
Results
Whole-brain GLM analyses
Neural processes engaged during action prediction
To address how action familiarity impacts AON activity using
random-effects analyses, we report two contrasts. The first contrast identified brain regions more engaged when participants
watched whole-body movements with the intention to predict
which posture should follow after an occlusion, compared with
watching the same videos but attending to the color of a dot that
was superimposed on top of the dancer (Fig. 3).
This analysis revealed significant activity in M1 and the anterior regions of STG (for all peak coordinates from this contrast,
see Table 2). This contrast shows the effects of the online updating of observed movements in anticipation of the decisionmaking period. The activity seen in the motor regions could
perhaps represent the fact that, even though dance movements
were observed in both conditions, the posture prediction task
elicits more extensive engagement of motor cortical activity. Specifically, maintaining representations of actions so that they may
be simulated during a period of occlusion may require more
activity within primary motor regions (Kilner et al., 2009; Stadler
et al., 2011; Cross et al., 2013; Hari et al., 2014; compare mu
suppression in this region during action observation). Interestingly,
activity within higher-level occipital cortices (V4v and V3v) also
emerged from this contrast. This pattern of activity could reflect
increased visual attention demands of biological motion tracking, as
opposed to what was required for the dot-tracking task.
Evaluated regional activations sensitive to increasing familiarity
The second random-effects analysis evaluated brain regions sensitive to the increasing familiarity of a complex whole-body
movement (for all peak coordinates from this contrast, see Table
3). This contrast allows us to locate the regions of interest for the
DCM analysis as well as assess general effects of perceived action
familiarity based on participants’ individual subjective ratings of
each action stimulus. As can be seen in Figure 4, the parametric
Gardner et al. • Modulation of AON by Movement Familiarity
J. Neurosci., January 28, 2015 • 35(4):1561–1572 • 1565
Figure 2. The model space. A, The endogenous (fixed) connectivity between the three regions. B, The three families of inputs (movement) tested: MTG, IFG and MTG, and IFG. For each of these
three families, 15 models, shown in C, were tested to identify the modulation of increasing familiarity, resulting in 45 models for each participant. Solid lines indicate fixed connectivity. Dashed
arrows indicate input into the system by movement. Dotted arrows indicate modulations on the given connection by increasing familiarity.
contrast of increasing familiarity reveals activity within bilateral
premotor, parietal cortices, and left temporal cortices. This contrast suggests that, as the movements are rated as increasingly
familiar, the stronger the response becomes within core AON
regions. These results add support to the view that the more
familiar an observed action is, the stronger activity is within the
AON (Buccino et al., 2004; Calvo-Merino et al., 2005; Cross et al.,
2006). The three nodes in the left hemisphere form the ROIs for
the DCM analysis, which evaluates their effective connectivity
during action observation and how increasing familiarity modulates connections within this triad of brain regions.
Effective connectivity analyses
The DCMs were created using the three ROIs listed in Table 1:
MTG, IPL, and IFG (all in the left hemisphere). The input(s) into
the system was movement, and the modulations were increasing
Gardner et al. • Modulation of AON by Movement Familiarity
1566 • J. Neurosci., January 28, 2015 • 35(4):1561–1572
Figure 3.
The GLM results of the main effect of performing the posture prediction task compared with the dot color identification task. All p values ⬍0.005; k ⫽ 10 voxels.
Table 2. Localization of averaged BOLD response for the posture prediction versus dot tracking tasks
MNI coordinates
Anatomical region
BA
x
y
z
Putative functional name
t value
Cluster size
pcorrected value
Postures versus dots
R postcentral gyrus
R postcentral gyrus
R superior occipital gyrus
R lingual gyrus
R rolandic operculum
R Heschl’s gyrus
R postcentral gyrus
R mid orbital gyrus
R mid orbital gyrus
R superior medial gyrus
L postcentral gyrus
L postcentral gyrus
L superior parietal lobule
R superior frontal gyrus
R middle cingulate cortex
R supplemental motor area
R parahippocampal gyrus
L middle occipital gyrus
L middle temporal gyrus
L medial temporal gyrus
L inferior parietal lobule
L superior temporal gyrus
L superior temporal gyrus
R caudate nucleus
L caudate nucleus
L caudate nucleus
L inferior parietal cortex
L amygdala
R amygdala
R amygdala
L superior frontal gyrus
L posterior cingulate cortex
1
2
17
18
41
41/42
1
10
32/10
10
2
2
31
6
6
6
19/30
18
22
22/37
19
42
42/43
23
23
23
40/7
25
25
25
9
31
27
27
21
24
48
45
63
6
15
9
⫺27
⫺21
⫺15
18
15
3
24
⫺24
⫺51
⫺42
⫺30
⫺45
⫺60
24
⫺18
⫺18
⫺42
⫺48
⫺21
21
⫺12
⫺6
⫺43
⫺37
⫺100
⫺88
⫺25
⫺22
⫺13
50
50
59
⫺40
⫺43
⫺25
⫺10
⫺22
⫺16
⫺46
⫺88
⫺40
⫺46
⫺55
⫺31
⫺28
2
⫺1
14
⫺67
⫺73
⫺1
⫺1
53
⫺52
70
55
7
⫺11
22
10
34
⫺14
⫺2
10
58
70
43
67
46
67
16
1
⫺2
1
13
19
16
28
28
22
49
34
⫺14
⫺11
31
25
M1
M1
V3v
V4v
S2
PAC/STG
M1
MPFC
ACC
MPFCv
M1
M1
PCC
PMd
PMd
SMAd
—
MOG
MTG
MTG/STS
IPL
pSTG
STG
—
—
—
IPC
AMYG
AMYG
AMYG
SFG
PCC
7.25
5.13
6.77
3.25
6.70
5.30
4.34
5.72
5.40
4.34
5.50
5.10
5.46
5.16
5.01
4.71
4.98
4.66
4.48
3.00
4.47
4.30
2.96
4.24
4.02
3.29
4.02
3.77
3.75
3.61
3.49
3.46
326
—
90
—
345
—
—
415
—
—
158
—
32
382
—
—
102
76
42
—
91
45
—
96
82
—
51
—
34
28
25
43
0.032
0.140
0.032
0.744
0.032
0.135
0.284
0.129
0.129
0.284
0.129
0.140
0.129
0.140
0.145
0.214
0.145
0.219
0.268
0.285
0.915
0.285
0.344
0.720
0.344
0.462
0.462
0.529
0.529
0.627
0.285
0.915
MNI coordinates of peaks of relative activation within regions responding to the main effects of task: postures versus dots. Results were calculated at puncorrected ⬍0.005; k ⫽ 10 voxels. Up to 3 local maxima are listed when a cluster has
multiple peaks more than 8 mm apart. V4v, Ventral visual area 4; S2, sensorimotor area; PAC, primary auditory cortex; STG, superior temporal gyrus; M1, primary motor cortex; MPFC, medial prefrontal cortex; ACC, anterior cingulate cortex;
MPFCv, ventral medial prefrontal cortex; PCC, posterior cingulate cortex; PMd, dorsal premotor cortex; SMAd, dorsal supplemental motor area; MOG, middle occipital gyrus; MTG, middle temporal gyrus; STS, superior temporal sulcus; pSTG,
posterior superior temporal gyrus; AMYG, amygdala; IPL, inferior parietal lobule; SFG, superior frontal gyrus; IPC, inferior parietal cortex.
Gardner et al. • Modulation of AON by Movement Familiarity
J. Neurosci., January 28, 2015 • 35(4):1561–1572 • 1567
Table 3. Localization of averaged BOLD response for observation of actions rated as increasingly familiar
MNI coordinates
Anatomical region
BA
x
y
z
Putative functional name
t value
Cluster size
pcorrected value
Increasing familiarity
Left supramarginal gyrus
Left inferior parietal lobule
Left inferior parietal lobule
Left middle temporal gyrus
Left superior frontal gyrus
Left superior parietal lobule
Left superior parietal lobule
Right superior parietal lobule
Right angular gyrus
Right angular gyrus
Right inferior frontal gyrus (pars opercularis)
Right postcentral gyrus
Right inferior parietal lobule
Left inferior frontal gyrus (pars opercularis)
40
7/40
7/40
39
6
7
7
7
7/19
7
44
2
40
44
⫺48
⫺33
⫺48
⫺51
⫺18
⫺21
⫺15
18
30
27
33
48
36
⫺45
⫺31
⫺37
⫺37
⫺58
11
⫺67
⫺67
⫺67
⫺70
⫺61
11
⫺28
⫺43
8
34
40
52
⫺2
61
46
52
61
37
43
28
52
55
25
SmG
IPL
IPL
MTG
SFG
SPL
SPL
SPL
AG
AG
IFG
M1
IPL
IFG
4.02
3.99
3.80
3.96
3.74
3.74
3.63
3.68
3.49
3.27
3.63
3.41
3.02
3.24
141
—
—
60
10
83
—
96
—
—
13
25
—
12
0.837
0.837
0.837
0.837
0.837
0.837
0.837
0.837
0.881
0.897
0.837
0.881
0.993
0.897
MNI coordinates of peaks of relative activation within regions responding to the parametric effects of increasing familiarity. Results were calculated at puncorrected ⬍0.005; k ⫽ 10 voxels. Up to 3 local maxima are listed when a cluster has
multiple peaks more than 8 mm apart. SmG, Supramarginal gyrus; IPL, inferior parietal lobule; MTG, middle temporal gyrus; SFG, superior frontal gyrus; SPL, superior parietal lobule; AG, angular gyrus; IFG, inferior frontal gyrus; M1, primary motor cortex.
Figure 4.
The GLM results of the parametric rating contrast for the posture prediction task. All p values ⬍0.005; k ⫽ 10 voxels.
familiarity. First, we identify where there is input into the system
using a family comparison analysis. Next, we report the BMS
analysis of the models within the winning family. Finally, we used
Bayesian model averaging (BMA) to present the parameter estimates of the winning family of models.
Family level inference
As described in Materials and Methods, we classified our 45 models into three families based on input into the system. To recap,
the families were MTG input, IFG input, and input into both
MTG and IFG.
The results of the family comparison of inputs showed that
there is unequivocally strong evidence for the family with input
into both regions of the system. The exceedance probability of this
family was (almost) 1, implying that there is a near certainty that this
class of input explains the network. This identification of the inputs
into the system allowed us to concentrate our model comparison on
the 15 models with MTG and IFG input into the system.
BMS and BMA within optimal family
After assessing the existence of input parameters with family
comparisons, we were then able to perform a BMS analysis on the
15 models within the MTG and IFG input family. As shown in
Figure 5A, there is a clear optimal model, model 15.
The optimal model was the model that had modulation by increasing familiarity on all fixed connections (Fig. 5C). The probability of this model was 0.72 (Fig. 5B), which is a high probability. The
next best model, model 6, had an exceedance probability of 0.11.
In relation to our hypothesis that there would be greater topdown modulation for increasing familiarity, a winning model
that had fully modulated connections would neither confirm nor
refute this hypothesis. Although the posterior probability of the
winning model was 0.72, this does not provide definitive evidence
for this and only this model. Therefore, we used BMA to obtain
estimates of effective connectivity (and their modulation) that
accommodate uncertainty about models (Stephan et al., 2010). It
is not always possible to find sufficient evidence for one model
1568 • J. Neurosci., January 28, 2015 • 35(4):1561–1572
Gardner et al. • Modulation of AON by Movement Familiarity
Figure 5. BMS on the 15 models in the MTG and IFG input family. A, Exceedance probability of all models. There is one clear winner, model 15, which had the posterior probability of 0.72. B, Model
15, the winning model, had modulation of increasing familiarity on all fixed connections.
being the optimal model. Depending on which model is declared
the best fitting, different inferences will be made regarding the
behavior of a system. BMA helps to resolve this ambiguity by
averaging over the models, accounting for the model evidence in
the averaging; therefore, models with a low probability will not
contribute very much to the BMA. This BMA also incorporates
Bayesian parameter averaging over subjects to provide robust estimates of quantitative changes in coupling that are weighted by our
relative confidence in the 15 models considered. The results of the
BMA for the IFG and MTG input family are shown in Figure 6.
Upon examination of the effects of movement on the network, the BMA results demonstrate that all the connections are
significantly ⬎0, supported by a one-sample t test, shown in Table 4 (the use of t tests provides a way of scoring the standardized
effects sizes in relation to intersubject variability). Beginning with
the inputs into the network, the coupling strengths are relatively
weak and inhibitory. The reason for this may be that we allowed
for stochastic effects, which means that the endogenous connec-
tivity within the system is not reliant on a deterministic input into
the network (Li et al., 2011). The inclusion of stochastic effects
accounts for an unmodeled node modulating the input, meaning
that the endogenous connectivity is not affected by weak inputs.
The endogenous connections between the nodes show us that the
anatomical basis of our models was correct; movement reveals connections. The reciprocal connections between IPL and IFG appear
stronger than the connections between MTG and IPL. It should be
noted that the movement input contained videos that were rated as
both familiar and unfamiliar, so these coupling parameters can be
considered the average of the two polarities. Therefore, to understand these coupling strengths, we next investigated the modulatory
effects of increasing familiarity.
The impact on the network’s modulatory connectivity
from increasing familiarity can be seen in Figure 6B. These
modulatory connections were then placed into a one-sample t
test that revealed that not all significantly differed from zero
(Table 5). Only the modulatory influences between MTG-IPL
Gardner et al. • Modulation of AON by Movement Familiarity
J. Neurosci., January 28, 2015 • 35(4):1561–1572 • 1569
Figure 6. The resulting BMA of the winning model in Figure 5. A, The input and fixed connectivity of the model, subject to the input of movement. The dashed semicircled arrows indicate
self-connections. Solid arrows indicate the endogenous connectivity. Straight dashed lines indicate the input into the system. B, The modulatory effects of increasing familiarity on the fixed
connections. In all cases, the numerical value represents the connection strength/modulation in log scaling parameters.
and between IPL-MTG were significantly different from zero
across individuals.
The modulatory effect of increasing familiarity on the fixed
connection reveals several noteworthy findings described here
and reconciled in the Discussion. The first is that, when a video is
rated as increasingly familiar, the connection from MTG to IPL is
attenuated. The sign change indicates that the bottom-up connection is attenuated by more familiar movements, thus supporting our hypothesis and assumptions made by a predictive coding
model. The second finding is an attenuation of the connection
Gardner et al. • Modulation of AON by Movement Familiarity
1570 • J. Neurosci., January 28, 2015 • 35(4):1561–1572
Table 4. Results of a one sample t test for coupling parameters of endogenous
activity of movement: endogenous connectivity
From
To
IFG
IPL
MTG
IFG
IPL
MTG
⫺0.3941 (0.0267)*
( p ⬍ 0.0001)
0.6069 (0.0108)*
( p ⬍ 0.0001)
—
0.6991 (0.0107)*
( p ⬍ 0.0001)
⫺0.3510 (0.0285)*
( p ⬍ 0.0001)
0.2574 (0.0100)*
( p ⬍ 0.0001)
—
0.2119 (0.0141)*
( p ⬍ 0.0001)
⫺0.3008 (0.0220)*
( p ⬍ 0.0001)
Data are mean (SEM) for each connection. —, Not investigated. The threshold was set at p ⬍ 0.007 (corresponding
to an FDR-corrected threshold of p ⬍ 0.05 for multiple comparisons).
*Significant connection.
Table 5. Results of a one sample t test for coupling parameters of modulatory
activity of increasing familiarity: modulatory
From
IFG
IPL
MTG
IFG
—
—
IPL
⫺0.068 (0.0520)
( p ⫽ 0.207)
—
⫺0.013 (0.005)
( p ⫽ 0.017)
—
To
MTG
⫺0.011 (0.004)*
( p ⫽ 0.005)
⫺0.012 (0.003)*
( p ⫽ 0.001)
—
Data are mean (SEM) for each connection. —, Not investigated. The threshold was set at p ⬍ 0.0125 (corresponding
to an FDR-corrected threshold of p ⬍ 0.05, corrected for multiple comparisons).
*Significant connection.
from IPL to MTG. This finding was not predicted and, as such,
does not clearly support our hypothesis, as we would have predicted significantly augmented modulation in this top-down direction. However, as discussed below, this finding nonetheless
informs our understanding of a predictive coding account of
action perception.
Discussion
Our aim was to characterize how subjective familiarity of an observed action impacts AON engagement through complementary use of parametric GLM and effective connectivity analyses.
We found that, as observed movements were rated as more familiar, BOLD signal in left MTG, IPL, and IFG increased. We
then used DCM to explore effective connectivity between these
regions to evaluate the hypothesis that, as movements are rated as
increasingly familiar, the anterior influence (MTG ¡ IPL ¡
IFG), representing bottom-up, feedforward action coding, attenuates, whereas connectivity for posterior influence (IFG ¡ IPL
¡ MTG), representing top-down, feedback action coding, is upregulated. DCM provided partial support of this hypothesis by
demonstrating attenuated influence from connections leading to
and originating from MTG. In the following, we consider these
findings in terms of a predictive coding model of AON function
and how they advance our understanding of the impact of familiarity on action perception.
The impact of familiarity on the AON and the “like
me” hypothesis
The main GLM findings show that primary motor and AON
regions are recruited during perception and prediction of movements and that increasingly familiar movements are associated
with concomitant increases in activity. The first result corroborates research demonstrating sensorimotor engagement during
tasks that explicitly tap into prediction processes (Blakemore and
Frith, 2005; Falck-Ytter et al., 2006; Stadler et al., 2011; Cross et
al., 2013). The parametric analyses reveal that increasingly familiar movements preferentially engage core AON regions, supporting the general premise of a “like me” hypothesis of AON
function (Buccino et al., 2004; Calvo-Merino et al., 2005; Cross et
al., 2006; Meltzoff, 2007; Liew et al., 2011; Press, 2011). The parametric contrast allowed us to examine the relationship between
AON activity and familiarity in a nonbinary fashion, thus advancing knowledge from previous studies. This approach subsequently enabled examination of causal connectivity between core
AON regions to further characterize AON contributions to action understanding.
Effective connectivity
Our first effective connectivity aim was to create a feasible model
space based on AON regions proposed previously (Keysers and
Perrett, 2004). By tailoring this model space, we could address
where movement inputted to the system and examine the models
within this family (Penny et al., 2010). We showed inputs to both
IFG and MTG in a reciprocally connected network. Next, we
sought to identify the optimal model of modulation/modulatory
activity (B matrix) based on these fixed connections. The BMS
results revealed the optimal model as one where increasing familiarity modulates all fixed connections. By use of BMA, we found
that increasing movement familiarity attenuates anterior influence between MTG and IPL while also attenuating posterior influence between IPL and MTG.
The parameter estimates (from the BMA) suggest that increasing familiarity causes diffuse and small reductions in effective connectivity among the three areas studied. The small effect
sizes deserve some comment; in this analysis, we used stochastic
DCM. In stochastic DCM, one estimates both the neuronal activity and effective connectivity that best explain observed responses. Generally, this provides smaller estimates of changes in
coupling because condition-specific effects can also be modeled
by differences in neuronal activity. Although small, our Bayesian
model comparison suggests that familiarity-related changes in
effective connectivity are evident in the data. The effect sizes are
expressed in terms of log-scale parameters and can be interpreted
(approximately) as proportional changes. In other words, familiarity induces a change of ⬃1% of the underlying connectivity
strengths. Furthermore, as predicted, ascending connections to
IPL show a familiarity-related decrease greater in magnitude than
the decrease in descending connections from IPL.
Predictive coding models revisited
Our findings support several assumptions made by models of
action perception that rely on notions of predictive coding (Keysers and Perrett, 2004; Kilner et al., 2007a,b). These models suggest greater influence from visual to motor regions when an
observed movement is unfamiliar. Such activity is hypothesized
to be indicative of action representations being built in a perceptually driven, bottom-up manner. When an observed movement
is familiar, top-down predictions should have a greater influence
on perceptual processing at lower levels. These predictions are
formally identical to corollary discharge (i.e., the expected consequences of an intended movement). This connects predictive
coding accounts of action perception to machine learning accounts of motor control (Wolpert et al., 2003) that appeal to
notions of corollary discharge. In the predictive coding account
of action observation (Kilner et al., 2007a,b), the more familiar a
movement, the more precise top-down predictions become. Ef-
Gardner et al. • Modulation of AON by Movement Familiarity
fectively, increasing familiarity should increase influence of topdown predictions relative to bottom-up information (which, in
this model, originates in MTG). We therefore anticipated that
more familiar actions should be associated with increasing influence from connections spanning posteriorly from IFG ¡ IPL and
IPL ¡ MTG, and decreasing influence from connections spanning anteriorly from MTG ¡ IPL and IPL ¡ IFG.
DCM analyses partially support these hypotheses. We show
that, with increasing familiarity, MTG exerts an attenuated influence on IPL in an anterior direction, as hypothesized. A similar
dampening of influence from IPL to IFG with increasing familiarity is also observed, although this finding did not survive corrections for multiple comparisons. Our hypotheses concerning
the influence of familiarity on posterior-projecting connections
were not supported. Increasing action familiarity did not significantly upregulate influence from IFG to IPL, as was expected.
One possible explanation for this could be that the influence IFG
exerts on IPL is impervious to variations in familiarity examined
in the present study. Most crucially, and contrary to our original
hypothesis, a significant attenuation of influence was observed in
posterior connections from IPL to MTG.
At first glance, this finding might appear to contradict a predictive coding account of action observation. However, our initial hypotheses might have been overly simplistic, as they did not
take into account the range of excitatory and inhibitory influences between nodes within a predictive coding framework (Keysers and Gazzola, 2014). In keeping with our original hypotheses,
the reason why effective connectivity between MTG and IPL in
both directions attenuates with increasing familiarity could be
that increasingly accurate predictions decrease demand on incoming or ongoing perceptual processing. As such, the present
findings illustrate a version of predictive coding in which outputs
from, and inputs to, MTG attenuate with increasing familiarity,
whereas reciprocal influence between parietal and premotor areas is less impacted by increasing action familiarity. To an extent,
these findings support a predictive coding framework of the AON
in a nuanced and subtle manner. The general idea that increased
familiarity is associated with decreased prediction error, and a
dampening of sensory inputs is supported by our data. However, the present findings do not yield clear support for more
specific predictions concerning the concurrent upregulation
of posterior-projecting connections (IFG ¡ IPL and IPL ¡
MTG) and downregularion of anterior-projecting connections
(MTG ¡ IPL and IPL ¡ MTG).
An alternative framing of these DCM results is that, with increasing familiarity, localized representations become sufficient
to perform the task at hand, resulting in decreased cross-node
coordination within the AON (as this coordination becomes less
necessary). Such an interpretation would be consistent with the
univariate findings reported in the present study and others
(Buccino et al., 2004; Calvo-Merino et al., 2005; Cross et al., 2006;
Vogt et al., 2007; Shimada, 2010; Liew et al., 2011), which show
increased activity within the individual AON nodes during
familiar action observation. This interpretation remains speculative at this stage. To test this possible explanation,
follow-up research could investigate observation of actions
that cover a broader range of familiarity to determine whether
the degree of familiarity drives the connection strengths between AON nodes, such that observation of highly unfamiliar
actions is associated with stronger AON connections, whereas
observation of actions rated as highly familiar is associated
with attenuated connections. Were this alternative theoretical
framing to be supported by follow-up work, it would call for
J. Neurosci., January 28, 2015 • 35(4):1561–1572 • 1571
an updating and reconsideration of a predictive coding account of action perception.
In conclusion, the present findings provide partial support for
a predictive coding account of action observation, as well as offer
novel insights into how familiarity modulates effective connectivity within the AON. By using participants’ individual, subjective ratings of familiarity, we show greater AON activity when
movements were perceived as increasingly familiar. Through the
use of effective connectivity analyses, we demonstrate attenuation of reciprocal connections between IPL and MTG with increasing familiarity and presumed decreasing prediction error.
Although this finding is broadly in line with a predictive coding
account of action perception (Kilner et al., 2007b), the data do
not provide clear or complete support for this theoretical model
for how familiarity should impact influence between AON nodes.
An alternative possibility is that increased familiarity of an observed action results in a shift away from coordinated activity
between AON nodes and toward more individuated processing
within individual nodes. A challenge for future work is to further
explore how familiarity modulates influence between AON regions. Of particular importance for future investigation is how
different levels of familiarity impact parietal and premotor regions, as our findings less clearly demonstrate marked changes in
effective connectivity between these two regions with increasing
familiarity. As a whole, the present study demonstrates the utility
of effective connectivity analyses to explore simulationist accounts of social information processing.
References
Blakemore SJ, Frith C (2005) The role of motor contagion in the prediction
of action. Neuropsychology 43:260 –267. CrossRef Medline
Buccino G, Lui F, Canessa N, Patteri I, Lagravinese G, Benuzzi F, Porro CA,
Rizzolatti G (2004) Neural circuits involved in the recognition of actions
performed by nonconspecifics: an fMRI study. J Cogn Neurosci 16:114 –
126. CrossRef Medline
Buxton RB, Wong EC, Frank LR (1998) Dynamics of blood flow and oxygenation changes during brain activation: the balloon model. Mag Reson
Med 39:855– 864. CrossRef Medline
Calvo-Merino B, Glaser DE, Gre`zes J, Passingham RE, Haggard P (2005)
Action observation and acquired motor skills: an fMRI study with expert
dancers. Cereb Cortex 15:1243–1249. CrossRef Medline
Caspers S, Zilles K, Laird AR, Eickhoff SB (2010) ALE meta-analysis of action observation and imitation in the human brain. Neuroimage 50:
1148 –1167. CrossRef Medline
Cross ES, Hamilton AF, Grafton ST (2006) Building a motor simulation de
novo: observation of dance by dancers. Neuroimage 31:1257–1267.
CrossRef Medline
Cross ES, Kraemer DJ, Hamilton AF, Kelley WM, Grafton ST (2009) Sensitivity of the action observation network to physical and observational
learning. Cereb Cortex 19:315–326. CrossRef Medline
Cross ES, Liepelt R, Hamilton AF, Parkinson J, Ramsey R, Stadler W, Prinz W
(2012) Robotic movement preferentially engages the action observation
network. 33:2238 –2254. CrossRef Medline
Cross ES, Stadler W, Parkinson J, Schu¨tz-Bosbach S, Prinz W (2013) The
influence of visual training on predicting complex action sequences. Hum
Brain Mapp 34:467– 486. CrossRef Medline
Falck-Ytter T, Gredeba¨ck G, von Hofsten C (2006) Infants predict other
people’s action goals. Nat Neurosci 9:878 – 879. CrossRef Medline
Friston KJ (2007) Statistical parametric mapping. London: Academic.
Friston KJ, Harrison L, Penny W (2003) Dynamic causal modelling. Neuroimage 19:1273–1302. CrossRef Medline
Gazzola V, Keysers C (2009) The observation and execution of actions share
motor and somatosensory voxels in all tested subjects: single-subject analyses of unsmoothed fMRI data. Cereb Cortex 19:1239 –1255. CrossRef
Medline
Grafton ST (2009) Embodied cognition and the stimulation of action to
understand others. Ann N Y Acad Sci 1156:97–117. CrossRef Medline
1572 • J. Neurosci., January 28, 2015 • 35(4):1561–1572
Hamilton AF (2013) The mirror neuron system contributes to social responding. Cortex 49:2957–2959. CrossRef Medline
Hamilton AF, Grafton ST (2006) Goal representation in human anterior
intraparietal sulcus. J Neurosci 26:1133–1137. CrossRef Medline
Hari R, Bourguignon M, Piitulainen H, Smeds E, De Tie`ge X, Jousma¨ki V
(2014) Human primary motor correct is both activated and stabilized
during observation of other persons phasic motor actions. Philos Trans R
Soc B 369:20130171. CrossRef Medline
Keysers C, Gazzola V (2009) Expanding the mirror: vicarious activity for
actions, emotions, and sensations. Curr Opin Neurobiol 19:666 – 671.
CrossRef Medline
Keysers C, Gazzola V (2014) Hebbian learning and predictive mirror neurons for actions, sensations and emotions. Philos Trans R Soc Lond B Biol
Sci 369:20130175. CrossRef Medline
Keysers C, Perrett DI (2004) Demystifying social cognition: a Hebbian perspective. Trends Cogn Sci 8:501–507. CrossRef Medline
Kilner JM, Friston KJ, Frith CD (2007a) The mirror-neuron system: a
Bayesian perspective. Neuroreport 18:619 – 623. CrossRef Medline
Kilner JM, Friston KJ, Frith CD (2007b) Predictive coding: an account of the
mirror neuron system. Cogn Process 8:159 –166. CrossRef Medline
Kilner JM, Marchant JL, Frith CD (2009) Relationship between activity in
human primary motor cortex during action observation and the mirror
neuron system. PLoS One 4:e4925. CrossRef Medline
Lamm C, Nusbaum HC, Meltzoff AN, Decety J (2007) What are you feeling?
Using functional magnetic resonance imaging to assess the modulation of
sensory and affective responses during empathy for pain. Brain Res 1227:
153–161. CrossRef Medline
Li B, Daunizeau J, Stephan KE, Penny W, Hu D, Friston K (2011) Generalised filtering and stochastic DCM for fMRI. Neuroimage 58:442– 457.
CrossRef Medline
Liew SL, Sheng T, Margetis JL, Aziz-Zadeh L (2013) Both novelty and expertise increase action observation network activity. Front Hum Neurosci
7:541. CrossRef Medline
Liew SL, Han S, Aziz-Zadeh L (2011) Familiarity modulates mirror neuron
and mentalizing regions during intention understanding. Hum Brain
Mapp 32:1986 –1997. CrossRef Medline
Marreiros AC, Kiebel SJ, Friston KJ (2008) Dynamic causal modeling for
fMRI: a two-state model. Neuroimage 39:269 –278. CrossRef Medline
Meltzoff AN (2007) Like me: a foundation for social cognition. Dev Sci
10:126 –134. CrossRef Medline
Oldfield RC (1971) The assessment and analysis of handedness: the Edinburgh inventory. Neuropsychologia 9:97–113. CrossRef Medline
Gardner et al. • Modulation of AON by Movement Familiarity
Penny WD, Stephan KE, Daunizeau J, Rosa MJ, Friston KJ, Schofield TM, Leff
AP (2010) Comparing families of dynamic causal models. PLoS Comput Biol 6:e1000709. CrossRef Medline
Press C (2011) Action observation and robotic agents: learning and anthropomorphism. Neurosci Biobehav Rev 35:1410 –1418. CrossRef Medline
Schippers MB, Keysers C (2011) Mapping the flow of information within
the putative mirror neuron system during gesture observation. Neuroimage 57:37– 44. CrossRef Medline
Schubotz RI (2007) Prediction of external events with our motor system:
towards a new framework. Trends Cogn Sci 11:211–218. CrossRef
Medline
Shimada S (2010) Deactivation in the sensorimotor area during observation
of a human agent performing robotic actions. Brain Cogn 72:394 –399.
CrossRef Medline
Sinigaglia C (2013) What type of action understanding is subserved by mirror neurons? Neurosci Lett 540:59 – 61. CrossRef Medline
Smith SM (2012) The future of FMRI connectivity. Neuroimage 62:1257–
1266. CrossRef Medline
Stadler W, Schubotz RI, von Cramon DY, Springer A, Graf M, Prinz W
(2011) Predicting and memorizing observed action: differential premotor cortex involvement. Hum Brain Mapp 32:677– 687. CrossRef Medline
Stephan KE, Kasper L, Harrison LM, Daunizeau J, den Ouden HE, Breakspear
M, Friston KJ (2008) Nonlinear dynamic causal models for fMRI. Neuroimage 42:649 – 662. CrossRef Medline
Stephan KE, Penny WD, Daunizeau J, Moran RJ, Friston KJ (2009) Bayesian
model selection for group studies. Neuroimage 46:1004 –1017. CrossRef
Medline
Stephan KE, Penny WD, Moran RJ, den Ouden HE, Daunizeau J, Friston KJ
(2010) Ten simple rules for dynamic causal modeling. Neuroimage 49:
3099 3109. CrossRef Medline
Urgesi C, Maieron M, Avenanti A, Tidoni E, Fabbro F, Aglioti SM (2010)
Simulating the future of actions in the human corticospinal system. Cereb
Cortex 20:2511–2521. CrossRef Medline
Vogt S, Buccino G, Wohlschla¨ger AM, Canessa N, Shah NJ, Zilles K, Eickhoff
SB, Freund HJ, Rizzolatti G, Fink GR (2007) Prefrontal involvement in
imitation learning of hand actions: effects of practice and expertise. Neuroimage 37:1371–1383. CrossRef Medline
Wolpert DM, Doya K, Kawato M (2003) A unifying computational framework for motor control and social interaction. Philos Trans R Soc Lond B
Biol Sci 358:593– 602. CrossRef Medline


© Copyright 2026