
Very extended cold gas, star formation and outflows in the halo of a
Astronomy
&
Astrophysics
A&A 574, A14 (2015)
DOI: 10.1051/0004-6361/201424980
c ESO 2015
Very extended cold gas, star formation and outflows in the halo
of a bright quasar at z > 6
C. Cicone1,2 , R. Maiolino1,2 , S. Gallerani3 , R. Neri4 , A. Ferrara3 , E. Sturm5 , F. Fiore6 , E. Piconcelli6 , and C. Feruglio4
1
2
3
4
5
6
Cavendish Laboratory, University of Cambridge, 19 J. J. Thomson Avenue, CB3 0HE Cambridge, UK
e-mail: [email protected]
Kavli Institute for Cosmology, University of Cambridge, Madingley Road, CB3 0HA Cambridge, UK
Scuola Normale Superiore, Piazza dei Cavalieri 7, 56126 Pisa, Italy
Institut de Radioastronomie Millimétrique (IRAM), 300 rue de la Piscine, 38406 St. Martin d’Hères, Grenoble, France
Max Planck Institute für Extraterrestrische Physik (MPE), Giessenbachstraße 1, 85748 Garching, Germany
Osservatorio Astronomico di Roma (INAF), via Frascati 33, 00040 Monteporzio Catone, Italy
Received 12 September 2014 / Accepted 14 November 2014
ABSTRACT
Past observations of quasar host galaxies at z > 6 have found cold gas and star formation on compact scales of a few kiloparsecs.
We present new high sensitivity IRAM Plateau de Bure Interferometer follow-up observations of the [C ii] 158 μm emission line and
far-infrared (FIR) continuum in the host galaxy of SDSS J1148+5251, a luminous quasar at redshift 6.4189. We find that a large
portion of the gas traced by [C ii] is at high velocities, up to ∼1400 km s−1 relative to the systemic velocity, confirming the presence
of a major outflow as indicated by previous observations. The outflow has a complex morphology and reaches a maximum projected
radius of 30 kpc. The extreme spatial extent of the outflow allows us, for the first time in an external galaxy, to estimate mass-loss
rate, kinetic power, and momentum rate of the outflow as a function of the projected distance from the nucleus and the dynamical time
scale. These trends reveal multiple outflow events during the past 100 Myr, although the bulk of the mass, energy, and momentum
appear to have been released more recently within the past ∼20 Myr. Surprisingly, we discover that the quiescent gas at systemic
velocity is also extremely extended. More specifically, we find that, while 30% of the [C ii] within v ∈(−200, 200) km s−1 traces a
compact component that is not resolved by our observations, 70% of the [C ii] emission in this velocity range is extended with a
projected full width at half maximum (FWHM) size of 17.4 ± 1.4 kpc. We detect FIR continuum emission associated with both the
compact and the extended [C ii] components, although the extended FIR emission has a FWHM of 11 ± 3 kpc, thus smaller than the
extended [C ii] source. Overall, our results indicate that the cold gas traced by [C ii] is distributed up to r ∼ 30 kpc in the host galaxy
of SDSS J1148+5251. A large amount of extended [C ii] is likely to be associated with star formation occurring on large scales, but
the [C ii] source extends well beyond the FIR continuum, and additional multi-wavelength observations are needed in order to clarify
the origin of this very extended [C ii] .
Key words. galaxies: general – galaxies: ISM – galaxies: evolution – galaxies: high-redshift – quasars: general
1. Introduction
Recent millimetre observations have revealed that the host
galaxies of high redshift luminous quasars are quite compact,
with extremely intense star formation confined within a few
kiloparsecs in their nuclear regions, fed by large amounts of
dense gas (e.g. see Carilli & Walter 2013 for a recent review).
Moreover, high resolution interferometric observations of these
high redshift sources have suggested the presence of regularly
rotating and relatively undisturbed disks (Carniani et al. 2013;
Wang et al. 2013), although in some cases they appear to be
highly turbulent (De Breuck et al. 2014). However, recent theoretical studies have concluded that, in order to reconcile the
extreme properties (black hole (BH) mass, dust, and gas mass)
of these high redshift quasars with early star formation occurring with a standard initial mass function (IMF), the dynamical masses of these objects should be a factor of 3−30 higher
than the maximum values allowed by observations (Valiante
et al. 2011, 2014; Calura et al. 2014). This suggests that past
Appendices are available in electronic form at
http://www.aanda.org
millimetre observations may have missed a significant portion
of baryons in high redshift quasar host galaxies.
Only in a few high redshift quasars and radio galaxies have
observations revealed the presence of some diffuse gas at a distance of several kiloparsecs from the nucleus, possibly associated with gas-rich companions and suggestive of galaxy merger
processes (e.g. Ivison et al. 2008, 2012; Gallerani et al. 2012;
Emonts et al. 2014). Within the massive haloes of high-z radio
galaxies, cold gas emission can be detected up to tens of kiloparsecs offset from the galactic nucleus, often aligned with the
extended radio jets (Nesvadba et al. 2009; Emonts et al. 2011,
2014).
The collisionally excited fine structure transition of C+
2
P3/2 →2 P1/2 at rest-frame wavelength of 157.741 μm (hereafter
[C ii] 158 μm) is conveniently redshifted at z > 4 into the submillimetre/millimetre atmospheric windows. The [C ii] 158 μm
is one of the brightest lines in the spectrum of star forming galaxies, since it is the dominant coolant of the interstellar medium
(ISM) over a wide range of physical conditions. The ionisation
potential of carbon is 11.26 eV, so C+ , HI, and even H2 usually coexist in the same medium, and indeed neutral hydrogen
is the main collisional partner of C+ . Although [C ii] emission
Article published by EDP Sciences
A14, page 1 of 21
A&A 574, A14 (2015)
is commonly associated with star formation (e.g. Sargsyan et al.
2014; De Looze et al. 2014), the large variety of physical conditions in which C+ can be produced and excited keeps its interpretation from being straightforward. This has been shown
clearly by recent detailed studies of the spatial distribution of
various gas tracers in the Milky Way and a few other nearby
galaxies, including Herschel observations of [C ii]. In particular, in our Galaxy, only ∼50% of the [C ii] emission is associated with dense photon-dominated regions (PDRs) exposed to
the far-ultraviolet (FUV) radiation field of young and massive
stars (Pineda et al. 2013). About 30% of [C ii] in the Milky
Way is linked to “CO-dark” molecular hydrogen, which dominates the gas mass of diffuse molecular clouds, but it can also
be an important component of some unshielded dense molecular clouds with large envelopes where the formation of CO is
inhibited and where most of the gas-phase carbon is found in
C0 or C+ atoms (Wolfire et al. 2010; Langer et al. 2010, 2014;
Velusamy et al. 2010; Pineda et al. 2013). Finally, Pineda et al.
(2013) have shown that ∼20% of [C ii] is linked to diffuse atomic
clouds (in particular to the cold neutral medium, CNM), and
a low fraction (∼4%) is associated with warm ionised medium
(WIM), although the WIM contribution to [C ii] emission may
be significantly more according to Velusamy & Langer (2014).
Further complicating its interpretation, [C ii] can be enhanced by
shocks (Appleton et al. 2013). Intriguingly, [C ii] also seems to
be a good tracer of outflows and, especially, of molecular gas in
outflow (Fischer et al. 2010; Contursi et al. 2013; Kreckel et al.
2014).
The first high redshift source in which [C ii] emission was
ever detected (Maiolino et al. 2005), SDSS J1148+5251 at redshift 6.4189, is one of the most powerful quasars in the Universe,
with an intrinsic bolometric luminosity of LAGN = 5.63×10¹³ L
(Schneider et al. 2014). This is the perfect laboratory for studying the formation of the first massive galaxies and the coevolution of galaxies and black holes at the end of the reionisation epoch. SDSS J1148+5251 was discovered through SDSS
photometry (Fan et al. 2003), and since then it has been the subject of extensive multi-wavelength studies, aimed at constraining
the extreme properties of its host galaxy and of its cosmological environment (e.g. Bertoldi et al. 2003; Walter et al. 2003,
2004; Willott et al. 2003; Riechers et al. 2009; Gallerani et al.
2010; Decarli et al. 2012; Carilli & Walter 2013). Walter et al.
(2009) observed the [C ii] emission line in SDSS J1148+5251,
using the most extended configuration of the IRAM Plateau
de Bure Interferometer (PdBI), and derived a size of 1.5 kpc,
which combined with the extreme far-infrared (FIR) luminosity of this source, suggests the presence of a kpc-scale “hyperstarburst” in its nucleus, fed by large amounts of molecular gas.
Moreover, SDSS J1148+5251 was also the first high redshift
galaxy in which a powerful quasar-driven outflow was discovered (Maiolino et al. 2012). The outflow was revealed by the
presence of extremely broad wings of the [C ii] emission line,
tracing gas at high velocities (v up to 1200 km s−1 ), which appeared marginally resolved at a 2 arcsec resolution, with a measured (projected) diameter of ∼16 kpc.
In this work we present new follow-up observations of the
[C ii] emission line and FIR continuum in SDSS J1148+5251,
obtained with the C and D configurations of the IRAM PdBI (resulting in a synthesised beam size of 1.3 × 1.2 for the [C ii] observations and of 1.1 × 1.0 for the FIR continuum observations), which enable us to investigate the properties of this source
on large scales, with a sensitivity much higher than previous observations. Throughout the paper, we adopt a standard ΛCDM
cosmological model with H0 = 67.3 km s−1 Mpc−1 , ΩΛ = 0.685,
A14, page 2 of 21
ΩM = 0.315 (Planck Collaboration XVI 2014). With the adopted
cosmology, at the redshift of SDSS J1148+5251, the physical scale is 5.623 kpc arcsec−1 , and the age of the Universe is
0.85 Gyr.
2. Observations
We have observed with the IRAM PdBI the [C ii] 158 μm line
in the host galaxy of the luminous quasar SDSS J1148+5251.
The pointing and phase centre of our observations corresponds
to the SDSS optical position of the quasar (RA = 11:48:16.64,
Dec = 52:51:50.30). At the redshift of the source (z = 6.4189,
Maiolino et al. 2005), the [C ii] 158 μm transition is redshifted
into the 1 mm band, at an observed frequency of 256.175 GHz.
The observations were obtained with the C configuration of the
IRAM PdBI (with 6 antennas covering baselines from 16.6 m
to 176.0 m) between November 2012 and April 2013 and were
combined with the previous 2011 observations in D configuration (Maiolino et al. 2012), for a total on-source-time of
30 h. We reach a sensitivity of 0.46 mJy beam−1 in channels
of 100 km s−1 , which is unprecedented for IRAM PdBI observations of high redshift quasars at this frequency (Wang et al.
2013 reach a similar line sensitivity using the Atacama large
millimetre/sub-millimetre array (ALMA)). The resulting synthesised beam-size using natural weighting is 1.3 × 1.2 , and the
PdBI primary beam, giving the field of view, at these frequencies
is 19.7 ×19.7 . Data reduction and analysis were performed by
using the CLIC and MAPPING softwares within the GILDAS
package. The flux calibration accuracy in the 1 mm band is about
20% (Castro-Carrizo & Neri 2010). We used the wide-band express (WideX) correlator offered by the PdBI, which provides a
spectral resolution of 20 MHz (corresponding to 23.4 km s−1 )
over its full bandwidth of 3.6 GHz. The 3.6 GHz spectral window was centred at 256.172 GHz (i.e. on the [C ii] 158 μm line)
for all tracks but two, for which the centre was instead set at
256.672 GHz, hence providing an additional 0.5 GHz-wide window on the continuum blueward of the line.
In this work we also make use of ancillary C+D configuration IRAM PdBI observations of the FIR continuum
of SDSS J1148+5251 at 262 GHz (rest frame wavelength
λ = 154.2 μm) and 259.4 GHz (rest frame wavelength λ =
155.8 μm), carried out between May 2010 and December 2012.
By merging these two datasets at 262 GHz and 259.4 GHz, we
obtain a high sensitivity (1σ rms noise of 0.082 mJy beam−1 )
map of the FIR continuum of SDSS J1148+5251 at an average
rest-frame wavelength λ = 155 μm (average observed frequency
of 261 GHz). The resulting synthesised beam-size using natural weighting is 1.1 ×1.0 . The total on source time for these
ancillary FIR observations is 28 h. These deep FIR continuum
observations are part of a parallel IRAM PdBI programme. The
dataset at 262 GHz has been presented by Gallerani et al. (2014),
who report the serendipitous detection of the CO(17−16) and
OH+ emission lines in SDSS J1148+5251.
3. Results
3.1. The FIR continuum at 256 GHz
For the purpose of continuum subtraction, the rest-frame
157.7 μm FIR continuum (observed frequency of 256 GHz) is
estimated by collapsing the line-free channels of our wide-band
IRAM PdBI observations, corresponding to the velocity ranges
of v ∈ (−2700, −2400) km s−1 , v ∈ (−1900, −1500) km s−1
and v ∈ (1500, 2100) km s−1 . The channels between
C. Cicone et al.: Very extended cold gas, star formation and outflows in the halo of a bright quasar at z > 6
Fig. 1. IRAM PdBI continuum-subtracted spectrum of the [C ii] 158 μm emission line of SDSS J1148+5251. The three spectra shown have
been extracted using different apertures, namely circular apertures with diameters of 2 arcsec (left panel), 4 arcsec (central panel) and 8 arcsec
(right panel). Note the different scales on the y-axes in the three panels. For display purposes, the spectra have been re-binned by a factor of 2,
corresponding to channels of 46.8 km s−1 . The Gaussian fits to the line profiles (using a narrow and a broad Gaussian component to fit respectively
the narrow core, tracing quiescent gas, and the broad wings, tracing the outflow) are performed on the original non-binned spectra and the fits
results are reported in Table 1.
Table 1. Results of the Gaussian fits to the [C ii] 158 μm emission line spectrum of SDSS J1148+5251.
Aperture†
2 arcsec
4 arcsec
8 arcsec
v
[km s−1 ]
13 ± 9
24 ± 13
14 ± 19
Narrow component
σv
S peak
[km s−1 ]
[mJy]
146 ± 11 14.5 ± 0.9
148 ± 16
30 ± 3
150 ± 20
34 ± 4
Iν
[Jy km s−1 ]
5.3 ± 0.5
11.0 ± 1.5
13 ± 3
v
[km s−1 ]
250 ± 160
170 ± 170
200 ± 300
Broad component
σv
S peak
[km s−1 ]
[mJy]
730 ± 170 2.0 ± 0.6
900 ± 200 5.8 ± 1.6
900 ± 300
10 ± 3
Iν
[Jy km s−1 ]
3.7 ± 1.4
12 ± 5
21 ± 9
Total line
Iν
[Jy km s−1 ]
9.0 ± 1.5
23 ± 5
34 ± 9
Notes. (†) Diameter of the circular aperture used for extracting the spectrum, as in Fig. 1.
v = −2400 km s−1 and v = −1900 km s−1 are excluded from
the continuum integration because of the presence of a putative
feature, detected at the 4.2σ level in the maps, whose position is
shifted by 1.5 arcsec to the south with respect to the quasar optical position and whose origin is not clear from our data (it could
be be either part of the extended outflow discussed in Sect. 3.4
or associated with another galaxy).
The uv plot of the continuum at 256 GHz can be fitted by
a point (unresolved) source1 centred at RA = 11:48:16.62 and
Dec = 52:51:50.22, with a flux density of 3.3 mJy. We compare
our new continuum flux density estimate with the Max Planck
millimetre bolometer-II (MAMBO-II) 1.2 mm observations of
Bertoldi et al. (2003), who report a flux density of 5.0 ± 0.6 mJy.
Because of the broad bandwidth of MAMBO-II, the flux expected at our PdBI frequency of 256 GHz from the MAMBO-II
observations of Bertoldi et al. (2003) must be modelled by taking into account both the MAMBO-II transmission curve, which
determines the spectral response of the bolometer at different
frequencies, and the FIR spectral energy distribution (SED) of
SDSS J1148+5251, which, at FIR wavelengths, can be modelled
by using a modified blackbody curve with emissivity β = 1.6
(Leipski et al. 2014). For simplicity, we perform the calculation under the Rayleigh-Jeans approximation and by assuming
τν
1 so that the flux density scales as S ν ∝ ν(β+2) , where
the optical depth is parametrised as a power law in frequency,
τν = (ν/ν0 )β , following Draine (2006)2. We obtain an expected
flux density at 256 GHz of 4.8 ± 0.6 mJy, to be compared
with our measured value of 3.3 ± 0.7 mJy, where the error includes a 20% flux calibration uncertainty. We note that there
is a small inconsistency between our new 157.7 μm continuum estimate and the flux density expected at these wavelengths
from the bolometric observations of Bertoldi et al. (2003). This
discrepancy was not evidenced in Maiolino et al. (2012) because of the larger error of their continuum measure, which
was only based on the D-configuration data. This small inconsistency with Bertoldi et al. (2003) is likely due to the presence of additional sources close to SDSS J1148+5251 contributing to the 10.7 MAMBO-II beam. In particular, one source
∼10 north-west of SDSS J1148+5251 was clearly detected by
Herschel (Leipski et al. 2010, 2013), and it is also marginally
detected by our PdBI observations (Fig. A.1). In Appendix A
we further test this hypothesis and we show that, when modelling the FIR SED of SDSS J1148+5251 by only considering
the Herschel/PACS continuum measurements of Leipski et al.
(2013), corrected for the contaminating north-western source,
and the PdBI measurements by Riechers et al. (2009) and
Gallerani et al. (2014) at other frequencies, the flux density expected at the MAMBO-II frequencies (by taking into account
the full transmission curve) would be of 3.8 mJy, which in turn
would predict a flux density at 256 GHz of 3.6 ± 0.4 mJy, consistent with our PdBI measurement.
1
We note that, although the FIR continuum of SDSS J1148+5251
is not resolved in the 256 GHz dataset, the FIR continuum emission appears well resolved in the deeper ancillary dataset at 261 GHz
(λrest = 155 μm, see also explanation in Sect. 2), as shown in Sect. 3.6.
2
λ0 = c/ν0 is the wavelength where the optical depth is unity, expected
to be λ0 100 μm.
A14, page 3 of 21
A&A 574, A14 (2015)
Fig. 2. IRAM PdBI continuum-subtracted map of the total [C ii] 158 μm emission of SDSS J1148+5251, integrated within v ∈ (−1400, 1200)
km s−1 . Negative and positive contours are in steps of 3σ (1σ rms noise is 0.26 Jy beam−1 km s−1 ). The synthesised beam (1.3 × 1.2 ) is shown
in the bottom left corner of the map. The cross indicates the pointing and phase centre, corresponding to the optical position of the quasar.
3.2. The total [C II] 158 μm emission
Following the standard procedure, we subtract the continuum (estimated in Sect. 3.1) directly from the uv data, and
we extract from the continuum-subtracted and cleaned data
cube the spectrum of the [C ii] 158 μm emission line of
SDSS J1148+5251. In Fig. 1 we show the resulting continuumsubtracted spectra extracted using three circular apertures with
diameters of 2 arcsec, 4 arcsec, and 8 arcsec. Note that the three
plots in Fig. 1 have different scales on the y-axis. Each spectrum
in Fig. 1 is fit by using two Gaussians, e.g., a narrow Gaussian
to fit the central core of the line, tracing quiescent gas, and a
broad Gaussian to fit the broad wings, tracing the outflow discovered by Maiolino et al. (2012). The fit with two Gaussians
is a simplistic model for the [C ii] 158 μm emission profile of
SDSS J1148+5251, however it constitutes a good starting point
for our study. The fit results are reported in Table 1. The widths
of the two Gaussians used for fitting the [C ii] 158 μm spectral
profile show no significant variations between spectra extracted
from different apertures3, and they are consistent with Maiolino
et al. (2012).
Figure 1 and Table 1 clearly show that the contribution from
an extended gas component to the total [C ii] 158 μm flux in
SDSS J1148+5251 is significant. Indeed, the total integrated flux
estimated by using the spectrum extracted from the 8 arcsec
3
We note that all the six parameters of the fit are left as free parameters
in the spectral fitting procedure. In particular, we did not constrain the
fits performed on the spectra extracted from different apertures to have
same widths, central velocities and/or amplitudes.
A14, page 4 of 21
diameter aperture is significantly larger than the flux retrieved
using the 4 arcsec aperture, and is almost four times as large as
the flux measured from the 2 arcsec aperture. Such flux increment is observed in both the narrow and the broad Gaussians
that are fit to the emission line profiles, suggesting that both
components trace emission extended on extremely large scales
(d 4 arcsec on sky, corresponding to d 22 kpc). However,
we note that the largest flux variation with aperture size is observed in the broad wings of the [C ii] 158 μm line, confirming
that the massive outflow is very extended.
The complex morphology and extreme spatial extent of the
[C ii] 158 μm emission around this z ∼ 6.4 quasar are clearly revealed by the map in Fig. 2, obtained by collapsing the velocity
channels spanning the full velocity extent of the emission line
profile, i.e. from v = −1400 km s−1 to v = 1200 km s−1 .
The map shows a filamentary [C ii] 158 μm source, with structures extending in the radial direction up to the extraordinary
(for a quasar host galaxy at z = 6.4) (projected) distances of
r ∼ 30 kpc from the quasar position (indicated by the cross).
The fits performed on the spectra extracted from different
apertures (Fig. 1 and Table 1) suggest that a large amount of
the [C ii] 158 μm emission at a distance r > 2 arcsec from
the quasar (i.e. the emission that is not retrieved by using the
4 arcsec diameter aperture, but that is recovered with the largest
8 arcsec diameter aperture) is associated with the broad wings of
the [C ii] line, tracing a powerful outflow (Maiolino et al. 2012).
We further investigate this in Fig. 3, where we show the same
map as Fig. 2, in which we have marked the position of six regions (indicated with A-F) that are at a distance of r 2 arcsec
C. Cicone et al.: Very extended cold gas, star formation and outflows in the halo of a bright quasar at z > 6
Fig. 3. IRAM PdBI continuum-subtracted map of the total [C ii] 158 μm emission of SDSS J1148+5251, integrated within v ∈
(−1400, 1200) km s−1 , along with spectra extracted from different positions on the source. Negative and positive contours are in steps of 3σ
(1σ rms noise is 0.26 Jy beam−1 km s−1 ). For display purposes, the spectra have been re-binned by a factor of 4, corresponding to channels of
93.6 km s−1 . The Gaussian fits to the line profiles are performed on the original non-binned spectra and the fits results are presented in Table B.1.
from the emission peak. These regions represent the brightest
features within the extended [C ii] 158 μm source. The spectra
extracted from regions A-F (by using the elliptical apertures indicated in the map) are also shown in Fig. 3. The spectral fitting, performed by using multiple Gaussians (the fit results are
reported in Table B.1 in Appendix B), shows that features A-F
are characterised, on average, by high velocity dispersions and
velocity offsets, suggesting an outflow origin.
Table 2. Comparison
SDSS J1148+5251.
However, there is also a large amount of extended [C ii] associated with “narrow” emission at systemic velocity (e.g. features
B, C, F in Fig. 3), indicating the presence of extended dynamically “quiescent” (i.e. non outflowing) [C ii] -emitting gas outside of the central “hyper-starburst” detected by Walter et al.
(2009). This extremely interesting – and unexpected – new
prospect is investigated in Sect. 3.5. Interestingly, the narrow
(σv = 110 ± 50 km s−1 ) feature in spectrum B with peak flux
density of S peak = 2.7 ± 1.0 mJy is blueshifted at a velocity of
v = −170 ± 40 km s−1 (Table B.1). The shift in velocity, together
with the low velocity dispersion and large distance from the nucleus, suggests that this feature may have a merger/inflow origin.
This hypothesis is however difficult to test with the current data.
Maiolino et al. (2012)
3.3. Comparison with previous observations
We listed in Table 2 all previous and current [C ii] observations of SDSS J1148+5251. We note that the total [C ii] 158 μm
velocity-integrated flux of 34±9 Jy km s−1 that we estimate from
our new IRAM PdBI observations is significantly larger than
any previous flux measurement of [C ii] obtained for this source.
Such large discrepancy deserves further clarification, as these
new observations significantly change the scenario presented by
previous [C ii] 158 μm observations of SDSS J1148+5251 and
of other high redshift quasars.
with
Ref.
Maiolino et al. (2005)
Walter et al. (2009)
This work
‡
‡
previous
[C ii]
observations
σv †
[km s−1 ]
150 ± 20
S peak
[mJy]
12
Iν
[Jy km s−1 ]
4.1 ± 0.5
122 ± 12
12.7 ± 1.1
3.9 ± 0.3
150 ± 20
23 ± 2
14 ± 3
150 ± 20
44 ± 5
34 ± 9
of
Notes. (†) The values of σv reported for Maiolino et al. (2012) and for
the present work refer to the narrow component to allow a comparison
with earlier studies that did not detect the broad component. ‡ Values
obtained from Gaussian fitting of the spectra extracted from the largest
apertures used in these works.
The first but only apparent flux inconsistency that we
evidence is with the D-configuration data presented in
Maiolino et al. (2012). The total flux derived by using the spectrum extracted from a 6 arcsec-diameter aperture shown in
Maiolino et al. (2012) is over a factor of two lower than our
new estimate (Table 2). This is in part due to the use of a smaller
aperture by Maiolino et al. (2012), which likely missed a fraction of the most extended emission. However, we have also reanalysed the Maiolino et al. (2012) dataset (which is also included in the final dataset used in this work), and we have
found that the bulk of the flux loss was due to cleaning problems associated with the data cubes, with lower sensitivity, from
which the spectra were extracted. Indeed, the discrepancy between the two datasets is much reduced (down to a 20% flux
discrepancy, likely associated with flux calibration issues in the
1 mm band, e.g. Castro-Carrizo & Neri 2010) when estimating
the fluxes from the uv data.
A14, page 5 of 21
A&A 574, A14 (2015)
Fig. 4. Top panels: IRAM PdBI continuum-subtracted maps of the blue (left) and red (right) wings of the [C ii] 158 μm line of SDSS J1148+5251,
integrated within v ∈ (−1400, −300) km s−1 and v ∈ (400, 1200) km s−1 , respectively. Negative and positive contours are in steps of 1.5σ (1σ rms is
0.17 Jy beam−1 km s−1 and 0.14 Jy beam−1 km s−1 for the blue and red wing, respectively). Bottom panels: map of the blue and red wings merged
together (left) and corresponding uv plot (right). In the map of the merged wings, negative and positive contours are in steps of 2σ (1σ rms is
0.21 Jy beam−1 km s−1 ). The uv plot shows the real part of visibilities as a function of the uv distance, binned in baseline steps of 10 m. In all maps,
the cross indicates the pointing and phase centre, corresponding to the optical position of the quasar.
The discrepancy with Walter et al. (2009), who derived a
flux of only 3.9 ± 0.3 Jy km s−1 , can instead be almost entirely
explained by the complex and extended nature of the source
(Fig. 2). These authors indeed observed SDSS J1148+5251
with the most extended configuration of the IRAM PdBI, therefore lacking short baselines and completely resolving out the
extended [C ii] 158 μm emission. As a result, they only detected the [C ii] 158 μm flux associated with the central “hyperstarburst”, which is concentrated within a very compact region
of size ∼1.5 kpc. Moreover, due to their narrow bandwidth of
Δν = 1 GHz, the broad wings associated with the outflow could
not be identified by Walter et al. (2009), and were subtracted
from the line as continuum emission. This implies that also the
flux of the narrow component was underestimated because the
continuum level was overestimated, thereby causing an additional significant flux loss with respect to our new observations.
a factor of 2 with respect to our estimate (Table 2). As a consequence, we suspect that the early [C ii] 158 μm detection in
SDSS J1148+5251 by Maiolino et al. (2005) was affected by
some calibration issues. In particular, pointing uncertainties may
have played an important role. At that time (2004), the lack of
bright sources close to SDSS J1148+5251 suitable for pointing
calibration, had forced the use of pointing calibration sources
very far away from the target, which may have affected significantly the final pointing accuracy. As a consequence, the
pointing uncertainty of the IRAM 30 m observations was probably comparable to or possibly even larger than the nominal upper limit of 3 quoted by the observatory in 2004. Since the full
width at half maximum (FWHM) of the IRAM 30 m beam-size
at 256 GHz is only of 9.6 , a pointing offset of 3 −4 could
have caused a significant flux loss.
The origin of the discrepancy with the single-dish
(IRAM 30 m) flux measure by Maiolino et al. (2005) is more
uncertain. Similarly to Walter et al. (2009), Maiolino et al.
(2005) had a bandwidth of only 1 GHz, and so they also subtracted the broad wings from the baselines as continuum emission. However, even taking into account the flux loss due to the
wings subtraction, there is still an inconsistency of more than
3.4. The resolved [CII] outflow
A14, page 6 of 21
The [C ii] 158 μm spectrum of SDSS J1148+5251 exhibits extremely broad (FWHM = 2100 ± 500 km s−1 ) wings, superimposed on a narrower core with FWHM = 350 ± 50 km s−1
(Fig. 1). The broad wings of the [C ii] 158 μm line, discovered
by Maiolino et al. (2012), are believed to trace the most distant
and powerful quasar-driven outflow ever detected. The outflow
C. Cicone et al.: Very extended cold gas, star formation and outflows in the halo of a bright quasar at z > 6
is also extremely extended. This could already be inferred from
the low spatial resolution (synthesised beam of 2.2 ×1.8 ) observations presented in Maiolino et al. (2012), which marginally
resolved the emission associated with the broad wings, providing a rough estimate for the outflow size (FWHM) of 2.9 arcsec.
Our new, higher resolution IRAM PdBI observations fully
resolve the [C ii] 158 μm outflow of SDSS J1148+5251. In the
top panels of Fig. 4 we show the continuum-subtracted maps
of the blue and red wings of the [C ii] line, integrated within
v ∈ (−1400, −300) km s−1 and v ∈ (400, 1200) km s−1 , respectively. We also report in the bottom-left panel of Fig. 4 the map of
the wings merged together, similarly to Maiolino et al. (2012).
As already suggested by the analysis of the spectra extracted
from different apertures (Fig. 1 and Table 1), the maps unambiguously show that the wings are extremely extended, and in
particular that they are even more extended than what initially
estimated by Maiolino et al. (2012). The bottom-right panel of
Fig. 4 shows the real part of the visibilities of the broad wings
as a function of the uv baseline radius (also known as “uv plot”).
The steeply declining trend clearly confirms that the broad wings
are extended and resolved by our observations at high significance, and that they are not an artefact of the cleaning process.
We note that the detection of the broad and spatially extended
[C ii] component, tracing the outflow, is also confirmed by splitting the dataset into independent parts.
The fluctuations observed at large uv radii in the uv plot of
the broad wings (bottom-right panel of Fig. 4) indicate that the
morphology of the outflow is complex, non-Gaussian, consistently with the complexity of the structures revealed by the maps.
For example, both a disk-like and a ring-like brightness distributions would produce similar positive and negative fluctuations as
a function of uv radius, although we found that neither of these
models provides a good fit to our data.
The maps of the blue and red wings of the [C ii] 158 μm
emission (upper panels of Fig. 4) indicate that the blueshifted
and the redshifted sides of the outflow are generally co-spatial.
Indeed, the two maps trace the same butterfly-shaped structure,
although some blobs appear brighter in the blue component than
in the red one and viceversa. We note that the spatial correspondence between blueshifted and redshifted wings rules out the
hypothesis that companion galaxies with different systemic velocities are at the origin of the bulk of the broad [C ii] 158 μm
emission, leaving a massive and extended outflow as the only
viable explanation.
3.4.1. Outflow velocity and dynamical time scale
In Maiolino et al. (2012) the outflow was only marginally resolved, and the outflow mass-loss rate of M˙ out 3500 M yr−1
was estimated by assuming a spherical and/or multi-conical
geometry. In the model adopted by Maiolino et al. (2012), the
outflow rate was given by M˙ out = 3vMout /R, where v is the outflow velocity, Mout is the mass of atomic gas in outflow (estimated from the [C ii] 158 μm flux in the broad wings), and R
is the radius of the broad wings emission (obtained by fitting
the uv plot of the broad wings with a circular Gaussian model).
However, our new, higher resolution IRAM PdBI observations
allow us to fully resolve the outflow, hence enabling a much
more detailed characterisation of the outflow properties, which
was not possible with the previous dataset. The complex morphology revealed by the new maps of the outflow (Fig. 4) is
clearly not consistent with the simple spherical or multi-conical
geometry assumed by Maiolino et al. (2012). Any attempt of
modelling the [C ii] outflow in SDSS J1148+5251 based on the
current data would require a different, more complex geometry,
and the uncertainties on such model would be very large. For this
reason, in this paper, we decide to abstain from a simplistic modelling of the outflow geometry and instead we adopt a different,
“resolved” approach for estimating the outflow properties.
Our approach is described in detail in Appendix C, and is
based on measuring the dynamical time scales of individual
“blobs” of [C ii] emission within the outflow4 . More specifically, we produce channel maps centred at different velocities,
spanning the entire velocity range corresponding to the red and
blue wings of the [C ii] 158 μm line, tracing the outflow in the
host galaxy of SDSS J1148+5251. The outflow channel maps
are shown in Fig. C.1. In these maps, we identify 48 “clumps”
belonging to the outflow, as explained in Appendix C. For each
clump in outflow we estimate its average (projected) velocity (v),
its (projected) distance from the quasar (R), and its [C ii] flux,
which is used for estimating the mass of (atomic) gas in outflow as explained in the next section (Sect. 3.4.2). The dynamical time scale of a clump in outflow is therefore simply given
by τdyn = R/v. We note that, by applying this definition, we are
implicitly assuming that the velocity v of the clumps is constant
throughout the outflow.
The relationship between the velocity and the distance from
the quasar of the clumps in outflow is shown in Fig. 5. The average velocity of the outflowing blobs does not depend on R, suggesting that the outflow is not significantly accelerating and/or
decelerating. This also supports the definition of dynamical time
scales given above. The distribution of τdyn within the outflow
is reported in Fig. 6; the histogram shows a slightly skewed left
= 107.4 yr, but spanning a
distribution, with median of τmedian
dyn
6.6
8.0
broad range from τmin
yr to τmax
yr. This indidyn = 10
dyn = 10
cates that the outflow has been in place for ∼100 Myr, which is a
non-negligible fraction of the age of the Universe at this redshift
(i.e. 850 Myr with the adopted cosmology).
One should note that our measurement of τdyn neglects projection effects, more specifically, the fact that the observed
distance R of the clumps from the centre is the projected
distance, and that the observed velocity is actually only the component along our line of sight. As a consequence, the dynamical time scales should be corrected by a factor | tan φ|−1 , i.e.
τdyn (real) = τdyn (obs)/| tan φ|, where φ is the angle between our
line of sight and the outflow direction of each individual cloud.
Obviously φ is not known. However, in the absence of any additional information on the outflow geometry, the most simplistic assumption we can make is that of a uniform distribution
of the outflowing clouds’ velocities as a function of φ. In this
case, the correction factor averaged over the entire solid angle,
1
1
| tan φ|−1 dΩ, is equal to unity. Therefore, al= 4π
| tan φ|
4π
though the dynamical time scales may need to be corrected by
a significant factor for the individual clumps, the global average
trends may not be affected significantly.
3.4.2. Integrated outflow mass-loss rate, kinetic power
and momentum rate
In order to calculate the outflow mass-loss rate, we need to estimate the mass of gas carried by the outflow. To do this, we
4
We note that in this work we also use the term “clumps” to refer to the
blobs of [C ii] emission detected in outflow. The reader should be aware
that these clumps or blobs generally do not correspond to individual
clouds, as the minimum physical size probed by our observations (given
by the synthesised beam) is ∼6−7 kpc.
A14, page 7 of 21
A&A 574, A14 (2015)
Fig. 5. Outflow velocity as a function of the radial distance from the
quasar position. Both R and v are projected quantities. To produce this
plot, the outflowing clumps have been divided into bins of radial distance from the quasar (ΔR = 0.6 arcsec, i.e. 3 kpc). The plot shows
the average velocity of the clumps within each bin ( v = i=N
i=1 vi , where
N is the number of clumps in each bin). The error bars in the x direction
2 1/2
indicate the bin size. The error on v is given by σ v = ( i=N
/N,
i=1 σvi )
where σvi is the uncertainty on the average velocity vi of a clump in outflow, estimated as explained in Appendix C.
Fig. 6. Distribution of dynamical time scales (τdyn = R/v, where R is the
projected distance from the central quasar and v is the outflow velocity)
within the outflow, obtained for the individual outflowing clumps as
described in Sect. 3.4 and in Appendix C.
first measure the [C ii] flux associated with each outflowing
clump, as explained in Appendix C. The relationship between
[C ii] luminosity and gas mass depends on the gas density,
temperature and abundance of C+ ions (XC+ ). We convert the
[C ii] luminosity of the outflowing clumps into gas mass by using the formula provided by Hailey-Dunsheath et al. (2010),
obtained under the hypothesis of optically thin [C ii] emission.
To this regard, we note that the assumption of optically thin
[C ii] has been challenged by observations of high-z dusty star
forming galaxies (Neri et al. 2014; Gullberg et al. submitted).
However, optically thick conditions for [C ii] have been proposed to occur in extremely compact and dense starburst systems. It is unlikely that the diffuse and very extended [C ii] outflowing component detected by us can be optically thick, even
because the large velocity gradients in the outflow make self absorption even more unlikely. As in Maiolino et al. (2012), we
assume that XC+ = 1.4 × 10⁻⁴ , T = 200 K, and n
ncrit
(ncrit ∼ 3 × 103 cm−3 ), typical of photo-dissociated regions
(PDRs), and that 70% of the [C ii] flux arises from such medium
(while the remaining 30% arises from other ISM phases).
A14, page 8 of 21
The integrated outflow rate that we obtain by adding up the
˙ out = Mout /τdyn ) from all of the
mass-loss rate contribution (i.e. M
outflowing clumps is 1400 ±300 M yr−1 . The error on M˙ out (see
Appendix C for the details), does not take into account the uncertainty on the conversion from [C ii] luminosity to atomic gas
mass. We stress that our measurement should be considered as
a lower limit on the total outflow mass-loss rate, in first place
because of the conservative assumptions we made for estimating the atomic gas mass from the [C ii] luminosity, and in second place because it only accounts for the atomic gas phase of
the outflow, while a significant amount of the mass in outflow
may be in the molecular phase, similarly to local ultra-luminous
infrared galaxies (ULIRGs) (e.g. Cicone et al. (2014) and refs
therein).
The integrated outflow mass-loss rate measured using this
“resolved” approach is over a factor of 2 lower than the previous estimate by Maiolino et al. (2012), which was based on
lower resolution and lower sensitivity data and relied on a simplistic model for the outflow geometry. Conversely, our new
method for estimating the outflow mass-loss rate, described in
Sect. 3.4.1 and in Appendix C, does not assume any model for
the outflow geometry. Furthermore, the outflow size estimated
by Maiolino et al. (2012) by fitting the uv data with a simple
Gaussian model was only of R 1.5 arcsec ( 8 kpc), i.e. half
the average R
3 arcsec that we measure by applying our
“resolved” approach to the new dataset. It is therefore not surprising that our revised estimate of the outflow mass-loss rate in
SDSS J1148+5251 is lower than the value that was obtained by
Maiolino et al. (2012), although our estimate should be considered a lower limit as explained above.
We estimate the integrated kinetic power and momentum rate
of the outflow by summing up the contribution from all outflow˙ out v2 and M˙ out v, evaling clumps. Specifically, the sum of 1/2 M
uated separately for each blob in outflow, gives, respectively, an
integrated outflow kinetic power of (3.3 ± 0.5) × 1044 erg s−1
and an integrated outflow momentum rate of (7.2 ± 1.0) ×
1036 g cm s−2 . It is common practice in studies of AGN-driven
outflows to compare these quantities with the AGN bolometric luminosity (LAGN ) and with the total radiative momentum
output from the AGN (LAGN /c). In this case, by using the intrinsic AGN luminosity of LAGN = 5.63 × 10¹³ L inferred by
Schneider et al. (2014) for SDSS J1148+5251, the ratio between our estimate of the outflow kinetic power and LAGN is
(1.6 ± 0.2) × 10−3 , and the ratio between the momentum rate
and LAGN /c is 1.00 ± 0.14. These values and their implications
will be discussed in Sect. 4.1. We also discuss in Sect. 4.1 the
possible contribution of star formation to driving the observed
outflow.
3.4.3. Outflow properties as a function of τdyn and R
In Sect. 3.4.2 we have derived the integrated outflow mass-loss
rate, kinetic power and momentum rate. However, one may argue that given the quite broad distribution in dynamical time
scales within the outflow evidenced in Fig. 6, the clumps were
not ejected all at the same time as a consequence of a single, explosive event, but, instead, they may have been expelled from the
galaxy at different epochs. It is therefore interesting to investigate the contribution to the mass-loss rate, kinetic power and momentum rate of the outflow from clumps with different “ages”,
i.e. with different τdyn . To this end, we present in Fig. 7 the mass˙ out v2 )/LAGN and momenloss rate, the kinetic power ratio (1/2 M
tum rate ratio ( M˙ out v)/(LAGN/c) of the outflow as a function of
C. Cicone et al.: Very extended cold gas, star formation and outflows in the halo of a bright quasar at z > 6
˙ out (left), kinetic power ratio (1/2 M˙ out v2 )/LAGN (centre) and momentum rate ratio ( M˙ out v)/(LAGN /c) (right) as a
Fig. 7. Outflow mass-loss rate M
function of the dynamical time scale of the clumps in outflow. These plots have been obtained by dividing the outflowing clumps (see Sect. 3.4) in
˙ out , (1/2 M˙ out v2 )/LAGN and ( M
˙ out v)/(LAGN /c)
bins of Δlog(τdyn ) = 0.15. The plots show, in correspondence of the average τdyn of each bin, the total M
obtained by adding up the contribution of all the outflowing clumps within the bin. The error bars in the x direction indicate the bin size, i.e.
Δx = ±0.075. The error bars in the y direction are calculated using the statistical error propagation (i.e. by propagating the errors on v, R and on
the [C ii] fluxes measured for each clump in outflow, which are estimated in Appendix C). The errors do not take into account the uncertainty on
the conversion from [C ii] luminosity to atomic gas mass and the uncertainty on the AGN luminosity estimate (Schneider et al. 2014).
˙ out (left), kinetic power ratio (1/2 M˙ out v2 )/LAGN (centre) and momentum rate ratio ( M˙ out v)/(LAGN /c) (right) as a
Fig. 8. Outflow mass-loss rate M
function of the projected distance from the quasar position. These plots have been obtained by dividing the outflowing clumps (see Sect. 3.4) in
˙ out , (1/2 M˙ out v2 )/LAGN
bins of ΔR = 0.6 arcsec, corresponding to 3 kpc. The plots show, in correspondence of the average R of each bin, the total M
˙ out v)/(LAGN /c) obtained by adding up the contribution of all the outflowing clumps within the bin. For an explanation of the error bars, see
and ( M
caption of Fig. 7.
the dynamical time scale of the outflowing clumps. Figure 7
suggests that the ejection of gas has not occurred at a constant
rate in SDSS J1148+5251. In particular, the most extreme outflow event seems to have happened more recently, within the
past ∼5 Myr, as indicated by the first prominent peak of outflow mass-loss rate, kinetic power and momentum flux in Fig. 7.
Interestingly, Fig. 7 shows the presence of a second, broader
peak of these outflow properties between τdyn ∈ (8−20) Myr.
Taken at face value, these findings would imply that, although
the outflow may have been in place for 100 Myr, the bulk of
the mass, energy and momentum have been released throughout
two major outflow events happened more recently, within the
past ∼20 Myr (Fig. 7).
A similar non-uniform distribution of the outflow mass-loss
rate, kinetic power and momentum rate is also evidenced as a
function of the (projected) distance from the quasar, as shown by
Fig. 8, in which we report the radial profiles of the outflow prop˙ out v2 )/LAGN
erties. Figure 8 indicates that, overall, M˙ out , (1/2 M
and ( M˙ out v)/(LAGN/c) decrease with the distance from the
quasar. The main peak can be identified at projected radial distance of ∼0.5 arcsec from the position of the central quasar,
corresponding to ∼3 kpc. There is also marginal evidence
for a second, broad peak between r ∈ (1.5−3) arcsec (i.e.
r ∈ (8−17) kpc). Similarly to what suggested for Fig. 7, the two
peaks in Fig. 8 may be associated to major outflow events during
the recent life of the quasar-galaxy. However, the significance of
the second peak at r ∈ (8−17) kpc is low, so this interpretation
should be taken with caution. Figure 8 can be readily compared
with the predictions of recent theoretical studies of AGN feedback (Costa et al. 2014b; Thompson et al. 2014). This discussion
is presented in Sect. 4.1.
We stress that observations are naturally limited for large R
(and hence for high τdyn ): indeed, outflow clumps at large distances from the galaxy centre are more difficult to probe due to
the sensitivity of our maps. The lowest outflow velocities (which
can also give high values of τdyn ) are also difficult to probe due to
contamination by quiescent gas, i.e. the narrow component of the
[C ii] line. In addition, “old” outflowing clumps, associated with
longer dynamical time scales and typically at larger distances,
are more likely to have dissolved or evaporated. Therefore, the
decreasing outflow rate with τdyn and radius may be in part the
result of sensitivity issues in the observations and/or of the effect
of outflowing clouds dissolving as they travel to larger distances,
or being decelerated by the interaction with the intergalactic and
circumgalactic media. For similar reasons, it is difficult to assess
with the current data whether the outflow in SDSS J1148+5251
A14, page 9 of 21
A&A 574, A14 (2015)
Fig. 9. IRAM PdBI continuum-subtracted map (left) and uv plane analysis (right) of the core of the [C ii] 158 μm emission line of
SDSS J1148+5251, integrated within v ∈ (−200, 200) km s−1 . Left: negative and positive contours correspond to −3σ, 3σ, 5σ to 40σ in steps of
5σ (1σ rms noise is 0.10 Jy beam−1 km s−1 ). The cross indicates the pointing and phase centre, corresponding to the optical position of the quasar.
Right: real part of visibilities as a function of the uv distance (uv plot), binned in baseline steps of 10 m. The red curve indicates the best fit to
the uv plot, which corresponds to the sum of two components: a point (unresolved) source, responsible for the flattening of the visibilities at large
uv radii (uv radii > 50 m), and an extended (resolved) source fitted with a circular Gaussian model, which is responsible for the sharp decline of
the visibilities at small uv radii.
manages to escape the viral radius of the host galaxy and to enrich the intergalactic medium (IGM).
3.5. Quiescent (narrow) [C II] emission
The map of the narrow component of the [C ii] 158 μm emission,
integrated within v ∈ (−200, 200) km s−1 , is presented in Fig. 9.
The source is resolved at high significance by our PdBI observations, and it appears surprisingly extended, on scales >
∼20 kpc.
This could already be inferred from the spectra extracted from
different apertures, which showed that the flux of the narrow
component is a factor of ∼2 larger in the 4 arcsec-aperture spectrum with respect to the 2 arcsec-aperture spectrum (Fig. 1 and
Table 1).
The uv plot of the narrow [C ii] 158 μm emission, in the
right panel of Fig. 9, provides important information about
the structure of the source. In particular, the uv plot clearly
shows the presence of two components: a compact component
(not resolved), which is responsible for the flattening of the
uv visibility amplitude at large (>50 m) uv radii, and an extended component (resolved at high significance), which is at
the origin of the decreasing trend of the uv visibility amplitude with radius at small uv radii5 . The red curve represents
our best fit model, which is obtained by fitting the compact
component with a point source and the resolved component
with a circular Gaussian distribution. The resulting FWHM
size of the circular Gaussian model is 3.1 ± 0.3 arcsec, corresponding to 17.4 ± 1.7 kpc. The velocity-integrated fluxes
derived from the uv modelling are 6.2 ± 0.6 Jy km s−1
and 3.08 ± 0.12 Jy km s−1 for the resolved/extended and
5
We note that the detection of this spatially extended component has
also been confirmed by splitting the dataset into independent parts.
A14, page 10 of 21
point sources, respectively. These fluxes can be translated
into [C ii] luminosities of L[CII],ext = (6.7 ± 0.7) × 109 L and
L[CII],point = (3.33 ± 0.13) × 109 L . Strikingly, the uv fit indicates that about 70% of the total [C ii] emission at velocities
v ∈ (−200, 200) km s−1 is in the extended component. We note
that, however, the quality of the data does not allow us to distinguish between different models for the extended source. In particular, an exponential intensity distribution would also provide
a good fit to the resolved component.
The extended and compact components contributing to the
narrow [C ii] emission within v ∈ (−200, 200) km s−1 can be disentangled in the uv plane and, therefore, imaged separately, by
using the model fit shown in Fig. 9. In the upper panel of Fig. 10
we show the map of the extended component, obtained by subtracting from the uv data the point source model fit. The map
shows an irregular ring-like and filamentary structure, with the
most prominent filament extending up to r ∼ 28 kpc (5 arcsec)
in the western direction with respect to the quasar position. The
centroid of the extended source is slightly shifted to the southeast with respect to the optical quasar position (indicated by the
cross). The map of the compact component is shown in the bottom panel of Fig. 10, and it has been obtained by applying a
uv tapering that cuts the visibilities with uv radius < 80m. This
bright, compact source, unresolved in our data and peaking at the
quasar position, had already been detected and imaged by Walter
et al. (2009) and it is likely tracing a kpc-scale hyper-starburst in
the centre of SDSS J1148+5251.
We find no evidence for a regular rotation pattern in our
IRAM PdBI [C ii] maps (Appendix D). A spatial shift between
the blue- and the red-shifted sides of the [C ii] line was found
in previous high resolution interferometric [C ii] observations
by Walter et al. (2009), which we now know that were resolving out a large portion of extended [C ii] flux (∼70% within
C. Cicone et al.: Very extended cold gas, star formation and outflows in the halo of a bright quasar at z > 6
The spatially extended and kinematically quiescent (i.e.
“narrow”) [C ii] source discovered in SDSS J1148+5251
(top panel of Fig. 10) is reminiscent of the giant (r
50 kpc) low surface brightness and kinematically unperturbed
(σv 300 km s−1 ) haloes found in high redshift radio galaxies
(HzRGs) by Villar-Martín et al. (2003). These quiescent nebulae around HzRGs are detected in several emission lines (Lyα,
C iv, He ii, N v) and are thought to trace giant halo gas reservoirs
(rather than companion galaxies) photoionised primarily by
the radio-loud quasar continuum. Although SDSS J1148+5251
is not radio-loud (Carilli et al. 2004), and although previous
Hubble Space Telescope (HST) observations by Decarli et al.
(2012) did not find evidence for extended Lyα emission (possibly due to strong dust extinction on large scales, as supported
by our FIR continuum observations described in Sect. 3.6), our
new IRAM PdBI observations of an extended and quiescent
[C ii] halo surrounding this high-z quasar show some similarities
(e.g. the spatial extent and the velocity dispersion) with the gas
haloes surrounding HzRGs. In the case of SDSS J1148+5251,
however, we also detect associated FIR continuum emission up
to r 8−10 kpc (Sect. 3.6), suggesting that extended star formation, rather than the quasar, is the main excitation source of the
[C ii] halo, at least up to scales of r 10 kpc. We further discuss
the origin of the extended [C ii] source and its connection with
star formation in Sects. 4.2 and 4.3.
3.6. Analysis of the FIR continuum extent
Fig. 10. Maps of the extended (top) and compact (bottom) components
that contribute to the core [C ii] 158 μm emission of SDSS J1148+5251
within v ∈ (−200, 200) km s−1 . The map of the extended component
has been obtained by subtracting from the uv data the point source
model fit. The map of the compact component has been produced by
applying a uv tapering that cuts the visibilities with uv radius <80 m;
this operation increases the spatial resolution of the data (the resulting
beam size is 1.1 ×1.1 ). Negative and positive contours are in steps
of 2σ for the extended component in the top panel (1σ rms noise of
0.10 Jy beam−1 km s−1 ). For the compact component in the bottom
panel, contours correspond to −3σ, 3σ, 5σ to 30σ in steps of 5σ
(1σ rms noise of 0.11 Jy beam−1 km s−1 ). In both panels, the cross
indicates the pointing and phase centre, corresponding to the optical
position of the quasar.
v ∈ (−200, 200) km s−1 as shown by our uv fit in Fig. 9). While
the compact source, which is not resolved by our observations,
is probably rotationally-broadened as suggested by Walter et al.
(2009), the hypothesis of rotation does not seem to hold for the
dominant extended component, as shown in Fig. D.1, although
some irregular velocity pattern is observed, possibly associated
with some minor mergers. This implies that it is difficult to estimate the dynamical mass of this system on large scales.
We investigate the presence of extended dust emission in
SDSS J1148+5251 by using ancillary high sensitivity IRAM
PdBI observations of the FIR continuum in this source obtained
as a part of a parallel project presented by Gallerani et al. (2014)
(see also Sect. 2). These deep ancillary continuum observations
at 262 GHz and 259.4 GHz are particularly suited for studying
the extent of the FIR emission in SDSS J1148+5251, as, once
merged, they reach a continuum sensitivity of 0.082 mJy beam−1
and have a slightly higher spatial resolution (synthesised beam
of 1.1 × 1.0 ) than our main dataset at 256 GHz.
The left panel of Fig. 11 shows the map of the FIR continuum emission of SDSS J1148+5251 at an average rest-frame
wavelength of λ = 155 μm (average observed frequency of
261 GHz), produced by merging the two datasets at 262 GHz
and 259.4 GHz as explained in Sect. 26 . The corresponding
uv visibility diagram is shown in the right panel of Fig. 11.
Similarly to the narrow [C ii] 158 μm emission (Fig. 9), the
dust thermal emission can also be disentangled in the uv data
into a compact (unresolved) and an extended (resolved) component. Accordingly, we fit the uv plot of the 155 μm FIR continuum with a combination of a point source model and a circular
Gaussian model, and show the best fit as a red curve in Fig 11.
We stress that, although the circular Gaussian model provides
a good fit to the data, it constitutes a simplistic approximation,
and better quality data may reveal a more complex structure. The
uv fit indicates that 45 ± 9% of the FIR emission at this wavelength is in the extended source, and it provides a FWHM size
for the circular Gaussian component of 2.0 ± 0.5 arcsec, corresponding to 11 ± 3 kpc. Taken at face value, this result suggests
6
A zoomed-out version of this map, showing the marginal detection
of an additional continuum source in the field, is shown in Fig. A.1
(Appendix A). In Fig. A.1 we also show a map of the 256 GHz continuum, obtained by collapsing the line-free channels of the main dataset
and used for the purpose of continuum-subtraction as described in
Sect. 3.1.
A14, page 11 of 21
A&A 574, A14 (2015)
Fig. 11. IRAM PdBI map (left) and uv plane analysis (right) of the FIR continuum of SDSS J1148+5251 at average rest-frame wavelength
λ = 155 μm (average observed frequency of 261 GHz). Left: negative and positive contours correspond to −3σ, 3σ, 5σ to 35σ in steps of 5σ
(1σ rms noise is 0.082 mJy beam−1 ). The synthesised beam is shown at the bottom left corner (1.1 × 1.0 ) and the cross indicates the pointing
and phase centre, corresponding to the optical position of the quasar. Right: real part of visibilities as a function of the uv distance (uv plot), binned
in baseline steps of 20 m. The red curve indicates the best fit to the uv plot, which corresponds to the sum of two components: a point (unresolved)
source, responsible for the flattening of the visibilities at large uv radii (uv radii > 100 m), and an extended (resolved) source fitted with a circular
Gaussian model, which is responsible for the decreasing trend at smaller uv radii.
that the narrow [C ii] (FWHM = 17.4 ± 1.7 kpc) extends beyond
the region of intensive and high surface density star formation
in the host galaxy of SDSS J1148+5251, traced by the FIR continuum emission (FWHM = 11 ± 3 kpc) (further discussion in
Sect. 4).
We use the uv fit results for producing separate maps of
the extended and compact FIR sources, which are presented in
Fig. 12. Strikingly, the resolved component exhibits a tail extending by r ∼ 10 kpc in the western direction, i.e. the same
direction as the r ∼ 28 kpc filament observed in the map of the
extended [C ii] (Fig. 10). This suggests that the western [C ii] filament embeds star formation heating dust on r ∼10 kpc scales.
In order to estimate the FIR luminosity associated with the
extended and compact dust continuum sources, we apportion the
total FIR luminosity of SDSS J1148+5251, LFIR(42.5−122.5 μm) =
(1.3 ± 0.2) × 1013 L (Rosa Valiante, priv. comm.7 ), according to the flux ratio estimated from our uv modelling of the
FIR emission at 155 μm (Fig. 11). This results into FIR
(42.5−122.5 μm) luminosities of LFIR,ext = (6.0 ± 1.5) × 1012 L
and LFIR,point = (7.4 ± 1.6) × 1012 L for the extended and compact component, respectively.
4. Discussion
4.1. The driving mechanism of the outflow
In Sect. 3.4 we have studied with unprecedented detail the
properties of the massive and extended [C ii] outflow of
SDSS J1148+5251. We have shown that the [C ii]-emitting gas
7
This value of LFIR(42.5−122.5 μm) has been estimated by using the same
method as in Valiante et al. (2011), by restricting the integration range
to the wavelength range 42.5−122.5 μm.
A14, page 12 of 21
in this source reaches extremely high projected outflow velocities of v ∼ 1400 km s−1 , with an average outflow velocity
of v
800 km s−1 (Fig. 5). The observed very high velocities
strongly favour the AGN as the dominant driving mechanism of
the outflow in SDSS J1148+5251.
However, SDSS J1148+5251, besides hosting a powerful
unobscured quasar (LAGN = 5.63 × 10¹³ L , Schneider et al.
2014), is also a powerful starbursting galaxy (Walter et al. 2009).
In particular, our new deep FIR continuum observations show
the presence of strong and spatially extended warm dust continuum emission, indicative of intense star formation occurring
up to scales of at least r ∼ 8−10 kpc (see also discussion in
Sect. 4.3). By splitting the total infrared (TIR, 8−1000 μm) luminosity of LTIR(8−1000 μm) = (2.2 ± 0.3) × 1013 L (Valiante et al.
2011) according to the flux ratio between extended and compact component estimated from our uv analysis of the FIR continuum emission (Sect. 3.6), we obtain for the extended component LTIR,ext = (10 ± 2) × 1012 L . By using the relation in
Kennicutt (1998), a Chabrier IMF and a negligible AGN contribution (such assumption is only valid for the extended component, as the AGN contribution to dust heating may be significant in the unresolved component, as shown by Schneider
et al. 2014), the TIR luminosity can be converted into a star
formation rate of SFRext = (1000 ± 200) M yr−1 . Supernova
events associated with such an high star formation rate may also
be an important source of feedback in SDSS J1148+5251 (see
also Costa et al. 2014c,a). Following Veilleux et al. (2005), the
kinetic power injected by supernovae associated with SFRext is
Pkin,SF = (7.0±1.7)×1044 erg s−1 . A comparison between Pkin,SF
and our (lower limit) estimate of the integrated outflow kinetic
power of Pkin,outflow = (3.3 ± 0.5) × 1044 erg s−1 (Sect. 3.4.2)
would give a lower limit on the coupling efficiency (by assuming
a purely star formation-driven outflow) of 47 ± 13%. Such lower
C. Cicone et al.: Very extended cold gas, star formation and outflows in the halo of a bright quasar at z > 6
Fig. 12. Maps of the extended (top) and compact (bottom) components
that contribute to the FIR continuum emission of SDSS J1148+5251
at average rest-frame wavelength λ = 155 μm. The map of the extended component has been obtained by subtracting, from the uv data,
the point source model of the compact component resulting from the
uv fit reported in Fig. 11. The map of the compact component has
been obtained by applying a uv tapering that cuts visibilities with uv
radius <100 m, therefore slightly increasing the resolution of the data
(the resulting beam size is 0.99 × 0.89 ). In the map of the extended
component, contours correspond to −3σ, 3σ, 5σ to 9σ in steps of 2σ
(1σ rms noise is 0.082 mJy beam−1 ). For the compact component, contours correspond to −3σ, 3σ, 5σ to 25σ in steps of 5σ (1σ rms noise is
0.088 mJy beam−1 ). In both panels, the cross indicates the pointing and
phase centre, corresponding to the optical position of the quasar.
limit efficiency is already significantly higher than the value of
1−10% expected for star formation-driven winds (e.g. Cicone
et al. 2014).
In the following, based on the velocity and coupling efficiency arguments, we will assume that, although the intense star formation on large scales may also play a role,
the AGN gives the dominant contribution to driving the outflow. This is also in agreement with the hierarchical semianalytic models by Valiante et al. (2012), who predicted quasar
feedback to be the dominant mechanism in SDSS J1148+5251.
We will now discuss the properties of the major [C ii] outflow in SDSS J1148+5251 in the light of current models of
AGN feedback.
The models that have been proposed so far for explaining
AGN-driven kpc-scale outflows can be branched into two main
categories: the so-called “blast wave” models, in which large
scale outflows are generated by hydrodynamical coupling of
the AGN with the galaxy ISM through fast winds originating
from the accretion disk (e.g. King 2003, 2005, 2010; Lapi et al.
2005; Menci et al. 2006, 2008; Zubovas & King 2012, 2014;
Faucher-Giguère & Quataert 2012; Costa et al. 2014b and references therein), and the models invoking radiation pressure on
dusty clouds as the main mechanism at the origin of galacticscale outflows (e.g. Hopkins & Elvis 2010; Fabian 2012; Roth
et al. 2012; Thompson et al. 2014 and refs therein). In the recent
years, both classes of models have been tested against observations of AGN-driven outflows and, in particular, of massive kpcscale outflows of cold and dense molecular gas in nearby galaxies (Feruglio et al. 2010, 2013a,b; Alatalo et al. 2011; Sturm
et al. 2011; Aalto et al. 2012; Veilleux et al. 2013; Spoon et al.
2013; Combes et al. 2013; Cicone et al. 2012, 2014; GarcíaBurillo et al. 2014). A recent study by Cicone et al. (2014)
showed that the “blast wave” scenario and, specifically, the
“energy-conserving” nature of the observed large-scale molecular outflows is favoured when considering a consistent sample of (U)LIRGs and powerful quasars in the local Universe.
However, there are only a few studies investigating the feedback mechanisms in high-z sources and, in particular, the detail of information provided by our new [C ii] observations of
SDSS J1148+5251 is unprecedented. In this section we discuss
our results, presented in Sect. 3.4, in the light of the proposed
theoretical models for AGN-driven outflows.
In this context, theoretical works have shown that there are
three main properties of outflows, namely the mass-loss rate, the
momentum rate (or momentum flux) and the kinetic power, that
can be used as “key” indicators for the dominant feedback mechanism in action. In Sects. 3.4 and Appendix C we have used our
new [C ii] observations for inferring these properties (both integrated and as a function of dynamical time scale and radius)
for the very extended outflow in SDSS J1148+5251. Bearing in
mind that these are lower limits (because of the caveats discussed
in Sect. 3.4 and Appendix C), the integrated values that we have
obtained, do not help much in discriminating between different
models. In particular, the modest integrated momentum rate of
(1.00±0.14) LAGN /c and kinetic power of (1.6±0.2)×10−3 LAGN
would be in principle consistent with any of the proposed models. However, the unprecedented spatial extent of the outflow in
SDSS J1148+5251 has allowed us, for the first time, to go beyond the integrated values by investigating the dependence of
the outflow properties as a function of the dynamical time scale
of the outflow and of the distance from the quasar (Figs. 7 and 8).
The plots in Fig. 8, in particular, allow a direct comparison
with the predictions of two recent studies, Costa et al. (2014b),
who incorporate the sub-grid physics representing the “blast
wave” feedback prescriptions into cosmological simulations,
and Thompson et al. (2014), who further develop the physics
of dusty radiation-pressure driven shells and discuss it in the
context of the most recent observational results. Our results appear qualitatively inconsistent with the results obtained by Costa
et al. (2014b) from cosmological simulations of energy-driven
outflows generated by inner accretion disk winds, which instead
show that, on the same physical scales of 30 (proper) kpc,
the momentum flux and kinetic power of the outflow overall
A14, page 13 of 21
A&A 574, A14 (2015)
increase with radial distance from the AGN (Fig. 15 of Costa
et al. 2014b). Moreover, quantitatively, the outflow momentum
rate and kinetic power inferred for SDSS J1148+5251 are about
one order of magnitude lower than the integrated values reported by Costa et al. (2014b) for the same simulation. We note
however that the previously mentioned results by Costa et al.
(2014b) were obtained using a central black hole with mass
of ∼108 M , i.e. significantly lower than the black hole mass
of ∼3 × 10⁹ M estimated for SDSS J1148+5251 (Willott et al.
2003). Simulations may produce significantly different results
for more massive haloes and BHs. For example, Costa et al.
(2014b) show that, in presence of a more massive BH (MBH ∼
109 M ), even in the “momentum-driven” limit, i.e. the limit in
which the thermal energy input from the inner wind is not conserved, efficient large scale AGN-driven outflows may develop,
comparable to those developed under “energy-conserving” conditions. In this case, by definition, the momentum flux would
be of the order of LAGN /c, consistently to what we infer for
SDSS J1148+5251.
Costa et al. (2014b) also show that, when an AGN-driven
outflow develops, regardless of its momentum- or energyconserving nature, its morphology is highly anisotropic and it
strongly depends on the cosmological environment. In particular, the outflow develops preferably along “lower density” paths,
free from filamentary cosmic inflows or from regions characterised by large amounts of dense gas in the halo or in the host
galaxy. Interestingly, by comparing the maps in Fig. 4 and the
top panel of Fig. 10, we note that the peak of the outflow component does not coincide with the peak of the narrow extended
component. On the contrary, the narrow extended component
(top panel of Fig. 10) peaks to the south-east with respect to
the quasar position, where the outflow appears suppressed. If assuming that the emission within v ∈ (−200, 200) km s−1 is not
significantly contaminated by the outflow, this result would support the scenario in which the outflow develops preferably in
directions avoiding high density regions in the galaxy or in the
halo.
We now consider the second class of models of AGN-driven
outflows, i.e. models of outflows generated by coupling of the
AGN radiation to dusty interstellar medium at galactic (∼kpc)
scales. More specifically, we refer to the work by Thompson
et al. (2014), who further developed the physics on which these
models are based, demonstrating that dusty radiation-pressure
driven shells can reach high velocities (vout
vesc ). The predictions of Thompson et al. (2014) are qualitatively consistent
with our observations of the outflow in SDSS J1148+5251, as
shown by a comparison between our Fig. 8 and Fig. 3 of their
paper. In particular, the decreasing trend with R and the modest (although lower limit) value of the momentum flux inferred
for SDSS J1148+5251 could be explained by dusty radiationpressure driven shells without resorting to extreme ISM conditions such as τIR
1. Our resolved FIR continuum observations
(Fig. 12) show that large amounts of dust are indeed present in
this source. However, the FIR emission, indicating the presence
of warm dust, only extends up to maximum radial distances of
r
10 kpc from the nucleus, while the outflow extends up to
r 30 kpc.
We finally consider the possibility that a previous episode of
radio-jets may have driven the observed outflow. Carilli et al.
(2004) imaged the radio continuum of SDSS J1148+5251 at
1.4 GHz with the very large array (VLA), and they found
that this source is radio-quiet, with a radio continuum emission consistent with being primarily powered by star formation. Therefore, if radio jets are responsible for the observed
A14, page 14 of 21
Fig. 13. [C ii] /FIR luminosity ratio as a function of FIR luminosity,
with our new estimate of L[CII] /LFIR in SDSS J1148+5251, obtained
separately for the extended and compact components, as explained in
Sect. 4.2. For comparison, the plot also includes previous ISO observations of local star-forming galaxies (asterisks, Malhotra et al. 2001)
and of local ULIRGs (diamonds, Luhman et al. 2003) along with their
median and scatter (dashed lines), recent Herschel/PACS observations
of local LIRGs (small open circles, Díaz-Santos et al. 2013), the CSOZEUS survey of star forming and active galaxies at redshift 1 < z < 2
(triangles, Stacey et al. 2010), observations of sub-millimetre galaxies
(SMGs) at 2 < z < 5 (open circles, Ivison et al. 2010; De Breuck
et al. 2014; Valtchanov et al. 2011; Cox et al. 2011; Swinbank et al.
2012; Carniani et al. 2013), sub-millimetre galaxies (SMGs) at z > 5
(filled circles, Riechers et al. 2013, 2014; Neri et al. 2014; Rawle et al.
2014), quasars at 2 < z < 5 (open stars, Maiolino et al. 2009; Wagg
et al. 2010; Carniani et al. 2013), and z > 5 quasars (filled stars,
Venemans et al. 2012; Wang et al. 2013; Willott et al. 2013). The dotted
horizontal line indicates the Milky Way value (L[CII] /LFIR ∼ 3 × 10⁻³ ,
Carilli & Walter 2013). All measurements refer to the FIR luminosity
as integrated over 42.5–122.5 μm. Where necessary, we have converted
LFIR(40−500 μm) and LTIR(8−1000 μm) into LFIR(42.5−122.5 μm) by using the conversion factors provided by Carilli & Walter (2013), i.e. LFIR(40−500 μm)
1.2 LFIR(42.5−122.5 μm) and LTIR(8−1000 μm) 1.3 LFIR(40−500 μm) .
large-scale [C ii] outflow, they have now disappeared. However,
the complex outflow morphology (Fig. 4) and the rather flat trend
of velocity as a function of radius (Fig. 5) suggest that a significant contribution from radio jets is unlikely, as radio jets tend
to drive very collimated outflows with large velocity gradients
across the kpc-scale jets (e.g. Nesvadba et al. 2008).
4.2. The [C II]-to-FIR luminosity ratio
In Sects. 3.5 and 3.6 we have shown a method, based on
the uv visibility analysis, for decomposing both the narrow [C ii] emission and the FIR continuum emission of
SDSS J1148+5251 into an extended (resolved) and a compact
(unresolved) component. Following this decomposition, we estimate the [C ii]-to-FIR luminosity ratios separately for these two
components. We obtain log(L[CII] /LFIR )EXT = −2.95+0.10
−0.13 and
+0.09
log(L[CII] /LFIR )POINT = −3.34−0.11. These estimates are compared in Fig. 13 with literature L[CII] /LFIR measurements obtained for local and distant galaxies.
C. Cicone et al.: Very extended cold gas, star formation and outflows in the halo of a bright quasar at z > 6
We stress that the L[CII] /LFIR values reported in Fig. 13 refer to the compact and extended components of the narrow
[C ii] emission in SDSS J1148+5251, integrated within (−200,
200) km s−1 . By only selecting the emission within this narrow velocity range, we intend to avoid contamination by the
outflow, whose contribution to the [C ii] flux may be significant already at velocities |v| > 200 km s−1 , as shown in
Appendix C. However, the reader should be aware that, by selecting a wider velocity range for the [C ii] emission, the ratio
L[CII] /LFIR would naturally increase, especially for the extended
component. In particular, by selecting the [C ii] emission within
(−300, 400) km s−1 , we obtain log(L[CII] /LFIR )EXT = −2.79+0.10
−0.14
and log(L[CII] /LFIR )POINT = −3.26+0.09
−0.11 , corresponding to an increase of L[CII] /LFIR by a factor of 1.5 ± 0.5 and by a factor of 1.2 ± 0.4 for the extended and compact components,
respectively.
The [C ii]-to-FIR luminosity ratio is related to the contribution of the [C ii] line emission to the cooling of the (neutral) ISM
in comparison to the cooling via dust grains as traced by the
FIR emission. In local galaxies, early infrared space observatory
(ISO) observations and, more recently, Herschel observations,
have established a clear trend for decreasing [C ii]-to-FIR ratio
with increasing FIR luminosity (Luhman et al. 2003; Brauher
et al. 2008; Díaz-Santos et al. 2013). The decreasing trend is
even more evident for L[CII] /LFIR as a function of LFIR /MH2
(Graciá-Carpio et al. 2011). In particular, in local LIRGs and
ULIRGs, L[CII] /LFIR drops by about one order of magnitude with
respect to normal disk galaxies, and this deficiency is also extended to other FIR fine structure lines such as the [O i] 63 μm
and [N ii] 122 μm emission lines.
Lower [C ii]-to-FIR ratios are most likely associated with
intense star formation activity occurring in compact and warm
starbursts (Díaz-Santos et al. 2013). More specifically, in compact starbursts, the main factors that can act to reduce the
[C ii] emission with respect to the FIR emission are: (i) high
gas volume densities (n
n[CII]
cr ), for which the level popu+
lations of the C atoms ratio as their statistical weights, and
thus the [C ii] intensity becomes almost insensitive to higher gas
volume densities and higher FUV fluxes (Wolfire et al. 1989);
(ii) high ratios of FUV intensity field to the total hydrogen gas
volume density, which would increase the positive charge of dust
grains, thereby reducing the efficiency of gas heating via photoelectrons released by dust grains and so the relative efficiency of
cooling via [C ii] emission with respect to dust cooling (Luhman
et al. 2003; Díaz-Santos et al. 2013); (iii) a high ionisation parameter U (which is essentially linked to (ii)) that reduces the
opacity of hydrogen atoms (because a high amount of HI is
ionised) with respect to the dust opacity, hence increasing the
fraction of UV photons absorbed by dust. Additionally, the incident UV radiation heats the dust to higher temperatures (Abel
et al. 2009; Graciá-Carpio et al. 2011). Lower [C ii]-to-FIR ratios may also be associated with an increased AGN contribution
to the dust heating (and so to LFIR ) for sources with higher FIR
luminosities. According to Sargsyan et al. (2014), the [C ii] luminosity is little affected by the presence of an AGN and it traces
mostly star formation, while the FIR luminosity can have a significant AGN contribution in addition to the starburst component, resulting therefore in lower L[CII] /LFIR for AGN-dominated
sources.
However, a relation between the [C ii] luminosity and the
FIR luminosity has not been clearly established for high redshift infrared luminous galaxies, which display a large scatter in
the L[CII] /LFIR vs. LFIR diagram (Graciá-Carpio et al. 2011), in
Fig. 14. [C ii] /FIR luminosity surface density ratio as a function of the
projected distance from the quasar optical position. The black curve
represents our model of Σ[CII] /ΣFIR (r) for the extended source, obtained
from the analysis of the uv data as explained in Sect. 4.2. The grey
shaded region indicates the statistical uncertainty on the Σ[CII] /ΣFIR predicted by the model based on the uv analysis. The blue triangles show
the values of L[CII] /LFIR calculated at different radii by integrating the
extended [C ii] and FIR emission over concentric annuli. For comparison, the [C ii] /FIR luminosity ratio of the compact (unresolved) component is also shown, plotted at a representative upper limit radius of
FWHMbeam /2, where FWHMbeam refers to the beam-size of the FIR
continuum observations (Fig. 11).
some cases with values that are completely consistent with local disk galaxies, as also shown by Fig. 13. We find that, in the
case of SDSS J1148+5251, the [C ii] -to-FIR ratio in the compact source is lower than in the extended component, by a factor
of ∼2.5 (Fig. 13). We note that a similar result has been obtained
by Díaz-Santos et al. (2014) for the nuclear and extended components of local LIRGs observed with Herschel/PACS. This finding is consistent with a picture in which the nuclear [C ii] and
FIR emissions in SDSS J1148+5251 are excited by a compact
“hyper-starburst” (Walter et al. 2009), similar to the nuclear regions of local ULIRGs, while the extended components trace
more diffuse, “disk-like” star formation.
In Fig. 14 we show the [C ii] -to-FIR surface density ratio as a function of the projected distance from the quasar. The
black curve is obtained by modelling in the uv data the [C ii] and
FIR extended components with circular Gaussian distributions
(Sects. 3.5 and 3.6), and it corresponds to:
Σ[CII]
L[CII],ext σ2FIR
1
1
(r) =
−
exp − r2
,
2
2
ΣFIR
LFIR,ext σ[CII]
2σ[CII] 2σ2FIR
(1)
where L[CII],ext = (6.7 ± 0.7) × 109 L , LFIR,ext = (6.0 ± 1.5) ×
1012 L , σ[CII] = (1.32 ± 0.13) arcsec and σFIR = (0.9 ± 0.2) arcsec, as derived from the uv analysis. We remind that this model
of Σ[CII] /ΣFIR (r) is based on the narrow [C ii] emission integrated
within (−200, 200) km s−1 , because in this velocity range the
[C ii] flux contamination by the outflow is low ( 20%, according to the spectral decomposition shown in Fig. 1). Considering
a larger velocity range for the [C ii] emission would have as
a main effect an upward shift of the relationship in Fig. 14.
In particular, if taking into account the [C ii] emission within
A14, page 15 of 21
A&A 574, A14 (2015)
(−300, 400) km s−1 , Σ[CII] /ΣFIR increases, at every radius, by a
factor of ∼1.4.
The blue triangles in Fig. 14 show the Σ[CII] /ΣFIR (r) ratio
obtained by integrating the [C ii] extended emission in the top
panel of Fig. 10 over concentric annuli with Δr = 0.4 arcsec.
These values follow quite well the black curve, at least up to
r
8 kpc. We also show in Fig. 14 the L[CII] /LFIR ratio obtained for the compact source, plotted in correspondence of an
upper limit-radius of 0.5 arcsec (2.8 kpc), corresponding to half
beam size. Interestingly, the [C ii]-to-FIR ratio measured for the
compact source is consistent within the one-sigma uncertainty
with the value obtained for the extended source at a comparable r, suggesting that the two components may be powered by a
similar mechanism (i.e. intense and compact star formation), at
least up to ∼ 5 kpc distance from the nucleus. At larger r, i.e.
5 < r[kpc] < 10, Σ[CII] /ΣFIR (r) increases to values more compatible with the disks of local galaxies (although still lower than
the values measured in the Milky Way and in the bulk of local
galaxies, see Fig. 13), hinting at a less extreme star formation
activity occurring on these scales.
The discovery of extended star formation (at least up to
scales of r ∼ 10 kpc) in SDSS J1148+5251 challenges the scenario presented by previous observations of high redshift quasar
host galaxies, which suggested that in this class of sources both
the star formation and the cold gas reservoirs are confined within
less than a few kiloparsecs from the nucleus (Carilli & Walter
2013). Quite interestingly, the possibility of a diffuse and extended mode of star formation in high-z massive galaxies was
predicted by Hatch et al. (2008), who discovered a large (60 kpc)
halo of diffuse ultraviolet light, powered by a young stellar population, surrounding the Spiderweb Galaxy, a radio galaxy at z =
2. Understanding the origin of the [C ii] emission at r 10 kpc
and its connection with star formation is however more complex,
and possible explanations are suggested in Sect. 4.3.
4.3. Origin of the [C II] emission at r
10 kpc
Figure 14 shows that our model uncertainty for the [C ii] -toFIR surface density ratio increases significantly for r 10 kpc,
and, in particular, no constraints can be put on Σ[CII] /ΣFIR at such
large radii. This is due to the fact that, above r ∼ 8−10 kpc, the
FIR continuum drops below our sensitivity and only [C ii] is detected, as it can be clearly seen by comparing the upper panels of Figs. 10 and 12. Previous studies have suggested that
[C ii] emission is a good tracer of star formation in galaxies regardless of their classification as starbursts, AGN hosts or composite galaxies (e.g. Sargsyan et al. 2014; De Looze et al. 2014).
However, the abrupt drop of FIR surface density that we observe in SDSS J1148+5251 at r
10 kpc may indicate that
the [C ii] flux in this source and on such large scales does not
correlate with star formation (and so with the FIR emission)
in the same way as in the nuclear regions. In other words, extended [C ii] emission at r
10 kpc may trace a different
regime of star formation with respect to the central regions of
the galaxy (r < 5 kpc) and also with respect to the regions at
5 < r[kpc] < 10.
Furthermore, at r
10 kpc, a significant amount of
[C ii] may trace a different ISM phase than dense PDRs. For
example, [C ii] may arise from diffuse HI (mostly cold neutral
medium, CNM), diffuse molecular clouds and, in minor measure, diffuse warm ionised medium (WIM). This behaviour of
[C ii] has been observed in low metallicity systems such as
Haro 11 and in the outskirts of the Milky Way and other local
A14, page 16 of 21
galaxies (Kramer et al. 2013; Parkin et al. 2013; Pineda et al.
2013; Langer et al. 2014). In particular, Kramer et al. (2013)
have shown that the CNM contribution to [C ii] in the outer regions of M33 increases by ∼25% with respect to the inner region (i.e. r < 2 kpc). This effect is accompanied by an increase
of L[CII] /LFIR by almost a factor of 4 for r > 4.5 kpc, similarly
to what we observe in SDSS J1148+5251, although in M33 the
transition occurs at much smaller scales. Moreover, Pineda et al.
(2013) and Langer et al. (2014) have shown that, in our Galaxy, a
significant amount of [C ii] stems from CNM (∼20%) and from
“CO-dark” molecular gas (∼30%), which dominates the gas
mass of diffuse and “warm” molecular clouds (i.e. a transition
phase between diffuse HI clouds and dense CO-bright molecular clouds), and these fractions increase with increasing galactocentric distance. In addition, Vallini et al. (2013) have shown
through radiative transfer simulations of the ISM in Himiko
(Ouchi et al. 2013) that [C ii] emission may arise from the CNM
residing at the periphery (r ≥ 5 kpc) of the galaxy.
However, we note that the [C ii] surface density that we measure in the extended component of SDSS J1148+5251 is still
three orders of magnitude higher than what observed in the outskirts of local galaxies. This implies that the contribution of
different ISM phases to the [C ii] emission discussed above is
not sufficient for justifying the extended [C ii] flux – with no
significant associated FIR emission – observed at r
10 kpc
in SDSS J1148+5251. Therefore, although a comparison with
the local Universe may help understanding what we observe in
SDSS J1148+5251, we should keep in mind that the galactic environment of a luminous quasar at z > 6 can be very different
even from the most extreme galaxies that we observe locally,
and even more so from the Milky Way or other local disks such
as M33 and M51.
In order to clarify the origin of the extended [C ii] emission at r > 10 kpc, high sensitivity and multi-wavelength observations are needed. In particular, while our IRAM PdBI observations prove, for the first time, that cold gas (both in outflow and not) extends up to r ∼ 30 kpc in the host galaxy of
SDSS J1148+5251, corresponding to about 1/3 of the virial radius estimated for its massive halo (Valiante et al. 2011, 2014), it
is still not clear what is the primary mechanism exciting [C ii] up
to such large distances from the nucleus. In summary, whether
associated with dense PDRs or with a more diffuse ISM phase,
the extended – and relatively high surface density – [C ii] emission discovered in SDSS J1148+5251 requires an excitation
source. This may be provided by in situ star formation, by the
nuclear starburst, by the quasar and/or also by strong shocks (e.g.
see Appleton et al. 2013).
5. Summary and conclusions
We have presented follow-up C and D configuration IRAM
PdBI observations of the [C ii] 158 μm fine structure line
and FIR continuum in the host galaxy of the luminous
quasar SDSS J1148+5251 at redshift z = 6.4189. The total
[C ii] velocity-integrated flux of 34 ± 9 Jy km s−1 , estimated by
using a spectrum extracted from a circular aperture with a diameter of 8 arcsec, is significantly larger than any previous measurement of the same source. This clearly indicates the presence, in
the quasar host galaxy, of additional baryonic mass (in cold gas)
that was missed by previous observations with a lower sensitivity
to large scale structures. The [C ii] spectrum shows broad emission extending from −1400 km s−1 to 1200 km s−1 from the systemic velocity, confirming the detection of a powerful outflow
by Maiolino et al. (2012). The total continuum-subtracted map
C. Cicone et al.: Very extended cold gas, star formation and outflows in the halo of a bright quasar at z > 6
shows a very extended [C ii] source, with filamentary structures
extending up to the extreme distance of r ∼ 30 kpc from the
position of the quasar.
We have further investigated the properties of the outflow,
and we have found that:
– The outflow is resolved at high significance by our observations, revealing an extremely complex morphology,
butterfly-like, with filaments extending up to r
30 kpc
from the nucleus.
– Although the median outflow dynamical time scale is
τmedian
= 25 Myr, the distribution of τdyn within the outflow
dyn
is quite broad, ranging from ∼4 Myr to ∼100 Myr, indicating
that the outflow has been in place for at least 100 Myr, which
is a non-negligible fraction of the age of the Universe at this
redshift.
– Our new estimates of the lower limits on the integrated massloss rate, momentum rate and kinetic power of the outflow
are of 1400 ± 300 M yr−1 , (1.00 ± 0.14) LAGN /c and (1.6 ±
0.2) × 10−3 LAGN , respectively.
– We have investigated, for the first time in an external galaxy,
the outflow properties as a function of the dynamical time
scale and of the projected distance from the quasar. The results suggest that the ejection of gas in this source has not
occurred at a constant rate, but most likely through multiple
outflow events. In particular, we have found that the bulk of
the mass, energy and momentum in this source have been
released within the past ∼20 Myr.
We have discussed possible driving sources for the observed
[C ii] outflow, finding that quasar feedback is likely the dominant
mechanism driving the outflow in SDSS J1148+5251 (although
the contribution from extended star formation may be significant). We have discussed the outflow properties in the light of
theoretical models for AGN-driven outflows. We have noted that
the integrated outflow momentum rate of (1.00 ± 0.14) LAGN /c
and kinetic power of (1.6 ± 0.2) × 10−3 LAGN are quite modest
compared to local ULIRGs /quasars and in principle consistent
with any of the proposed models of AGN-driven outflows. By
considering the mass-loss outflow rate, momentum rate and kinetic power of the outflow as a function of the distance from the
quasar, we have found that observations are qualitatively consistent with radiation-pressure driven dusty shells. However, we
have also found that the morphology and distribution of the outflow is consistent with recent cosmological simulations involving energy-driven outflows. Yet, a more quantitative comparison
with the latter studies requires simulations matching the properties of this specific object (halo mass, black hole mass).
Quite surprisingly, we have discovered that not only the outflow, but also the quiescent gas traced by [C ii] at systemic velocity is extremely extended in this source. More specifically, we
have found that the [C ii] emission within v ∈ (−200, 200) km s−1
traces two components:
(i) A compact source, not resolved at our spatial resolution
of ∼1.2 arcsec, which corresponds to the 1.5 kpc size nuclear
“hyper-starburs” detected by previous observations;
(ii) An extended source with a FWHM size of 3.1 ± 0.3 arcsec,
corresponding to 17.4 ± 1.7 kpc. The map of this component reveals a complex structure, with a prominent filament
extending up to r
28 kpc to the west (with respect to
the quasar position). Strikingly, this extended component
contributes to almost ∼70% of the [C ii] flux within v ∈
(−200, 200) km s−1 .
By using ancillary deep FIR continuum observations at λrest =
155 μm, we have found that also the FIR emission from dust can
be disentangled into a compact and a more extended component
contributing to 45% of the total FIR emission at this wavelength.
The extended FIR component has a FWHM size of 11 ± 3 kpc,
with a tail extending by r ∼ 10 kpc to the west, and it has therefore a smaller extent than the extended [C ii] source.
We have estimated the [C ii] -to-FIR surface density ratio as
a function of the distance from the quasar, and we have found
that, within r
5 kpc, Σ[CII] /ΣFIR is low ( 6 × 10⁻⁴ ) and not
significantly different between the compact and the extended
components, suggesting that both components may be powered
by an intense and compact starburst. At intermediate radii, i.e.
5 < r[kpc] < 10, Σ[CII] /ΣFIR increases up to 1.0 × 10⁻³ , supporting the hypothesis of less extreme star formation activity
on these scales. At larger radii, i.e. r
10 kpc, the FIR continuum drops below our sensitivity and only [C ii] is detected.
This indicates that at such large distances from the galaxy centre, the [C ii] emission does not correlate with FIR continuum
and with star formation in the same way as in the central regions. Moreover, similarly to the outskirts of local galaxies and
to low metallicity systems, a large fraction of [C ii] at r 10 kpc
may arise from different phases of the ISM than dense PDRs,
such as diffuse atomic or molecular gas clouds. However, how
[C ii] emission can be excited up to such large distances from
the quasar and from the intense central starburst remains obscure, and additional observations with the future facilities such
as the northern extended millimetre array (NOEMA) are needed
for answering this question.
Acknowledgements. We thank the referee, Carlos De Breuck, for providing constructive comments that have significantly helped to improve the paper. We
also thank Rosa Valiante and Christian Leipski for useful discussion. C.C. acknowledges support by the Isaac Newton Studentship and by STFC funding.
This work is based on observations carried out with the IRAM Plateau de Bure
Interferometer. IRAM is supported by INSU/CNRS (France), MPG (Germany)
and IGN (Spain). In this paper we use the IDL SED fitting code developed by
Caitlin M. Casey (Casey 2012).
References
Aalto, S., Garcia-Burillo, S., Muller, S., et al. 2012, A&A, 537, A44
Abel, N. P., Dudley, C., Fischer, J., Satyapal, S., & van Hoof, P. A. M. 2009,
ApJ, 701, 1147
Alatalo, K., Blitz, L., Young, L. M., et al. 2011, ApJ, 735, 88
Appleton, P. N., Guillard, P., & Boulanger, F. E. A. 2013, ApJ, 777, 66
Bertoldi, F., Carilli, C. L., Cox, P., et al. 2003, A&A, 406, L55
Brauher, J. R., Dale, D. A., & Helou, G. 2008, ApJS, 178, 280
Calura, F., Gilli, R., Vignali, C., et al. 2014, MNRAS, 438, 2765
Carilli, C. L., & Walter, F. 2013, ARA&A, 51, 105
Carilli, C. L., Walter, F., Bertoldi, F., et al. 2004, AJ, 128, 997
Carniani, S., Marconi, A., Biggs, A., et al. 2013, A&A, 559, A29
Casey, C. M. 2012, MNRAS, 425, 3094
Castro-Carrizo, A., & Neri, R. 2010, IRAM Plateau de Bure Interferometer Data
Reduction Cookbook
Cicone, C., Feruglio, C., Maiolino, R., et al. 2012, A&A, 543, A99
Cicone, C., Maiolino, R., Sturm, E., et al. 2014, A&A, 562, A21
Combes, F., García-Burillo, S., & Casasola, V. E. A. 2013, A&A, 558, A124
Contursi, A., Poglitsch, A., Grácia Carpio, J., et al. 2013, A&A, 549, A118
Costa, T., Sijacki, D., & Haehnelt, M. 2014a, MNRAS, submitted
[arXiv:1411.0678]
Costa, T., Sijacki, D., & Haehnelt, M. G. 2014b, MNRAS, 444, 2355
Costa, T., Sijacki, D., Trenti, M., & Haehnelt, M. G. 2014c, MNRAS, 439, 2146
Cox, P., Krips, M., Neri, R., et al. 2011, ApJ, 740, 63
De Breuck, C., Williams, R. J., Swinbank, M., et al. 2014, A&A, 565, A59
De Looze, I., Cormier, D., Lebouteiller, V., et al. 2014, A&A, 568, A62
Decarli, R., Walter, F., Yang, Y., et al. 2012, ApJ, 756, 150
Díaz-Santos, T., Armus, L., Charmandaris, V., et al. 2013, ApJ, 774, 68
Díaz-Santos, T., Armus, L., & Charmandaris, V. E. A. 2014, ApJ, 788, L17
Draine, B. T. 2006, ApJ, 636, 1114
Emonts, B. H. C., Norris, R. P., & Feain, I. E. A. 2011, MNRAS, 415, 655
A14, page 17 of 21
A&A 574, A14 (2015)
Emonts, B. H. C., Norris, R. P., Feain, I., et al. 2014, MNRAS, 438, 2898
Fabian, A. C. 2012, ARA&A, 50, 455
Fan, X., Strauss, M. A., Schneider, D. P., et al. 2003, AJ, 125, 1649
Faucher-Giguère, C.-A., & Quataert, E. 2012, MNRAS, 425, 605
Feruglio, C., Maiolino, R., Piconcelli, E., et al. 2010, A&A, 518, L155
Feruglio, C., Fiore, F., Maiolino, R., et al. 2013a, A&A, 549, A51
Feruglio, C., Fiore, F., & Piconcelli, E. E. A. 2013b, A&A, 558, A87
Fischer, J., Sturm, E., González-Alfonso, E., et al. 2010, A&A, 518, L41
Gallerani, S., Maiolino, R., Juarez, Y., & Nagao, T. E. A. 2010, A&A, 523, A85
Gallerani, S., Neri, R., & Maiolino, R. E. A. 2012, A&A, 543, A114
Gallerani, S., Ferrara, A., Neri, R., & Maiolino, R. 2014, MNRAS, 445, 2848
García-Burillo, S., Combes, F., & Usero, A., et al. 2014, A&A, 567, A125
Graciá-Carpio, J., Sturm, E., Hailey-Dunsheath, S., et al. 2011, ApJ, 728, L7
Hailey-Dunsheath, S., Nikola, T., Stacey, G. J., et al. 2010, ApJ, 714, L162
Hatch, N. A., Overzier, R. A., Röttgering, H. J. A., Kurk, J. D., & Miley, G. K.
2008, MNRAS, 383, 931
Hopkins, P. F., & Elvis, M. 2010, MNRAS, 401, 7
Ivison, R. J., Morrison, G. E., Biggs, A. D., et al. 2008, MNRAS, 390, 1117
Ivison, R. J., Swinbank, A. M., Swinyard, B., et al. 2010, A&A, 518, L35
Ivison, R. J., Smail, I., Amblard, A., et al. 2012, MNRAS, 425, 1320
Kennicutt, Jr., R. C. 1998, ARA&A 36, 189
King, A. 2003, ApJ, 596, L27
King, A. 2005, ApJ, 635, L121
King, A. R. 2010, MNRAS, 402, 1516
Kramer, C., Abreu-Vicente, J., García-Burillo, S., et al. 2013, A&A, 553, A114
Kreckel, K., Armus, L., Groves, B., et al. 2014, ApJ, 790, 26
Langer, W. D., Velusamy, T., Pineda, J. L., et al. 2010, A&A, 521, L17
Langer, W. D., Velusamy, T., Pineda, J. L., Willacy, K., & Goldsmith, P. F. 2014,
A&A, 561, A122
Lapi, A., Cavaliere, A., & Menci, N. 2005, ApJ, 619, 60
Leipski, C., Meisenheimer, K., Klaas, U., et al. 2010, A&A, 518, L34
Leipski, C., Meisenheimer, K., & Walter, F., et al. 2013, ApJ, 772, 103
Leipski, C., Meisenheimer, K., Walter, F., & Klaas, U. E. A. 2014, ApJ, 785,
154
Luhman, M. L., Satyapal, S., Fischer, J., et al. 2003, ApJ, 594, 758
Maiolino, R., Cox, P., Caselli, P., et al. 2005, A&A, 440, L51
Maiolino, R., Caselli, P., Nagao, T., et al. 2009, A&A, 500, L1
Maiolino, R., Gallerani, S., Neri, R., et al. 2012, MNRAS, 425, L66
Malhotra, S., Kaufman, M. J., Hollenbach, D., et al. 2001, ApJ, 561, 766
Menci, N., Fontana, A., Giallongo, E., Grazian, A., & Salimbeni, S. 2006, ApJ,
647, 753
Menci, N., Fiore, F., Puccetti, S., & Cavaliere, A. 2008, ApJ, 686, 219
Neri, R., Downes, D., Cox, P., & Walter, F. 2014, A&A, 562, A35
Nesvadba, N. P. H., Lehnert, M. D., De Breuck, C., Gilbert, A. M., & van
Breugel, W. 2008, A&A, 491, 407
Nesvadba, N. P. H., Neri, R., De Breuck, C., et al. 2009, MNRAS, 395, L16
Ouchi, M., Ellis, R., Ono, Y., & Nakanishi, K. E. A. 2013, ApJ, 778, 102
Parkin, T. J., Wilson, C. D., Schirm, M. R. P., & Baes, M. E. A. 2013, ApJ, 776,
65
Pineda, J. L., Langer, W. D., Velusamy, T., & Goldsmith, P. F. 2013, A&A, 554,
A103
Planck Collaboration XVI. 2014, A&A, 571, A16
Rawle, T. D., Egami, E., & Bussmann, R. S., et al. 2014, ApJ, 783, 59
Riechers, D. A., Walter, F., Bertoldi, F., et al. 2009, ApJ, 703, 1338
Riechers, D. A., Bradford, C. M., Clements, D. L., et al. 2013, Nature, 496,
329
Riechers, D. A., Carilli, C. L., Capak, P. L., et al. 2014, ApJ, accepted
[arXiv:1404.7159]
Roth, N., Kasen, D., Hopkins, P. F., & Quataert, E. 2012, ApJ, 759, 36
Sargsyan, L., Samsonyan, A., Lebouteiller, V., et al. 2014, ApJ, 790, 15
Schneider, R., Bianchi, S., Valiante, R., Risaliti, G., & Salvadori, S. 2014
[arXiv:1402.2279]
Spoon, H. W. W., Farrah, D., & Lebouteiller, V., et al. 2013, ApJ, 775, 127
Stacey, G. J., Hailey-Dunsheath, S., Ferkinhoff, C., et al. 2010, ApJ, 724, 957
Sturm, E., González-Alfonso, E., Veilleux, S., et al. 2011, ApJ, 733, L16
Swinbank, A. M., Karim, A., Smail, I., et al. 2012, MNRAS, 427, 1066
Thompson, T. A., Fabian, A. C., Quataert, E., & Murray, N. 2014
[arXiv:1406.5206]
Valiante, R., Schneider, R., Salvadori, S., & Bianchi, S. 2011, MNRAS, 416,
1916
Valiante, R., Schneider, R., Maiolino, R., Salvadori, S., & Bianchi, S. 2012,
MNRAS, 427, L60
Valiante, R., Schneider, R., Salvadori, S., & Gallerani, S. 2014, MNRAS, 444,
2442
Vallini, L., Gallerani, S., Ferrara, A., & Baek, S. 2013, MNRAS, 433, 1567
Valtchanov, I., Virdee, J., Ivison, R. J., et al. 2011, MNRAS, 415, 3473
Veilleux, S., Cecil, G., & Bland-Hawthorn, J. 2005, ARA&A, 43, 769
Veilleux, S., Meléndez, M., Sturm, E., et al. 2013, ApJ, 776, 27
Velusamy, T., & Langer, W. D. 2014 [arXiv:1409.4788]
Velusamy, T., Langer, W. D., & Pineda, J. L., et al. 2010, A&A, 521, L18
Venemans, B. P., McMahon, R. G., Walter, F., et al. 2012, ApJ, 751, L25
Villar-Martín, M., Vernet, J., di Serego Alighieri, S., et al. 2003, MNRAS, 346,
273
Wagg, J., Carilli, C. L., Wilner, D. J., et al. 2010, A&A, 519, L1
Walter, F., Bertoldi, F., & Carilli, C., et al. 2003, Nature, 424, 406
Walter, F., Carilli, C., Bertoldi, F., et al. 2004, ApJ, 615, L17
Walter, F., Riechers, D., Cox, P., et al. 2009, Nature, 457, 699
Wang, R., Wagg, J., Carilli, C. L., et al. 2013, ApJ, 773, 44
Willott, C. J., McLure, R. J., & Jarvis, M. J. 2003, ApJ, 587, L15
Willott, C. J., Omont, A., & Bergeron, J. 2013, ApJ, 770, 13
Wolfire, M. G., Hollenbach, D., & Tielens, A. G. G. M. 1989, ApJ, 344, 770
Wolfire, M. G., Hollenbach, D., & McKee, C. F. 2010, ApJ, 716, 1191
Zubovas, K., & King, A. 2012, ApJ, 745, L34
Zubovas, K., & King, A. R. 2014, MNRAS, 439, 400
Pages 19 to 21 are available in the electronic edition of the journal at http://www.aanda.org
A14, page 18 of 21
C. Cicone et al.: Very extended cold gas, star formation and outflows in the halo of a bright quasar at z > 6
Appendix A: Additional FIR continuum source
Herschel observations revealed the presence of an additional FIR
continuum source, north-west of SDSS J1148+5251, at a distance of ∼10 (Leipski et al. 2010, 2013, 2014). This northwestern source is detected at the ∼5σ level in our PdBI observations. More specifically, Fig. A.1 shows that a FIR continuum
source at a distance of 10.5 from SDSS J1148+5251 is independently detected in both our FIR continuum maps at 256 GHz
(4.5σ) and at 261 GHz (5.6σ).
In Sect. 3.1 we have evidenced a 2σ inconsistency between
our new FIR continuum flux density estimate at 256 GHz of
3.3±0.7 mJy and the flux density of 4.8±0.6 mJy expected at the
same observed frequency from the MAMBO-II bolometric observations by Bertoldi et al. (2003). Such small discrepancy can
be fully explained by the presence of the north-western source
contaminating the MAMBO-II flux measurement. We further
test this hypothesis by performing a fitting of the FIR SED of
SDSS J1148+5251, in which we select only the continuum measurements available in the literature that are not contaminated by
the north-western source or that have been corrected for this effect (Fig. A.2). In particular, we select the 100 μm and 160 μm
Herschel/PACS observations by Leipski et al. (2013) (corrected
for the contaminating source), the 1.1 mm PdBI observations by
Gallerani et al. (2014) (observed frequency of 262 GHz), and
the 1.3 mm and 2.8 mm PdBI observations by Riechers et al.
(2009) (observed frequencies of 225 GHz and 109 GHz, respectively). We exclude from the SED fitting our PdBI data point at
256 GHz (shown as a red star in Fig. A.2), as the purpose of the
fit is showing the consistency of our continuum measurement
with the previous observations, once corrected for the contaminating north-western source. The FIR SED in Fig. A.2 is fit with
a single temperature modified blackbody combined with a mid
infrared (MIR) power law, following Casey (2012). By fixing
the emissivity β = 1.6, we obtain a dust temperature of 64 K.
We note that our PdBI continuum observation at 256 GHz sits
perfectly on the SED model in Fig. A.2.
Fig. A.2. FIR SED of SDSS J1148+5251, where only the continuum
measurements corrected for the contaminating north-west source are
shown, i.e. the Herschel/PACS observations by Leipski et al. (2013), the
PdBI observations by Riechers et al. (2009) and Gallerani et al. (2014),
and our new PdBI observations at 256 GHz (Sect. 3.1). Different symbols have been used for different datasets (see legend at the bottom-left
corner of the plot). The FIR SED has been fit with a single dust temperature modified blackbody with fixed emissivity β = 1.6, combined with
a MIR power law, following Casey (2012). Our new PdBI data point
at 256 GHz has been excluded from the fit, as explained in the text.
We then use the FIR SED fit model for estimating the expected MAMBO-II flux density, by taking into account the spectral response of the bolometer (transmission curve). We obtain
an expected MAMBO-II flux density of 3.8 mJy, i.e. significantly lower than the value reported by Bertoldi et al. (2003),
which would in turn predict a flux density at 256 GHz of
3.6 ± 0.4 mJy, consistent with our PdBI measurement.
Appendix B: Spectral features in the extended
[C ii] source
In Table B.1 we report the results of the spectral fitting to the
bright features A-F of the extended [C ii] 158 μm source, shown
in Fig. 3. It is immediately evident from Table B.1 that the
features A-F are characterised, on average, by high velocity
Table B.1. Results of the Gaussian fits to the spectra extracted from
different positions on the source shown in Fig. 3
Pos†
A
B
Fig. A.1. IRAM PdBI maps of the FIR continuum showing the
marginal detection of an additional source in the field, north-west of
SDSS J1148+5251, at a projected distance of 10.5 arcsec, originally
discovered by Herschel. Left: the map on the left panel has been obtained by collapsing the line-free channels of the dataset at 256 GHz as
explained in Sect. 3.1. The synthesised beam is 1.3 × 1.2 . Negative
and positive contours correspond to −3σ, 2σ, 4σ to 18σ in steps of 2σ
(1σ rms noise is 0.159 mJy beam−1 ). Right: the map on the right panel
has been obtained by merging the two ancillary datasets at 262 GHz
and 259.4 GHz (average observed frequency of 260.7 GHz). This is the
same map as Fig. 11, which is employed for studying the spatial extent
of the FIR continuum. The synthesised beam is 1.1 ×1.0 . Negative
and positive contours correspond to −3σ, 3σ, 5σ to 40σ in steps of 5σ
(1σ rms noise is 0.082 mJy beam−1 ).
C
D
E
F
v
[km s−1 ]
−700 ± 300
1100 ± 140
−170 ± 40
−300 ± 400
−1120 ± 110
700 ± 500
130 ± 100
−900 ± 400
800 ± 200
−1430 ± 90
100 ± 200
1200 ± 200
110 ± 80
1100 ± 90
−800 ± 500
σv
[km s−1 ]
800 ± 300
230 ± 150
110 ± 50
800 ± 400
210 ± 120
700 ± 400
140 ± 120
600 ± 400
500 ± 200
130 ± 90
500 ± 200
300 ± 200
220 ± 80
100 ± 90
400 ± 600
S peak
[mJy]
0.8 ± 0.2
0.8 ± 0.4
2.7 ± 1.0
0.9 ± 0.5
1.5 ± 0.7
1.0 ± 0.5
1.4 ± 1.0
1.1 ± 0.5
1.6 ± 0.5
1.1 ± 0.6
1.5 ± 0.3
0.7 ± 0.6
1.9 ± 0.5
1.0 ± 0.7
0.4 ± 0.4
Iν
[Jy km s−1 ]
1.7 ± 0.8
0.5 ± 0.4
0.7 ± 0.4
1.7 ± 1.3
0.8 ± 0.6
1.6 ± 1.2
0.5 ± 0.6
1.5 ± 1.3
1.9 ± 1.1
0.4 ± 0.3
2.0 ± 0.9
0.5 ± 0.5
1.0 ± 0.5
0.3 ± 0.3
0.3 ± 0.7
Notes. (†) Each row corresponds to a Gaussian component. We note that
in all cases the spectral fit requires multiple Gaussian components.
A14, page 19 of 21
A&A 574, A14 (2015)
dispersions, which can be as high as σv ∼ 800 km s−1 , suggesting that they are mostly associated with the outflow discovered
by Maiolino et al. (2012). This is confirmed by the analysis of
the maps of the broad wings (Sect. 3.4). However, we note that,
in correspondence of some positions (e.g. B, C, F), there is also a
significant contribution from “narrow” emission at the systemic
velocity, hinting at the presence of a very extended “quiescent”
(i.e. non outflowing) [C ii] component, which is investigated in
Sect. 3.5.
the outflow. For similar reasons we have not taken into account
the central core emission within ±200 km s−1 , although there
may be a significative outflow contribution of ∼20% even at
these low velocities, as suggested by the Gaussian fits to the
line profile (Fig. 1). However, we have included in the outflow
the central blobs visible in maps B2 and R2 (mean velocities
of ±350 km s−1 ), because they are offset with respect to the
quasar position and appear to be co-spatial with the higher velocity emission in maps B3 and R3, which is undoubtedly tracing
the outflow.
For each blob (belonging to the outflow) we calculate from
the maps its projected distance from the central quasar and, accordingly, obtain a measure of its dynamical time scale. The
dynamical time scale is defined as τdyn = R/v, where R is the
distance travelled by the clump (assumed equal to the projected
distance between the centroid of each clump and the optical position of the quasar) and v is the velocity of the gas. The error on
R is estimated differently for resolved and unresolved clumps; in
particular, for unresolved clumps, σR is the FWHM of the synthesised beam divided by the signal-to-noise ratio. For resolved
2
clumps, instead, we set σR = (rmax
−(FWHMbeam /2)2 )1/2 , where
rmax is the maximum (projected) radius of the blob. We conservatively adopt for v the average (projected) velocity of each map.
We note that the uncertainty on v, defined as σv =Δv/2, is obviously higher in the higher velocity maps, where we have integrated the emission over larger velocity channels (Δv). The distribution of τdyn that we measure within the outflow is shown in
Fig. 6.
To estimate the mass of (atomic) gas in outflow, we first measure the [C ii] flux associated with each outflowing clump, by using apertures centred on the positions of the crosses (indicated in
Fig. C.1). We then convert the [C ii] fluxes (integrated over their
corresponding velocity ranges Δv) into [C ii] 158 μm luminosities, and the [C ii] luminosities into (lower limits on the) atomic
Appendix C: Outflow channel maps
In this section we explain the method we employ for estimating the outflow mass-loss rate using the resolved information
provided by our IRAM PdBI observations. We produce channel
maps of the [C ii] 158 μm blue- and red-shifted emission at velocities v ≤ −200 km s−1 and v ≥ 200 km s−1 , respectively. The
maps are shown in Fig. C.1. The channel widths vary with velocities, because we aim to obtain an approximately constant signalto-noise for the extended emission in each map. For this reason,
at lower velocities, i.e. closer to the [C ii] emission peak, we use
narrow channels with Δv = 100 km s−1 , while at higher velocities, tracing the fainter high-velocity component of the outflow,
we integrate over wider channels of Δv ∼ 200 − 500 km s−1 . The
centroid positions of the 48 clumps that we ascribe to the outflow
are indicated in Fig. C.1. These are selected to be spatially included within the region corresponding to the total [C ii] source
shown in Fig. 2 and to have in the maps a signal-to-noise ratio S NR ≥ 3. We note that we have conservatively excluded
from the outflow computation the central components of maps
B1 ( v = −250 km s−1 ) and R1 ( v = 250 km s−1 ), because,
due to low velocities probed by these two maps, it is difficult to
assess to which extent the central extended emission belongs to
Fig. C.1. IRAM PdBI continuum-subtracted maps of the blue- (top panels) and red- (bottom panels) shifted [C ii] 158 μm emission of
SDSS J1148+5251, obtained at different velocities. The corresponding velocity integration ranges are indicated on each map. Negative and positive contours are in steps of 1.5σ. In all panels the big central cross indicates the pointing and phase centre, corresponding to the optical position of
the quasar. The small crosses mark the position of the 48 blobs that we identified as belonging to the outflow. For each of these clumps in outflow
we estimate the dynamical time scale τdyn = R/v, where R is the distance from the quasar position, and v is the average velocity of each map.
A14, page 20 of 21
C. Cicone et al.: Very extended cold gas, star formation and outflows in the halo of a bright quasar at z > 6
gas mass, following Hailey-Dunsheath et al. (2010) as explained
in Sect. 3.4. By adding up the mass-loss rate contribution, i.e.
M˙ out = Mout /τdyn , from all the 48 clumps in outflow, we obtain
a total integrated outflow rate of 1400 ± 300 M yr−1 . The eri=48 2
ror is simply ( i=1
σi, M˙ )1/2 , where σ M˙ out is the uncertainty on
out
M˙ out for a given clump in outflow, obtained by propagating errors on τdyn and on the velocity-integrated flux associated with
the clump. We note, however, that the uncertainty on the conversion from [C ii] luminosity to atomic gas mass is not taken into
account in our error estimate.
Appendix D: Moments maps
We show in Fig. D.1 the first and second moment maps of the
[C ii] emission within v ∈(−200, 200) km s−1 , obtained by applying a flux threshold of 2.8 mJy. The moments maps suggest that
the bulk of [C ii] does not trace gas in a regularly rotating disk.
Our IRAM PdBI observations are dominated by the extended
[C ii] component which, in this velocity range, contributes to
∼70% of the total flux (Sect. 3.5). It is however possible that the
compact source, unresolved by our observations, is rotationallysupported, as suggested by Walter et al. (2009). Moreover, the
first moment map shows a north-south velocity gradient south
of the quasar position, with velocities ranging from 20 km s−1
to 100 km s−1 , whose origin is not clear. In conclusion, no constrains can be put on the total dynamical mass of the system from
our [C ii] observations.
Fig. D.1. First (top) and second (bottom) moment maps obtained within
v ∈(−200, 200) km s−1 by applying a flux threshold of 2.8 mJy. Velocity
contours in both maps are in steps of 20 km s−1 .
A14, page 21 of 21
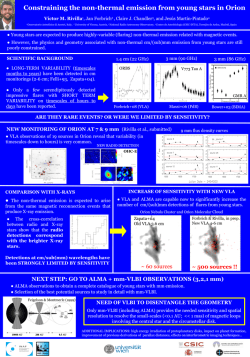

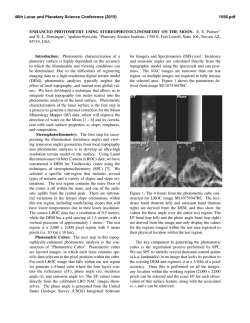
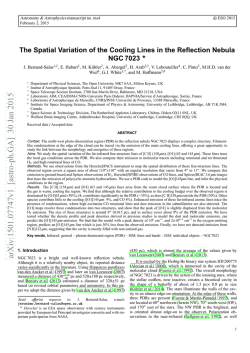
© Copyright 2026