
Merger rates in hierarchical models of galaxy formation. II
Mon. Not. R. Astron. Soc. 000, 000{000 (1994)
Merger rates in hierarchical models of galaxy formation.
II. Comparison with N-body simulations
Cedric Lacey1;3 and Shaun Cole2;4
1 Physics Department, Oxford University, Nuclear & Astrophysics Building, Keble Rd, Oxford OX1 3RH
2 Department of Physics, University of Durham, Science Laboratories, South Rd, Durham DH1 3LE
3 [email protected]
4 [email protected]
28 February 1994
ABSTRACT
We compare analytical predictions of the mass functions, merger rates and formation times of dark
matter halos with the results of large N-body simulations of self-similar clustering. The simulations,
with 1283 particles, are for = 1 and initial power spectra P (k) / kn , with n = ,2; ,1; 0. The
analytical predictions are based on the Press-Schechter model and its extensions (Bond et al. 1991;
Lacey & Cole 1993), and depend on the function (M ), describing the r.m.s. uctuation in the
initial density eld when smoothed on mass scale M , and a critical density threshold c0 applied
to the initial density eld. If we use a top-hat lter to calculate (M ), where the radius of the
top-hat is simply that which contains mass M , then we nd that the threshold value c0 which
gives the best match between the analytical and N-body mass functions is independent of the
spectral index for ,2 < n < 0. This independence does not hold for Gaussian ltering of the initial
conditions. We have investigated a range of methods for identifying the halos in the simulations
at overdensities 50 , 500, both percolation with various linking lengths, and a method based
on nding spheres of a specied overdensity. For percolation with a linking length of 0:2 , 0:3
times the mean interparticle distance, the value of the threshold for = 1 and top-hat ltering is
close to c0 = 1:69, which is the analytical prediction for the collapse of a spherically symmetric
overdense region. The analytical mass functions t those estimated from the simulations with a
maximum error of a factor of 2, over a range of 103 in mass, which is the full dynamic range of
our N-body simulations; the error is largest for the rare massive halos, while the abundance of
more numerous halos has a typical error of < 30%. The same choice of lter and threshold leads to
remarkable agreement (over a factor 102 , 103 in mass) between the analytical predictions for halo
merger rates and formation times derived by Lacey & Cole and the estimates from the simulations,
including for merger rates their dependence on the masses of the two halos involved and the time
interval being considered, and for formation times the dependence on halo mass. For N-body halos
identied using the alternative methods, almost as good agreement with the analytical formulae
is obtained if c0 is rst adjusted to give the best t to the mass function. Thus the analytical
Press-Schechter mass function and its extension to halo lifetimes and merger rates provide a very
useful description of the growth of dark matter halos through hierarchical clustering.
{ dark matter
tions, with smaller objects collapsing rst, and then merging together to form larger and larger objects. The halos of
dark matter formed in this way, objects which are in approximate dynamical equilibrium, form the gravitational potential wells in which gas collects and forms stars to produce
visible galaxies. Subsequent merging of the dark halos leads
Key words: galaxies: clustering { galaxies: evolution { galaxies: formation { cosmology: theory
In the standard cosmological picture, the mass density of
the universe is dominated by collisionless dark matter, and
structure in this component forms by hierarchical gravitational clustering starting from low amplitude seed uctua-
1 INTRODUCTION
ASTRO-PH-9402069
2
C. Lacey and S. Cole
to formation of groups and clusters of galaxies bound together by a common dark halo, and is accompanied by some
merging of the visible galaxies with each other. It is obviously of great interest to understand this process of structure
formation via merging in more detail. One approach, begun
by Aarseth, Gott & Turner (1979) and Efstathiou & Eastwood (1981), is to calculate the non-linear evolution of the
dark matter numerically, using large N-body simulations. A
second approach, complementary to the rst, is to develop
approximate analytical descriptions which relate non-linear
properties such as the mass distribution and merging probabilities of collapsed objects to the initial spectrum of linear
density uctuations from which they grew. These analytical
descriptions must then be tested against the results of the
numerical simulations. If they work, they provide insight
into the numerical results, and provide the basis for simplied calculations and modelling which can cover a much
wider range of parameter space than is feasible with the
numerical simulations alone.
The analytical approach was pioneered by Press &
Schechter (1974) (hereafter PS), who derived, rather heuristically, an expression for the mass spectrum of collapsed,
virialized objects resulting (via dissipationless gravitational
clustering) from initial density uctuations obeying Gaussian statistics. The basis of the method is to derive a
threshold value of the linear overdensity for collapse of
spherical perturbations, and then calculate the fraction of
mass in the linear density eld that is above this threshold when smoothed on various scales. The PS mass function formula has since been widely applied to a variety
of problems, including gravitational lensing by dark halos (Narayan & White 1988), abundance of clusters and
their inuence on the cosmic microwave background via the
Sunyaev-Zel'dovich eect (Cole & Kaiser 1988), and galaxy
formation (Cole & Kaiser 1989; White & Frenk 1991; Kaumann, White & Guiderdoni 1993; Kaumann, Guiderdoni
& White 1994). The PS mass function was put on a somewhat rmer theoretical basis by Bond et al. (1991) (hereafter BCEK), who, by considering the random walk of linear
overdensity (at a xed location) as a function of smoothing
scale, obtained a rigorous solution to the problem of abovethreshold regions lying inside other above-threshold regions
(the so-called \cloud-in-cloud" problem). BCEK also showed
how the derived mass function depended on the lter used
to dene the spatial smoothing, and that the standard PS
formula in fact only results in the case of \sharp k-space"
ltering, which is also the only case for which exact analytical results can be obtained. (Related approximate results
were also obtained by Peacock & Heavens (1990).) In addition, the approach of BCEK showed how to go beyond a
calculation of the mass function at a single time, to derive
the conditional mass function relating the halo masses at
two dierent times. (An identical formula for the conditional
mass function was also derived much more heuristically by
Bower (1991).) The BCEK approach was then taken up by
Lacey & Cole (1993) (hereafter Paper I), who used the con-
ditional mass function for the case of sharp k-space ltering
to derive a range of results on the merging of dark halos.
These included the instantaneous merger rate as a function
of the masses of both halos involved, and the distribution of
formation and survival times of halos of a given mass identied at a given epoch, the formation time being dened as
the earlier epoch when the halo mass was only half of that
at the identication epoch, and the survival time as when
the halo mass has grown to twice that at the identication
epoch. The expressions for these depend on the initial linear uctuations through their power spectrum, and on the
background cosmology (density parameter and cosmological constant ). Preliminary applications of these results
were made to constraining the value of from the merging
of galaxy clusters, and to estimating the rate of accretion of
satellites by the disks of spiral galaxies.
An alternative analytical approach is assume that objects form from peaks in the initial density eld. This has
been extensively used to study clustering of galaxies and
clusters (Peacock & Heavens 1985; Bardeen et al. 1986), but
has been less used in calculating mass functions because of
the problem of dealing properly with peaks which lie inside
other peaks, and of identifying what mass object forms from
a given size peak (e.g. Bond (1988)). Bond & Myers (1993a)
have recently developed a new method which combines aspects of the Press-Schechter and peaks methods, but this
requires one to generate and analyze Monte Carlo realizations of the linear density eld, and so is much more complicated to apply, though still simpler than doing an N-body
simulation.
Our aim in this paper is to test the analytical results
for merging of dark halos derived in Paper I against a set of
large N-body simulations. Specically, we test the formulae
for merger probabilities as a function of the masses of the
halos involved and of the dierence in cosmic epochs, and for
the distribution of formation epochs of halos. We also revisit
the question of how well the PS mass function itself works
compared to simulations. The latter question has been investigated previously, notably by Efstathiou et al. (1988) (hereafter EFWD) for a set of self-similar models with power-law
initial power spectra and = 1, and by Efstathiou & Rees
(1988), White et al. (1993) and Bond & Myers (1993b) for
Cold Dark Matter (CDM) models, who all found reasonably good agreement. BCEK tested their conditional mass
function formulae against EFWD's simulations, and found
encouraging results, but the size of their simulations (323
particles) did not allow very detailed comparisons. In this
paper, we address these questions using 1283 2 106 particle N-body simulations of self-similar models, with = 1
and initial power spectra P (k) / kn , n = ,2; ,1; 0. With
this large number of particles, it is possible to make fairly detailed tests of the merger formulae. There has been some discussion of what is the best lter to use with the standard PS
mass function formula, and whether improved results can be
obtained by choosing a threshold linear overdensity dierent
from that of the simple spherical collapse model (Efstathiou
Merger rates
& Rees 1988; Carlberg & Couchman 1989), and we investigate this also. In related work, Kaumann & White (1993)
presented a Monte Carlo method to generate merger histories that are consistent with the BCEK conditional mass
function. They then made a qualitative comparison of some
of the properties of the merger histories from their Monte
Carlo method with those from a CDM simulation, and argued that there was reasonable agreement.
An important question that arises when comparing analytical predictions for mass functions, merger rates etc. of
dark halos with the corresponding quantities in N-body simulations, is how best to identify the halos in the simulations. Given that the halos found in simulations are neither completely isolated nor exactly in virial equilibrium,
there seems no unique way to do this. Much work has been
based on the percolation or \friends-of-friends" algorithm
(Davis et al. 1985) (DEFW), in which particles are linked
together with other particles into a group if the distance
to the nearest group member is less than a certain fraction
(usually taken to be 0:2) of the mean interparticle separation. However, other group-nding schemes have also been
used (e.g. Warren et al. (1992), Bond & Myers (1993b)). It
is important to know how much the comparison with analytical results depends on the group-nding scheme employed,
so we will investigate the eect of varying the linking length
in the friends-of-friends scheme, and also use an alternative
method based on nding spheres of particles of a certain
overdensity.
The plan of the paper is as follows: In x2 we review
the analytical results on merging derived in Paper I. In x3
we describe the N-body simulations, and in x4 we describe
our group-nding schemes. In x5 we compare the N-body
mass functions with the PS formula. The following two sections test the predictions for merging against the simulations: merger probabilities as a function of mass in x6, and
formation epochs in x7. We present our conclusions in x8.
2 REVIEW OF ANALYTICAL MERGER
RESULTS
2.1 Spatial Filtering and Random Trajectories
In this section, we review the analytical results on merging
of dark halos derived in Paper I and in BCEK. Central to
the approach is spatial ltering of the linear density eld.
The initial conditions for structure formation are specied
as a Gaussian random density eld (x) = (x)= , 1 having some power spectrum P (k), where is the mean density. This eld is smoothed by convolving it with sphericallysymmetric lters WR (r) of various radii R, having Fourier
representations c
WR (k):
cR (k) =
W
Z
WR (jxj) exp(,ik:x) d3 x:
(2.1)
The variance of the eld after smoothing with a lter is
related to the power spectrum by
2 (R) h2 iR =
Z
1
0
c
WR2 (k)P (k) 4k2 dk
3
(2.2)
We list below the lters that we will be using in this
paper, and their Fourier representations. We also give the
natural volume Vf that is associated with a lter of radius
Rf .
Top Hat (TH):
,
3= 4R3T r < RT
0
r > RT
c
WR (k) = (kR3 3 ) [sin(kRT ) , (kRT ) cos(kRT )]
T
VT = (4=3)R3T
WR (r) =
Gaussian (G):
WR (r) =
1
2 r
(2)3=2 R3G exp , 2R2G
c
WR (k) = exp
2 , 2kR2
G
VG = (2)3=2 R3G
(2.3)
(2.4)
(2.5)
(2.6)
(2.7)
(2.8)
Sharp k-space (SK):
1
22 r3 [sin (r=RS ) , (r=RS ) cos (r=RS )]
c
WR (k) = 1 k < 1=RS
0 k > 1=RS
WR (r) =
VS = 62 R3S
(2.9)
(2.10)
(2.11)
R 1 The lters2 are normalized according to the condition
c
0 WR (r)4r dr = WR (k = 0) = 1. The natural volume of a lter is dened by rescaling WR (r = 0) to 1,
and then integrating this rescaled lter over all space; thus
Vf = 1=WR (r = 0) in terms of the unscaled lter. (In the
case of the sharp k-space lter, the volume integrals are
aR little ill-dened if done in real space, since the integral
r
2
0 WR (r)4r dr actually oscillates around 1 as r ! 1.
If desired, this minor problem can be cured by multiplying
WR (r) by exp(,r) before doing the integral, and taking
the limit ! 0 afterwards.) The natural mass under a lter is then dened as Mf = Vf .
When the density uctuations are small ( << 1), they
grow according to linear perturbation theory, (x; t) / D(t),
where the linear growth factor D(t) depends on the background cosmological model; for = 1, D(t) / a(t) / t2=3 ,
a(t) being the cosmic expansion factor. (We are assuming
that only the growing mode of linear perturbation theory
is present.) The non-linear evolution can be calculated analytically for spherical perturbations (e.g. Peebles (1980);
Paper I); for a uniform overdense spherical uctuation, the
collapse time depends on its initial linear overdensity. It is
convenient to work in terms of the initial density eld extrapolated according to linear theory to some xed reference
epoch t0 , for which we also take a(t0 ) = 1; from now on, this
4
C. Lacey and S. Cole
is what we will mean by (x). In terms of this extrapolated
, a spherical perturbation of mean overdensity collapses
at time t if = c(t), where, for = 1, we have the usual
result
c (t) = c0 =a(t) = c0 (t0 =t)2=3
c0 = 3(12)2=3 =20 1:69
(2.12)
(The generalization of this for < 1 is derived in Paper I;
note that the second line of equation (2.1) of that paper
contains a typographical error.)
The basic assumption of the BCEK approach is that
a particle at time t resides in a virialized halo whose mass
M is given by nding the largest radius lter for which the
linear density (R; x) averaged around the initial position of
that particle exceeds the threshold from the spherical collapse model, (R; x) > c (t). At a particular point x, (R; x)
follows a trajectory vs R as the lter radius varies, and
one needs to nd the largest-R crossing of the trajectory
through the threshold = c. For a Gaussian random eld,
BCEK show how to obtain the distribution of such threshold
crossings for a general lter, and thus the fraction of particles in halos of dierent masses. However, only for sharp
k-space ltering do they obtain an analytical solution to this
problem; in this case, the random trajectories are Brownian
random walks in vs 2 (R). The only further assumption
made is that (R) monotonically declines with increasing
R. The results for merging derived in Paper I, which will
be tested against N-body simulations in the present paper,
are all obtained in this analytically tractable case of sharp
k-space ltering.
2.2 Mass Function
For sharp k-space ltering, the fraction of mass in halos with
mass M , at time t, per interval dM , is found to be (BCEK;
Paper I equation (2.10))
df
dM (M; t) =
2 d2 (M ) c (t)
exp , c(t)
2(M )2
(2)1=2 3 (M ) dM 1=2
2
2.3 Conditional Mass Function and Merger
Probability
The conditional probability for a mass element to be part
of a halo of mass M1 at time t1 , given that it is part of a
larger halo of mass M2 > M1 at a later time t2 > t1 , is found
by studying trajectories that cross two dierent thresholds,
c (t1 ) and c (t2 ). The result is, for the conditional mass fraction per interval dM1 (BCEK, Paper I equation (2.15))
df (M ; t jM ; t ) =
dM1 1 1 2 2
2
2
d1 (c1 , c2 )
exp , (c1 , c2 ) (2.16)
2(12 , 22 )
(2)1=2 (12 , 22 )3=2 dM1 where 1 = (M1 ), 2 = (M2 ), c1 = c (t1 ) and c2 =
c (t2 ). The only assumption made here about the function
c (t) is that it monotonically decreases with increasing t.
The reverse conditional probability, for M2 given M1 , is (Paper I equation (2.16))
df (M ; t jM ; t ) =
dM2 2 2 1 1
3=2
1 c2 (c1 , c2 )
12
c1
(2)1=2
22 (12 , 22 )
2
2
2 2
d2 exp , (c2 1 , c1 2 )
dM
212 22 (12 , 22 )
2
This is obviously the same as the probability for a halo of
mass M1 at t1 to be incorporated into a halo of mass M2 >
M1 at t2 > t1 . Thus, if we set M2 = M1 + M and t2 =
t1 + t in the above formula, we get the probability for a
halo to gain mass M by merging in time t. Taking the
limit t ! 0 then gives the instantaneous merger rate as a
function of M1 and M (equation (2.18)) of Paper I).
(2.13)
Suppose one identies a halo of mass M2 at time t2 . At an
earlier time, one can identify the progenitors of this halo. We
dene the formation time of the halo identied at epoch t2 as
the earliest time tf < t2 at which it has a progenitor of mass
M1 at least half of M2 . We nd the cumulative probability
distribution for tf (equation (2.26) of Paper I)
P (tf < t1 jM2 ; t2 ) =
Z M2
c (t) d ln M 2 (M ) d ln M exp
2 (
t
)
c
, 22 (M )
(2.14)
where is now the mean density at the reference epoch t0 .
This is the same result as found by Press & Schechter (1974).
By dening c (t)=(M ), (2.13) can be rewritten as
df = 2 1=2 exp(, 2 =2)
d ln (2.17)
2.4 Formation Times
(To make the correspondence with the equations in Paper I,
note that we there used the notation S = 2 (M ), ! = c(t).)
Thus, the comoving number density of halos of mass M
present at time t, per dM , is
dn (M; t) =
dM
which is independent of the form of the uctuation spectrum.
(2.15)
M2 df
(M1 ; t1 jM2 ; t2 ) dM1
M2 =2 M1 dM1
(2.18)
The dierential probability distribution for tf is then given
by
dp
dtf (tf jM2 ; t2 ) =
Z M2
M2 @ h df (M ; t jM ; t )i dM
1 f 2 2 1
M2 =2 M1 @tf dM1
(2.19)
5
Merger rates
We noted in Paper I that the expression corresponding
to equation (2.19) actually leads to a slight mathematical
inconsistency in some cases: for power-law power spectra
P (k) / kn with n > 0, the probability density for tf goes
slightly negative for small t2 , tf . In Paper I, we also derived formation time distributions based on a Monte Carlo
method, which do not have the problem of negative probability density. These distributions have similar shapes to the
analytical ones, but with the mean shifted. We will see in x7
that the analytical distribution gives a remarkably good t
to the N-body results.
2.5 Self-Similar Models
The analytical results presented above make no special assumptions about the functions (M ) and c (t), except that
they are monotonic. However, in testing these results against
simulations, we will focus on self-similar models, in which
the density parameter = 1, so that there is no characteristic time in the expansion of the universe, and in
which the initial density uctuations have a scale-free spectrum, P (k) / kn . In this case, the evolution of structure should be self-similar in time. This has some advantages, to be discussed in x3. From equation (2.2), we obtain
(M ) / M ,(n+3)=6 , in general. For to decline with increasing M , we require n > ,3, which is just a condition
for structure to grow hierarchically, with small objects collapsing rst and then merging to form larger objects. For
the Top Hat lter, the integral in equation (2.2) only converges for n < 1. We will be considering N-body models with
n = ,2; ,1; 0.
For = 1, density uctuations grow as D(t) / a(t) /
t2=3 in linear theory, so thatpthe r.m.s. uctuation on comoving scale k,1 is roughly 4k3 P (k)a(t). Thus we can
dene a characteristic non-linear wavenumber k (t) by
4k3 (t) P (k (t)) a2 (t) = 1
(2.20)
At time t, uctuations are of order unity and are starting
to collapse on a comoving lengthscale k (t),1 . In a selfsimilar model, this should be the only characteristic lengthscale for structure.
In our analytical expressions for mass functions, merger
probabilities etc, it is convenient to dene a lter-dependent
characteristic mass scale M (t) by
(M (t)) = c(t)
(2.21)
where c(t) = c0 =a(t) for = 1. The mass M is related to
the lter-independent quantity k by
6=(n+3)
M (t) = f cf (n)
(2.22)
c0
k3 (t)
where is the mean density at the reference epoch when
a = 1. f relates the natural volume of a lter to its radius through Vf f R3f (c.f. x2.1), and cf (n), which enters
through the relation (2.2) between (R) and P (k), is dened
by
c2f (n) =
Z
1
0
c
WR2 =1 (k) kn+2 dk
(2.23)
For the lters we are using, cf (,2) = 1:373; 0:941; 1:000,
cf (,1) = 1:500; 0:707; 0:707 and cf (0) = 2:170; 0:666; 0:577
for T H; G; SK lters respectively. From equations (2.20)
and (2.22), the characteristic mass grows as M (t) /
a6=(n+3) . The mass function (2.13) can then be rewritten
as
1=2 2
n + 3 M (n+3)=6
df
=
d ln M
6
M
(n+3)=3 M
exp , 21 M
(2.24)
in which form the mass and time only appear in the combination M=M (t). Similarly, the merger probability (2.17)
can be rewritten as a distribution for M2 =M1 depending on
M1 =M (a1 ) and a2 =a1 , and the formation time distribution
(2.19) can be rewritten as a distribution for af =a2 depending
on M2 =M (a2 ).
2.6 Choice of ltering and collapse threshold
As already described, the BCEK derivation of the PS mass
function is based on sharp k-space ltering. On the hand,
the original, more heuristic, derivation by PS themselves assumed top hat ltering, and most applications of the PS
formula have followed this and used the (M ) relation for
top hat ltering. However, some papers have also used the
Gaussian ltered (M ) for comparing the PS formula to Nbody simulations and in applications (e.g. Efstathiou & Rees
(1988)). Since what enters the various formulae is (M ),
while what is obtained directly with a choice of lter type
and power spectrum is (R), one can also view this in terms
of making dierent choices for the mass - lter radius relation (or equivalently f ) while keeping the type of ltering
the same. In x2.1 we described a simple choice for the M (R)
relation based on the lter prole, but it is by no means
obvious that this is the best choice for giving the mass of
non-linear collapsed objects corresponding to a given lter
scale. BCEK's approach was to use the natural denition
of lter mass for the top hat lter, for which the volume is
best dened, and then choose an M (R) relation for other
lters such that (M ) was the same as for top hat ltering
of the same power spectrum, on the grounds that the collapse threshold c (t) is also calculated for a top hat spherical perturbation. For power-law power spectra, this requires
making f in equation (2.22) a function of spectral index
as well as lter type, while for a general P (k) it must be a
function of R. The choice made by BCEK corresponds to
using the (M ) relation for top hat ltering in formulae like
(2.13) and (2.17), even though these formulae are derived
for sharp k-space ltering. In this paper, when we refer to
the (M ) relation for a particular lter type, we will always
be assuming our \natural" choice for the M (R) relation. We
will investigate which (M ) relation in combination with the
6
C. Lacey and S. Cole
PS mass function formula gives the best t to simulations
in x5.
A related issue concerns the choice of collapse threshold,
which for = 1 boils down to a choice for c0 in equation
(2.12). While the spherical collapse model gives an unambiguous answer, one can take the view that, since real collapses have non-top hat and non-spherical density proles,
c0 should be regarded as a phenomenological parameter,
chosen to give the best t to N-body results (e.g. Bond
& Myers (1993b)). Since the PS mass function and other
formulae depend on f and c0 only through M (equation
2.22), there is a degeneracy between these two parameters
for any given spectral index n, but this degeneracy is lifted
as soon as one considers results for dierent n. The choice
of c0 will be considered in relation to the simulations in x5.
3 N-BODY SIMULATIONS
The simulations were performed using the high resolution
particle-particle-particle-mesh (P 3 M ) code of Efstathiou et
al. (1985) (EDFW) with 1283 2 106 particles. The
long-range force was computed on a 2563 mesh, while the
softening parameter for the short-range force was chosen to
be = 0:2(L=256), where L is the size of the (periodic)
computational box. This corresponds to the interparticle
force falling to half of its point-mass value at a separation
r 0:4 L=3200. Initial positions and velocities were generated by displacing particles from a uniform 1283 grid according to the Zel'dovich approximation, assuming the linear
power spectrum and Gaussian statistics. We ran one simulation for each of n = ,2; ,1; 0. For n = ,1 and n = 0,
the initial amplitude of the power spectrum was chosen to
equal the white noise level at the Nyquist frequency of the
particle grid; for n = ,2, this choice was found to lead to
large departures from self-similar behaviour in the derived
mass functions and related quantities, so this simulation was
instead started when the amplitude was smaller by a factor
0.4. We adopted the convention of normalizing the expansion
factor a to 1 when the variance of the linear theory power
spectrum in a top-hat sphere of radius L=32 was 1. With this
choice, the initial expansion factors were ai = 0:2; 0:15; 0:06
respectively for n = ,2; ,1; 0. The initial r.m.s. 1D displacements of the particles were approximately 0:9; 0:5; 0:25 in
units of the particle grid spacing. The time integration was
performed using the variable p = a , with = 2=(n + 3),
and a constant stepsize p=pi = 14 (256=L)3=2 0:023
(EDFW).
For each simulation we output the positions and velocities of all the particles at many epochs. The spacing of
these outputs was chosen pso that the characteristic mass,
M? , increased by a factor 2 between each successive output, which corresponds to an increase of a factor 2(n+3)=12
in the expansion factor a. The nal expansion factors for
the simulations were determined basically by the computer
resources available; for the later stages, the CPU time was
dominated by the short-range force calculation by a large
factor. The simulations were stopped at expansion factors
a = 1:26; 2:00; 1:68 respectively for n = ,2; ,1; 0. This gave
us between 20 and 24 useful outputs from each simulation.
Self-similar models have two advantages from the point
of view of testing our analytical predictions against simulations. (i) We can check whether the simulations obey the selfsimilar scaling which physically they should. In particular,
this allows us to test whether the simulations were started
at a small enough expansion factor. We can also delineate
the range of masses of virialized objects for which the simulations are reliable, bearing in mind the eects of particle
discreteness and force resolution on small scales, and missing
long-wavelength modes on scales larger than the box. (ii) By
using the self-similar scaling, we can straightforwardly combine the results from dierent output times to reduce the
Poisson uctuations on the N-body results due to the nite
number of halos in the box. These factors, and the simple
way to test for dependence on the form of the initial spectrum, were what motivated us to look at self-similar models
rather than more physically-inspired models such as Cold
Dark Matter.
4 GROUP-FINDING IN THE SIMULATIONS
4.1 Overview
We wish to obtain the properties of dark matter halos from
the simulations to compare with our analytical results. Simple theoretical calculations idealize dark halos as isolated
spherical objects in dynamical equilibrium, but the objects
found in simulations with = 1 are neither isolated nor in
complete dynamical equilibrium, because halos continue to
grow by accreting or merging with other halos on a timescale
comparable to the expansion time, which is also comparable
to their internal dynamical times. (In a universe with 1,
on the other hand, one expects the conditions of isolation
and dynamical equilibrium to be much better satised). Nor
are real halos spherical. The issue of how to identify the
groups of particles in the simulations that one calls dark halos is therefore not completely straightforward, and a variety
of schemes have been used by dierent authors (e.g. DEFW,
Barnes & Efstathiou (1987), Warren et al. (1992), Bond &
Myers (1993b)). In order to give some idea of how sensitive
the comparisons are to the group-nding method employed,
we will present results for two dierent schemes, namely percolation, and a spherical overdensity method. Both are based
on particle positions, making no use of the velocity information in the simulations. A fuller discussion and comparison
of the internal properties of the halos found by using these
dierent schemes and parameters, for the dierent initial
power spectra, will be given by Cole & Lacey (1994).
4.2 Friends-of-Friends (FOF) Groups
The percolation method is the standard friends-of-friends algorithm (hereafter FOF) of DEFW, which has been widely
Merger rates
used. Groups are dened by linking together all pairs of
particles with separation less than bn,1=3 , n being the mean
particle density. This denes groups bounded approximately
by a surface of constant local density, = 3=(2b3 ). The
value usually used for the dimensionless linking length is
b = 0:2 (e.g. Frenk et al. (1988)), which corresponds to a
density threshold = 60. For a spherical halo with a density prole (r) / r,2 , this local density threshold corresponds to a mean overdensity hi= 180, which is close to
the value 182 178 for a just virialized object predicted for
a top-hat spherical collapse (e.g. Peebles (1980), Paper I).
It has been argued that the choice b = 0:2 approximately
delineates between objects which are virialized and objects
which are still collapsing in their outer parts, but in our own
investigations (Cole & Lacey 1994), we nd that the closeness to global virial equilibrium of N-body halos depends
rather weakly on the value of b, so that this criterion does
not strongly select a value for b. We will make comparisons
with FOF groups for b = 0:15; 0:2; 0:3, corresponding to local overdensities of 140, 60 and 18 respectively. We will use
the abbreviation FOF(b) for groups identied using FOF
with linking parameter b.
4.3 Spherical Overdensity (SO) Groups
The second method we apply, which we call spherical overdensity (SO), is based on nding spherical regions in a simulation having a certain mean overdensity, which we denote
by hi=. We rst calculate a local density for each
particle by nding the distance rN to its N'th nearest neighbour, and dene the density as 3(N + 1)=(4rN3 ). Particles
are sorted by density. The highest density particle is taken as
the candidate centre for the rst sphere. A sphere is grown
around this centre, with the radius being increased until the
mean overdensity rst falls below the value . (The sphere
must contain at least 2 particles). The centre of mass of the
particles in this sphere is then taken as a new centre, and
the process of growing a sphere of the specied overdensity
repeated. This process is iterated until the shift in the centre
between successive iterations falls below n,1=3 . The particles in the sphere are all labeled as belonging to the same
group, and removed from the list of particles considered by
the group-nder. Then one moves on the next highest density particle which is not already in a group, and repeats
the process of nding an overdense sphere, including iteration of the centre. Finally, after all the groups have been
found, any groups which lie inside larger groups are merged
with the larger group, according to the following procedure:
Each group is considered as a sphere of mean overdensity ,
based on its actual mass, centred on its actual centre of mass.
Starting with the largest sphere, any smaller sphere whose
centre is inside the larger sphere is merged with that sphere
(but the assumed radius of the larger sphere is not changed).
This is then repeated for the next largest remaining sphere,
and so on down in mass. We will use the abbreviation SO()
for SO groups identied at overdensity .
7
We will present comparisons for SO groups with spherical overdensity = 180, chosen to agree with the spherical collapse model. For the local density estimate, we used
N = 10, but the results were not especially sensitive to this.
For the convergence of the group centres, we found = 0:1
to be adequate. With these parameters, an average of fewer
than 0.1 iterations per group were required, and the fraction of particles involved in merging small groups into large
ones was less than 10,3 . We also experimented with dening
the initial list of centres for growing spheres from particles
ranked either by gravitational potential (deepest potential
rst) or by the magnitude of the acceleration (highest acceleration rst). The potential and acceleration were calculated for each particle using a modied version of the P 3 M
code, with the same grid and softening parameters as for the
original simulation. The groups found starting from acceleration or potential centres were almost identical to those
found starting from density centres. A fuller discussion of
the method will be given in Cole & Lacey (1994). We have
used the method based on density centres in this paper since
it is more straightforward.
Our spherical overdensity algorithm has many similarities to the method used by Warren et al. (1992), and to
the \smooth particle overdensity" method of Bond & Myers
(1993b). The Warren et al. method grows spheres of specied overdensity around centres which are particle positions
ranked by gravitational acceleration, and merges small halos which are inside larger ones, but does not iterate the
positions of the centres. The Bond & Myers method grows
spheres of a given overdensity around centres which are chosen initially to be positions of particles ranked by local density, and then iterates each sphere until the centre of mass
converges. However, the volume of a group, used in dening
its mean density, is dened by calculating a volume for each
particle based on its local density, and summing these over
all particles within the sphere to get the total volume, rather
than as the volume of the sphere itself.
4.4 Comparison of Methods
The percolation method has the advantage that it is simple,
relatively fast, and does not make any assumption about the
geometry of the groups. However, some (a denite minority) of the groups it selects are formed of two or more dense
lumps separated by low-density bridges, as has been noted
by previous authors. These groups seem rather unphysical.
The spherical overdensity method avoids this problem, instead producing groups concentrated around a single centre,
but on the other hand, tends to chop o the outer portions
of ellipsoidal halos. It is also more complicated and more
time-consuming to run. It is not clear which method should
be considered \best", so it is interesting to compare results
obtained with both.
8
C. Lacey and S. Cole
5 MASS FUNCTIONS IN THE SIMULATIONS
5.1 Tests for Self-Similarity
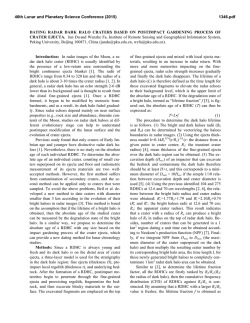
Figure 1 shows the N-body mass functions for all output
times for all three values of the spectral index n. The halos
were found using the friends-of-friends method with b = 0:2,
and the mass function for each output time rescaled to a
distribution in M=M (t), with M (t) computed using a top
hat lter with the standard choice c0 = 1:69. Scaled in
this way, the mass functions for dierent times should be
identical, as a simple consequence of self-similarity, and it
can be seen that the simulations conform to this expectation very well. We have excluded from the plots halos having
N < Nmin = 20 or N > Nmax = 2 104 particles. Halos
containing only a few particles are not represented accurately by the simulations, and cause noticeable departures
from self-similarity if included, while the properties of halos
having masses approaching that of the box are aected by
the absence from the initial conditions of modes with wavelength exceeding the size of the box. For our simulations,
the Nmax cuto in fact makes little dierence, because M
is still much smaller than the mass of the box when the
simulations are halted.
Rigorously, self-similar clustering solutions only exist
for spectral indices in the range ,1 < n < 1, since outside this range, the r.m.s. peculiar velocity receives divergent contributions from either large or small scales (Davis
& Peebles 1977). For n < ,1, the problem arises from the
very long wavelength uctuations, which contribute negligibly to the r.m.s. overdensity, but produce large-scale coherent velocities. This should not aect the collapse of structure
on small scales, so small scale structure is still expected to
evolve in a self-similar way. This expectation is borne out
by the scaling of the mass functions, which works as well for
the n = ,2 models as for n = ,1 or 0.
Since the scaling of the mass functions in the simulations is consistent with self-similarity, we average the results for all output times together to increase their precision, weighting the contribution to df=d ln M in each bin in
M=M in proportion to the number of halos in that bin for
each output time. We use these averaged mass functions in
the comparisons that follow.
5.2 Choice of Filter and Density Threshold
We now consider the choice of lter in the Press-Schechter
mass function (c.f. x2.6). The PS prediction is that when
the distribution in mass is converted to a distribution in
= c (t)=(M ), it should have a universal form (equation 2.15), independent of the power spectrum. However,
(M ), and thus , depends on the lter used. For self-similar
models, = (M=M (t))(n+3)=6 , and dierent choices of lter lead to dierent values of M , according to equation
(2.22). To test this prediction of a universal form, in Figure 2 we plot the N-body mass functions of our self similar
models for FOF(0.2) groups, converted to distributions in
Mass functions for dierent output times, for groups
identied using FOF(0.2), and masses rescaled to be in units of
the characteristic mass M(t). df =d ln M is the fraction of mass
in halos per logarithmic interval in halo mass. Each panel shows
the results for a single N-body run (n = ,2; ,1; 0), with the mass
functions for dierent output times plotted as solid lines, and the
Press-Schechter prediction (equation (2.24)) for top-hat ltering
and c0 = 1:69 as a dashed line.
Figure 1.
Merger rates
, for three dierent choices of lter: top hat (TH), Gaussian (G) or sharp k-space (SK). In each case, we have assumed c0 = 1:69 in calculating . It can be seen that for
either top hat or sharp k-space ltering, the N-body mass
functions in the form df=d ln vs are indeed almost the
same for the dierent initial power spectra, consistent with
PS, but that for Gaussian ltering, there is a large spread
between the N-body curves for dierent n at high masses
( >
1). Thus, Gaussian ltering is inconsistent with assuming a single universal value for the threshold c0 in the
PS and related formulae. Various authors have nonetheless
used it in comparing the PS mass function to CDM simulations (e.g. Efstathiou & Rees (1988), Carlberg & Couchman (1989)). This result on the relative merits of the dierent types of lter also holds for the other group identication schemes we tested (friends-of-friends with b = 0:15 and
b = 0:3, and spherical overdensity with = 180).
A second question concerns how well the PS formula
actually ts, and what is the best value to use for c0 . In
Figure 2 (which assumed c0 = 1:69), the standard PS prediction (equation 2.15) is shown by a dot-dash curve in each
panel. While the PS and N-body curves have the same general shape, it is apparent that they could be brought into
even closer agreement by shifting the N-body curves horizontally, which corresponds to changing c0 ( / c0 ). For
each lter, we have estimated by eye what value of c0 gives
the best t. The resulting best t PS curve in each case is
shown by a dotted line, and the corresponding value of c0
given in the panel. (Rather than replot the N-body curves
with the new value of c0 , we have shifted the PS curve in,1 .) For Gaussian ltering, the best t c0
versely as, / c0
depends strongly on the power spectrum, so we have tted
the n = ,1 results, in the middle of our range. It can be
seen that for FOF(0.2) groups, the best t c0 1:81 is close
to the standard value c0 = 1:69 from the spherical collapse
model for top hat ltering, but diers somewhat more for
sharp k-space or Gaussian ltering. With a lter-dependent
(but spectrum-independent) c0 chosen in this way, the PS
mass function with TH or SK ltering ts the N-body results very well, especially TH ltering, where t is accurate
to 30% over the range 0:3 <
< 3. However, the PS formula
does systematically over-estimate the abundance of low mass
halos ( <
1), compared to the simulations.
These results on c0 are reasonably consistent with
those found by previous authors. EFWD found a reasonable
t to FOF(0.2) groups in self-similar models for top hat
ltering with c0 = 1:68, while Efstathiou & Rees (1988)
and Carlberg & Couchman (1989) found c0 = 1:33 and
c0 = 1:44 respectively for FOF(0.2) groups in CDM models
using Gaussian ltering (note that the CDM power spectrum has eective spectral index d ln P (k)=d ln k ,2 on
the range of scales considered). Bond & Myers (1993b) nd
c0 = 1:58 from their CDM simulations, but this is using
their own group-nding scheme, which produces somewhat
more massive groups than FOF(0.2), and correspondingly
requires a smaller c0 .
9
5.3 Mass Functions with Dierent
Group-nding
It is important to investigate how sensitive the results on
mass functions are to the group-nding method employed.
We have repeated the previous analysis for friends-of-friends
with two other values of the linking parameter, b = 0:15 and
0:3, and for the spherical overdensity method with overdensity = 180. Figure 3 shows the results for top hat ltering and c0 = 1:69. The dot-dash curve in each panel
is identical, and is the standard PS result, while the dotted curve is the shifted PS curve which seems to give the
best t, the corresponding best t value of c0 being given
in each panel. Comparing the N-body mass functions with
dierent group nders, the plots show the expected result
that halo masses are smaller for FOF(0.15) than FOF(0.2),
and larger for FOF(0.3). SO(180) halos are also on average
smaller than FOF(0.2), but give very similar mass functions
to FOF(0.15). The best t values of c0 vary with groupnder accordingly, larger halo masses requiring a smaller
c0 , and vice versa, as shown in the gure.
Overall, TH ltering gave the best t of N-body mass
functions to the PS formula for all the group-nders, when
c0 was allowed to vary, though SK ltering was almost as
good. With TH ltering, all the group-nders gave reasonable ts to PS (with dierent c0 ), as can be seen from Figure 3, though in each case, when the PS formula is tted
at the high mass end, it predicts somewhat too many low
mass halos, the discrepancy being largest for FOF(0.15) and
SO(0.3). FOF(0.3) groups result in the best t to PS overall, when c0 is allowed to vary. For the canonical choice
c0 = 1:69, FOF(0.2) and FOF(0.3) groups agree about
equally well with PS.
5.4 Discussion
We now summarize the results of this section. For the choice
of lter in the Press-Schechter mass function, for self-similar
models with ,2 n 0, there seems little to choose between top hat and sharp k-space ltering, but Gaussian ltering results in a signicantly worse t to the N-body results. The N-body mass functions change with changes in the
group-nding used, but this can to a considerable extent be
compensated in the PS formula by adjusting c0 . If c0 is
instead xed at the value 1:69 from the spherical collapse
model, then for FOF groups, a value b 0:2 , 0:3 seems to
give the best agreement with PS. We caution however that
these conclusions may be changed for more general power
spectra, in particular, there may be more dierence between
top hat and sharp k-space ltering. In the remainder of this
paper, in looking at merger properties, we will concentrate
on b = 0:2 FOF groups, using top hat ltering, since these
choices are the most standard. For simplicity we will use the
standard value c0 = 1:69 for the collapse threshold, since
this is in any case close to the best t for the other choices
made. The PS mass function then ts our N-body results to
within a factor 2 or better for 0:3 <
< 3.
10
C. Lacey and S. Cole
Averaged mass functions for the dierent N-body models, compared to the Press-Schechter mass function using dierent
lters. df =d ln is the fraction of mass per logarithmic interval in = (M=M)(n+3)=6 . Groups were identied using FOF(0.2). Each
panel shows results for a dierent choice of lter: top hat (TH), Gaussian (G) and sharp k-space (SK) respectively. Each panel shows
the N-body mass functions for n = ,2 (long dashed line), n = ,1 (solid) and n = 0 (short dashed), where these have been averaged
over all output times. Also shown is the standard Press-Schechter result (equation (2.15)) (long dash dot curve), and also the PS curve
shifted in to give the best t to the N-body results (dotted curve). Shifting in is equivalent to using a dierent value for c0 from
the standard one. The values of c0 for the best-tting PS curves are shown in the top right corner of each plot.
Figure 2.
Eects on N-body mass functions of dierent group-nding schemes. Each panel shows the mass functions for n = ,2; ,1; 0
(long dashed, solid and short dashed lines respectively), for a dierent choice of group nding scheme and parameters. The rst 2 panels
show friends-of-friends with b = 0:15; 0:3 respectively (the case b = 0:2 was shown in Figure 2), while the last shows the spherical
overdensity method with = 180. In each panel, the N-body mass functions have been averaged over output times, and converted to
distributions in assuming top hat ltering and c0 = 1:69. Also shown in each panel is the standard Press-Schechter result (equation
(2.15)) (long dash dot curve), and the PS curve shifted in to give the best t to the N-body results (dotted curve). The values of c0
corresponding to the best-tting PS curves are shown in the top right corner of each plot.
Figure 3.
Merger rates
11
A comparison of the analytical conditional mass functions (2.17) (dashed curves) with those of FOF(0.2) groups in the n = ,2
simulation (solid lines). Top hat (TH) smoothing and the standard c0 = 1:69 were used to dene M. We have used only halos with
N1 > 20 and N > 20. An indication of the magnitudes of the statistical errors in these estimates are shown by the Poisson error bars,
which are calculated as described in the text. The top row of plots show results for an interval pa=a1 = 0:06, which equals that between
consecutive outputs of our n = ,2 simulation, i.e. between which M increases by a factor of 2. From left to right these three plots
correspond to increasing M1 =M as indicated on each plot. The lower row of plots make the same comparison for a larger time interval,
a=a1 = 0:59, which corresponds to the interval over which M increases by a factor 16.
Figure 4.
12
C. Lacey and S. Cole
Like Figure 4, but for
p the n = ,1 model. The values of a=a1 indicated on the gures again correspond to the intervals over
which M increases by factors 2 and 16 respectively.
Figure 5.
6 MERGER RATES
The conditional mass function, df=d ln M jM1 ;a;a1 , (2.17)
describes the probability that a halo of mass M1 at the
epoch when the expansion factor equals a1 will accrete mass
M M2 , M1 to become a halo of mass M2 at expansion
factor a2 = a1 + a. In the limit of a ! 0 this yields the
instantaneous merger rate at expansion factor a1 of halos of
mass M1 with halos of mass M . Here we compare the conditional mass function (2.17) for both small and large time
intervals t with estimates made directly from our N-body
simulations.
Having constructed group catalogues for each output
time of our simulations using one of the group nding algorithms discussed in x4 it is an easy matter to construct
the conditional mass function for any pair of output times.
For each group of mass M1 identied at the epoch when the
expansion factor equals a1 we determine which halo it has
become incorporated in at expansion factor a2 by nding the
halo at this later epoch which contains the largest fraction
of the particles from the original halo. Dening the mass of
this new halo as M2 we construct a joint histogram of M1
and M = M2 , M1 . The scale free nature of the initial
conditions of our simulations implies that the form of these
histograms when expressed in units of M1 =M? (M? given
by (2.21) at a = a1 ) and M=M1 should depend only on
a=a1 (a2 , a1 )=a1 . Consequently the histograms from
dierent pairs of output times, but with the same value of
a=a1 , can be averaged to yield more accurate estimates
of the conditional mass function. For each pair of output
times we weight the contribution to df=d ln M jM1 ;a;a1 in
Merger rates
13
Like Figure 4, but for
p the n = 0 model. The values of a=a1 indicated on the gures again correspond to the intervals over
which M increases by factors 2 and 16 respectively.
Figure 6.
each bin of M=M1 in proportion to the number of halos in
that bin. We estimate Poisson error bars for the conditional
mass function from the number of halos Nbin in each mass
bin, summed over the pairs of output times. Successive pairs
of output times are not really independent, so we dene an
eective number perpbin as Ne = Nbin =f , and take the fractional error to be 1= Ne . For the particular case for which
a=a1 corresponds to the spacing between
p successive outputs, i.e. outputs spaced by a factor 2 in M (t), we take
f = 1, but for all larger values of a=a1 we adopt f = 2,
which corresponds to taking outputs separated by a factor
2 in M (t) to be independent. This procedure is obviously
not rigorous, but provides some indication of the magnitude
of statistical errors.
We have compared the analytical predictions of (2.17)
with the conditional mass functions estimated from each of
our the simulations for a wide range of both M1 and a=a1 .
A representative selection of these comparisons are shown in
Figures 4, 5 and 6, which are for the case of groups identied
using FOF(0.2), and restricted to halos satisfying N1 > 20
and N = N2 , N1 > 20, N1 and N2 being the number of
particles in the halo at a1 and a2 respectively. In these gures, M was dened using top hat (TH) smoothing and the
standard c0 = 1:69, which gave close to the best t to the
FOF(0.2) mass functions in x5. The ts of the analytical to
the N-body results in these diagrams are much less sensitive
to the adopted value of c0 than was the case for the mass
functions, and adopting the \best t" value of c0 = 1:81
only slightly changes the analytic distributions. In fact, the
values of c0 which give the best t for the conditional mass
14
C. Lacey and S. Cole
Figure 7.
Like Figure 5, but for SO(180) groups and with the best t value of c0 = 1:96 adopted from Figure 2.
functions are in general somewhat dierent from those found
for the mass functions themselves. The deviations of the rst
few or last few N-body points from the analytical curves seen
in some of the plots seem not to be signicant, but depend
on the choice of N1 and N . With more conservative cuts,
one gets smaller deviations, but then the N-body data covers
smaller ranges in M1 and M .
The conditional mass functions, df=d ln M jM1 ;a;a1 ,
shown in these gures exhibit a quite complicated dependence on the accreted mass, M , the initial mass, M1 , the
time interval, a, and on the spectral index, n, of the initial conditions. The distributions in M=M1 are asymmetric
and vary in both the form and degree of this asymmetry, in
their width, and in the location of their peak, when either
M1 =M , a=a1 , or n are changed. The distributions are
broadest and most asymmetric for low values of M1 =M .
Also for xed M1 =M they are broader for lower values of
n. Increasing a=a1 shifts the peaks of the distributions to
higher masses while also altering the asymmetric nature of
the low M1 =M distributions. Remarkably all these features
are quantitatively reproduced by the analytical expression
(2.17). Overall, we nd reasonable agreement between the
simulations and the analytical distributions over 2-3 decades
in M1 =M and M=M1 .
We also investigated the dependence of the conditional
mass functions on the choice of group nding algorithm.
Using the \best t" c0 values from x5, the analytical distributions t about as well for FOF(0.3) as for FOF(0.2), while
for FOF(0.15) and SO(180), the ts were slightly worse. We
show the results for the n=-1 spherical overdensity groups
in Figure 7, with c0 = 1:96. In this case, the analytical
distribution actually ts even better if c0 = 1:69 is chosen.
Merger rates
15
Comparison of the distribution of formation epochs derived from the FOF(0.2) groups in the n = ,2 simulation (solid curves)
with the analytical prediction (2.19) (dashed curves), for the various values of M=M indicated. We have assumed co = 1:69. For the
N-body curves, halos were identied and formation epochs af found for a set of identication epochs a0 diering by powers of 2 in M ,
and the results averaged. Only halos with N > 40 were used. The error bars represent Poisson errors corresponding to the total number
of halos in each bin in af , after combining the dierent epochs.
Figure 8.
Figure 9.
Same as Figure 8, but for the n = ,1 model.
16
C. Lacey and S. Cole
Figure 10.
Figure 11.
Same as Figure 8, but for the n = 0 model.
Same as Figure 9, but for SO(180) groups in the n = ,1 model, and with c0 = 1:96.
Merger rates
17
Distributions of dpf =d!~f for the N-body simulations compared with the analytical and Monte Carlo predictions from Paper I.
The thin solid lines show the N-body results for dierent values of M=M (averaged over output times as in Figures 8 - 10). The N-body
curves plotted are for the mass ranges M=M = 0:9 , 120, 0:1 , 15, 0:2 , 7 for n = ,2; ,1; 0 respectively. The short dash and long dash
curves are respectively the analytical and Monte Carlo predictions.
Figure 12.
7 FORMATION TIMES
In hierarchical models halos evolve continuously by accreting smaller halos and by merging with comparable and larger
halos. Thus there is no clear cut way of dening when a particular halo formed. As a working denition we have adopted
the formation time to be the point at which half the mass
of a halo is assembled. The distribution dpf =dtf (tf jM2 ; t2 ),
equation (2.19), gives the probability that half the mass of
a halo of mass M2 identied at time t2 was assembled at an
earlier time tf . Here we compare this analytical distribution
of formation times with estimates made directly from our
N-body simulations.
Starting with a set of group catalogues dened using one
of the group nding schemes of x5 we proceed as follows. For
each group of mass M identied at a particular output epoch
at which the expansion factor equals a0 , we identify its most
massive progenitor at all earlier output times. Progenitors
of a group are dened to be all those groups present at an
earlier epoch that have the majority (normally greater than
90%) of their particles incorporated into the nal group. We
then determine at which epoch the mass of this most massive progenitor rst becomes larger than M=2. This epoch
is taken to dene the formation time of the halo and denes the expansion factor af at formation. The histogram
of af values built up for a particular choice of a0 and M
denes the formation time distribution dpf =d ln af jM;a0 . For
our scale free simulations, this distribution is a function of
only M=M and af =a0 . Hence we can once again combine
the histograms from dierent nal output times, a0 , to better determine the numerical estimate of dpf =d ln af jM=M .
We choose to use only nal epochs separated by a factor 2
in M , so that they are approximately independent, and to
estimate Poisson errors from the combined number of halos
in each bin.
Figures 8,9 and 10 compare these results for FOF(0.2)
groups for a range of M=M with the analytical predictions
of equation (2.19), for spectral indices n = ,2,,1 and 0
respectively. In constructing these plots, we use only halos
with N > 40 particles at the epoch a0 . (Note, if the epoch
a0 is identied with the present epoch then the quantity
plotted along the x-axis log(af =a0 ) = , log(1 + zf ), where
zf is the formation redshift). In each case, there is a clear
trend for larger M=M halos to be both younger on average
and to have a narrower range of ages. This behaviour, and in
fact the precise shape of the distributions, is well reproduced
by the analytical distributions given by equation (2.19). We
nd agreement over 2-3 decades in M=M .
We also investigated the formation times of groups identied using the FOF algorithm with diering values of the
linking length b and for groups dened by SO with = 180.
Once the threshold c0 was adjusted to the appropriate \best
t value" found for the mass functions, then the agreement
between the analytical and numerical distributions was as
good as for the FOF(0.2) groups. In contrast to the ts to the
conditional mass functions in x6, the ts to the formation
time distributions were appreciably worse for FOF(0.15),
FOF(0.3) and SO(180) groups if the value c0 = 1:69 was
used instead of the appropriate \best t" value. As an example we show the distributions of formation times for the
case of the SO(180) groups in Figure 11.
18
C. Lacey and S. Cole
In paper I, we dened a scaled variable
c (af ) , c (a0 )
!~ f =
(2 (M=2) , 2 (M ))1=2
(n+3)=6
= (M=M (a(0n))+3)=3 (a1=02=af , 1)
(7.1)
(2
, 1)
(the second line is for self-similar models) in terms of
which the analytical distribution of formation times dpf =d!~ f
is independent of M=M and very nearly independent of
the spectral index n. This last property was demonstrated
graphically in Figure 7 of Paper I. Here we transform each
of distributions from Figures 8,9 and 10 into distributions
dpf =d!~ f which we show in Fig. 12. These gures conrm that
for the groups found in the N-body simulations there is also
very little dependence of these distributions on either mass
or spectral index. The short-dashed curves in Fig. 12 are
the analytical distributions while the long-dashed curves are
the Monte-Carlo distributions taken from Paper I. Clearly,
the distributions estimated from the N-body simulations are
well described by the analytical predictions (equation 2.19),
while the Monte Carlo model tends to overestimate halo
ages. We are currently working on an improved Monte Carlo
procedure which gives results very close to the analytical and
N-body ones.
8 CONCLUSIONS
We have tested the statistical predictions of the PressSchechter model for the halo mass function (Press &
Schechter 1974; Bond et al. 1991) and its extension to halo
lifetimes and merger rates (Paper I) against a set of large
self-similar N-body simulations with = 1 and spectral indices n = ,2; ,1; 0. The comparison reveals that in every
respect the analytical formulae produce remarkably good ts
to the numerical results.
To dene the analytical formulae two choices have to be
made. First one must select the form of spatial lter which
is applied to the linear density eld in order to dene (M ),
the rms uctuation as a function of mass scale. Secondly, one
must set the critical density threshold c0. We have found
that if one chooses a top hat ltering function, where the
radius of the top hat is simply that which contains mass
M , then the value of c0 required to match the halo mass
functions is independent of the spectral index of the linear
density eld for ,2 < n < 0. This independence also holds
for sharp k-space ltering of the initial conditions, but not
for Gaussian ltering. Furthermore, with top hat ltering
the standard choice of c0 (1:69 for = 1), predicted by the
analytical model for the collapse of a spherically symmetric
overdense region, produces a good t to the mass function of
halos selected using the usual friends-of-friends method with
a linking parameter b = 0:2 (which selects halos having mean
overdensity 100 , 200). We have investigated the eect of
varying the way halos are dened in the N-body simulations,
both using friends-of-friends with dierent linking lengths
(b = 0:15 and b = 0:3), and a spherical overdensity method,
which nds spherical regions of overdensity = 180. The
mass functions for the b = 0:15 and = 180 groups agree
less well with the analytical model for c0 = 1:69 and top
hat ltering, but can be brought into reasonable agreement
by increasing c0 .
With the choice of top hat ltering and c0 = 1:69,
the analytical mass functions dier by less than a factor
1:5 , 2 from those estimated from the b = 0:2 groups in the
simulations, over a range of 103 in mass (see Fig. 1). The
error is largest for the rare high-mass halos, but is typically
<
30% for the more numerous halos which contain most of
the mass. The error in the mass function can in fact be reduced to <
30% overall for this case by slightly increasing
c0 . The comparison is limited to the abovementioned range
of mass by the dynamic range of our simulations, which span
3 decades of mass from the smallest resolved halos (containing at least 20 particles) to the most massive. Although
still limited in dynamic range, this is a considerable improvement over the comparison made by Efstathiou et al.
(1988), which utilized simulations containing only 1=64th of
the number of particles of our simulations. The comparison
of halo merger rates with the analytical predictions reveals
remarkable agreement between the analytical formula and
the estimates from the simulations. All the trends seen in
the dependence of the merger rate on the masses of the two
halos involved and on the time interval considered are reproduced quantitatively by the analytic formula (2.17). In
fact, equation (2.17) is a reasonable t to the numerical estimates over the full range of masses that we are able to
explore. A similarly impressive agreement is seen when one
compares the distribution of halo formation times estimated
from the simulations with the analytical formula (2.19). For
the b = 0:15, b = 0:3 and = 180 groups, the agreement for
merger rates and formation times is about as good as for the
b = 0:2 groups, provided that instead of the standard value
c0 = 1:69, one uses the values of c0 which best t the mass
functions in the other formulae too.
We end with a caveat. Despite its success in matching
the results of N-body simulations, the Press-Schechter approach from which our formulae are derived falls some way
short of being a rigorous analytical model of gravitational
instability and non-linear dynamics. It is instead based on
the ansatz (Bond et al. 1991) that the mass in non-linear
objects of mass M can be equated with the mass within regions whose linear theory density perturbation exceeds a
threshold value, c , when smoothed on the mass scale M ,
but is below the threshold on all larger scales. In particular, no regard is paid to the shape or size of these regions.
Many will enclose less than mass M , making it impossible that they form objects of mass M without combining
with other nearby material. It is clear that any physically
realistic model must take account of the properties of the
linear density eld across the entirety of each region that
collapses to form a non-linear halo. The \peak-patch" analysis of (Bond & Myers 1993a) is the rst model that ad-
Merger rates
dresses this aspect of the problem. The disadvantage of this
more rigorous treatment is that it is very complex and does
not lead to analytical formulae for halo mass functions or
merger rates. Thus, despite the fundamental aws in the
Press-Schechter approach, the analytical formulae that it
yields are extremely valuable if they are an accurate description of the true halo mass functions and merger statistics.
This work conrms that these statistical predictions reproduce remarkably well the non-linear hierarchical evolution
of dark matter halos in large scale free cosmological N-body
simulations. They therefore provide a valid and extremely
useful framework in which to study galaxy and cluster formation in hierarchical models.
9 ACKNOWLEDGMENTS
We thank George Efstathiou and Carlos Frenk for providing
us with a copy of the P 3 M N-body code, and both them
and Tom Quinn for much helpful advice on N-body simulations. CGL is supported by a SERC Advanced Fellowship
and SMC by a SERC postdoctoral research assistantship.
REFERENCES
Aarseth S. J., Gott J. R., & Turner E. L., 1979, ApJ, 228, 664
Bardeen J. M., Bond J. R., Kaiser N., Szalay A .S., 1986, ApJ,
304, 15 (BBKS)
Barnes J. E., Efstathiou G., 1987, ApJ, 319, 575
Bond J. R., in Unruh W. G., Semeno G. W., eds, The Early
Universe, Reidel, Dordrecht, p283
Bond J. R., Cole S., Efstathiou G., Kaiser N., 1991, ApJ, 379,
440 (BCEK)
Bond J. R., Myers S. T., 1993, CITA preprint 93/27
Bond J. R., Myers S. T., 1993, CITA preprint 93/28
Bower R. J., 1991, MNRAS, 248, 332
Carlberg R. G., Couchman H. M. P., 1989, ApJ, 340, 47
Cole S., Kaiser N., 1988, MNRAS, 233, 637
Cole S., Kaiser N., 1989, MNRAS, 237, 1127
Cole S., Lacey C. G., 1994, in preparation
Davis M., Efstathiou G., Frenk C. S., White, S. D. M., 1985,
ApJ, 292, 371 (DEFW)
Davis M., Peebles P. J. E., 1977, ApJ Supp, 34, 425
Efstathiou G., Eastwood J. W., 1981, MNRAS, 194, 503
Efstathiou G., Davis M., Frenk, C. S., White, S. D. M., 1985,
ApJ Supp, 57, 241 (EDFW)
Efstathiou G., Rees M. J., 1988, MNRAS, 230, 5P
Efstathiou G., Frenk C. S., White S. D. M., Davis M., 1988,
MNRAS, 235, 715 (EFWD)
Frenk C. S., White S. D. M., Davis M., Efstathiou G., 1988,
ApJ, 327, 507
Kaumann G., White S. D. M., 1993, MNRAS, 261, 921
Kaumann G., White S. D. M., Guiderdoni B., 1993, MNRAS
264, 201
Kaumann G., Guiderdoni B., White, S. D. M., 1994, MNRAS
in press.
Lacey C. G., Cole S., 1993, MNRAS, 262, 627 (Paper I)
Narayan R., White S. D. M., 1988, MNRAS, 231, 97P
Peacock J. A., Heavens A. F., 1985 MNRAS 217, 805
19
Peacock J. A., Heavens A. F., 1990 MNRAS 243, 133
Peebles P. J. E., 1980, The Large Scale Structure of the
Universe. Princeton Univ. Press, Princeton, NJ
Press W. H., Schechter P., 1974, ApJ, 187, 425 (PS)
Warren M. S, Quinn P. J., Salmon J. K., Zurek W. H., 1992,
ApJ, 399, 405
White S. D. M., Frenk C.S., 1991, ApJ, 379, 25
White S. D. M., Efstathiou G., Frenk C.S., 1993, MNRAS, 262,
1023


© Copyright 2026