
Chieftain Silica Sand Mine Proposal, Barron County
ANALYSIS AND PRELIMINARY DETERMINATION FOR THE PROPOSED ADDITION OF NINE POTENTIAL MNE SITES AND THE MODIFICATION OF A DRYER, AND MODIFICATION OF THE FACILITY TO SUPPORT POTENTIAL INCREASE OF MINING AND PROCESSING CAPACITIES AND ANALYSIS AND PRELIMINARY DETERMINATION FOR THE OPERATION PERMIT FOR AN INDUSTRIAL SAND PRODUCTION FACILITY WITH MINES AND A PROCESSING PLANT FOR CHIEFTAIN SAND AND PROPPANT BARRON, LLC, TO BE LOCATED AT US HIGHWAY 53 AND COUNTY HIGHWAY SS, DOVRE TWNSHP, BARRON COUNTY, WISCONSIN Construction Permit No.: 13-POY-205 Operation Permit No.: 603107010-F01 Facility ID No. 603107010 This review was performed by the Wisconsin Department of Natural Resources, Bureau of Air Management in accordance with Chapter 285, Wis. Stats., and Chapters NR 400 to NR 499, Wis. Adm. Code. Reviewed by: Paul O. Yeung Date: 12/8/2014 Peer review conducted by: /s/ Joe Brehm Date:11/20/2014 Preliminary Determination Approved by: Signature Date Regional Supervisor or Central Office Designee: /s/ Rick Wulk 12/9/2014 Stationary Source Modeling Team Leader: /s/ Emily Houtler for JR Sims 12/9/2014 Compliance Engineer (reviewed/approved): /s/ Joydeb Bhattacharyya for John Dague 12/9/2014 cc: John B. Dague - Northern Region Air Program, Cumberland Area Office Calhoun Memorial Library, 321 Moore St., PO Box 25, Chetek, WI 54728 Preliminary Determination, FID No. 603107010, Permit Nos. 13-POY-205, 603107010-F01 Page 2 of 49 INTRODUCTION Stationary sources that are not specifically exempt from the requirement to obtain a construction permit under s. 285.60(5), Wis. Stats. or ch. NR 406, Wis. Adm. Code may not commence construction, reconstruction, replacement, relocation or modification unless a construction permit for the project has been issued by the Department of Natural Resource’s (DNR’s) Air Management Program. Owners or operators subject to the construction permit requirements must submit a construction and operation permit applications to the DNR. The applications are reviewed following the provisions set forth in ss. 285.60 to 285.67, Wis. Stats. The criteria for permit issuance vary depending on whether the source is major or minor and whether the source is or proposed to be located in an attainment or nonattainment area. Subject sources are to be reviewed with respect to the equipment and facility description provided in the applications and for the resulting impact upon the air quality. The review ensures compliance with all applicable rules and statutory requirements. The preliminary determination will show why the source(s) should be approved, conditionally approved, or disapproved. It will encompass emission calculations and an air quality analysis using US EPA models, if applicable. Emissions from volatile organic compound (VOC) sources and small sources whose emissions are known to be insignificant are normally not modeled. As a precautionary note, the emission estimates are based on US EPA emission factors (AP-42) or theoretical data and can vary from actual stack test data. The sources included in this construction permit are also required to obtain an operation permit under s. 285.60(1)(b), Wis. Stats. This review constitutes the Department’s review of applications for both the construction permit and the operation permit for these units. A final decision on the construction permit and operation permit will not be made until the public has had an opportunity to comment on the Department’s analysis, preliminary determination and draft permit. The conditions proposed in the draft permit may be revised in any final permit issued based on comments received or further evaluation by the Department. GENERAL APPLICATION INFORMATION Owner/Operator: Chieftain Sand And Proppant Barron, LLC 331 27th Street New Auburn, WI 54757 Responsible Official: Victor Serri Chief Operating Officer Application Contact Person: Tom Henning, Consultant (920) 207-0721 Application Submitted By: Tom Henning, Consultant (920) 207-0721 Application submittal date: January 23, 2014 Additional Information Submitted: May 28, 2014 through December 8, 2014 Preliminary Determination, FID No. 603107010, Permit Nos. 13-POY-205, 603107010-F01 Date of Complete Application: Page 3 of 49 December 8, 2014 PROJECT DESCRIPTION Chieftain Sand and Proppant was issued construction permit 11-POY-178 on April 25, 2012. That permit authorized to construct Process P01, Stack S01 – Fluid Bed Dryer with a 150 ton per hour (tph) drying capacity and a burner capacity no greater than 40 million BTU per hour (MMBTU/hr). Emissions are controlled with a baghouse (C01). The dryer is fueled with natural gas. Process P02, Stack S02 – A Screening Tower baghouse (C02) will be used to control emissions from sand handling, processing, and storage operations inside the dry plant building. Process P03, Stack S03 – Three Storage Silos for finished sand are each equipped with filters (C03) to control emissions generated from air displacement. Process P04, Stack S04 – Loadout Station used to load either rail cars or trucks. Transfer point is equipped with filters (C04) to control emissions from the loading process. Process P05 – Multiple natural gas space heaters and air make-up units, total combustion capacity of up to 5 MMBTU/hr. These units will be vented through the dry plant general building exhausts. Fugitive Source F01 – On-site Truck Traffic to the Sand Receiving Station in Dry Plant on Unpaved Roads Fugitive Source F02 – Washed Sand Stockpile Fugitive Source F03 – Waste Material Storage Pile Fugitive Source F04 – Transload Operations Fugitive Source F05 – Crushing Fugitive Source F06 – Screening Fugitive Source F07 – Up to 12 Conveyors / Loading Transfers Fugitive Source F08 – Sand Storage Pile Fugitive Source F09 – Truck Traffic at the Mine and Wet Plant on Unpaved Roads Fugitive Source F10 – Blasting at the Mine Fugitive Source F11 – Drilling at the Mine One mine, Anderson mine (40 acre) at 2586 3rd Ave, Chetek was covered under 11-POY-178. On November 14, 2013, Chieftain Sand was issued construction permit 13-POY-108 to make the following changes to permit 11-POY-178 in order to: 1. Install a new rotary industrial sand dryer with a baghouse (P11, S11, C11). The dryer would have drying capacity of 100 tons per hour and up to 40 MMBTU/hour burner capacity (natural gas fired). 2. Install a post-drying screening operation with a baghouse for control (P12, S12, C12). 3. Add three product silos with bin vent filters (P13A, B and C). 4. Install a second rail/truck loadout station with conveyor and dustless loadout spouts (P14) controlled by cartridge collector. 5. Add an additional feed hopper, conveyors/stackers and waste pile to F03, F04, and F06, respectively. Initially wet sand will be trucked to the dry plant site, stockpiled, and fed into hoppers and conveyors to move the sand into the two dryers. In the future, Chieftain intends on Preliminary Determination, FID No. 603107010, Permit Nos. 13-POY-205, 603107010-F01 6. 7. 8. 9. 10. 11. Page 4 of 49 installing a wet sand storage building. This will cover the outdoor piles and move some of the sand transfer points inside the building. New natural gas heating units which will result in the total heat input capacity of these natural gas (and/or propane) heating units up to 20 million BTU per hour. Change the sand drying capacity of the existing dryer from 150 tons per hour to 200 tons per hour. The burner heat input capacity will remain at 40 million BTU per hour. The sand screening tower capacity will increase to 200 tons per hour as well. Add four more potential mines as potential sand sources. Increase unpaved road vehicle mile travelled, and the emissions of F01 and F09 are combined. Remove blasting and drilling from the facility permit. Blasting and drilling has not been done at the site, and will not be done. The four new mines are: Luckey (160 acre): 362 25 ½ ST CTH AA, Chetek; Poetsch (35 acre): 2485 3rd Ave, Chetek; Schaaf (80 acre): 364 24 ¾ ST, Chetek; Siemers (80 acre): No address, about half a mile South of Luckey off 25 ½ ST, New Auburn. On January 23, 2014, Chieftain Sand submitted a new construction permit application (the application was partially received on December 26, 2013), with subsequent proposed changes, for the following changes at the facility: 1. Change the rotary sand dryer (P11) capacity to 200 tons per hour, with a capacity heat input of 50 million BTU per hour. 2. Change the second screening tower (P12) operation capacity to 200 tons per hour. 3. Change the fluid bed dryer (P01) CO emission limit to make the facility synthetic minor for Part 70 for CO. 4. Add blasting and drilling (removed in permit 13-POY-108) to the facility. 5. Add a grizzly feeder in the dry plant. 6. Increase the size of the crusher to 800 tons per hour (it was at 300 tons per hour in 13-POY-108). 7. Increase the size of the screen in wet plant to 800 tons per hour (it was at 500 tons per hour in 13POY-108). 8. Add nine potential mine sites. 9. Add outdoor storage pile acreage. 10. Change the mining production limit to 6,000,000 tons per year. 11. Change the wet plant capacity to 7,008,000 tons per year (capacity of the crusher at the wet plant) 12. Increase truck traffic VMT at the mine sites (unpaved), and wet plant (paved and unpaved) and dry plant (paved). 13. Add front end loader traffic emissions at the mine sites and wet and dry plants. 14. Include water truck traffic emissions at the facility. The nine potential new mine sites may potentially be located in each of these areas: Sioux Creek S12 Mine - T32N, R11W, S12 (T. of Sioux Creek), Sioux Creek S13 Mine - T32N, R11W, S13 (T. of Sioux Creek), Sioux Creek S24 Mine - T32N, R11W, S24 (T. of Sioux Creek), Dovre S7 Mine - T32N, R10W, S7 (T. of Dovre), Dovre S18 Mine - T32N, R10W, S18 (T. of Dovre), Dovre S19 Mine - T32N, R10W, S19 (T. of Dovre), Dovre S8 Mine - T32N, R10W, S8 (T. of Dovre), Dovre S17 Mine - T32N, R10W, S17 (T. of Dovre), and Dovre Mine - S20 T32N, R10W, S20 (T. of Dovre), all in Barron County. The project is subject to NSPS under Part 60 Subpart UUU and Subpart OOO. There is no applicable specific exemption in s. NR 406.04(1), therefore a construction permit and an operation permit will be required. Other Actions: Preliminary Determination, FID No. 603107010, Permit Nos. 13-POY-205, 603107010-F01 Page 5 of 49 This construction permit will also be processed as an operation permit (603107010-F01) which covers operations at the entire facility. SOURCE DESCRIPTION The rotary sand dryer (P11) was permitted under 13-POY-108 with a sand drying capacity of 100 tons per hour, and with a heat input capacity of 40 million BTU per hour. Chieftain Sand has proposed to change the rotary sand dryer (P11) capacity to 200 tons per hour, with a heat input capacity of 50 million BTU per hour. The sand screening tower (P12) was permitted under 13-POY-108 with a sand processing capacity of 100 tons per hour. Chieftain Sand has proposed to change the sand screening tower (P12) capacity to 200 tons per hour. In addition, the company proposed to add 9 potential sand mines. The nine potential new mines are and may potentially be located in each of these areas: Sioux Creek S12 Mine T32N, R11W, S12 (T. of Sioux Creek), Sioux Creek S13 Mine - T32N, R11W, S13 (T. of Sioux Creek), Sioux Creek S24 Mine - T32N, R11W, S24 (T. of Sioux Creek), Dovre S7 Mine - T32N, R10W, S7 (T. of Dovre), Dovre S18 Mine - T32N, R10W, S18 (T. of Dovre), Dovre S19 Mine - T32N, R10W, S19 (T. of Dovre), Dovre S8 Mine - T32N, R10W, S8 (T. of Dovre), Dovre S17 Mine - T32N, R10W, S17 (T. of Dovre), and Dovre Mine - S20 T32N, R10W, S20 (T. of Dovre), all in Barron County. These potential mines may be located in the locations as outline in the following figure: The company proposed an increase in mining production limit to 6.0 million tons per year. The limit on mine sand of 6.0 million tons per year will be enforced. Some of the mined sand may not need to be crushed. The VMT limitation on truck traffic on unpaved roads will also be increased as proposed in the permit application material. The VMT on the front end loader traffic will be limited as well. The silos and rail load out will not be changed. Description of New or Modified Units. Emission Unit Information. Preliminary Determination, FID No. 603107010, Permit Nos. 13-POY-205, 603107010-F01 Page 6 of 49 Emission Unit Information. Boiler/furnace number [or process line, etc.]: P11 Unit description: New Rotary Sand Dryer Control technology status: Baghouse Maximum continuous rating (mmBTU/hr): 50 mmBTU/hr; 200 tons/hr Date of construction or last modification: 2014 Construction Permit Requirements: 13-POY-205 Stack Information. Stack identification number: S11 Exhausting unit(s): P11 This stack has an actual exhaust point: Y Discharge height above ground level (ft): 90 Inside dimensions at outlet (ft): 4 Exhaust flow rate (normal) (ACFM): 65,000 Exhaust flow rate (maximum) (ACFM): 65,000 Exhaust gas temperature (normal) (°F): 140 Exhaust gas temperature (maximum) (°F): 140 Exhaust gas discharge direction: UP Stack equipped with any obstruction: NO Control Device Information. Control Device identification number: C11 Exhausting emissions unit(s): P11 Control device type [baghouse, ESP, etc.]: Baghouse Control device description: Baghouse Manufacturer and model number: - Date of construction: Primary Fuel 2013 Fuel name Higher heating value Max. hourly consumption Natural Gas 1020 BTU/cu. ft. 49000 cu. ft./hr Emission Unit Information. Boiler/furnace number [or process line, etc.]: Unit description: Control technology status: Maximum continuous rating (mmBTU/hr): Date of construction or last modification: Construction Permit Requirements: P12 Sand Dry Plant Building Fabric Filter Baghouse 2014 13-POY-205 Preliminary Determination, FID No. 603107010, Permit Nos. 13-POY-205, 603107010-F01 Page 7 of 49 Stack Information . Stack identification number: S12 Exhausting unit(s): P12 This stack has an actual exhaust point: Y Discharge height above ground level (ft): 90 Inside dimensions at outlet (ft): 3 Exhaust flow rate (normal) (ACFM): 30000 Exhaust flow rate (maximum) (ACFM): 30000 Exhaust gas temperature (normal) (°F): 75 Exhaust gas temperature (maximum) (°F): 75 Exhaust gas discharge direction: UP Stack equipped with any obstruction: NO Control Device Information. Control Device identification number: C12 Exhausting emissions unit(s): P12 Control device type [baghouse, ESP, etc.]: Control device description: Manufacturer and model number: Date of construction: Fabric Filter Baghouse 2013 Preliminary Determination, FID No. 603107010, Permit Nos. 13-POY-205, 603107010-F01 Page 8 of 49 Stack Parameter Summary. F Normal Flow Rate ACFM Maximum Flow Rate ACFM 85 170 65000 65000 -- 85 68 27000 27000 1 -- 88 Ambient 300 300 No 1 -- 88 Ambient 300 300 H No 1 -- 88 Ambient 300 300 Circular H No 1.3 -- 30 Ambient 1000 1000 S11 Circular U No 4 -- 90 140 65000 65000 S12 Circular U No 3 -- 90 75 30000 30000 S13A Circular H No 1 -- 88 Ambient 300 300 S13B Circular H No 1 -- 88 Ambient 300 300 S13C Circular H No 1 -- 88 Ambient 300 300 S14 Circular H No 1.3 -- 30 Ambient 1000 1000 Circular or Rectangular Discharge Direction U, D, H Exhaust Obstacle Yes/No Diameter or Width (if rect.) ft Length (if rect.) ft S01 Circular U No 4 S02 Circular U No S03A Circular H S03B Circular S03C Height Temp. ft -- 3 No H Circular S04 Stack ID Insignificant Emissions Units. Maintenance of Grounds, Equipment, and Buildings (lawn care, painting, etc.) HVAC System Maintenance Pollution Control Equipment Maintenance Fire Control Equipment Janitorial Activities Office Activities Convenience Water Heating Convenience Space Heating (< 5 million BTU/hr Burning Gas, Liquid, or Wood) Sanitary Sewer and Plumbing Venting CROSS MEDIA IMPACTS The sand mine operation will be subject to NR 135, Wis. Adm. Code for the reclamation of the mine site. Sand not acceptable as product will be used in the reclamation of the mine site. EMISSION CALCULATIONS. Preliminary Determination, FID No. 603107010, Permit Nos. 13-POY-205, 603107010-F01 Page 9 of 49 For the rotary sand dryer (P11), the maximum capacity is 200 tons per hour. AP-42 Table 11.19.1-1 provides a particulate matter (PM) emission of 2.0 pounds per ton of sand for a sand dryer. It is unknown whether that would be for a fluid bed dryer or a rotary dryer. The emission factor rating is E. It is unknown what the particle size distribution would be. The maximum theoretical PM emissions from each dryer based on this emission factor would be 2.0 lb/ton * 200 ton/hr = 400 lb/hr On an annual basis, the maximum theoretical PM emissions from each dryer based on this emission factor would be: 400 #/hr * 8760 hrs/yr / 2000 #/ton = 1752 tons/yr The dryer will be subject to the PM emission limitation in NR 415.05 and the allowable emission rate in NR 415 will be the more restrictive limit of (a) and (b), and this limit includes both front and back half: (a) 0.20 #/1000 # exhaust gas; the exhaust flow rate at capacity will be 65000 acf/min at 140F. The exhaust gas mass flow rate at standard conditions will be: 65000 acf/min * (460+68)/(460+140) * 60 min/hr * 0.075 #/cf = 257400 #/hr At 0.20 #/1000# gas, the allowable PM emission limit will be: 0.20 #/1000 # * 257400 #/hr = 51.48 #/hr (b) The maximum allowable emission limit calculated by the process weight rate equation is: E = 17.31 P0.16. The process weight rate (at capacity) is 200 tons/hr in this case. So, E = 17.31 (200)0.16 E = 40.41 #/hr As far as NR 415.05 is concerned, the PM limit based on process rate equation is the more restrictive limit when the dryer is operating at capacity. The dryers are subject to NSPS Subpart UUU. The NSPS PM emission limit for sand dryer is 0.025 gr/dscf. According to the permit application material, the exhaust flow for the dryer will be 65000 acf/min at 140oF. The allowable PM emissions under NSPS from the dryer will be: 0.025 gr/dscf * 65000 cf/min (460+528)/(460+140) * 60 min/hr / 7000 gr/# = 12.26 #/hr On an annual basis, that is the same as 12.26 #/hr * 8760 hrs/yr / 2000 #/ton = 53.7 tons/yr The NSPS PM limit will be based on Method 5 front half catch only. Preliminary Determination, FID No. 603107010, Permit Nos. 13-POY-205, 603107010-F01 Page 10 of 49 The major majority of the condensable particulates emission tests using Method 202 performed on industrial sand dryers have shown that the condensable particulates emission rates correspond to, or lower than the AP-42 emission factor of 5.7 pounds per million cubic feet of natural gas (0.0057 pound per million BTU) for condensable particulates from natural gas combustion. As a conservative measure, the emission factor can be doubled to calculate the potential emissions of condensable particulates from the each of the dryers: 0.0057 #/mmbtu * 2 * 50 mmbtu/hr = 0.57 #/hr The total (filterable + condensable) PM potential to emit for each dryer before applying more restrictive limitations and requirements will be: (12.26 + 0.57) #/hr = 12.83 #/hr On an annual basis, that is the same as 12.83 #/hr * 8760 hrs/yr / 2000 #/ton = 56.2 tons/yr The company requested more restrictive PM emission limit for each dryer of 3.5 #/hr. The dryer PM annual potential to emit will be: 3.5 #/hr * 8760 hrs/yr / 2000 #/ton = 4.91 tons/yr The 3.5 #/hr emission limit corresponds to the baghouse outlet loading of: 3.5 #/hr * 7000 gr/# * 1 hr/60 min / [65000*(460+68)/(460+140)] cf/min = 0.007 gr/dscf To be synthetic minor for PM10 the company requested a PM10 emission limit of 3.2 pounds per hour. 3.2 #/hr * 8760 hrs/yr / 2000 #/ton = 14.02 tons/yr The 3.2 #/hr emission limit corresponds to the baghouse outlet loading of: 3.2 #/hr * 7000 gr/# * 1 hr/60 min / [65000*(460+68)/(460+140)] cf/min = 0.0065 gr/dscf To meet the ambient standard for PM2.5 the company requested a PM10 emission limit of 2.5 pounds per hour. 2.5 #/hr * 8760 hrs/yr / 2000 #/ton = 10.95 tons/yr The 2.5 #/hr emission limit corresponds to the baghouse outlet loading of: 2.5 #/hr * 7000 gr/# * 1 hr/60 min / [65000*(460+68)/(460+140)] cf/min = 0.005 gr/dscf The emissions due to the combustion of fuel in the dryer are given in Table 1. The P12 equipment and processes are placed inside the new dry plant building. It is unknown how much of the particulate matter emissions from the processes will be captured and be exhausted to the filter collector. The maximum theoretical emissions can be back-calculated from the emission limit with an assumed filter control efficiency of 99.5%. The applicant has requested for an emission limit for PM of Preliminary Determination, FID No. 603107010, Permit Nos. 13-POY-205, 603107010-F01 Page 11 of 49 2.2 #/hr for P12. So, in such a case, the maximum theoretical particulate matter (PM) emissions would be: 2.2 #/hr / (1-0.995) = 440 #/hr 440 #/hr * 8760 hrs/yr / 2000 #/ton = 1927.2 tons/yr The new dry plant building is subject to the more restrictive of s. NR 415.05(1) and s. NR 415.05(2). The PM limit in s. NR 415.05(1) is 0.20 pound per 1000 exhaust gas. The maximum exhaust flow rate will be 50000 cf/min at 75F. The emission limit at 0.2 pound per 1000 exhaust gas will be: 0.20 lb/1000 lb gas * 30000 ft3/min * (460+68)/(460+75) * 60 min/hr * 0.075 lb/ft3 = 26.65 lb/hr The PM limit in s. NR 415.05(2) is E = 17.31 P0.16 E = 17.31 (200)0.16 E = 40.41 lb/hr So the more restrictive PM limit is that from the process weight rate in NR 415.05(2). By rule, the new dry plant building is required to meet the NSPS in Part 60 Subpart OOO of front half only PM limit of 0.014 gr/dscf. That corresponds to 0.014 grain/dscf * 30000 ft3/min * (460+68)/(460+75) ÷ 7,000 grain/lb * 60 min/hr = 3.55 lb/hr 3.55 #/hr * 8760 hrs/yr / 2000 #/ton = 15.55 tons/yr There is no combustion associated with this process, any emission of condensable particulates would be negligible. The company has requested the PM limit of 2.2 pounds per hour. The dry plant PM annual potential to emit will be: 2.2 #/hr * 8760 hrs/yr / 2000 #/ton = 9.64 tons/yr The 2.2 #/hr emission limit corresponds to the cartridge collector outlet loading of: 2.2 #/hr * 7000 gr/# * 1 hr/60 min / [30000 ft3/min * (460+68)/(460+75)] = 0.009 gr/dscf The company has requested the PM10 limit of 2.0 pounds per hour. The dry plant PM10 annual potential to emit will be: 2.0 #/hr * 8760 hrs/yr / 2000 #/ton = 8.76 tons/yr The 2.0 #/hr emission limit corresponds to the cartridge collector outlet loading of: 2.0 #/hr * 7000 gr/# * 1 hr/60 min / [30000 ft3/min * (460+68)/(460+75)] = 0.0047 gr/dscf Preliminary Determination, FID No. 603107010, Permit Nos. 13-POY-205, 603107010-F01 Page 12 of 49 The company has requested the PM2.5 limit of 1.7 pounds per hour. The dry plant PM2.5 annual potential to emit will be: 1.7 #/hr * 8760 hrs/yr / 2000 #/ton = 7.45 tons/yr The 1.7 #/hr emission limit corresponds to the cartridge collector outlet loading of: 1.7 #/hr * 7000 gr/# * 1 hr/60 min / [50000 ft3/min * (460+68)/(460+75)] = 0.004 gr/dscf Silos P13A, P13B and P13C P13A, P13B and P13C are identical processes (silos). The emission calculations provided here are for each process. PM emissions occur when the silos are being filled from a conveyor transferring sand into each silo. As sand enters the silos, the volume of sand displaces an equal volume of air. Any entrained sand and dust particles leaving will be particulate matter emissions. The AP-42 PM emission factor of 0.003 #/ton for conveyor transfer point given in Table 11.19.2-2, can be used to calculate the PM maximum theoretical emissions. The maximum loading capacity is 200 tons per hour (the dryer’s capacity). The PM maximum theoretical emissions will be 0.003 lb/ton * 200 ton/hr = 0.6 lb/hr 0.6 #/hr * 8760 hrs/yr / 2000 #/ton = 2.63 tons/yr The uncontrolled emission factor for PM10 is 0.0011 #/ton. The PM10 maximum theoretical emissions will be 0.0011 lb/ton * 200 ton/hr = 0.22 lb/hr 0.22 #/hr * 8760 hrs/yr / 2000 #/ton = 0.96 tons/yr No emission factor for PM2.5 is given in the AP-42 table. For the MTE, the PM10 and PM2.5 emission rates are assumed to be the same. Particulate matter (PM) emissions are subject to the more restrictive limitation in s. NR 415.05(1)(m) and (2), Wis. Adm. Code. Section NR 415.05(1)(m), Wis. Adm. Code limits the PM emissions to less than 0.20 pound per 1000 pounds of exhaust gas. The exhaust gas rate is 1000 scf/min. At 0.20 pound per 1000 pounds of exhaust gas, the allowable PM emissions would be: 0.20 #/1000 # * 1000 cf/min * 60 min/hr * 0.075 #/cf = 0.9 #/hr 0.9 #/hr * 8760 hrs/yr / 2000 #/ton = 3.94 tons/yr Section NR 415.05(2), Wis. Adm. Code limits the PM emissions based on the process weight rate equation 17.31P0.16 #/hr, where P is the process weight rate in tons per hour, and in this case, P = 200 for the entre process line. E = 17.31P0.16 #/hr Preliminary Determination, FID No. 603107010, Permit Nos. 13-POY-205, 603107010-F01 Page 13 of 49 E = 17.31 (200)0.16 E = 40.40 #/hr So the PM limit 0.20 pound per 1000 pounds of exhaust gas is more restrictive. This PM limit is based on Method 5 and Method 202, and includes condensable particulates. An individually stack-vented silo is not subject to the PM emission limit in the NSPS Subpart OOO. The company proposed to limit the PM emissions from each of P13A, P13B and P13C to 0.043 pound per hour. At 0.013 #/hr, the annual potential to emit based on this limit will be: 0.013 #/hr * 8760 hrs/yr / 2000 #/ton = 0.057 tons/yr The applicant also requested the PM10 and PM2.5 emission limits to be 0.013 #/hr in order to meet ambient air quality standards for PM10 and PM2.5. In addition, together with the other limitations and permit conditions for PM10, the facility will be a synthetic minor source for Part 70 for PM10 emissions. The 0.013 #/hr emission limit corresponds to the baghouse outlet loading of: 0.013 #/hr * 7000 gr/# * 1 hr/60 min / 300 dscf/min = 0.005 gr/dscf P14, Railcar loading station For P14, the railcar loading station, the FIRE PM emission factor of 0.02 #/ton for bulk loading of construction sand, SCC 30502506, can be used to calculate the PM maximum theoretical emissions. The maximum loading capacity is 200 tons per hour (the dryer’s capacity). The PM maximum theoretical emissions will be 0.02 lb/ton * 200 ton/hr = 4.0 lb/hr 4.0 #/hr * 8760 hrs/yr / 2000 #/ton = 17.52 tons/yr The uncontrolled emission factor for PM10 is 0.0024 #/ton. The PM10 maximum theoretical emissions will be 0.0024 lb/ton * 200 ton/hr = 0.48 lb/hr 0.48 #/hr * 8760 hrs/yr / 2000 #/ton = 2.1 tons/yr No emission factor for PM2.5 is given in FIRE. For the MTE, the PM10 and PM2.5 emission rates are assumed to be the same. Particulate matter (PM) emissions are subject to the more restrictive limitation in s. NR 415.05(1)(m) and (2), Wis. Adm. Code. Section NR 415.05(1)(m), Wis. Adm. Code limits the PM emissions to less than 0.20 pound per 1000 pounds of exhaust gas. The exhaust gas rate is 1000 scf/min. At 0.20 pound per 1000 pounds of exhaust gas, the allowable PM emissions would be: Preliminary Determination, FID No. 603107010, Permit Nos. 13-POY-205, 603107010-F01 Page 14 of 49 0.2 #/1000 # * 1000 cf/min * 60 min/hr * 0.075 #/cf = 0.9 #/hr Section NR 415.05(2), Wis. Adm. Code limits the PM emissions based on the process weight rate equation 17.31P0.16 #/hr, where P is the process weight rate in tons per hour, and in this case, P = 200 for the entre process line. E = 17.31P0.16 #/hr E = 17.31 (200)0.16 E = 40.40 #/hr So the PM limit of 0.20 pound per 1000 pounds of exhaust gas is more restrictive. This PM limit is based on Method 5 and Method 202, and includes condensable particulates. The NSPS PM emission limit for the #1 truck and railcar loadout station is 0.014 gr/dscf. The maximum flow rate is 1000 scfm. Thus the NSPS PM emission limit from the loadout station will be: 0.014 gr/dscf * 000 scf/min * 60 min/hr / 7000 gr/# = 0.12 #/hr On an annual basis, that is the same as 0.12 #/hr * 8760 hrs/yr / 2000 #/ton = 0.53 tons/yr The NSPS limit is for filterable particles only and the compliance test method is Method 5. There is no combustion associated with this process, any emission of condensable particulates would be negligible. The company proposed to limit the PM emissions from S14 to 0.043 pound per hour. At 0.043 #/hr, the annual potential to emit based on this limit will be: 0.043 #/hr * 8760 hrs/yr / 2000 #/ton = 0.19 tons/yr The applicant also requested the PM10 and PM2.5 emission limits to be 0.043 #/hr in order to meet ambient air quality standards for PM10 and PM2.5. In addition, together with the other limitations and permit conditions for PM10, the facility will be a synthetic minor source for Part 70 for PM10 emissions. The 0.043 #/hr emission limit corresponds to the baghouse outlet loading of: 0.043 #/hr * 7000 gr/# * 1 hr/60 min / 1000 dscf/min = 0.005 gr/dscf The summary of the stack vented emissions and the non-stack vented emissions from the facility are as given in Tables 2 through 6 below. Preliminary Determination, FID No. 603107010, Permit Nos. 13-POY-205, 603107010-F01 Page 15 of 49 Table 1. Emission Calculations for By Products of Combustion for the dryers Fluid Bed Dryer - Natural Gas (P01) Dryer Emission Emission Factor Total Potential Total Potential Capacity Factor in Emissions Emissions Source of lb/MMBTU lb/hr ton/yr Emission Factors 6.0 26.28 2/19/14 Stack Test = 4.09 lb/hr 0.17 6.8 29.78 Manufacturer 0.0054 0.22 0.94 AP-42 Table 1.4-2 6 Pollutant MMBTU/hr lb/10 cf CO 40 NOx 40 VOC 40 5.5 CO2 40 120,000 118 4,706 20,612 AP-42 Table 1.4-2 SO2 40 0.60 0.00059 0.024 0.10 AP-42 Table 1.4-2 Natural gas contains 1,020 MMBTU/MMCF per footnote in AP-42 Table 1.4-2. MMBTU/hr is calculated based on 39,000 cf/hr of natural gas x 1020 BTU/cf = 40 MMBTU Rotary Sand Dryer - Natural Gas (P11) Dryer Capacity Emis Factor Pollutant ton/hr lb/ton lb/hr ton/yr Emission Factors CO 200 0.020 4.0 17.52 Stack test (@100 tph) = 0.06 lb/hr NOx 200 0.044 8.7 38.11 Manufacturer2 Burner Capacity Emis Factor 6 Potential Emissions Emis Factor1 Potential Emissions Source of Source of Pollutant MMBTU/hr lb/10 cf lb/MMBTU lb/hr ton/yr Emission Factors VOC 50 5.5 0.0054 0.27 1.18 Manufacturer CO2 50 120,000 118 5,882 25,765 AP-42 Table 1.4-2 SO2 50 0.60 0.0006 0.029 0.13 AP-42 Table 1.4-2 1 Natural gas contains 1,020 MMBTU/MMCF per footnote in AP-42 Table 1.4-2. 2 A safety factor of 50% has been applied to the NOx emission Factor. Preliminary Determination, FID No. 603107010, Permit Nos. 13-POY-205, 603107010-F01 Page 16 of 49 Table 1B. Emission Calculations for By Products of Combustion for the heating units Heating Units - Natural Gas or Propane Heater Emission Emission Total Potential Total Potential Capacity (Total) Factor Factor Emissions Emissions Source of lb/hr ton/yr Emission Factors 3 Pollutant MMBTU/hr lb/10 gal lb/MMBTU CO 20 7.5 0.082 1.6 7.2 AP-42 Table 1.5-1 NOx 20 13 0.14 2.84 12.45 AP-42 Table 1.5-1 VOC 20 0.80 0.0087 0.17 0.77 AP-42 Table 1.5-1 CO2 20 12,500 136.612 2,732 11,967 AP-42 Table 1.5-1 SO2 20 0.016 0.00017 0.0035 0.015 AP-42 Table 1.5-1 Emissions calculated using propane as the primary fuel. According to AP-42 Table 1.5-1, propane contains 91.5 MMBTU/103 gallons Table 1C. Emission Calculations for By Products of Combustion for blasting Blasting (F10) 1 2 Pollutant ANFO Use1 ton/yr Emission Factor lb/ton Potential Emissions ton/yr Source of Emission Factors CO NOx VOC 1,350 1,350 1,350 67 17 - 45.2 11 - AP-42 Table 13.3-1 AP-42 Table 13.3-1 AP-42 Table 13.3-1 CO2 1,350 374 253 See Note 2 below. SO2 1,350 2.0 1.4 AP-42 Table 13.3-1 ANFO (Ammonium Nitrate + fuel oil) Emission Factor from 40 CFR 98 Table C-1, complete conversion of fuel oil carbon to CO2, 6% fuel oil in ANFO, and fuel oil wt. of 7.2 lb/gal = 73.96 kg CO2/MMBTU x 2.2 lb/kg x 0.138 MMBTU/gal x gal/7.2 lb x 2,000 lb/ton x 0.06 ton Fuel Oil/ton ANFO = 374 lb CO2/ton ANFO Preliminary Determination, FID No. 603107010, Permit Nos. 13-POY-205, 603107010-F01 Page 17 of 49 Table 1D. SUMMARY OF TOTAL POTENTIAL EMISSIONS FROM COMBUSTION UNITS Pollutant P01 Existing Dryer ton/yr Heaters ton/yr F10 Blasting ton/yr P11 New Dryer ton/yr Total ton/yr CO NOx VOC 26.3 29.8 0.94 7.2 12.4 0.77 45.2 11.5 - 17.5 38.1 1.18 96.2 91.8 2.9 CO2 20,612 11,967 253 25,765 58,596 SO2 0.10 0.015 1.4 0.13 1.6 Table 2. POTENTIAL EMISSIONS OF PARTICULATE MATTER for Stacked Sources Hourly Emissions Annual Emissions Hourly Emissions Annual Emissions Hourly Emissions Annual Emissions lb PM/hr 2.8 ton PM/yr 12.26 lb PM10/hr 2.8 ton PM10/yr 12.26 lb PM2.5/hr 1.36 ton PM2.5/yr 6.0 Process P01 - Fluid Bed Dryer Control Device Baghouse P02 - Screening Tower Baghouse 1.8 7.88 1.8 7.88 1.07 4.7 P03 Three Storage Silos Bin Vent 0.013 0.056 0.013 0.056 0.013 0.056 P04 Truck and Rail Loading Filter 0.043 0.19 0.043 0.19 0.043 0.19 P11 - Rotary Dryer Baghouse 3.5 15.3 3.2 14.0 2.5 11.0 P12 - Screening Tower Baghouse 2.2 9.6 2.0 8.8 1.7 7.4 P13 Second Three Storage Silos Bin Vent 0.013 0.056 0.013 0.056 0.013 0.056 P14 Truck and Rail Loading Filter 0.043 0.19 0.043 0.19 0.043 0.19 5.7 45.532 5.2 43.432 4.2 29.592 Total = Preliminary Determination, FID No. 603107010, Permit Nos. 13-POY-205, 603107010-F01 Page 18 of 49 Table 3. Potential PM Emissions Calculations for Fugitive Sources PM Process Process # of Units Number PM10 PM2.5 Hourly Capacity Annual Capacity Emission Factor Hourly Emission Annual Emission Emission Factor Hourly Emission Annual Emission Emission Factor Hourly Emission Annual Emission tph (each) tpy lb/ton lb PM/hr ton PM/yr lb/ton lb PM10/hr ton PM10/yr lb/ton lb PM2.5/hr ton PM2.5/yr Crusher (Wet Plant) F05 1 800 7,000,800 0.0012 0.96 4.2 0.00054 0.43 1.9 0.00010 0.080 0.35 Screen (Wet Plant) F06 1 800 7,000,800 0.0022 1.8 7.7 0.00074 0.59 2.6 0.000050 0.040 0.18 Up to 15 Conveyors F07 15 800 7,000,800 0.00014 1.7 7.4 0.000046 0.55 2.4 0.000013 0.16 0.68 Stackers & Hoppers Unwashed Sand F08A 3 800 7,000,800 0.00071 1.7 7.5 0.00034 0.8 3.6 0.000051 0.12 0.5 Stackers, Hoppers and Transload - Washed Sand F08B 7 800 3,504,000 0.00071 4.0 8.8 0.00034 1.9 4.1 0.000051 0.29 0.6 Grizzly (Dry Plant) F09 1 600 3,504,000 0.0012 0.72 2.1 0.00054 0.32 0.95 0.00010 0.060 0.26 Notes: 1. Crusher, Screen, Converyors and Grizzly: Emission Factors from AP-42, Table 11.19.2-2 for controlled sources (0.55 - 2.88 % moisture). 2. Stackers, Hoppers and Transload: Emission Factors from AP-42 13.2.4 (1): EF (lb/ton) = k * 0.0032 * (U/5)1.3 / (M/2)1.4 where, k PM30 = 0.74 Size fraction constant k PM10 = 0.35 Size fraction constant k PM2.5 = 0.053 Size fraction constant M= 8.0 Moisture content, % (Unwashed Sand) U= 8.85 Average wind speed, mph Preliminary Determination, FID No. 603107010, Permit Nos. 13-POY-205, 603107010-F01 Page 19 of 49 Table 4. Sand Storage Piles - Wind Erosion PM Emission Factor = 0.38 ton PM/acre/yr (undisturbed area) Emission Factor Source: Fifth Edition of AP-42, Table 11.9-4, Chapter 11.9, "Western Surface Coal Mining", 1998 Note: No scaling factors available for PM2.5 & PM10; use ratio of 'k' factors from AP-42, Sect. 13.2.4, Aggregate Handling and Storage Piles, 2006 k, PM = k, PM10 = k, PM2.5 = 0.74 Storage Pile Area = 0.35 Control Efficiency = 50% (from natural moisture) 0.053 Time = 8,760 hours/year Storage Piles - Uncontrolled 20 acres Storage Piles - Controlled EF PM ton/acre/yr Hourly lb/hr Annual ton/yr EF PM ton/acre/yr Hourly lb/hr Annual ton/yr PM30 0.38 1.7 7.6 0.19 0.87 3.8 PM10 0.18 0.82 3.6 0.090 0.41 1.8 PM2.5 0.027 0.12 0.54 0.014 0.062 0.27 Note: PM30 = PM Preliminary Determination, FID No. 603107010, Permit Nos. 13-POY-205, 603107010-F01 Page 20 of 49 Table 5. Overburden Removal and Blasting MINE OVERBURDEN REMOVAL From AP-42 Table 11.9-1, Bulldozing Variables k Value (Particle Size Multiplier) s Value (Silt Content) 1 M (Moisture content) Activity Time (hr/year) E (Emission Rate lb/hr) E (Emission Rate T/year) Equation for bulldozing overburden: PM EMISSIONS FROM BLASTING from AP-42 Table 11.9-1, Blasting of Overburden PM PM10 PM2.5 1.0 0.75 0.105 Variables PM PM10 PM2.5 1.0 0.52 0.03 22,000 22,000 22,000 80 46 1.8 80 24 0.95 80 1.4 0.055 k Value (Particle Size Multiplier) A (Blast Area) 1 4.8 4.8 4.8 10 3,000 1.9 10 3,000 0.2 10 3,000 0.035 Number of Blasts per year Emission Factor, lb/blast Emission Rate, ton/yr 2.8 0.4 0.052 Equation for PM from Blasting: EF = k * 0.000014*A1.5 E = 5.7 *k * (s)1.2 / M1.3 Where: E = Size-specific emission factor (lb/hr) Where: EF = Size-specific emission factor (lb/blast) k = Particle size multiplier k = Particle size multiplier A = area of horizontal blast (ft2) s = Surface material silt content (%) M = Material moisture content (%) 1 Area of blast estimated at 1/2 acre. Total blast area estimated to be: 0.5 acre/blast x 80 blast/yr = 40 acre/yr Number of blasts is assumed to be half of maximum theoretical. Preliminary Determination, FID No. 603107010, Permit Nos. 13-POY-205, 603107010-F01 Page 21 of 49 Table 6A. Vehicle Traffic - Unpaved Roads at the Mines Emissions calculations are based on AP-42 Section 13.2.2: Unpaved Roads EF = Where: k(s/12)a(W/3)b * [(365 - P)/365] Particulate emission factor, lb/VMT Haul Overburden Truck Loader Truck Water Truck k (PM 2.5) = k (PM 10) = k (PM 30) = a= a= b= s= 0.15 1.5 4.9 0.9 0.7 0.45 4.8 0.15 1.5 4.9 0.9 0.7 0.45 4.8 0.15 1.5 4.9 0.9 0.7 0.45 4.8 0.15 1.5 4.9 0.9 0.7 0.45 4.8 W= P= 27.5 115 36 115 40 115 30 115 Uncontrolled Emission Factors, lb/VMT Pollutant Haul Truck Loader Overburden Truck Water Truck PM2.5 PM10 0.12 1.2 0.138 1.38 0.14 1.4 0.13 1.3 PM30 4.8 5.4 5.7 5.0 Mine Production Capacity = Overburden Removal = 6,000,000 2,628,000 tons/year tons/year Vehicle Miles Traveled Per Year Sand Truck Loader Overburden Truck Water Truck Tons/trip 40 7.0 40 Trips/year 150,000 1,232,571 65,700 250 Distance/trip (mi) 0.75 0.01 0.30 0.75 VMT/year 112,500 12,326 19,909 188 Uncontrolled Emissions: constant for PM-2.5, lb/VMT constant for PM-10, lb/VMT constant for PM-30, lb/VMT for PM10 and PM2.5 for PM 30 surface material silt content, % (from AP-42 Table 13.2.2.1) Mean weight of vehicles, tons (AP-42 Figure 13.2.1.2) Preliminary Determination, FID No. 603107010, Permit Nos. 13-POY-205, 603107010-F01 PM 2.5 Page 22 of 49 PM 10 PM 30 lb/hr ton/yr lb/hr ton/yr lb/hr ton/yr Sand Truck Loader Overburden Truck Water Truck 1.6 0.19 0.33 0.003 6.9 0.85 1.4 0.012 16 1.9 3.3 0.03 69 8.5 14 0.12 62 7.6 13 0.11 269 33 56 0.47 Total: 2.1 9.2 20.9 91.7 82.1 360 Control Eff. = 75% Other Vehicles 50% Controlled Emissions: PM 2.5 PM 10 Water Truck PM 30 lb/hr ton/yr lb/hr ton/yr lb/hr ton/yr Sand Truck Loader Overburden Truck Water Truck 0.39 0.048 0.082 0.0014 1.72 0.212 0.36 0.0060 3.9 0.48 0.82 0.014 17.2 2.12 3.6 0.060 15.4 1.90 3.2 0.053 67 8.3 14.1 0.23 Total: 0.52 2.29 5.2 22.9 20.6 90.0 Preliminary Determination, FID No. 603107010, Permit Nos. 13-POY-205, 603107010-F01 Page 23 of 49 Table 6B. Unpaved Roads - Wash Plant UNPAVED ROADS: Emissions calculations are based on AP-42 Section 13.2.2 EF = k(s/12)a(W/3)b * [(365 - P)/365] in lb/VMT Where: Loader Water Truck Haul Truck k (PM 2.5) = k (PM 10) = k (PM 30) = a= a= b= s= 0.15 1.5 4.9 0.9 0.7 0.45 4.8 0.15 1.5 4.9 0.9 0.7 0.45 4.8 0.15 1.5 4.9 0.9 0.7 0.45 4.8 W= P= 36 115 30 115 27.5 115 constant for PM-2.5, lb/VMT constant for PM-10, lb/VMT constant for PM-30, lb/VMT for PM10 and PM2.5 for PM 30 surface material silt content, % (from AP-42 Table 13.2.2.1) Mean weight of vehicles, tons (AP-42 Figure 13.2.1.2) Uncontrolled Emission Factors, lb/VMT Pollutant Loader Water Truck Haul Truck PM2.5 0.138 0.127 0.122 PM10 1.38 1.27 1.22 PM30 5.4 5.0 4.8 Production = Vehicle Miles Traveled Per Year Loader Water Truck Haul Truck 280,320 Tons/trip 7.0 Trips/year 1,001,143 250 0.01 0.10 0.10 10,011 25 28,032 Distance/trip (mi) VMT/year 7,008,000 tons/year 25.0 (Water Truck = 365 - P) Uncontrolled Emissions: PM 2.5 PM 10 PM 30 Preliminary Determination, FID No. 603107010, Permit Nos. 13-POY-205, 603107010-F01 lb/hr ton/yr lb/hr ton/yr lb/hr ton/yr Water Truck 0.0004 0.002 0.004 0.016 0.014 0.062 Haul Truck 0.39 1.71 3.91 17.1 15.3 67.1 Loader 0.16 0.69 1.57 6.9 6.2 27.1 Total: 0.55 2.40 5.48 24.0 21.5 94.3 Control Eff. = Controlled Emissions: PM 2.5 75% 50% Loader, Haul Truck Water Truck PM 10 PM 30 lb/hr ton/yr lb/hr ton/yr lb/hr ton/yr 0.00018 0.00079 0.0018 0.0079 0.0071 0.031 Haul Truck 0.10 0.428 0.98 4.3 3.8 16.8 Loader 0.039 0.17 0.39 1.7 1.5 6.8 Total: 0.14 0.60 1.4 6.0 5.4 23.6 Water Truck . Page 24 of 49 Preliminary Determination, FID No. 603107010, Permit Nos. 13-POY-205, 603107010-F01 Page 25 of 49 Table 6B. Paved Roads - Wash Plant PAVED ROADS: Emissions calculations are based on AP-42 Section 13.2.1 EF = k (sL)0.91(W)1.02 Particulate emission factor, lb/VMT Where: k (PM 2.5) = k (PM 10) = k (PM 30) = SL = 0.00054 0.0022 0.011 8.2 0.00054 0.0022 0.011 8.2 constant for PM 2.5, lb/VMT constant for PM 10, lb/VMT constant for PM 30, lb/VMT silt loading (AP-42 Table 13.2.1-3)(g/m2) The average silt loading value for industrial roads at quarries is used. Silt loading at fac sand facilities will be low because frac sand grains are not easily crushed to generate silt. Haul Truck Water Truck 27.5 30 W= Mean weight of vehicles, tons Uncontrolled Emission Factors, lb/VMT Pollutant Haul Truck Water Truck PM2.5 0.11 0.12 PM10 0.44 0.48 PM30 2.2 2.4 Production = Vehicle Miles Traveled Per Year Haul Truck Tons/trip Trips/year 280,320 250 0.60 0.60 168,192 150 VMT/year tons/year Water Truck 25.0 Distance/trip (mi) 7,008,000 (Water Truck = 365 - P) Uncontrolled Emissions: PM 2.5 PM 10 PM 30 Preliminary Determination, FID No. 603107010, Permit Nos. 13-POY-205, 603107010-F01 Page 26 of 49 lb/hr ton/yr lb/hr ton/yr lb/hr Water Truck 0.0020 0.009 0.008 0.036 0.041 0.18 Haul Truck 2.1 9.1 8.4 36.9 42.1 184.4 Total: 2.1 9.1 8.4 36.9 42.2 184.6 Control Efficiency = 90% Haul Truck 50% Water Truck Controlled Emissions: PM 2.5 PM 10 ton/yr PM 30 lb/hr ton/yr lb/hr ton/yr lb/hr ton/yr Water Truck 0.00101 0.0044 0.0041 0.018 0.021 0.090 Haul Truck 0.21 0.91 0.84 3.7 4.2 18.4 Total: 0.21 0.91 0.85 3.7 4.2 18.5 Total Annual Uncontrolled Emissions due to paved and unpaved roads in wet plant: PM (=PM30): 94.3 + 184.6 tons/yr = 278.9 tons/yr PM10: 24.0 + 36.9 tons/yr = 60.9 tons/yr PM10: 2.4 + 9.1 tons/yr = 12.5 tons/yr Total Annual Controlled Emissions due to paved and unpaved roads in wet plant: PM (=PM30): 23.6 + 18.5 tons/yr = 42.1 tons/yr PM10: 6.0. + 3.7 tons/yr = 9.7 tons/yr PM10: 0.6 + 0.91 tons/yr = 1.51 tons/yr Preliminary Determination, FID No. 603107010, Permit Nos. 13-POY-205, 603107010-F01 Page 27 of 49 Table 6C. Unpaved Roads - Dry Plant UNPAVED ROADS: Emissions calculations are based on AP-42 Section 13.2.2 EF = k(s/12)a(W/3)b * [(365 - P)/365] in lb/VMT Where: Loader Water Truck k (PM 2.5) = k (PM 10) = k (PM 30) = a= a= b= s= 0.15 1.5 4.9 0.9 0.7 0.45 4.8 0.15 1.5 4.9 0.9 0.7 0.45 4.8 W= P= 36 115 30 115 constant for PM-2.5, lb/VMT constant for PM-10, lb/VMT constant for PM-30, lb/VMT for PM10 and PM2.5 for PM 30 surface material silt content, % (from AP-42 Table 13.2.2.1) Mean weight of vehicles, tons (AP-42 Figure 13.2.1.2) Uncontrolled Emission Factors, lb/VMT Pollutant Loader Water Truck PM2.5 0.138 0.127 PM10 1.38 1.27 PM30 5.4 5.0 Production = Vehicle Miles Traveled Per Year Loader Water Truck Tons/trip 7.0 Trips/year 500,571 250 Distance/trip (mi) 0.01 0.10 VMT/year 5,006 25 Uncontrolled Emissions: 3,504,000 tons/year Preliminary Determination, FID No. 603107010, Permit Nos. 13-POY-205, 603107010-F01 PM 2.5 Water Truck Page 28 of 49 PM 10 PM 30 lb/hr ton/yr lb/hr ton/yr lb/hr ton/yr 0.0004 0.002 0.004 0.016 0.014 0.062 Loader 0.08 0.34 0.79 3.4 3.1 13.5 Total: 0.08 0.35 0.79 3.5 3.1 13.6 Control Efficiency = 75% 50% Loader Water Truck Controlled Emissions: PM 2.5 Water Truck PM 10 PM 30 lb/hr ton/yr lb/hr ton/yr lb/hr ton/yr 0.00018 0.00079 0.0018 0.0079 0.0071 0.031 Loader 0.020 0.086 0.20 0.86 0.77 3.4 Total: 0.020 0.087 0.20 0.87 0.78 3.4 Preliminary Determination, FID No. 603107010, Permit Nos. 13-POY-205, 603107010-F01 Page 29 of 49 Table 6C. Paved Roads - Dry Plant PAVED ROADS: Emissions calculations are based on AP-42 Section 13.2.1 EF = k (sL)0.91(W)1.02 Particulate emission factor, lb/VMT Where: k (PM 2.5) = k (PM 10) = k (PM 30) = SL = 0.00054 0.0022 0.011 8.2 0.00054 0.0022 0.011 8.2 constant for PM 2.5, lb/VMT constant for PM 10, lb/VMT constant for PM 30, lb/VMT silt loading (AP-42 Table 13.2.1-3)(g/m2) The average silt loading value for industrial roads at quarries is used. Silt loading at fac sand facilities will be low because frac sand grains are not easily crushed to generate silt. Haul Truck Water Truck 27.5 30 W= Mean weight of vehicles, tons Uncontrolled Emission Factors, lb/VMT Pollutant Haul Truck Water Truck PM2.5 0.11 0.12 PM10 0.44 0.48 PM30 2.2 2.40 Production = Vehicle Miles Traveled Per Year Haul Truck 25 Trips/year 140,160 250 0.50 0.50 70,080 125 VMT/year tons/year Water Truck Tons/trip Distance/trip (mi) 3,504,000 Uncontrolled Emissions: PM 2.5 PM 10 PM 30 Preliminary Determination, FID No. 603107010, Permit Nos. 13-POY-205, 603107010-F01 Page 30 of 49 lb/hr ton/yr lb/hr ton/yr lb/hr ton/yr Water Truck 0.0017 0.007 0.007 0.030 0.034 0.15 Haul Truck 0.86 3.8 3.5 15.4 17.5 76.9 Total: 0.86 3.8 3.5 15.4 17.6 77.0 Control Efficiency = 90% 50% Controlled Emissions: PM 2.5 Haul Truck Water Truck PM 10 PM 30 lb/hr ton/yr lb/hr ton/yr lb/hr ton/yr Water Truck 0.0008 0.004 0.003 0.015 0.017 0.07 Haul Truck 0.086 0.38 0.35 1.5 1.8 7.7 Total: 0.087 0.38 0.35 1.6 1.8 7.8 Total Annual Uncontrolled Emissions due to paved and unpaved roads in dry plant: PM (=PM30): 13.6 + 77.0 tons/yr = 90.6 tons/yr PM10: 3.5 + 15.4 tons/yr = 18.9 tons/yr PM2.5: 0.35 + 3.8 tons/yr = 4.15 tons/yr Total Annual Controlled Emissions due to paved and unpaved roads in dry plant: PM (=PM30): 3.4 + 7.8 tons/yr = 11.2 tons/yr PM10: 0.87 + 1.6 tons/yr = 2.47 tons/yr PM2.5: 0.087 + 0.38 tons/yr = 0.47 tons/yr Preliminary Determination, FID No. 603107010, Permit Nos. 13-POY-205, 603107010-F01 Page 31 of 49 Table 7. Potential Plant Emissions with Existing Facility, Plant #2, and Mines Chieftain Sand Emissions Summary PTE Emission Rates, ton/year Unit ID Device Type P01 P02 P03 P04 P05 P11 P12 P13 P14 Process Process Process Process Process Process Process Process Process F01A F01B F01C F02 F05 F06 F07 F08 F09 F10 F11 Device Description PM PM10 PM2.5 CO NOx SO2 VOC #1 Fluid Bed Dryer #1 Screening Tower Baghouse Three Storage Silos Rail/Truck Loadout Station Space Heaters #2 Industrial Sand Dryer #2 Screening Tower Baghouse Three Storage Silos Rail/Truck Loadout Station 12.2 7.9 0.056 0.19 0.67 15.3 9.6 0.056 0.19 12.2 7.9 0.056 0.19 0.67 14.0 8.8 0.056 0.19 6.0 4.7 0.056 0.19 0.67 11.0 7.4 0.056 0.19 26.3 ---7.2 17.5 ---- 29.8 ---12.4 38.1 ---- 0.10 ---0.015 0.13 ---- 0.94 ---0.77 1.2 ---- Fugitive Fugitive Fugitive Fugitive Fugitive Fugitive Fugitive Fugitive Fugitive Fugitive Vehicle Traffic at Mine - Controlled Vehicle Traffic at Wash Plant - Controlled Vehicle Traffic at Dry Plant - Controlled Stockpiles - Wind Erosion Crusher (Wet Plant) Screen (Wet Plant) Up to 15 Conveyors Stackers, Hoppers and Transloads Grizzly at the Dry Plant Blasting 90.0 42.1 11.1 3.8 4.2 7.7 7.4 16.3 2.1 1.8 22.9 9.7 2.4 1.8 1.9 2.6 2.4 7.7 0.95 0.95 2.3 1.5 0.47 0.27 0.35 0.18 0.68 1.2 0.26 0.055 --------- --------- --------- --------- 45.2 11.5 1.4 -- Fugitive Removal of Overburden 2.8 0.37 0.052 -- -- -- -- 232.8 97.4 37.4 96.2 91.8 1.6 2.9 -- 100 -- 100 100 100 100 Facility Totals = Title V Major Source Thresholds = Preliminary Determination, FID No. 603107010, Permit Nos. 13-POY-205, 603107010-F01 Page 32 of 49 WISCONSIN HAZARDOUS AIR POLLUTANT (NR 445) REVIEW The fuel used for combustion in the dryers is virgin fossil fuels. The hazardous air pollutants emitted due to the combustion of these virgin fossil fuels are exempt from the emission limitations and standards in NR 445. The emissions of FHAP can be calculated based on the emission factors in AP-42, Table 1.4-3. The sum of emission factors for individual HAP is 1.882 pounds per million cubic feet. The one FHAP with the highest emission factor is hexane, and the emission factor is 1.8 pounds per million cubic feet. The maximum heat input for both dryers combined will be (40 + 50) million BTU/hr = 90 million BTU/hr. The facility will also have 20 million BTU per hour heat input of space heating. So total heat input at the facility will be 110 million BTU/hr. At 1020 million BTU per million cubic feet of natural gas burned, the maximum natural gas burned will be 0.11 million cubic feet/hr. Thus, the emissions of any single HAP will be no more than 1.8 #/million cubic feet * 0.11 million cubic feet/hr = 0.198 pound per hour The annual maximum theoretical emission (MTE) of any single FHAP will be 0.198 #/hr * 8760 hr/yr / 2000 #/ton = 0.87 ton/yr The emissions of all FHAP combined from the facility will be no more than 1.882 #/million cubic feet * 0.11 million cubic feet/hr = 0.21 pound per hour The annual maximum theoretical emission (MTE) of all FHAP combined will be 0.21 #/hr * 8760 hr/yr / 2000 #/ton = 0.98 ton/yr As such, the MTE and the potential to emit (PTE) for any single FHAP will be less than 10 tons per year. The total MTE and PTE of all FHAP combined will be less than 25 tons per year. The facility is a true minor source of FHAP. The mined and processed sand is silica, and it is not a hazardous air pollutant regulated under the federal Clean Air Act. It is not regulated under the state hazardous air pollutant regulation under NR 445. COMPLIANCE AND TECHNOLOGY REVIEW Particulate matter will be emitted from the sand dryer, and the screening, conveying and elevator operations inside the dry plant building. These emissions will be controlled using fabric filter baghouses. The new dryer will be a rotary dryer and will have a capacity of 200 tons per hour. It will use natural gas as fuel, at a heat input capacity of 50 mmBtu per hour. Particulate matter (PM) emissions will be controlled by a baghouse. The particulate matter emissions from the sand dryer (P11, S11) will be subject to New Source Performance Standard (NSPS) in 40 CFR Part 60, Subpart UUU (s. NR 440.73, Wis. Preliminary Determination, FID No. 603107010, Permit Nos. 13-POY-205, 603107010-F01 Page 33 of 49 Adm. Code) for Calciners and Dryers in non-metallic mineral industries. The NSPS PM emission limit is 0.025 gr/dscf, and the limit is only for filterable particulates with a compliance stack test method of Method 5. The company proposed a PM emission limit of 3.5 pounds per hour from the dryer stack. The company also requested a PM10 limit of 3.2 #/hr, and a PM2.5 emission limit on the dryer as 2.5 pounds per hour. The new dryer is a rotary dryer. As such the rotary dryer is not required under NSPS to have opacity compliance monitoring. The company has proposed to have a certified opacity reader to measure and record the opacity of the new dryer stack exhaust on a daily basis using Method 9. This would have complied with the NSPS compliance monitoring requirement if the new dryer would have been a fluid bed dryer. The company has requested a particulate matter emission limit for the new dryer that is higher than the outlet baghouse loading obtained during a test for the existing dryer. This will provide a margin of error such that the emission limit can be complied with during the compliance test. The new dry plant building will result in PM emissions and will be controlled by a baghouse. The particulate matter emissions from the dry plant (P12, S12) will be subject to New Source Performance Standard (NSPS) in 40 CFR Part 60, Subpart OOO (s. NR 440.688, Wis. Adm. Code) for non-metallic mineral processing. The NSPS PM emission limit is 0.014 gr/dscf, and the limit is only for filterable particulates with a compliance stack test method of Method 5. The company proposed a PM emission limit of 2.2 pounds per hour from the P12 dry plant building stack. The company also requested a PM10 limit of 2.0 #/hr, and a PM2.5 emission limit on the dryer as 1.7 pound per hour. NSPS in Part 60 Subpart OOO requires quarterly Method 22 reading of the stack emission. The company will comply with that requirement. AIR QUALITY REVIEW The maximum impact from the dispersion modeling analysis includes the modeled impact of the sources plus a background concentration. The background concentration represents the contribution to overall air quality to those sources not explicitly modeled, including but not limited to fugitive emissions, nearby small sources and distant large sources, and other natural contributions. The background concentration is a conservative estimate of the impact of sources not explicitly modeled. In the real-world the background concentration can be less than the value listed in the dispersion modeling analysis. The modeled impact of the facility is a spatially and temporally coherent sum of the impact of each individually modeled source. It does not represent the overall maximum impact from each individual source added together. Therefore the modeled impact of the facility varies around the facility due to the different contributions from each source. Further, the modeled impact of the facility varies around the facility for each and every hour of the year due to the changing meteorological conditions. Fugitive dust sources do not have defined stack parameters and the generation of emission varies for each hour due to meteorological conditions, making it very unrepresentative to analyze the impact using a standard dispersion model. Assuming that a small amount of fugitive dust emissions vent into a large volume would produce a negligible modeling impact and is no more accurate than assuming a large amount of emission in a small volume. In the real-world fugitive dust emissions are higher during windy conditions – the exact opposite of when a stack based source has highest impact. Preliminary Determination, FID No. 603107010, Permit Nos. 13-POY-205, 603107010-F01 Page 34 of 49 Considering these factors (background concentration, spatial variation of concentration, temporal variation of concentration, uncertain emission characterization, opposing conditions leading to impact), the Department addresses fugitive dust (PM10) in permits by requiring the facility to reduce and control emissions. Performing explicit modeling for fugitive dust emissions is unrepresentative of the real-world impact. J.R. Sims has performed the ambient air quality review for this project. The following are his analysis, finding and conclusion. A. INTRODUCTION This dispersion analysis for a Title V, Research and Testing Exemption compares model results to National Ambient Air Quality Standards (NAAQS) for criteria pollutants. The facility has a physical location of: UTM, NAD 83, Zone 15, 610228E, 5012335N, Town of Dovre, Barron County, Wisconsin. PSD baselines HAVE NOT been set in Barron County. B. MODELING ANALYSIS I) General Conditions 1. Tom Henning, consultant for Chieftain Sand, supplied and Paul Yeung verified the emission parameters used in this analysis. Building dimensions were provided by SEH. Building Profile Input Program for PRIME (BPIPPrime) was used in this analysis to correctly account for the concepts and procedures expressed in the Good Engineering Practice technical support document as well as other related references. Measurements were compared with scaled aerial photographs for accuracy and appropriateness. 2. Five years (2006-2010) of preprocessed meteorological data was used in this analysis. The surface data was collected in Marshfield and the upper air meteorological data originated in Green Bay. 3. The American Meteorological Society/Environmental Protection Agency Regulatory Model Improvement Committee (AERMIC) steady-state plume model (AERMOD v 14134) was used in this analysis. The model used rural dispersion coefficients with regulatory and non-regulatory default options. These options allow for missing and calm wind correction, buoyancy induced dispersion, building downwash, recirculation cavity effects and internal computing of Ozone limiting values. 4. All sources vent vertically and without obstruction except as noted elsewhere within this document. II) Specific Conditions 5. The receptors used in this analysis consisted of a grid conforming to the physical layout of the building and grounds about the facility (8023 receptors) with 25-meter resolution near the facility and extending some 1,250 meters from a point identified as (0,0) of the Cartesian axis on which this facility was placed via supplied plot plans. Points within known fences or on top of buildings were not considered. Terrain is a factor in the area, so receptor elevations were considered via application of the AERMOD terrain processor (AERMAP) with USGS National Elevation Dataset (NED) tiles. Preliminary Determination, FID No. 603107010, Permit Nos. 13-POY-205, 603107010-F01 Page 35 of 49 MODEL RESULTS (All concentrations are reported in µg/m3 ) C. SIL ANALYSIS SIL Comparison Analysis Results (All concentrations are reported in µg/m3 ) PM10 24 hour PM2.5 24 hour PM2.5 Annual CO 1 hour CO 8 hour NO2 Annual SO2 3 hour SO2 24 hour SO2 Annual Comparative Results 21 9.3 1.9 95 52 3 0 0 0 Sig. Impact Level 5 1.2 0.3 2000 500 1 25 5 1 D. SIL CONCLUSION As shown in Section C above, the results of the modeling analysis demonstrate that the Significant Impact Level (SIL) will be satisfied for CO and SO2. SIL will be exceeded for PM10, PM2.5 and NO2. E. NAAQS ANALYSIS NAAQS Analysis NO2 Annual PM10 24 hour PM2.5 24 hour PM2.5 Annual Facility Impact 2.5 16.1 9.3 2.0 Background 8.0 29.4 25.6 8.7 Total 10.5 45.5 34.9 10.7 NAAQS 100 150 35 15 % NAAQS 11 30 99.7 71 NOX → NO2 conversion via Tier I F. NAAQS CONCLUSION The results of the modeling analysis demonstrate that ALL applicable air quality standards will be satisfied assuming the emissions rates, stack parameters and all other restrictions listed in this document. G. RECOMMENDATION The result of the modeling analysis recommends allowing the permit application to move forward through the approval process assuming the emissions rates, stack parameters and all other restrictions listed in this document. Stack Parameters ID Release Type Description LOCATION UTM NAD83 Zone 15 EMISSION RATES Pounds per Hour Preliminary Determination, FID No. 603107010, Permit Nos. 13-POY-205, 603107010-F01 S01 S02 S03A S03B S03C S04 S11 S12 S13A S13B S13C S14 DEFAULT DEFAULT DEFAULT DEFAULT DEFAULT DEFAULT DEFAULT DEFAULT DEFAULT DEFAULT DEFAULT DEFAULT Dryer Screening Tower SS #1 SS 2 SS 3 Loadout Dryer 2 Screen Plant SS 4 SS 5 SS 6 Loadout X 609654.1 609651.2 609688.6 609697.3 609705.9 609732.8 609643.1 609644.4 609686.5 609695.1 609678 609733.8 Page 36 of 49 Y 5012358 5012369 5012333 5012323 5012313 5012332 5012369 5012362 5012313 5012302 5012324 5012333 Z 332.38 332.4 332.27 332.32 332.26 332.21 332.38 332.38 332.32 332.26 332.27 332.21 NOX CO SO2 PM10 PM2.5 6.80 8.7 9.60 18.4 0.32 0.32 0.00 0.00 0.00 0.00 0.00 0.00 0.00 0.00 0.00 0.00 2.8 1.8 0.013 0.013 0.013 0.043 3.2 2 0.013 0.013 0.013 0.043 1.36 1.07 0.013 0.013 0.013 0.043 2.5 1.7 0.013 0.013 0.013 0.043 Preliminary Determination, FID No. 603107010, Permit Nos. 13-POY-205, 603107010-F01 ID Page 37 of 49 PHYSICALS Actual Height (ft) S01 S02 S03A S03B S03C S04 S11 S12 S13A S13B S13C S14 Temp Vel (F) (fps) 170.0 63.5 68.0 49.5 Ambient obstructed Ambient obstructed Ambient obstructed 85 85 88 88 88 30 50.0 59.0 90 140.0 86.2 90 75.0 70.7 88 Ambient obstructed 88 Ambient obstructed 88 Ambient obstructed 30 50.0 59.0 Flow (acfm) Dia (ft) 45500 28253 obstructed obstructed obstructed 1000 65000 30000 Obstructed Obstructed Obstructed 1000 3.9 3.5 1.0 1.0 1.0 0.6 4.0 3.0 1.0 1.0 1.0 0.6 EMISSIONS FROM NEW EQUIPMENT OR MODIFICATION Stack Emissions EMISSIONS FROM EXISTING EQUIPMENT Stack Emissions Stack S01 - Criteria Pollutants Emissions (Stack Height - 85 ft.). Maximum Theoretical Emissions (MTE) Pollutant Pounds per hour Tons per year PM/PM10/PM2.5 400 1752 SO2 0.024 0.1 NOx 6.8 29.8 CO 9.6 42.0 VOC 0.22 0.94 CO2 4706 20612 Stack S01 - Criteria Pollutants Emissions (Stack Height – 85 feet). Pollutant PM/PM10 PM2.5 SO2 NOx Potential to Emit (PTE) Pounds per hour Tons per year 2.8 1.36 0.024 6.8 12.26 5.96 0.1 29.8 Preliminary Determination, FID No. 603107010, Permit Nos. 13-POY-205, 603107010-F01 CO CO2 VOC 6.0 4706 0.22 Page 38 of 49 26.28 20612 0.94 Stack S02 - Criteria Pollutants Emissions (Stack Height - 85 feet) Maximum Theoretical Emissions (MTE) Pollutant Pounds per hour Tons per year PM/PM10/PM2.5 360 1577 Stack S02 - Criteria Pollutants Emissions (Stack Height – 85 feet). Pollutant PM/PM10 PM2.5 Potential to Emit (PTE) Pounds per hour Tons per year 1.8 1.07 7.88 4.7 Stack S03A - Criteria Pollutants Emissions (Stack Height - 88 ft.) Maximum Theoretical Emissions (MTE) Pollutant Pounds per hour Tons per year PM 0.6 2.63 PM10/PM2.5 0.22 0.96 Stack S03A - Criteria Pollutants Emissions (Stack Height – 88 feet). Pollutant PM/PM10/PM2.5 Potential to Emit (PTE) Pounds per hour Tons per year 0.013 0.06 Stack S03B - Criteria Pollutants Emissions (Stack Height - 88 ft.) Maximum Theoretical Emissions (MTE) Pollutant Pounds per hour Tons per year PM 0.6 2.63 PM10/PM2.5 0.22 0.96 Stack S03B - Criteria Pollutants Emissions (Stack Height – 88 feet). Pollutant PM/PM10/PM2.5 Potential to Emit (PTE) Pounds per hour Tons per year 0.013 0.06 Stack S03C - Criteria Pollutants Emissions (Stack Height - 88 ft.) Maximum Theoretical Emissions (MTE) Pollutant Pounds per hour Tons per year PM 0.6 2.63 PM10/PM2.5 0.22 0.96 Stack S03C - Criteria Pollutants Emissions (Stack Height – 88 feet). Pollutant PM/PM10/PM2.5 Potential to Emit (PTE) Pounds per hour Tons per year 0.013 0.06 Preliminary Determination, FID No. 603107010, Permit Nos. 13-POY-205, 603107010-F01 Page 39 of 49 Stack S04 - Criteria Pollutants Emissions (Stack Height - 30 ft.) Maximum Theoretical Emissions (MTE) Pollutant Pounds per hour Tons per year PM 4.0 17.52 PM10/PM2.5 0.48 2.1 Stack S04 - Criteria Pollutants Emissions (Stack Height – 30 feet). Pollutant PM/PM10/PM2.5 Potential to Emit (PTE) Pounds per hour Tons per year 0.043 0.19 Stack S11 - Criteria Pollutants Emissions (Stack Height - 90 ft.). Maximum Theoretical Emissions (MTE) Pollutant Pounds per hour Tons per year PM/PM10/PM2.5 400 1752 SO2 0.03 0.13 NOx 8.7 38.11 CO 18.4 80.59 VOC 0.27 1.18 CO2 5882 25763 Stack S11 - Criteria Pollutants Emissions (Stack Height – 90 feet). Pollutant PM PM10 PM2.5 SO2 NOx CO CO2 VOC Potential to Emit (PTE) Pounds per hour Tons per year 3.5 3.2 2.5 0.029 8.7 4.0 5882 0.27 15.33 14.02 10.95 0.13 38.11 17.52 25763 1.18 Stack S12 - Criteria Pollutants Emissions (Stack Height - 90 feet) Maximum Theoretical Emissions (MTE) Pollutant Pounds per hour Tons per year PM/PM10/PM2.5 440 1729 Stack S12 - Criteria Pollutants Emissions (Stack Height – 90 feet). Pollutant PM PM10 PM2.5 Potential to Emit (PTE) Pounds per hour Tons per year 2.2 2.0 1.7 9.64 8.76 7.45 Stack S13A - Criteria Pollutants Emissions (Stack Height - 88 ft.) Maximum Theoretical Emissions (MTE) Pollutant Pounds per hour Tons per year PM 0.6 2.63 PM10/PM2.5 0.22 0.96 Stack S13A - Criteria Pollutants Emissions (Stack Height – 88 feet). Pollutant PM/PM10/PM2.5 Potential to Emit (PTE) Pounds per hour Tons per year 0.013 0.06 Preliminary Determination, FID No. 603107010, Permit Nos. 13-POY-205, 603107010-F01 Page 40 of 49 Stack S13B - Criteria Pollutants Emissions (Stack Height - 88 ft.) Maximum Theoretical Emissions (MTE) Pollutant Pounds per hour Tons per year PM 0.6 2.63 PM10/PM2.5 0.22 0.96 Stack S13B - Criteria Pollutants Emissions (Stack Height – 88 feet). Pollutant PM/PM10/PM2.5 Potential to Emit (PTE) Pounds per hour Tons per year 0.013 0.06 Stack S13C - Criteria Pollutants Emissions (Stack Height - 88 ft.) Maximum Theoretical Emissions (MTE) Pollutant Pounds per hour Tons per year PM 0.6 2.63 PM10/PM2.5 0.22 0.96 Stack S13C - Criteria Pollutants Emissions (Stack Height – 88 feet). Pollutant PM/PM10/PM2.5 Potential to Emit (PTE) Pounds per hour Tons per year 0.013 0.06 Stack S14 - Criteria Pollutants Emissions (Stack Height - 30 ft.) Maximum Theoretical Emissions (MTE) Pollutant Pounds per hour Tons per year PM 4.0 17.52 PM10/PM2.5 0.48 2.1 Stack S14 - Criteria Pollutants Emissions (Stack Height – 30 feet). Pollutant PM/PM10/PM2.5 Potential to Emit (PTE) Pounds per hour Tons per year 0.043 0.19 Facility non-stack emissions F01A - Vehicle Traffic at Mines Criteria Pollutants Emissions Maximum Theoretical Emissions (MTE) Pollutant Pounds per hour Tons per year PM 157.0 360 PM10 40.0 91.7 PM2.5 4.0 9.17 F01A – Vehicle Traffic at Mines Criteria Pollutants Emissions Pollutant Potential to Emit (PTE) Pounds per hour Tons per year PM 90.0 PM10 22.9 PM2.5 2.29 F01B -Vehicle Traffic at Wet Plant Criteria Pollutants Emissions Pollutant Maximum Theoretical Emissions (MTE) Pounds per hour Tons per year PM 278.9 Preliminary Determination, FID No. 603107010, Permit Nos. 13-POY-205, 603107010-F01 PM10 PM2.5 Page 41 of 49 - 60.9 12.5 F01B -Vehicle Traffic at Wet Plant Criteria Pollutants Emissions Pollutant Potential to Emit (PTE) Pounds per hour Tons per year PM 42.1 PM10 9.7 PM2.5 1.51 F01C – Vehicle Traffic at Dry Plant Criteria Pollutants Emissions Pollutant Maximum Theoretical Emissions (MTE) Pounds per hour Tons per year PM 90.6 PM10 18.9 PM2.5 4.15 F01C – Vehicle Traffic at Dry Plant Criteria Pollutants Emissions Pollutant Potential to Emit (PTE) Pounds per hour Tons per year PM 11.2 PM10 2.47 PM2.5 0.47 F02 – Storage Piles Criteria Pollutants Emissions Pollutant PM PM10 PM2.5 Maximum Theoretical Emissions (MTE) Pounds per hour Tons per year 3.8 1.8 0.27 F02 – Storage Piles Criteria Pollutants Emissions Pollutant PM PM10 PM2.5 Potential to Emit (PTE) Pounds per hour Tons per year 3.8 1.8 0.27 F05 – Crusher Criteria Pollutants Emissions Pollutant PM PM10 PM2.5 F05 – Crusher Criteria Pollutants Emissions Pollutant PM PM10 PM2.5 Maximum Theoretical Emissions (MTE) Pounds per hour Tons per year 0.96 4.2 0.43 1.9 0.08 0.35 Potential to Emit (PTE) Pounds per hour Tons per year 0.96 4.2 0.43 1.9 0.08 0.35 F06 – Screen at Wet Plant Criteria Pollutants Emissions Maximum Theoretical Emissions (MTE) Pollutant Pounds per hour Tons per year PM 1.8 7.7 Preliminary Determination, FID No. 603107010, Permit Nos. 13-POY-205, 603107010-F01 PM10 PM2.5 0.59 0.04 Page 42 of 49 2.6 0.18 F06 – Screen at Wet Plant Criteria Pollutants Emissions Pollutant PM PM10 PM2.5 Potential to Emit (PTE) Pounds per hour Tons per year 1.8 7.7 0.59 2.6 0.04 0.18 F07 –Up to 15 Conveyors Criteria Pollutants Emissions Maximum Theoretical Emissions (MTE) Pollutant Pounds per hour Tons per year PM 1.7 7.4 PM10 0.55 2.4 PM2.5 0.21 0.91 F07 –Up to 15 Conveyors Criteria Pollutants Emissions Pollutant PM PM10 PM2.5 Potential to Emit (PTE) Pounds per hour Tons per year 2.2 9.8 0.74 3.2 0.21 0.91 F08 - Stackers, Hoppers and Tranloads Criteria Pollutants Emissions Maximum Theoretical Emissions (MTE) Pollutant Pounds per hour Tons per year PM 5.7 24.97 PM10 2.7 11.83 PM2.5 0.41 1.2 F08 - Stackers, Hoppers and Tranloads Criteria Pollutants Emissions Potential to Emit (PTE) Pollutant Pounds per hour Tons per year PM 5.7 16.3 PM10 2.7 7.7 PM2.5 0.41 1.1 F09 –Grissly Feeder at Dry Plant Criteria Pollutants Emissions Maximum Theoretical Emissions (MTE) Pollutant Pounds per hour Tons per year PM 0.72 2.1 PM10 0.32 0.95 PM2.5 0.06 0.26 F09 –Grissly Feeder at Dry Plant Criteria Pollutants Emissions Potential to Emit (PTE) Pollutant Pounds per hour Tons per year PM 0.72 2.1 PM10 0.32 0.95 PM2.5 0.06 0.26 Preliminary Determination, FID No. 603107010, Permit Nos. 13-POY-205, 603107010-F01 Page 43 of 49 F10 - Criteria Pollutants Emissions (Blasting) Maximum Theoretical Emissions (MTE) Pounds per hour Tons per year 3.6 1.9 0.11 2.8 23.0 90.4 506 Pollutant PM PM10 PM2.5 SO2 NOx CO CO2 F10 - Criteria Pollutants Emissions (Blasting) Pollutant PM PM10 PM2.5 SO2 NOx CO CO2 Potential to Emit (PTE) Pounds per hour Tons per year 1.8 0.95 0.055 1.4 11.5 45.2 253 F11 –Overburden Removal Criteria Pollutants Emissions Maximum Theoretical Emissions (MTE) Pollutant Pounds per hour Tons per year PM 8.2 PM10 1.2 PM2.5 0.15 F11 –Overburden Removal Criteria Pollutants Emissions Pollutant PM PM10 PM2.5 Potential to Emit (PTE) Pounds per hour Tons per year 2.8 0.4 0.052 Total Facility Emissions Pollutant Potential Annual Emissions (Ton/yr) PSD Threshold (Ton/yr) Title V Threshold (Ton/yr) Carbon Monoxide 96.2 250 100 Nitrogen Oxides 91.8 250 100 Volatile Organic Compounds 2.9 250 100 Carbon Dioxide 58,596 N/A N/A Sulfur Dioxide 1.6 250 100 Preliminary Determination, FID No. 603107010, Permit Nos. 13-POY-205, 603107010-F01 Page 44 of 49 Particulate Matter 232.8 250 - PM10 97.4 250 100 PM2.5 37.4 250 - Hazardous Air Pollutants negligible - 10 tpy single HAP 25 tpy all HAPs FACILITY AND PROJECT CLASSIFICATION 1. Project Status. Based on the emission estimates in this review, the facility maximum theoretical emissions may exceed Title V major source thresholds for PM10 and carbon monoxide emissions. To avoid being a major source for Part 70 for PM10, the company has requested to have the overburden removal operation limited to 3000 hours per year, and in addition, 90% control of the haul road traffic emissions has been proposed. As for CO emissions, to avoid being a major source for Part 70, the company has proposed lower CO limits for the dryers and a limit on the amount of explosives to be used. Therefore, the project will make the facility a synthetic minor non-Part 70 source for Title V since PM10 and carbon monoxide emissions will be less than the major source threshold of 100 tons per year. The project will be minor for PSD. 2. Facility Status After the Permit is Issued. Based on the emission estimates in this review, the facility maximum theoretical emissions may exceed Title V major source thresholds for particulate matter (PM10) and carbon monoxide emissions. To avoid being a major source for Part 70 for PM10, the company has requested to have the overburden removal operation limited to 3000 hours per year, and in addition, 90% control of the haul road traffic emissions has been proposed. As for CO emissions, to avoid being a major source for Part 70, the company has proposed lower CO limits for the dryers and a limit on the amount of explosives to be used. Therefore, after the permit is issued, the facility will be a synthetic minor non-Part 70 source for Title V since PM10 and carbon monoxide emissions will be less than the major source threshold of 100 tons per year. The facility will be minor for PSD. This conclusion is based on the assumption that Chieftain will not provide sand from mines associated with this facility to a dry plant or plants that are contiguous or adjacent to this facility such that the facilities would become a single source for purposes of Title V and PSD. Preliminary Determination, FID No. 603107010, Permit Nos. 13-POY-205, 603107010-F01 3. Page 45 of 49 EPA Class Code After the Permit is Issued. “A” [Means the source’s maximum theoretical emissions and potential to emit for one or more pollutants are greater than major source thresholds. The source is a major source (will have a FOP)]; “SM80” [Means the source’s maximum theoretical emissions of one or more pollutants are greater than major source thresholds and potential to emit is at least 80% but less than 100% of major source thresholds. The source is a non-major source (will have a FESOP)]; “SM” [Means the source’s maximum theoretical emissions of one or more pollutants are greater than major source thresholds but potential to emit for all pollutants is less than 80% of major source thresholds. The source is a non-major source (usually will have a FESOP)]; “B” [Means the source’s maximum theoretical emissions and potential to emit for all pollutants are less than major source thresholds. The source is a non-major source (will have a SOP)]. 4. Summary. NSR Applicability After Permit Issuance Major Minor PSD X Non-Attainment NA Federal HAP X Facility After Permit Issuance Part 70 FESOP (Syn. Minor) non-part 70 Part 70 Applicability Status EPA Class Code Status X A EPA Class Code After Permit Issuance SM80 SM B X ENVIRONMENTAL ANALYSIS An air pollution control construction permit that does not require review under chs. NR 405 or 408, Wis. Adm. Code, is considered a minor action under s. NR 150.20(1m)(m), Wis. Adm. Code and does not require an environmental analysis. Preliminary Determination, FID No. 603107010, Permit Nos. 13-POY-205, 603107010-F01 Page 46 of 49 The issuance of an initial operation permit under ss. 285.60, and 285.62 Wis. Stats., is considered an equivalent analysis action under s. NR 150.20(2)(a)4., Wis. Adm. Code. For further discussion on environmental impacts, please see the attached Environmental Analysis Questionnaire completed by the applicant. Actions specified under s. NR 150.20(2), Wis. Adm. Code, require a WEPA compliance determination under s. NR 150.35, Wis. Adm. Code, but do not require any additional environmental analysis under ch. NR 150, Wis. Adm. Code. The department has determined that this type of proposal is not expected to have the potential to cause significant adverse environmental or secondary effects. Notification of the determination required under s. NR 150.35, Wis. Adm. Code, is included in the public notice. RULE APPLICABILITY The facility is subject to the NSPS for Non-Metallic Mineral Processing Plants, 40 CFR 60, Subpart OOO, and the dryers are subject to the NSPS for Calciners And Dryers In Mineral Industries, 40 CFR 60, Subpart UUU (s. NR 440.73). The sand dryers are subject to the NSPS under s. NR 440.73, Wis. Adm. Code. The applicable PM emission limit is 0.057 gram per dry standard cubic meter. The applicable visible emission limit is 10% opacity. The dry plant baghouse, the loadout baghouse and the storage silo fabric filters are subject to the NSPS in 40 CFR Part 60, Subpart OOO. The applicable emission limit is 0.032 gram per dry standard cubic meter. No visible emission standard is applicable for stack emissions from units, except for the storage silos constructed after April 22, 2008. The storage silo fabric filters are subject to a visible emission limit of 7% opacity. 40 CFR 60, Subpart OOO has been revised and updated on April 28, 2009 with a more restrictive particulate matter stack emission limitations compared to the NSPS in s. NR 440.688, Wis. Adm. Code. Subpart OOO also has a more restrictive visible emission for non-captured particulate matter emissions. The wet sand processes starting from the crushers are subject to the NSPS in Subpart OOO. The mining of the sand is at or below the water table. As such, the wet mining operations themselves are not subject NSPS in Subpart OOO as per 40 CFR §60.670(a)(2). However, the fugitive dust emissions from the mining operations are subject to s. NR 415.075, Wis. Adm. Code. Visible emission limit will be 20% opacity. Implementation of a fugitive dust control plan will be necessary The facility is subject to the ambient air monitoring requirements under s. NR 415.075(4), Wis. Adm. Code for each of the mines. The facility will be required to set up, operate, and report the results obtained with a particulate matter ambient air monitoring system which complies with the requirements of s. NR 415.075(4)(a)1. – 5., Wis. Adm. Code. These requirements are contained in the air pollution control permit. However, the facility may apply for, and the Department may grant, a variance from the monitoring requirements of s. NR 415.075(4), Wis. Adm. Code, if the applicant demonstrates that the Preliminary Determination, FID No. 603107010, Permit Nos. 13-POY-205, 603107010-F01 Page 47 of 49 general public will not be exposed to significant levels of particulate matter from the source, and that the source’s emissions units and processes are controlled to a level which meets all applicable requirements, per s. NR 415.075(4)(b), Wis. Adm. Code. The sand processing plant is subject to s. NR 415.076, Wis. Adm. Code for the control of fugitive dust emissions. Precautions are required to be taken to prevent particulate matter from becoming airborne. NEW SOURCE PERFORMANCE STANDARDS (NSPS) APPLICABILITY For proposed construction of a source: 1. Is the proposed source in a source category for which there is an existing or proposed NSPS? Yes No Not applicable. (If yes, identify the source category.) The new rotary dryer is subject to the NSPS in Part 60 Subpart UUU. 2. Is the proposed source an affected facility? Yes No Not applicable. (Explain if necessary to clarify.) Yes For the proposed modification of an existing source: 1. Is the existing source, which is being modified, in a source category for which there is an existing or proposed NSPS? Yes No Not applicable. (If yes, identify the source category.) The dry plant and the processing plant is subject to the NSPS in Part 60 Subpart OOO. 2. Is the existing source, which is being modified, an affected facility (prior to modification)? Yes No Not applicable. (Explain if necessary to clarify here and in the following items) Yes. 3. Does the proposed modification constitute a modification under NSPS to the existing source? Yes No Not applicable. Yes. 4. Will the existing source be an affected facility after modification? Yes No Not applicable. Yes. NATIONAL EMISSION STANDARDS FOR HAZARDOUS AIR POLLUTANTS (NESHAPS) APPLICABILITY Part 61 NESHAPS: 1. Will the proposed new or modified source emit a pollutant controlled under an existing or proposed NESHAPS? Yes No (if yes, identify the pollutant). 2. Is the proposed new or modified source subject to an existing or proposed NESHAPS? Yes No (if yes, identify NESHAPS). Part 63 NESHAPS: 1. Will the proposed new or modified source emit a pollutant controlled under an existing Part 63 NESHAPS? Yes No (if yes, identify the pollutant). Preliminary Determination, FID No. 603107010, Permit Nos. 13-POY-205, 603107010-F01 Page 48 of 49 2. Is the proposed new or modified source subject to an existing Part 63 NESHAPS? Yes No (if yes, identify NESHAPS). 3. Is the proposed project subject to s. 112(g) of the Clean Air Act? Yes No. The section 112(g) rules only apply to case-by-case MACT standards that are developed for new construction or reconstruction of sources that (by themselves) constitutes a new major source of federal hazardous air pollutants (for source categories not covered under an existing Part 63 MACT standard). CRITERIA FOR PERMIT APPROVAL Section 285.63, Wis. Stats., sets forth the specific language for permit approval criteria. The Department finds that: 1. The source will meet emission limitations. 2. The source will not cause nor exacerbate a violation of an air quality standard or ambient air increment. 3. The source is operating or seeks to operate under an emission reduction option. Not Applicable. 4. The source will not preclude the construction or operation of another source for which an air pollution control permit application has been received. PRELIMINARY DETERMINATIONS FOR CONSTRUCTION PERMIT NO. 13-POY-205 AND OPERATION PERMIT NO. 603107010-F01 The Wisconsin Department of Natural Resources has reviewed the construction permit application and other materials submitted by Chieftain Sand And Proppant, LLC and hereby makes a preliminary determination that this project, when constructed and operated consistent with the application and subsequent information submitted, will be able to meet the emission limits and conditions included in the attached Draft Permit. Furthermore, the Department hereby makes a preliminary determination that an operation permit may be issued with the following Draft Applicable Limits and Draft Permit Conditions. A final decision regarding emission limits and conditions will be made after the Department has reviewed and evaluated all comments received during the public comment period. The proposed emission limits and other proposed conditions in the Draft Permit are written in the same form that they will appear in the construction permit and the operation permit. These proposed conditions may be changed as a result of public comments or further evaluation by the Department. The United States Environmental Protection Agency will be given the opportunity to comment on the operation permit of any Part-70 source prior to the Department making a final decision on the operation permit. Preliminary Determination, FID No. 603107010, Permit Nos. 13-POY-205, 603107010-F01 Page 49 of 49 PERMIT FEE CALCULATION BASIC FEES. Construction or replacement of a PSD or NAA minor source or the PSD or NAA minor modification of a Part 70 minor source. [$3,000] $3,000.00 TOTAL BASIC FEES $3,000.00 ADDITIONAL FEES. The application is for a source not reviewed under ch. NR 405 or 408, Wis. Adm. Code, where the applicant requested in writing and received the permit within 50 days of receipt of a complete application [$5,000]. $5,000.00 The application is for a source which requires specific permit conditions limiting the potential to emit to make the source a minor source or to make the modification a minor modification [$3,500]. $3,500.00 The permit application required review and analysis of two or more basic emissions units. $14,400.00 The construction permit requires emission testing. $6,000.00 The permit application is for a PSD or NAA minor source or minor modification to a major PSD or NAA source whose projected air quality impact requires a detailed air quality modeling analysis. [$1,000] $1,000.00 A public hearing on the application is held at the request of the permit applicant or its agent. [$1,500] $1,500.00 TOTAL ADDITIONAL FEES $31,400.00 TOTAL FEES (Total Basic Fees + Total Additional Fees) $34,400.00 CREDITS. The initial fee submitted with the application. [$7,500] -$7,500.00 Commence Construction Waiver Fee. [$300] -$300.00 TOTAL CREDITS -$7,800.00 TOTAL AMOUNT DUE (Total Fee + Total Credit) $26,600.00 ENVIRONMENTAL ANALYSIS QUESTIONNAIRE Wisconsin Department of Natural Resources Air Management Program I. Applicant Information: Applicant: Address: Contact Information: Tel: Title of Proposal: Chieftain Sand and Proppant Barron, LLC 331 – 27th Street, New Auburn, WI Jeffrey Goldsmith: 715-642-4371 E-mail: [email protected] Location: County: Township Range Section(s): Air Permit For Sand Plant and Mine Barron City/Town/Village: Dovre Parts of Sections 7, 8, 17, 18, 19, 20 T32N, R10W; Parts of Sections 12, 13, 24 T32N R11W Attach any maps, plans and other descriptive material. II. Brief overview of the proposal: Chieftain Sand and Proppant, LLC requests an air permit to increase the capacity of an existing dryer from 100 ton per hour to 200 ton per hour, to install a grizzly at the dry plant, and to provide addition mining locations. III. Purpose and need (include history and background as appropriate): This project will allow an increase in the facility production to provide proppant for use in oil and gas wells. This will allow for more efficient gas and oil recovery and supports the Unites States goal of energy independency. IV. Authorities and approvals (list local, state and federal permits or approvals required): Please list all other approvals required for this project. If additional approvals are required, you should also consider these under sections V. and VI. below. Barron County – Reclamation Plan for Mine WDNR General Stormwater Permit- Nonmetallic Mining Operations- WI-0046515-05 V. Environmental analysis: A. Analysis of affected environment and probable impacts Have you researched to determine if there are any of the following on the affected property or that may be affected by actions resulting from the project? Briefly describe any existing features or resources that may be affected by the proposal and the probable impacts on those features. Provide any supporting information that demonstrates that you have done this. 1. Physical environment (land use) The proposed modification of the existing dryer and the addition of the grizzly will not impact the land use at the dry plant. Land use impacts related to the additional mining locations are evaluated with the stormwater permitting process and reclamation plan process. 2. Physical environment (water resources and wetlands) The proposed modification of the existing dryer and the addition of the grizzly will not impact water resources and wetlands. Water resources and wetland issues related to the additional mining locations are evaluated with the stormwater permitting process and the issuance of a mining and reclamation permit from Barron County. 2 3. Biological environment - archaeological/historical sites The proposed modification of the existing dryer and the addition of the grizzly will not impact archaeological/historical sites. Archaeological/historical site issues related to the additional mining locations are evaluated with the stormwater permitting process. 4. Biological environment - threatened/endangered resources (NHI) The proposed modification of the existing dryer and the addition of the grizzly will not impact threatened/endangered resources. Threatened/endangered resource issues related to the additional mining locations are evaluated with the stormwater permitting process and the NHI list is evaluated during the preparation of the mine and reclamation plan submitted to Barron County. A copy of the most current NHI list for each township/range that includes a mine is included with the mine plan submitted to the county. 5. Social and economic – environmental justice and local impacts No adverse social, economic or environmental justice impacts are anticipated because of the proposed project. 6. Other special resources (e.g., State Natural Areas) No adverse impacts on other special resources are anticipated because of the proposed project. B. Analysis of alternatives Briefly describe the impacts of no action and of alternatives to the project that would decrease or eliminate adverse environmental impacts Adverse environmental impacts are not anticipated with the modification of the existing dryer and the addition of the grizzly at the dry plant. Therefore, the impacts of no action versus these activities are the same. Adverse environmental impacts from the proposed mining operations are manageable. A “no action” approach for the proposed mine would mean the demand for sand would be met elsewhere which might have more significant environmental impacts than the expansion of the current mine area. VI. Other considerations and assessing the need for an Environmental Impact Statement (EIS) A. Does the Project meet any of the following criteria under s. NR 150.20(4)(b)? All of the following are considerations for whether an Environmental Impact Statement may be required. Check all that potentially apply. 1. The project involves multiple department actions. 3. The project may set precedent for reducing or limiting environmental protection [NR 150.20(4)(b)3. Wis. Adm. Code]. 2. 4. 5. 6. 7. The project may be in conflict with local, state or federal environmental policies [NR 150.20(4)(b)2. Wis. Adm. Code]. The project may result in deleterious effects over large geographic areas [NR 150.20(4)(b)4. Wis. Adm. Code]. The project may result in long-term deleterious effects that are prohibitively difficult or expensive to reverse [NR 150.20(4)(b)5. Wis. Adm. Code]. The project may result in deleterious effects on especially important, critical, or sensitive environmental resources [NR 150.20(4)(b)6. Wis. Adm. Code]. The project involves broad public controversy [NR 150.20(4)(b)7. Wis. Adm. Code]. 3 8. The project may result in substantial risk to human life, health, or safety [NR 150.20(4)(b)8. Wis. Adm. Code]. B. For all boxes checked in A. above, describe the criteria in more detail below. The project involves department actions related to air permitting and stormwater permitting. 4
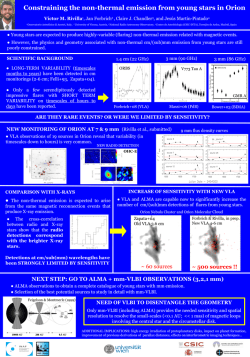


© Copyright 2026