
NH 2015 Wild Turkey Assessment
New Hampshire
WILD TURKEY ASSESSMENT
2015
Theodore W. Walski
New Hampshire Fish and Game Department
January 2015
Table of Contents
A. NATURAL HISTORY……………………………………………………. 6
B. HISTORICAL BACKGROUND ………………………………………… 5
C. TURKEY POPULATION ASSESSMENT ……………………………… 9
D. TURKEY HABITAT ASSESSMENT …………………………………... 14
E. HUNTING SEASONS ASSESSMENT ………………………………….. 22
F. RESEARCH FINDINGS AND NEEDS ………………………………… 28
G. SUMMARY AND CONCLUSIONS ……………………………………. 34
TABLES……………………………………………………………………… 38
FIGURES……………………………………………………………….…….. 48
APPENDICES…………………………………………………………..……. 61
2
A. NATURAL HISTORY
The Eastern Wild Turkey (Meleagris gallapavo sylvestris) is a relatively short–lived species, but
has a high potential reproductive rate. The average life span is 1½ years for males and 2 years
for females. The maximum life span is about 8 years.
Male and female turkeys are long-legged and long-necked, and stand 3 to 4 feet tall. Adult male
turkeys, called “gobblers” or “toms”, weigh 16-24 pounds, averaging 18 ½ pounds. Juvenile
male turkeys, called “jakes” are one year old or less, weighing 12 to 18 pounds, averaging 15
pounds. Adult males have 5 to 12 inch bristle-like “beards” that protrude from their chests, and
develop sharp “spurs” on their lower legs, which are useful for aging gobblers. Adult females,
called “hens”, weigh 8½ to 13 pounds, averaging 10 pounds. Hens rarely develop spurs, but
approximately 6% of adult hens develop “thin” beards similar to that of the gobblers. The chest
and back feathers of hens have buffy-brown tips, whereas those of gobblers are black-tipped.
The head/neck appendages and their coloration also differ between hens and gobblers.
The average clutch size is twelve eggs. Nesting success is roughly 35%, i.e.: for every three
hens attempting to nest, one hen successfully hatches out a brood. Almost all juvenile and adult
hens attempt to nest each spring. The preceding year’s hatch of young hens are themselves
nesting the following spring, or at eleven months of age. If the initial nest is abandoned from
disturbance or destroyed by a predator, most hens will make a second nesting attempt.
Turkeys are polygamous, in that one tom will breed a number of hens. The older, adult gobblers
breed most of the hens. Juvenile males, however, are capable of breeding. Weather conditions
are often a major factor in determining the yearly productivity of turkey populations. Rainy and
cool weather during the late May or early June hatching period can decimate newly-hatched
turkey broods.
In early summer, several hens with young often join together to form multiple brood flocks.
Hens which are unsuccessful in hatching a brood, or which lose their young, often become foster
mothers. Both of the above factors result in added protection for the group of young.
Turkeys have large yearly home ranges of about four to five square miles and long distance
movements by some turkeys often to thirty miles are not uncommon.
Turkeys can use a diversity of nesting cover or sites. The nest can be anywhere in the woods or
open fields. Often the nest is in clumps of brushy vegetation, such as juniper, blackberry,
goldenrod, spirea, or under loose logging slash, or in un-mowed hayfield grass.
The first two to three weeks of life are the most critical, and high mortality can occur during this
period. Even though the hen is very protective, chicks can be lost to a variety of predators, bad
weather and accidents. It is considered good success if six to seven of twelve poults survive until
fall.
Turkeys are true “omnivorous opportunists” in that they feed on almost anything and whatever is
in season. Animal matter, mostly insects, is as much as 10% of the diet. Grasses and herbs are
well used, particularly at winter “seeps” or wet areas. Large volumes of weed seeds are taken
during the summer. In late summer they feed avidly on blueberries, blackberries and cherries. A
3
staple part of the wild turkey’s fall, winter and spring diet is the hard mast or acorns and nuts
from oak, beech, hickory, cherry and ash trees.
Because of the presence of long lasting deep snow cover usually present in northern New
England, which greatly reduces the access to acorns, corn wastage at dairy farms becomes a very
important winter food. Barberry, rose hips and dried apples are very important winter foods.
Turkeys are ground-feeders. If deep snow covers the primary foods during the winter, then
shrubs which retain fruits or berries over the winter, or some type of grain wastage is needed for
at least part of the winter.
Wild turkey flocks cause little conflict with man or his land use and agriculture. Turkeys feed on
corn wastage at farms after the ensilage corn is cut in the early fall. While turkeys make good
use of dried fruit from “wild” apple trees, the use is during the winter and not in orchards during
the fall. Wild berries are plentiful to satisfy turkeys, and flocks can be readily scared away from
sites where small fruits are grown.
The wild turkey is in little competition, if any, with other animal species. Historically, it is
native to each New England state. Grouse eat buds primarily during winter, and woodcock have
migrated. There are no native or established populations of pheasants or quail in northern New
England.
Some hunters mistakenly believe that turkeys significantly compete with deer during fall and
winter for the available supply of acorns and beechnuts. Turkeys feed on a variety of foods
during the fall months. The rodent population of gray and red squirrels, chipmunks and 4 species
of mice and voles consume far more nuts per acre or square mile than a flock of turkeys. One
20-inch dbh oak tree can produce 10,000+ acorns. Deer feed on woody browse all winter, and
turkeys do not.
Predation on Wild Turkeys
Large ground-nesting game birds such as pheasants, grouse and turkeys are susceptible to
considerable nesting losses. Turkeys typically have only a nesting success rate of 33%, or 1 out
of every 3 hens successfully hatches a brood. Studies with radioed hen turkeys in New
Hampshire have shown that foxes, coyotes and fisher can kill turkeys on nests. Because of their
large size, turkeys leave considerable scent when they leave their nest to feed for a short while,
and can be tracked to the nest particularly when the ground and vegetation are wet. These larger
predators, along with raccoons, skunks and crows also find nests and eat the eggs. Nests are
readily abandoned during the first two weeks of the four-week incubation, if disturbed by
predators, dogs, humans and farm equipment.
The first 1-2 weeks of life are the most critical period in a turkey’s life, because they cannot fly
until about the age of 10-14 days, and until then have to be brooded on the ground where they are
vulnerable to a range of predators, including hawks and house cats.
Two other predators which readily kill adult turkeys in New Hampshire and throughout their
range in the United States, are great-horned owls and bobcats. The owl kills are common in New
Hampshire, particularly during April/May when the early nesting owls are quite territorial.
Usually only the head and neck area are eaten. Owls usually attack the turkeys when they are
4
roosting in trees during the night. Bobcat kills have been uncommon because New Hampshire
has a relatively low bobcat population.
B. HISTORY OF WILD TURKEYS IN NEW HAMPSHIRE
Most of the seven southern counties of New Hampshire were formerly turkey range. Practically
all of this primeval habitat consisted of vast, undisturbed tracts of mixed hardwoods and
coniferous forest with many mast-bearing trees (oaks, chestnuts, beech, hickory, cherry, ash) –
the primary food source of turkeys. The limiting factors in the North Country were the deep
snows and lack of oak trees – the acorns of which can be the “staff of life” for wild turkeys in
many states.
The pre-Columbian (or pre-European) population estimate for New Hampshire was
approximately 5,500 turkeys at a density of two birds per square mile over an area of 2,760
square miles (30% of the state’s 9,000 square miles) in the southern counties.
Settlement adversely effected turkeys in a variety of ways. Large tracts of forest were cleared
for agriculture and the important mast-bearing trees were cut and burned. Nests were destroyed
by burning and cattle. There were no seasons or limits. While the American chestnut was a very
important food for the wild turkey, the habitat destruction eliminated the turkey long before the
“blight” killed off the chestnut. By the end of the Revolutionary War, turkeys were, for all
practical purposes, gone from New Hampshire. Between 1830 and 1860, two-thirds or 85% of
most towns were cleared and there were over 1 million sheep. The last turkey reported from
New Hampshire was in 1854 in Weare.
Land use, logging and different types of farming have changed every square foot of land in New
Hampshire many times over during the past 400 years. The original habitat and forest
composition cannot be brought back. The numerous and very large specimens of mastproducing tree species such as white oak, red oak, beech, cherry, ash, hickory and basswood are
largely gone. One of the most important original turkey foods in New England, the American
chestnut, is entirely gone. The extensive “burning” by the Indians to create game habitat,
herbaceous and grassy openings and fruiting shrubs is a thing of the past.
Restoration Efforts
The Department’s efforts at wild turkey restoration dates back to the early 1960’s. Numerous
states were contacted to see if they would give, trade or sell some wild-trapped turkeys to New
Hampshire. There were numerous offers of pen-raised game farm turkeys, which the
Department refused on the advice of all states, which had worked with game farm type turkeys.
The Department was unable to find a source of pure wild-trapped turkeys until the turkey/fisher
swap with West Virginia materialized.
Turkey transplanting was initiated in 1969 when New Hampshire sent 25 fisher to West Virginia
and received 26 wild-trapped turkeys in return (11 in 1969 and 15 in 1970). These were released
in Pawtuckaway State Park, in the towns of Nottingham and Deerfield in southeastern New
Hampshire. This nucleus started reproducing, but one of the most severe winters on record
(1970-1971) decimated and/or dispersed this small nucleus. Other limiting factors may have
5
been the lack of farmland associated foods in the area and relative lack of hardiness in this strain
of turkey from a southern state.
The second and successful transplant was with 25 turkeys trapped in the Allegheny Mountains of
southwestern New York, bordering Pennsylvania and released during January 1975 in Walpole
and Westmoreland in southwestern New Hampshire in the Connecticut River Valley, bordering
Vermont. Since then, 15 transplants have been made to other parts of New Hampshire, with
turkeys trapped from this original population nucleus.
Justification for the Wild Turkey Program
Wild turkeys had the potential to become a major game species in New Hampshire, in terms of
man-hours of recreation. Two hunting seasons per year are possible. The bordering state of
Vermont and other states in the Northeast had already reached this goal. It was believed that the
potential existed to realize a population of perhaps 5,000 turkeys (it has reached about 40,000 as
of 2014) in New Hampshire. There was considerable interest by the sportsmen, landowners and
general public to fully restore and manage wild turkeys in the state.
Wild turkey hunting is desirable because it stresses quality hunting, results in little landowner
conflict, requires no artificial propagation, produces maximum hunting recreation with minimum
expenditure of the resource (low success rate), provides an additional big game species to hunt,
and provides more hunting opportunity in southern New Hampshire, where most of the state’s
hunters live. Turkeys help fill the void created by the loss of farmland and small game habitat.
New Hampshire has little or no hunting for quail, pheasants, mourning doves, squirrels or
cottontail rabbits. The best habitat for grouse, snowshoe hare and woodcock is in northern New
Hampshire, where the human population is far less dense.
Comparison to Other Hunting in the State
Turkey hunting was recognized as having the potential to become a major form of hunting
recreation in New Hampshire. While the bag limit for turkeys is minimal, the emphasis is on
calling and contact with turkeys, the quality of the hunt and the trophy nature of the turkey.
Some compensation for the low bag limit is the liberal season length and man-days of hunting
recreation.
It is recognized that a high percentage of New Hampshire’s hunters will not become turkey
hunters because of the specialized nature of the sport, and the skill and time demanded. During
2003 there were approximately 80,000 hunting licenses sold. There were 16,000 turkey season
permit-holders, so that this indicates approximately 20% of the state’s hunters are now turkey
hunting. If a fall shotgun turkey season is initiated, the number of participants and man-days of
hunting has the potential to double.
Past turkey hunter questionnaires show that the average permit-holder spends 5.5 days turkey
hunting. Therefore, during the 1989 turkey season the 1,000 hunters equated to 5,500 man-days
of hunting recreation. The 16,000 permit-holders from the 2003 spring season meant
approximately 880,000 man-days of hunting recreation.
6
A dramatic increase in turkey population and hunter participation has occurred since the
transplant of 25 New York turkeys to New Hampshire in 1975. During the first hunting season
in1980 there were 700 permit-holders and 31 gobblers were harvested from 11 towns. During
the 1989 season 1,120 permits were issued, and 142 gobblers taken from 38 towns. During the
2003 season 16,000 permit-holders took 2,600 gobblers from 206 towns. By 2013 20,062 permit
holders took 4,500 gobblers from 234 towns, a state record spring harvest.
Enabling Turkey Legislation
During 1977 Senate Bill number 83 (S.B.#83) was introduced and passed, to support restoration
work on the new species. The 25 wild-trapped turkeys from New York Fish & Game
Department had been released in New Hampshire just two years previous during January 1975.
The legislation had two distinct parts – one to give the Fish and Game Department Director the
power to set hunting seasons and regulations and the other part to prevent any persons in the
state from importing or releasing an undesirable type of non-wild turkey called “game farm
turkeys”.
When the first limited hunting season (by permit only) was initiated in 1980, a permit fee of
$5.00 was in place. This produced an ear-marked fund which could only be used for wild turkey
restoration, management and research. The thinking was that this would help pay for one
biologist’s work time on a Wild Turkey Project, and not use money needed for work on other
species such as deer. Federal Aid would subsequently pay a 75% portion of the annual project.
The following outlines the 1977 legislative bill and the responsibility of the Fish & Game
Department:
209:12-a Wild Turkey
I. The executive director shall adopt rules, pursuant to RSA 541-A, relative to:
a) Establishing seasons and bag limits and issuing wild turkey permits.
b) Establishing registration stations and registration agent fees for wild turkeys.
c) Specifying the methods for taking and registering wild turkeys.
d) The enhancement, protection and propagation of wild turkeys.
212:25-a Special Permit to Keep and Propagate Wild Turkeys
No person shall import any species of wild turkey, hybrid wild turkey, or wild turkey/domestic
turkey cross or any egg of these species into New Hampshire. Any person in possession of such
turkeys when this section takes effect shall be permitted to keep or propagate them by special
permit from the executive director. Persons without such a permit shall not sell, give away, or
release into the wild a live wild turkey, hybrid or wild turkey/domestic cross, or any fertile egg of
any of these species.
Game Farm Turkeys
This type of turkey was developed in the 1930s in various states such as a Pennsylvania,
Maryland, etc., as a potential method to produce a source of wild turkeys for restoration work.
Domestic hen turkeys were bred by wild male turkeys, and resulting offspring were bred in pens
7
to try and produce a turkey similar in stream lined form and color of the true wild turkey.
However, during years of this breeding and propagation in captivity many of the genetic traits
necessary for survival in the wild were lost.
In the New England area, Massachusetts F&G tried game farm turkeys in the Quabbin Reservoir
area in the early 1960s.This effort and others like it in other eastern states all failed because this
type of domestic/wild cross was not wild enough or hardy enough. The real breakthrough came
with the development of the rocket net to capture flocks of wild turkeys, and the willingness of
states to trap turkeys and transplant some to states without turkeys.
During the 1960s and 1970s each New England state passed legislation making it illegal for
individuals to import, propagate, sell or release game farm turkeys in their respective states.
Game farm turkeys have the potential to cross breed with true wild turkeys and ruin restoration
efforts. Regardless of the law, some individuals still continue to illegally acquire eggs, chicks or
adult turkeys from breeders or game farms in states distant from New Hampshire, where laws
pertaining to propagation of wild animals are less strict.
There are three main reasons game farm turkeys are undesirable and illegal. One bad effect is
genetic pollution. If the wild turkeys and game farm type interbreed, the wild strain is quickly
lost. New Hampshire needs the hardiest strain of wild turkeys to survive its hard winters. Also,
game farm turkeys can pass on diseases such as blackhead, fowl pox and cholera to wild turkeys,
which have little or no immunity to these diseases. The third bad effect of these turkeys is their
relative tameness, with such behavior as roosting on cars and porches and standing along the side
of busy highways. These give non-hunters a poor impression of true wild turkey behavior and
can result in an over-protectionist attitude. These tame turkeys often come into housing
developments and cause damage to plants and gardens and leave excessive droppings, and in so
doing, serve to devalue turkeys as a public resource.
There have been several sources or sites of game farm turkeys in New Hampshire, which have
been particularly noteworthy. The 23,000-acre Corbin Park Game Preserve in Sullivan County
acquired game farm turkeys in the 1960s. Some of them spread into surrounding towns, and still
in 2004 off-colored crosses show up at registration stations in the region. A dairy farm in the
Lebanon area acquired turkeys from a game farm in Pennsylvania in the 1980s and released
them. A game farm in Fairlee, Vermont had game farm turkeys and some of these are believed
to have crossed the Connecticut River into New Hampshire. Two additional sources in
southwest New Hampshire have spread game farm turkeys to numerous persons around the state
for years. All ten counties have had sites with game farm type turkeys.
The potential problems with identifying persons having game farm turkeys, and confiscating or
eliminating such turkeys, are numerous. Many hunters, as well as Department personnel cannot
readily discern the physical and color differences between true wild turkeys and game farm
turkeys. Behavior differences may or may not be obvious. There is as yet no definitive genetic
testing which can readily identify a true wild turkey from a game farm turkey. The National Wild
Turkey Federation has been sponsoring genetics research in recent years to develop methodology
to do this, as well as to distinguish between the five sub-species of wild turkeys. Good proof is
necessary in contested court cases. Capturing a flock of obvious game farm turkeys is not easy
because they can fly and do not readily go into a trap. Use of rocket nets is costly in terms of
man-days. Permission to acquire and use drugs for capturing is difficult.
8
Regardless of the difficulties in dealing with game farm turkeys, yearly effort should be made by
Department staff in the field and regional offices to report and document sites with such turkeys
and wherever practical to remove them. Conservation officers should investigate persons with
suspected game farm turkeys in captivity. Articles should periodically be written in various
magazines to re-emphasize the potential negative impacts and illegal nature of these types of
turkeys.
Another on-going or yearly occurrence is persons, when mowing hayfields and flushing turkeys
off nests, having the tendency to save the eggs and put them in an incubator or under a laying
chicken. These turkeys when hatched are worthless for returning to the wild because they
immediately become “imprinted” on humans and lose most of their wildness. These turkeys in
essence become “game farm turkeys”, even though their origin is of pure wild stock. It is illegal
for anyone to be hatching and raising wild turkeys. The nests or eggs should be left for the
crows and mammalian predators to clean up. Periodic reminders not to handle wild turkey eggs
should be shared with the public.
C. WILD TURKEY POPULATION ASSESSMENT
1989 Turkey Population
The wild turkey population in New Hampshire, as of April 1990 was estimated at 2,500 (Table
1). All or most of the towns in Cheshire, Sullivan, Hillsboro, Merrimack, Strafford and
Rockingham Counties had some wild turkeys in 1989. The southern half of the state’s 9,000
square miles was considered potential turkey range. About 3,000 of 5,000 square miles of
potential turkey habitat was occupied by turkeys, most with low densities.
In 1989, it was hoped that by the year 2000, New Hampshire would have a sustaining population
of 5,000 wild turkeys (Table 2). Land use, development and degree of remaining farms and
winter conditions were expected to be controlling factors. Turkeys existed in eight of New
Hampshire’s ten counties at the time. None were expected to survive in Coos County, the White
Mountain National Forest region and few in Carroll County. A few had shown up as far north as
Monroe and Littleton, and some were expected to live in this portion of Grafton County because
of the presence of dairy farms along the Connecticut River Valley. In the central portion of the
state, turkeys were not expected to make it far beyond Lake Winnipesaukee. The limit on the
eastern or Maine border was thought to be about Ossipee and Wolfeboro.
2004 Turkey Population
The turkey population has spiraled upward since 1990, and substantial range expansion has
occurred. As of August 2004, the statewide population was estimated to be 26,900 wild turkeys,
compared to 2,500 in 1989, or a ten-fold increase. Table 3 records the estimated turkey
population per WMU (see Appendix I for WMU map) and per square mile for 2004, and
projected population for 2015.
During 1989, it was felt no turkey population could sustain itself in Coos County, few in Carroll
County and only a small population might occupy the western half of Grafton County because of
the dairy farms in towns bordering the Connecticut River. There are now turkeys living in every
9
town of the state’s 10 counties. Turkey range of occupation has extended into the towns in
northernmost Coos County. Spring gobbler hunting is now allowed in all wildlife management
units, except WMU A. Carroll County, bordering Maine, now has a decent turkey population
and hunting season, as does the eastern half of Grafton County. Western Grafton County
bordering the Connecticut River now has surpassed the original release area in southwestern
New Hampshire, as the section of the state having the largest turkey population and the greatest
hunting season harvest. This regional increase in the turkey population is due to the greater
number of farms and the field brood habitat and winter foods associated with these farms.
Some of the relatively rapid expansion of a turkey population into the northern 3 counties of
New Hampshire can be attributed to the turkey transplants made in Maine near the New
Hampshire border and from the existing turkey population in northeastern Vermont, which
borders New Hampshire along the Connecticut River.
History of Turkey Transplants in New Hampshire
A total of 344 turkeys in 16 transplants have been made during the period 1969-1995. The
number in each transplant varied from 10 to 36, with an average of 22 turkeys per transplant.
Many more turkeys were trapped during this period, but were banded and/or affixed with radio
transmitters for various research studies. Table 4 records the years, release towns and number of
turkeys for each transplant, and Figure 1 shows the location of these transplants.
The original 1969-1970 transplant of 26 turkeys from West Virginia to Pawtuckaway State Park
in Rockingham County was a failure due to a combination of factors: two of the severest winters
of the century (1969-1970 and 1970-1971), lack of foods and brood habitat associated with
farmland and these turkeys were perhaps a less hardy strain than the subsequent turkeys obtained
from the deep snow country of New York.
Successful restoration began with the release of 25 turkeys trapped in New York during January
1975, and released in the town of Walpole. Primary factors in site selection were a relatively
large percent of farmland, and continuity with an adjacent, existing Vermont turkey population.
During 1978 and 1979 the process was begun of trapping turkeys from this southwest corner of
the state, and transplanting them to more eastern and northern sections of the state. Trap-and
transplant work in New Hampshire was concluded during the winter of 1994-1995, with two
transplants to north central New Hampshire, with one release on the east side of Lake
Winnipesaukee in Carroll County, and the other release on the west side of Lake Winnipesaukee
in Belknap County. No further transplants were needed in northernmost New Hampshire
because turkeys had been working up the Connecticut River boundary with Vermont, and
because transplants in Maine near the New Hampshire border had expanded into New
Hampshire.
Analysis of the potential turkey habitat and tentative transplant sites was for the most part
completed in 1978. A minimum of eight major transplants were planned for the southern half of
New Hampshire. It was thought that this would be sufficient to start population nuclei in the
seven southern counties. As time permitted, and more surplus turkeys became available,
additional and smaller transplants could be made to fill some of the gaps in turkey distribution.
10
The major criterion for selecting each of the transplant sites since 1975 has been the degree of
farmland present. The actual release point has always been a farm. The areas with the most
remaining dairy farms in each county have been selected. At least during the first winter at the
new release site, the flocks would have the opportunity to have corn wastage and other foods
around the fields if it was a hard winter.
Degree of Success of Transplants
The majority of the turkey transplants did well, and the population and range expansion
increased significantly after several years. The slowest growth and lowest hunter harvest
continues to be in southeastern New Hampshire (Rockingham and Strafford Counties). This
appears to result from the following characteristics of the region. The region has the highest
human density, the most development, the least amount of farmland and fields, and the most
posted land. This region of the state has received the most turkey transplants (7 of 16). In
addition, the first 2 turkey transplants in Maine were made only several miles from the New
Hampshire border in York County.
During 1993, an effort was made to bolster turkey populations in the southeast by making 3
supplemental transplants. This regional turkey population has had many years to multiply and
expand. As of 2004 there are turkeys living in every one of the towns in the southeast, and goodsized flocks at the original release site areas. Three transplants to south central New Hampshire
(Pittsfield, Lyndeboro, Boscawen) started off well, then stagnated for some years, and now have
good populations.
Methods of Estimating the Turkey Population
Assessment of the yearly turkey status and population throughout the various regions of the state
is done by a combination of methods: summer brood surveys, winter flock surveys and analysis
of sex and age data gathered at registration stations throughout the state during the hunting
seasons. The numerous tagged and radio telemetry turkeys from various field studies have also
contributed significant information about turkey population dynamics.
It is not difficult to locate broods during the summer because of the tendency of turkeys in 84%
forested New Hampshire to seek out hayfields and pastures as brood habitat. It is also not
difficult to locate turkey flocks during the winter months because of their tendency to congregate
at farms and backyard birdfeeders.
Federal Aid Grant W-89-R-III (Wild Turkey Studies in New Hampshire) has 11 different jobs
which are carried out every year. One job, Turkey Brood Surveys, determines regional turkey
nesting success and productivity. Brood sighting information is collected from regional
biological staff, conservation officers, landowners, and sportsmen during the summer months.
Data recorded includes date of observation, number of hens and young, size of young, town and
general locality. The periods when most hatching occurs is determined from size of the young.
The spring weather conditions are closely followed because this can have a major impact on
hatching success and annual productivity.
Another job, Winter Flock Surveys, is a census of regional wintering turkey flock abundance,
distribution and survival. Winter flock sighting information is collected from regional biological
11
staff, conservation officers, landowners, and sportsmen during the winter months. Data recorded
includes town, locality and comments on food usage and behavior. Weather conditions and
snowfall amounts are recorded throughout the winter.
A third job, Spring Harvest Data Coordination, Collection, Entry and Analysis, uses 50+
registration stations throughout the state to gather harvest information for each turkey taken
during the hunting season. Information on the registration form includes license and turkey
permit numbers, hunter’s name and address, date and time of kill, weapon type, town of kill and
turkey biological data: sex and age, weight, beard length, spur length and any abnormalities and
tag numbers. Registration form data are entered into a computer data set for analysis.
Estimates of the yearly turkey population per WMU are based on the turkey harvest totals per
each WMU during the spring gobbler season in May. In general, in states with established
turkey populations, the spring hunting season harvest takes approximately 20% of the male
segment of the turkey population. The female turkey population is not hunted in spring seasons.
The sex ratio at hatching is 50% males and 50% females. Therefore, the spring season harvest
represents approximately 1/10th of the total turkey population, or the estimated statewide turkey
population is ten times the number of the spring harvest.
Projected Turkey Populations for the Year 2015
Table 3 gives the estimated turkey populations for 2004 and the projection for the year 2015, or
the end of the 10-year management plan currently being formulated. It is not unreasonable to
assume a future wild turkey population of 35,000 to 40,000 wild turkeys in New Hampshire, or
an average of 4 to 5 turkeys per square mile. The neighboring state of Vermont has attained the
population figure of 40,000 wild turkeys, as has the state of Connecticut.
Based on 2004 harvest totals, units H1, H2 and D2 have already attained turkey population
estimates of 7.26, 5.09 and 6.19 turkeys per square mile, respectively. Units H1 and H2 in the
original turkey release region in southwestern New Hampshire have probably reached carrying
capacity. Turkey populations will probably continue to grow in most other units for the next 5 to
10 years. Based on the turkey populations in units H1 and H2 and the relative quality of habitat
in the other units, values of 2, 3, 4.5, 5 and 6 turkeys per square mile were projected for the year
2015 for the various units in the state.
Limiting Factors for Maximum Projected Turkey Population
A more realistic maximum projected population level might be more in the order of 30-32,000
wild turkeys. If a fall shotgun season comes about, there will be a significantly greater yearly
harvest. During fall seasons hen turkeys will comprise 65% or more of the harvest. While the
neighboring state of Vermont has reached a population of 40,000 turkeys, and is about the same
size as New Hampshire, there are some significant differences between the two states. Vermont
has seven times more dairy farms than New Hampshire. This much greater acreage of farmland
in Vermont provides more winter flock carrying capacity and the preferred summer brood habitat
of fields.
12
New Hampshire is one of the most rapidly developing states in the United States. More and
more farms and fields are lost to development each year. Yearly productivity of young turkeys
can be expected to decrease in towns with high human densities because the favored field habitat
for nesting and brood rearing is declining. Increased activity by children, dogs, cats and vehicles
leads to increased nest abandonment or destruction.
The “cultural carrying capacity” for turkey flocks in some developed towns in southeastern New
Hampshire has probably already been reached. Large turkey flocks living in suburban areas
often result in complaints. Turkeys will sample fruits and vegetables in back yards, leave
accumulations of droppings and sometimes provide a road hazard. Flocks particularly like to
visit birdfeeders during the winter months and can irritate persons trying to feed the songbirds.
There is current conflict between some dairy farms and large flocks of wintering turkeys.
Turkeys feed on the stored corn ensilage in bunker silos and leave droppings at these food
storage sites, which some farmers feel might transmit disease to cattle. The size and numbers of
wintering turkey flocks at dairy farms appear to be increasing. A fall gun season for turkeys may
be a method used to keep the turkey population from becoming too abundant.
More deer hunters are complaining about large flocks of turkeys eating too many acorns and
thereby depriving the favored deer of some of this food supply. Most hunters fail to understand
that the numerous species of mice and voles, squirrels and chipmunks consume far more nuts per
acre or square mile, and that there is little competition during the critical winter months when
deer are on a woody browse diet.
The radio telemetry turkey research studies discussed later in this report show that predation
losses of nests, nesting hens and young turkey chicks and poults have been relatively high.
There are numerous mammalian and avian predators throughout the state. The hunting and/or
trapping of raccoons, foxes and skunks have very significantly declined in the past four decades.
Hunting of coyotes and fisher is relatively uncommon. As more of turkey nesting and brood
rearing habitat is taken over by development, predation will be more concentrated on the
remaining habitat.
Turkeys are still relatively new to the state and most of the WMUs have probably not reached
their potential carrying capacity. Setting specific turkey population goals for each WMU might
not be realistic at this point in time.
2014 Turkey Population
An annual statewide turkey population estimate is made during the month of August by
incorporating numbers and data from: summer brood survey, winter flock survey and spring/fall
turkey harvests.
The turkey project biologist based in the Keene Office, acquires a good yearly sample of 100+
turkey broods during the summer, as well as the number and size of flocks during winter field
work. However, the majority of these observations are from towns in southwestern New
Hampshire. To obtain more comprehensive data from throughout the state two on-line public
surveys were initiated.
13
There have been six years of the Public Internet Winter Flock Survey (Table 5). The average
number of flock reports statewide have been 1,467 reports. The total number of turkeys from
these reports has averaged 23,500 turkeys, and average number per flock report was 15.7
turkeys. The survey for the first two years recorded the locality, usually the road name. In
subsequent years locality was omitted and only the town recorded. Many reports are of the same
flock of turkeys in a town. It is also apparent that the greater number of flock reports come from
WMUs in southeastern NH towns which have the greater human density and number of backyard
birdfeeders and hence many more reports to enter in the survey.
The Public Internet Summer Brood Survey (Table 6) has been conducted for four years. The
average number of brood reports received per year has been 1,033 reports. The poults per hen
average state-wide was 3.74poults for the month of August, and 4.00 poults per hen for the 4month summer recording period.
During development of the previous 10 year Turkey Management Plan and Turkey Assessment
in 2004, the turkey population was projected to be 30,000 to 32,000 turkeys by the year 2015.
This goal has been reached or surpassed by the end of year 2014, during which the population is
estimated at about 40,000 wild turkeys. Some states have estimated that the spring season turkey
hunting harvest takes approximately one-tenth of the total turkey population and 20 percent of
the male segment. Hence a spring gobbler season harvest of 4,000 gobblers would equate to a
statewide population of 40,000 turkeys.
By the end of year 2014 the carrying capacity of turkeys has probably been reached in most of
the state. There are at least some turkeys in every town in the state, from Portsmouth to
Pittsburg. The current estimated population of 40,000 turkeys is probably going to be the
average annual population for about the next ten years. Perhaps an annual population of 50,000
turkeys might be reached some year(s) when there is an above average summer hatch and
survival of young.
The majority of the turkey population increase during the past 4-5 years appears to have come
from towns in southeastern NH, or wildlife management units J2, L and M (Tables 3 and 7).
This was not initially expected because these units have the most human development and the
least amount of farmland. The 2014 estimate of 40, 000 wild turkeys equates to a state-wide
average of 4.55 turkeys per square mile, with WMUs in the southern half of the state having
significantly higher turkey densities than this.
D. WILD TURKEY HABITAT ASSESSMENT
Limiting Factors for Turkeys
The following text was originally written in 1989. Updates are offered where necessary in order
to provide an accurate perspective of turkey habitat conditions today. The most important factor
limiting turkey numbers and their range expansion in New Hampshire is access to winter food.
Snowfall is extensive over most of the region. Snowfall occurs from October through April in
the northern sections. Even in the more favorable regions, during some winters, turkeys will
have to withstand 100 or more days with from one to three feet of snow cover. In some cases
there will be no access at all to foods on the ground, and seep areas will remain frozen over due
to prolonged periods of zero range and lower temperatures. Deep, long-lasting snow cover
14
prevents turkeys from reaching foods on the ground, and turkeys cannot subsist on buds as do
partridge. It is a bad sign when turkeys are reported “budding”. When found dead from
starvation, their crops may be full of pine or hemlock needles or beech buds, which are of little
nutritional value. Turkeys will sometimes stay in roost trees and starve when deep powder snow
conditions persist because turkeys cannot walk around well and are susceptible to predators. It is
better when crusts form as it will increase their mobility and encourage them to look for food
above the snow.
The second most limiting factor is the lack of open or non-forested land. The winter foods,
which turkeys need to survive are not found in dense woodland when deep snow cover persists
for a long time. Turkeys need to rely on dried fruits and berries when acorns and nuts are
unavailable. Apple trees, rose, sumac, juniper and other fruiting shrubs only grow well in nonforested sites where competition is minimal and where they receive maximum sunlight. Next to
Maine, New Hampshire is the second most heavily forested state.
A third limiting factor is lack of numbers and variety of nut-bearing trees and other winter foods.
While acorns are a primary food of wild turkeys over most of their range in North America,
turkeys in some regions get along without the presence of any oak species if other mast species
act as substitutes. The pits from cherry tree fruits, nuts from hickory trees and seeds from ash
trees can be very important foods in other eastern states, but these three tree species are relatively
scarce in northern New England. Beechnuts are a favorite turkey food, but the yearly crop is
unreliable, and the trees are subject to disease. The seeds from hop hornbeam trees are a
favorite, but this species is relatively scarce.
The number of species of oak trees is limited. The acorns from the more palatable “sweet” white
oak species are the favorite of turkeys and other wildlife, but white oak is relatively scarce in
most of New Hampshire. Northern red oak is the main species on which turkeys have to rely for
acorns. Even its numbers are few compared to the numbers of birches, maples and white pines,
prevalent in most forest stands. Roughly the northern halves of Vermont, New Hampshire and
Maine have few oaks at all. Connecticut, Massachusetts and Rhode Island on the other hand,
have an abundance of oak, particularly white oak, as well as other nut-bearing trees.
Besides lack of numbers of fruit-bearing shrubs and trees, variety of species is lacking. Our
native winterberry, sumac, high-bush cranberry, juniper and wild apples are relatively scarce
because the state has become so heavily forested. The fruits from green briar, bittersweet and
flowering dogwood are important in other states, but hardly grow in New Hampshire. Important
European species, which have escaped, such as barberry, buckthorn and Tartarian honeysuckle
are also relatively scarce in New Hampshire.
A fourth important limiting factor, and perhaps the most limiting factor, is the relative scarcity of
farmland. New Hampshire has very little farmland, and it is not evenly distributed throughout
the state.
Scarcity of Farmlands
Since the initial restoration efforts with turkeys in the northernmost states, the great importance
of farmland, particularly dairy farming, has been well documented. Without farmland and
especially corn growing, turkeys could hardly exist in Michigan, Wisconsin and Minnesota.
15
Turkeys have taken hold and expanded rapidly in southeastern Minnesota, for example, almost
entirely due to the fact that a major wildlife conservation practice for wild turkeys and deer is to
leave blocks of standing corn for their wintering use. In northern New England, farmland is even
more important to turkeys because the region is heavily forested and human development
excludes turkeys from some of the best historic range in the coastal and river valley areas.
The land use practice that has done the most for turkeys is manure spreading during the winter
months. Since most of the corn grown is chopped for ensilage to feed the dairy cows, there is an
abundance of corn kernels left in the manure. In most cases, this has been a primary food source
of turkeys during the critical winter period when there is maximum snow depth and when the
acorn crop is scarce or non-existent.
Dairy farming is the primary reason Vermont had 12,000 to 15,000 wild turkeys in 1989, both a
spring and fall hunting season, and why turkeys are as far north as the Canadian border in the
Champlain Valley. Vermont supplies forty percent of the milk of the six New England states. It
is common to see winter flocks of fifty to one-hundred feeding on manure spreading and around
silage pits.
New Hampshire has relatively little farmland compared to other states. During 1986, the state
lost 68 dairy farms, or 13% of its remaining farms to the federal dairy farm buy-out program.
Most of those were lost in the southern counties or the turkey range. There were only 285 dairy
farms left in New Hampshire in 1989.
Vermont has far more wild turkeys because it has many more dairy farms. Vermont had seven
times the number in New Hampshire in 1989. Even though both states are approximately the
same size, there are some significant differences. Vermont is less forested, with far more farms.
Its soils are generally better, particularly in the counties bordering New York, where the majority
of farms exist. Vermont has more hardwood forest, whereas New Hampshire is extensively
covered with white pine, which has little value to turkeys and which acts to shade out the
desirable fruiting shrubs and apple trees. Southwestern Vermont has considerably milder winter
conditions and less snow depth. Turkeys even do well in northwestern Vermont on the Canadian
border, due to the warming influence of Lake Champlain, and the extensive dairy farming in this
large lake area. Vermont is subject to less development pressure. It is further away from East
Coast and the Boston area. Also the hilly topography of eastern Vermont, with the narrow
stream valleys, makes it less susceptible to development as compared to the relatively flat
topography of southern New Hampshire.
Another reason the relatively few dairy farms are so important in New England is because there
are few other types of farming, and there is little growing of grains other than corn. In other
states, turkeys make good use of oats, wheat, sorghum, millet and buckwheat. Most of New
Hampshire’s remaining dairy farms are along the narrow Connecticut River Valley, bordering
Vermont. The majority of farms in the southeast coastal plain and Merrimack River Valley have
been eliminated due to industrial development, suburban growth and high taxes. Those farms in
the Lakes Region have succumbed to summer resorts and second home development.
There is little former or abandoned farmland in early successional stages, which would produce
an abundance of fruiting shrubs. Mature tree growth or housing has taken over most of these
sites. Since forest openings are scarce, the pastures and hayfields make the best turkey brood
16
habitat where young turkeys can obtain the high protein diet of insects and seeds. More
importantly, turkey winter foods are most associated with this remaining farmland. Without the
existence of these dairy farms, it is probable that significant starvation and turkey losses would
have occurred during some of the hard winters, such as those of 1975, 1977, 1978, 1981 and
1986.
Another important type of feeding behavior at dairy farms is turkey use of the bunker, trench or
pit silos, which are filled with corn ensilage for feeding the cattle. Flocks frequently walk into
those trench silos to feed on the corn kernels in the ensilage. During hard winter conditions, use
is often on a daily basis. Trench silos at some farms are never used because the farm and
buildings sit in an exposed open area, with no tree cover close by.
Dairy cows and wild turkeys are “synonymous” with one another. Wherever there is a town with
some turkeys, the turkeys seek out the nearest farms. Dairy farms also represent a good
percentage of the remaining field or open land left in the state. The pastures and field borders
seem to be where the majority of the remaining barberry and rose bushes exist, as well as many
of the wild apple trees. Grassy seeps and agricultural weeds such as burdock are also present in
these fields. Therefore, turkeys gravitate to these farm sites to obtain the important winter foods.
Corn Plots for Turkey Winter Food
During 1995 approximately 30 dairy farms were selected throughout 5 counties, to pay them to
leave blocks of standing corn for turkey winter use. The money for this initiative came from the
earmarked turkey fund from the sale of the $5.00 turkey hunting permits. The payment rate was
$500 per acre, and the size of the plots varied from ¼ to 1 acre.
During the winter of 1995-1996 turkeys made little use of this corn because of a mild winter.
Deer ate most of the corn because of lack of mast, and because they did not yard up due to
minimal snow-cover.
For the second successive year farmers were paid to leave standing blocks of corn for the winter
of 1996-1997. It was hoped this winter would be a more accurate test of turkey use. However,
turkey use of standing corn was quite minimal at 25 plots at farms in 13 towns from 3 counties in
southwestern New Hampshire. The unusually good beechnut crop and little snowcover kept
turkeys in the woods. Deer eventually made significant use of most plots, and eliminated the
corn at some plots, even if one acre in size.
For the winter of 1997-1998 five corn plots of ½ acre in size were paid for in 3 towns in upper
Grafton County in the Connecticut River Valley. These plots received turkey use during most of
the winter. There were no corn plots in southwestern New Hampshire. Due to the cost of
standing corn, the heavy use by deer, and the uncertainty of winter conditions, and the
uncertainty of turkey usage, the use of the Department ear-marked turkey fund to pay for
standing corn was dropped. The emphasis shifted to buying crabapple trees, which retain their
fruit over the winter, as a method of addressing the lack of winter food sources for turkeys.
Crabapple Mini-Orchards
17
Since the re-introduction of wild turkeys to New Hampshire in 1975, turkey use of dried apples
left on trees over the winter has been well noted during deep snow periods. Crabapple trees have
been planted in recent years to beautify the landscape at schools, banks and MacDonalds. These
trees are hardy, produce apples in 2-3 years, and often are loaded with ½ bushels of fruit through
the winter. The idea was to establish some mini-orchards of crabapple varieties for turkey winter
food.
With the help of Charlie Williams, who was president of the New Hampshire Wild Turkey
Federation, and a Horticulture Professor at UNH, a list of 30 varieties of crabapples was
compiled, which retained fruit over winter and were winter hardy and disease resistant. Bailey
Nurseries in Minnesota shipped 270 trees of 12 varieties at a cost of $2,200. Newark Nurseries
in Michigan shipped 75 trees of two varieties at a cost of $525, and 19 trees of 3 varieties came
from a nursery in Maine. The average price per tree was approximately $6.50.
A total of 18 crabapple plots were planted at 14 sites in 13 towns, half on public land and half on
private land. A 4-foot high piece of wire fencing and a 2-foot plastic guard for the base of the
trunk, were put around each tree to prevent damage by deer and voles/mice. The number of trees
varied from 12 to 33, spacing in rows was 7 paces or 21 feet between trees, and virtually all plots
were in old fields or field edges, where there would be no competition from forest trees, and
tractor mowing could be done between trees.
Landowners were selected who had a high interest in wild turkeys and habitat management, had
suitable land and had turkeys using their land or living in the general area. The shipment of trees
comes in early May to the regional office in Keene. The trees are bare root stock in bundles of 5
or 10 trees.
The material cost of each mini-orchard has been approximately $250. About half is for the
actual cost of the trees, and half for the cost of the fencing and mouse guards. The landowner
has not had to pay anything. After several years of experimenting, the project settled on 20 trees
per plot, which includes 5 trees each of 4 varieties. During the past several years the one nursery
from Michigan has been the sole provider. The year 2003 was the sixth year that crabapple plots
have been disseminated by the four regional biologists. A total of 640 trees have been purchased
for approximately $10,000 annually to do 32 mini-orchard crabapple plots each year.
Turkeys have used the majority of the plots, although time to assess tree survival, fruit
production and turkey use during the winter months has been limited. Grouse have shown a
marked liking for the fruits in winter with as many as 9 grouse congregated together at several
sites. Late winter use by flocks of robins and waxwings has been noted. Crabapple trees that
have been well cared for by the landowner have grown fast, and produced an abundance of fruit
in several years.
Various problems have been noted over the six years. Major damage to the trees by deer and
mice has occurred during some deep snow winters. Better fencing and mouse guards are needed.
The logistics of moving these trees around the state has to be improved. The landowner recipient
should be expected to do the planting, fencing and some annual maintenance and asked to help
monitor the growth and wildlife use.
Further Decline in Dairy Farms
18
During 1989 there were only 285 dairy farms left in all 10 counties of New Hampshire. Now in
2004 there are less than 200 dairy farms left in the state, while neighboring Vermont has less
than 1,800 farms left (see Figures 2 and 3). The number of dairy farms appears to decline further
each year. There are now only 24 farms left in the original turkey release region of southwest
New Hampshire – 12 farms in the 23 towns in Cheshire County and 12 farms in the 15 towns in
Sullivan County. The southeast region of Rockingham/Strafford Counties has only a handful of
dairy farms left. The south/central region of Hillsboro and Merrimack Counties has perhaps 6
farms left in each county. The area of most dairy farms left in New Hampshire is in western
Grafton County in a tier of 10 towns directly bordering the Connecticut River. This county now
has the highest turkey harvest, and the most turkeys. As a whole the largest turkey harvests and
highest turkey densities are from the towns in the 3 counties directly bordering the Connecticut
River, because of the prevalence of farms and fields for winter food and good summer brood
habitat. As of January 2005, State Department of Agriculture data indicate there are only 137
dairy farms left in New Hampshire.
Another significant change during the past 15 years has been the decline of manure spreading
during the winter months. Many farms have built concrete bins to store the manure over the
winter. Less nitrates are lost as opposed to spreading the manure on the snow-cover in the fields.
There are increasing numbers of wintering turkey farm sites with 100 or more turkeys. This is
creating friction with some of the dairy farms. There is not enough natural food available for this
many turkeys congregated together, particularly during the deep snow-cover periods. Farmers
do not like turkeys in grain storage bins, or large numbers of turkeys eating the corn ensilage out
of the bunker and pit silos. There is also a concern by some farmers that turkeys could transmit
disease through their droppings. Beginning during winter 2004-2005 the University of New
Hampshire in cooperation with The Fish and Game Department and USDA Wildlife Services
will study this issue, with funding from USDA.
Turkey Flock Use of Backyard Birdfeeders
The main winter food source of all turkey flocks in New Hampshire in all towns in the state,
during periods of deeper snow-cover has become the sunflower seeds, cracked corn and other
seeds at the countless backyard birdfeeders. This feeding behavior developed gradually over the
past 15-20 years. Birdfeeders have become very popular. The building of new houses along all
roads in all towns has greatly increased the opportunity for turkeys to increase their range into
northern New Hampshire towns, into towns with little or no farmlands, and into heavily forested
portions of towns with little natural winter turkey foods available.
The sunflower seeds are a large component to the birdseed mixtures. Sunflower seeds are
considerably more nutritious than corn or acorns. Sunflower seeds have become a favorite
turkey food. More and more residents now feed flocks of 20 to 60 turkeys all winter.
Another significant change just during the past several years is the rapidly increasing number of
houses feeding wintering deer in their backyards. During the past two winters of doing winter
deer yard survey in towns from four counties the turkey project biologist noted that 85% of the
deer groups were going to backyards for corn and grain piles. More and more flocks of turkeys
are taking advantage of these deer feeding sites.
19
The Public Internet Winter flock Survey shows that a high percent of winter flocks are at
birdfeeders (Table 10). This is probably a major reason for the turkey population increase in
southeastern NH. During winter 2013, 400 flocks used birdfeeders or 22.7% of the total flocks,
compared to 432 flocks or 47.6% of flocks during winter 2014. Birdfeeder use was low during
winter 2013 since snow cover was relatively low because seven thaws created a lot of bare
ground sites.
During winter 2014 the greatest food usage was 432 flock reports (59.4%) at backyard
birdfeeders. The second highest category was 135 flock reports (18.6%) of turkeys using
corn/grain put out by people. The two categories combined become 78.0% of the flock
observations, of turkeys getting birdseed and grain provided at people’s houses.
The next highest category of food usage was of 77 flocks (10.6%) using apples/crabapples,
followed by 41 reports (5.6%) of acorn or beechnut use. When use of corn in manure, corn in
ensilage and standing corn were combined, the total of 26 flock reports was (3.5%) of corn use
from agriculture. Another 181 flock reports were recorded with the type of food usage listed as
“unknown”.
Distribution of Turkey Habitat in the State
Table 8 provides a summary of turkey habitat by WMU, as formulated in 2001. Table 9
provides a summary of important turkey habitat types by WMU. Since fields and farmland are
so important to turkeys in New Hampshire for summer brood habitat and a source of winter
foods and oaks/beech are an important mast food source for turkeys, the square miles of these
habitats were tabulated. The land or units in western New Hampshire or along the Connecticut
River Valley (D2, H1, H2) stand out as having the best remaining acreage of fields and crops,
and also some of the best turkey population densities as a result of this.
The square miles of beech/oak forest type show a significant difference from northern to
southern New Hampshire. The units in the North Country (A, B, C, D1) have a relatively small
percent of potential turkey habitat in the oak/beech forest type, as compared to the rest of the
units in the state.
The square miles of developed land per unit is also noteworthy. Southeastern New Hampshire
(units M, L and K) has significantly more developed land than elsewhere, as well as the highest
human densities. Since 2001, habitat loss has continued to occur as additional agricultural land is
put to other uses and both the human population and development increase.
Regional Severity of Winter Weather Conditions
Winter weather conditions can have a significant affect on wild turkey population growth
throughout various regions of the state. A severe winter can result in significant turkey
starvation losses and set back population growth for several years. In general, total inches of
snowfall are greater in the northern half than in the southern half of New Hampshire, and snowcover lasts longer in the northern half. Once snow-cover reaches a depth of 6 inches or more,
turkeys cannot get to foods on the ground. Seep or wet areas are visited a lot by turkeys when
snow-cover increases, but if a period of days of very low temperatures results, even the seep
20
areas become frozen. It is important to turkeys if one or more thawing periods occur during the
winter. Also, formation of crusts on the snow is good. This enables turkeys to walk around and
seek foods without burning a lot of energy. Turkeys flounder in deep loose snow and are more
susceptible to predators.
During the early years of turkey restoration, total snowfall was recorded for each winter month
of December, January, February and March. Also recorded were the number of winter days with
6 inches or more, and 12 inches or more of snow-cover. The snowfall data was obtained from
weather stations in Surry, Concord and Durham. The data from these three stations was then
averaged to represent the snowfall data for the southern half of New Hampshire. At that point in
time turkeys had not progressed much into the northern half of the state.
Three severe winters occurred over the time span 1969-1986. The winter of 1970-71 had 85
inches of snowfall with 107 days of over 6 inches of snow-cover. The winter of 1971-72 had 82
inches of snowfall during the December – March period. These two severe winters helped
eliminate the transplant of turkeys to Pawtuckaway State Park in Rockingham County and
decimated the statewide deer population. The worst winter for turkeys, which caused some
starvation, was 1981-82. While there was only 62 inches of total snowfall, the snow-cover came
early and stayed late. There were no thawing periods and 96 continuous days of 1 to 3 feet of
snow-cover.
A 10-year average (1969-1979) was made of total snowfall for the southern half of New
Hampshire and the snowfall for each subsequent year was compared to this. The 10-year winter
snowfall average by month was: December – 20 inches, January - 18 inches, February - 17
inches and March - 14 inches, for a total winter snowfall average of 69 inches.
Winter snowfall data should be monitored in northern New Hampshire, such as it is for deer.
The winter snowfall amounts will no doubt be significantly greater than from southern New
Hampshire. Potential turkey winter starvation losses will be much greater in northern New
Hampshire.
The most important limiting factor to turkey numbers and range expansion in New Hampshire is
access to winter food, because of deep snow-cover. However, during the past ten years or more
the winters “appear” to be getting milder, with more winter thawing periods, early spring greenups and less long-lasting snow cover.
The second most limiting factor is the lack of open or non-forested land. The edges of the open
field land is what produces most of the wild apple, barberry, rosehips, sumac, etc., which are
important turkey foods above the deep snow cover. The fields and pastures associated with the
dairy farms produced much of the turkey winter foods and also were the best turkey summer
brood habitat, since turkey restoration began in the state. More dairy farms have been lost during
the past ten years. As of 2014, there were only 130 dairy farms left in the state, compared to 435
during 1984. Most of the remaining dairy farms are in towns from the three counties (Grafton,
Sullivan, Cheshire) bordering the Connecticut River and Vermont. Thankfully there are still
1,500 horse farms in New Hampshire, and many small fields continue to be mowed throughout
the state, to provide hay bales to feed horses. These fields are good turkey brood habitat.
21
Winter turkey starvation losses do not appear to be significant in the northern one-third of NH
(Coos County and the northern portions of Grafton and Carroll Counties) even though farmland
is minimal and the density of human residences is relatively low. There appears to be enough
backyard feeders to help turkey flocks through the winter months. Another factor is the deerfeeding stations, where turkeys can get corn and grain, along with the deer.
E. HUNTING SEASONS ASSESSMENT
Types of Hunting Seasons and Methods
Of the two periods of hunting seasons for turkeys each year, the spring gobbler season is by far
the most popular and traditional in most states. Calling in gobblers with various calling devices
is a large part of the sport and tradition of turkey hunting. Only the male turkeys gobble and
display during the several spring months. This is the major reason spring turkey hunting is so
much more popular. Gobblers respond very little to calling during the fall months as it is not the
breeding season. Most fall flocks consist of one or more hens and their young, and the general
hunting technique usually involves trying to break up a flock and then trying to call some of
these in where the flock is re-assembling.
Turkeys have a high reproductive potential in that they hatch and average clutch of 10-12 eggs
and the great majority of all hens nest each year. Re-nesting is also the norm with turkeys
whereby if the first nest is lost to predation or abandoned due to disturbance, most hens will
make another nest. The young hens hatched during the early summer are themselves nesting the
following spring when they are less than one year old.
Initiating turkey hunting can start relatively soon after restoration or transplanting of turkeys to a
new region because of the high reproductive potential, the ability of turkeys to expand rapidly
because of their large home ranges, and the relative difficulty of hunting wild turkeys. Success
rates are typically in the order of 12%, i.e. only 12 out of every 100 hunters is going to
successfully harvest a gobbler during the spring season.
The great majority of hens have been bred before hunting begins in the spring. In almost all
states in the northeast the season begins in late April or early May, and ends in late May or early
June, depending on latitude. The hunting season does not begin earlier in the spring so as not to
interfere with the initial breeding activity. The season usually terminates by the end of May so
as not to interfere with the rearing of young after the peak of hatching in early June.
Time of day when turkeys can be hunted is also a factor in the regulations. During the spring
season the hunting hours are ½ hour before sunrise until 12:00 noon. Allowing only morning
hunting is thought to help reduce disturbance of hens which typically come off their nests to feed
for an hour or less in the afternoons, and also may mean less disturbance to other turkeys when
they go to roost in trees during the early evening at sunset. In any case, analysis of hunting
season data has shown that 80% or more of the spring gobbler season harvest occurs between the
hours of 5:00 and 8:00 AM.
The typical scenario for starting turkey hunting in a new state or region of a state is to start with a
limited spring season first. After the turkey population increases and expands its range, the
spring season may be lengthened, a fall archery only season started, and then a fall shotgun
22
season allowed when and if a stable turkey population develops, which has a spring gobbler
harvest of 0.5 to 1.0+ gobbler kill per square mile of turkey habitat. Bag limits are often later
liberalized by allowing 2 gobblers in the spring and/or 2 turkeys during a fall season.
A special permit is required to hunt turkeys in New Hampshire. This is one method of regulating
hunting pressure. Other methods include the possible use of lotteries, having different season
lengths in various wildlife management units, and allocation of the numbers of permits per
WMUs. In some states, permit-holders are allocated to hunt during specific weekly segments of
the month-long season.
During the past ten year segment the spring gobbler season has had the same season dates of
May 3 – 31st. The starting day of the regular season was whatever day of the week was May 3rd.
The 2-day weekend or Saturday & Sunday Youth Hunt has been the weekend preceding the May
3rd regular season start. The fall archery turkey season has remained the same 3-month period as
the September 15 – December 15 deer archery season. The 5-day fall turkey shotgun season was
initiated during fall 2006, and has been the five week days starting on the Monday of Columbus
Day during October.
Early Turkey Hunting Seasons
The first ten years (1980-1989) of limited spring gobbler hunting is summarized in Table 11. A
fall gun season for turkeys was not originally planned unless or until there was a significant
increase in turkey numbers and distribution. During fall turkey hunting, both toms and hens are
allowed to be hunted. New Hampshire did not have a turkey population large enough to
accommodate the harvest of hens from a fall gun season during preceding decades. However,
fall archery season for turkeys was allowed because it facilitates increased man-days of hunting
recreation with little or no impact on the resource. During the fall archery seasons of 1985
through 1989, 5, 3, 4, 2 and 12 turkeys, respectively, were harvested. The season length was
liberal and currently is three months in length. It runs concurrently with the fall archery season
for deer, or from September 15th to December 15th. The number of permit holders participating
was estimated at about 300 in 1989.
Current Spring Turkey Hunting Seasons
From the first limited spring season in 1980 with 31 gobblers harvested, it took ten years to reach
a harvest of 100 gobblers, with 142 harvested during the May 1989 season. With eastern
transplant areas soon open to hunting and the turkey population increasing in numbers in various
regions, the turkey season harvests began to increase rapidly. The increasing numbers of new
turkey hunters also contributed to this greater harvest. It took until 1989 to reach 1,000 permit
holders, and the number has increased significantly to where there were 16,000 permit holders in
2003.
Table 12 shows the total yearly spring harvest from 199 to 2014. From the 1994 to the 1995
season the harvest went from 334 to 536 gobblers, or about a 60% increase. Increases since then
have typically varied from 20 to 30%, except for the years 2002, 2003 and 2004 where the
harvest stayed at approximately 2,600 gobblers, due to two successive summers of below longterm average hatching success due to poor spring weather. It took a period of 19 seasons (19801998) to reach a harvest of 1,000 gobblers (1,015 in 1998). It then took only three more seasons
23
to reach a harvest of 2,000 gobblers (2,266 in 2001). Kill again increased from 2005 through
2008, while varying from year to year it has averaged about 3,900 per year.
As of the May 2003 season, the original release area of the state (unit H2 = 388 gobblers) still
recorded the largest number of turkeys harvested, followed by two other units in the southwest
region of the state: (unit K = 339 gobblers), and (unit H1 = 317 gobblers). Units B, C1, C2 were
opened to hunting during the May 2003 season and 59 gobblers were taken in this northern
region. Only units A1 and A2 near the Quebec border remain closed.
Only Cheshire and Sullivan Counties have perhaps reached their carrying capacity for turkeys,
after a period of 29 years since the original release in 1975. The other 8 counties still appear to
have expanding turkey populations. While northernmost Coos County (harvest = 139 gobblers)
is large, its potential is not great because it is the most forested county, with perhaps the hardest
winter conditions. The north central region of Carroll/Belknap Counties (harvest = 318
gobblers) in the Lake Winnipesaukee/Maine border area appears to have a significantly
increasing turkey population, even though few dairy farms remain in this region.
The southeastern region of Rockingham/Strafford Counties (harvest = 196 gobblers), has
produced a relatively low season harvest for years, even though the most turkey transplants were
made to this region. This is now the most developed region of the state, with the least farmland
and the most posted land. During the past two years, turkey harvest in the northern half of
Strafford County has been increasing.
Table 13 gives the 2005-2014 spring turkey kill by WMU. Statewide, the kill seems to be
leveling off at approximately 4,000 gobblers. It varied from 3,042 gobblers during May 2005, to
4,550 gobblers during May 2013. The average harvest during this 10-year segment was 3,807
gobblers. The Youth Hunt harvest varied from 389 during May 2005, to a high of 590 during
May 2013, and the 10-year average has been 503 gobblers or 13.2% of the regular season spring
harvest.
Turkey Harvest Densities
Figure 4 shows the 1980 through 2014 spring turkey harvest for each wildlife management unit
and statewide. It also shows the corresponding harvest per square mile of habitat for each unit.
These graphs include a threshold harvest rate of 0.5 per sq. mile which is considered a general
goal representing a threshold for considering allowing additional fall harvest during a limited fall
shotgun season. The harvest in recent years has shifted from southwestern to southeastern New
Hampshire. For years the highest harvests were in the western units of H1, H2, K and D2. For
approximately the past four years the southeastern units of J2, L and M have had the higher
harvest. Average kill per sq. mile in southeastern units are J2 (0.76), L (0.89) and M (0.74)
while in western units they are D2 (0.57), H1 (0.87), H2 (0.65) and K (0.91). It probably took
longer for the later turkey transplants to southeastern NH to grow and expand. The southeastern
region also has a much greater human density, and hence more turkey hunters. While farmland
in southeastern NH is greatly diminished, there is sufficient brood habitat, and an abundance of
birdfeeders for winter food.
Trends in Turkey Harvest and Kill Per Square Mile in WMU’s
24
The spring season harvest shows a leveling off for the past several years at an average of about
4,000 (Table 12). Further upward trends may be unlikely but if the turkey population continues
to increase in the units in the eastern and northern section of the state, the statewide yearly
harvest total should also increase. The hunter success rate may be leveling off. Since turkey
hunting was new to the state the success rate was only 3 to 5% the first few years, then increased
to about 10 to 12% after ten years, and is currently at about 16-17% for the past several years.
The number of permit-holders rose each year, but has now leveled off at between 18,000 and
20,000 hunters (Table 12). Currently, there are approximately 60,000 hunting license holders in
NH. During year 2013 there were 18,663 resident turkey hunters and 1,399 non-resident persons
who purchased a turkey permit. Therefore, about 1 out of 3 hunters hunts turkeys.
Age Classes of Turkeys in Harvest
Over the course of 35 hunting seasons in New Hampshire, there have almost always been more
juvenile gobblers (jakes) registered than adult gobblers (toms). This is understandable since
turkey hens produce an average of 12 young each year, of which half or 6 are going to be
juvenile males. Turkeys are not long-lived, having a maximum life span of approximately 8
years, and an average life span of only 1½ years for males. New Hampshire typically has
approximately 55% jakes and 45% toms in the spring gobbler harvest, or a juvenile:adult harvest
ratio of 1.30 to 1.0. Table 11 lists the harvest ratio for 1980-1989.
Table 14 has the juvenile/adult harvest ratios for the past ten years, and the breakdown of age
classes in the harvest each year. For years prior to this there were usually more jakes than toms
in the spring harvest. This was still the case during May 2005 when the harvest ratio was 1.11
jakes to 1.00 toms. Ever since then or for the past nine years there have been more toms in the
harvest than jakes, with the 9-year average being 0.58 jakes to 1.00 toms. With the growth of the
turkey population statewide there are now more adult gobblers living longer in the turkey
population, and hunters can be more selective in harvesting a tom rather than a jake.
Every turkey brought to a registration station since the first season has had spur, beard and
weight measurements taken, and there is a volume of data to follow any trends in harvest.
The following are the averages for the past ten years for each of the five gobbler age categories:
36% 1-year olds, 39.0% 2-year olds, 19.4% 3-year olds, 4.9% 4-year olds and 0.73% 5+ year
olds. It is apparent that the one and two year old gobblers comprise approximately 75% of the
annual harvest and that four and five year olds are relatively scarce. The small number of long,
sharp spurs from registration stations confirms there are relatively few old toms in the state
turkey population, and that the turkey population is hunted relatively hard.
Fall Archery Seasons
The first limited spring shotgun season was in 1980, and the first fall archery season was
initiated five years later in 1985. It was quite feasible to allow archery hunting because the low
hunter success rate by bow and arrow would not impact on the growth of turkey populations.
For the first three years the season opened the same day as the opener for the fall deer archery
season and went to late October, for a season length of approximately 5 ½ weeks. For the first
four seasons the number of participating hunters varied from 200 to 285 archery hunters. There
was an archery hunter questionnaire for these first four seasons. The harvests were quite low,
25
being only 5, 3, 4 and 2 turkeys respectively. Archery hunting was only just beginning to gain in
popularity and it took some time to learn about hunting this new species.
The number of participants and number of turkeys registered began to grow after the 1989
season. At this time the season was lengthened to be concurrent with the fall deer archery
season, or a 3-month season of September 15 – December 15. The fall harvest reached 100
turkeys, with 132 turkeys taken in 1995. During the 2003 questionnaire it was indicated that
36% of those hunting during the spring season also participated during the fall archery season. It
is therefore estimated that 5,400 hunters spent some time archery hunting for turkeys during the
fall 2003 season. During the fall 2003 archery season a record 270 turkeys were taken, and
another record was set during the 2004 fall season with 341 turkeys registered. Table 15 records
the archery harvest from 1993-2004.
Table 16 has the fall shotgun and fall archery turkey harvests for the past ten years (2005-2014).
The 5-day shotgun fall season was initiated during 2006. During 2006 this shotgun harvest was
122 turkeys, there was a high of 719 turkeys taken during fall 2010. The main reason for this
spike in harvest was due to eastern units J1, J2, L and M being open for this first time. The 9year average was 433 turkeys during the 5-day October season or 62.4% of the fall harvest.
A few hunters have suggested that the fall shotgun season be lengthen by adding a weekend. A
cautious approach has been taken because experience in other states has shown that too liberal a
fall season can negatively impact upon the turkey population for the following spring season.
During the NH fall turkey seasons the highest percent of the harvest has been of the adult hen
segment. Taking too many hens in the fall harvest could slow turkey population growth in areas.
An experienced turkey biologist from the NWTF has advised that the fall season turkey harvest
not be more than 20% of the spring harvest total.
The 3-month fall turkey archery season has varied from a harvest of 189 during fall 2014, to a
high of 418 turkeys during fall 2007, with a 9-year average of 261 turkeys or an average of
37.6% of the total fall harvest. Since the advent of the fall shotgun season, the percentage taken
by archery has declined, probably because it is easier to take a fall turkey by shotgun than by
archery.
Status of northern WMUs
The six poorer quality habitat units of A, B, C1, C2, E and F in northern NH, which have more
severe winter conditions, little farmland and low human density, have not shown significant
growth in the past ten years, which was not unexpected. During the spring 2014 season their
combined harvest of 196 turkeys, was only 5.6% of the statewide season total.
A criterion that has been used for when to open a unit to allow some fall shotgun season, has
been when a unit has reached a spring season harvest of > 0.5 gobbler kill per square mile.
These units are a considerable distance from this goal. These units do not have turkey
populations or spring harvests high enough to safely support a fall shotgun season. A liberal
spring gobbler season length and a fall archery season are sufficient.
Season Regulation Changes
26
As the turkey population increased in range expansion and numbers, various hunting regulations
became more liberal. The first two seasons were 9 days long, then went from 18 to 20 days for
four years and settled at a season length of 29 days since 1989 to the present in 2004. The
starting date varied during the first ten seasons, ranging from May 4th to as late as May 16th.
Radio telemetry research in neighboring Vermont indicated that the majority of hens began
incubation between May 4th and May 8th, and that state had a May 3rd opening day for the
hunting season for many years. Field studies in New Hampshire indicated a similar time pattern
for breeding, nesting and hatching. For years the starting date was selected so that it was not on
a Saturday or Sunday, so as to lessen hunting pressure on opening day. As the turkey population
multiplied and turkey hunting opportunity became available in most regions of the state, the
switch was made to May 3rd.
For the first two seasons in 1980 and 1981, the number of permit-holders were drawn by a
lottery, and assigned to one of several zones in which they had to hunt. This lottery and zone
system was discarded after these two years because it was shown that hunting success rate was
quite low, the number of permit applicants was not large and the rapid increase in turkey
distribution could tolerate the hunting pressure.
Several changes over the years helped increase hunter satisfaction. Hunters were allowed to use
one or more decoys. The end of the daily hunting period went from 11:00 AM to 12:00 noon. A
separate small turkey permit or stamp had to be printed and distributed around the state to license
agents for many years. During 2001, the permit became a “tag” on the hunting license, similar to
the deer and bear season tags. “Companion hunting” was finally allowed in 1994. This was a
very popular change for hunters. After a hunter registered a turkey, he could still assist another
hunter by calling turkeys.
During the first ten seasons a hunter questionnaire had been mailed to permit-holders in order to
determine such things as towns or areas hunted, number of man-days of hunting, hunting
pressure, hunter interference, number of turkeys heard and seen, etc. No hunter questionnaire
was sent out for years until 2002 when the Turkey/Small Game Committee of 5 biologists sent
out a 2-page questionnaire to 1,000 permit-holders, in order to assess hunter opinions about a
possible youth hunt, a possible fall shotgun season and degree of hunting pressure.
The questionnaire indicated that 36% of those hunting during the spring season also participate
during the fall archery season; that 84% support a spring youth hunt; that 67% rate turkey
hunting in the state as good or excellent; that 88% judged hunting pressure as light or moderate,
and would not welcome restrictions to when or where they could hunt in the state.
Over the years, additional units have been opened to various seasons as the turkey population has
increased and provided additional harvest opportunity. In recent years, additional consideration
was given to several means to liberalize the turkey hunting seasons. The best turkey population
units could perhaps have a 2-gobbler bag limit during the spring gobbler season, and the fall
shotgun season could have a weekend added to the five weekdays. However, this possible
liberalization was put on hold the past several years because of: the advent of the two turkey pox
viruses the past three years and the unknown loses to the viruses, the below average hatching
success several years, and the slowed growth in annual turkey harvests.
27
F. RESEARCH FINDINGS AND NEEDS
A substantial number of turkey research projects have been conducted in New Hampshire since
successful turkey restoration began in 1975. There have been 5 field studies with radio telemetry
turkeys, and 3 studies with imprinted captive turkeys to study nutrition and metabolism aspects.
The field work monitored turkeys in 6 of the states’ 10 counties. The University of New
Hampshire was a partner, and a Master of Science thesis resulted from each study. Appendix II
provides citations for New Hampshire studies.
The main source of funding for these research studies was from dedicated turkey permit revenue
and Federal Aid funds. Additional monies came from the University of New Hampshire. Its’
research facility in Brentwood, site of the former Department pheasant farm, was used to house
the captive turkeys for the several nutritional studies. For several studies some monies were
contributed from the New Hampshire Turkey Federation and from the National Wild Turkey
Federation. The Blue Mountain Forest Association, a preserve of 23,000 acres, allowed the use
of their land and provided lodging for one study.
1980 - 1981 Study of Two Turkey Transplants to Strafford/Rockingham County Area
The objective of this study was to document the winter range use and requirements of turkeys
with emphasis on winter food usage. This was the first major radio telemetry study of turkeys in
the state since the initial release of 25 wild turkeys in 1975. Size of winter home ranges of 5
flocks were 1,860, 879, 521, 1,502 and 455 acres, for an average of 1,042 acres. In square miles
this was 3.0, 1.42, 0.84, 2.42 and 0.73, for an average of 1.68 square miles. A total of 806 winter
feeding sites were inspected over 43.4 miles of trails. Over 80% of feeding sites were in
woodlands, 13.3% along edges of fields, pastures and power-lines, and 5.1% were in fields. Of
the 806 sites, 218 (27%) were in some type of wetland. Scratching for acorns occurred at 227 of
the feeding sites and accounted for 31.4% of the total feeding activity. Feeding on acorns
decreased markedly as depth of snow-cover increased. Next to mast, wetland plants were the
most important constituents of the turkeys’ winter diet. Most of this activity was at spring seep
sites, which have less snow-cover than surrounding habitats. Intensive use of sensitive fern was
responsible for most of the wetland feeding, and accounted for 20.7% of the total winter-feeding
activity. The spore heads have a high protein value. Other wetland foods used to a much lesser
extent were seeds from sedges and the fruits of winterberry bushes. A wide variety of other
foods were used, such as standing corn, beggar-tick, burdock, rose hips, wild apples and fruits
from barberry bushes. Scratching beneath white pine and hemlock trees occupied an estimated
15.6% of the feeding activity. Examination of droppings indicated that white pine seeds made
up some portion of the diet. Scratching for blue beech seeds accounted for 6.0% of feeding
activity when snow-cover was minimal.
1987 - 1988 Radio Telemetry Study of Nesting Hen Turkeys in Sullivan/Cheshire County
and Rockingham/Strafford County
Predation was very high both years of this study. Ten of 21 hens (48%) were killed in 1987, and
11 of 29 hens (39%) in 1988. The combined total for the two years was 21 of 50 hens (42%)
killed by predators. While predation of hens was a high 42%, predation of nests was even
higher. Of 40 nests monitored over the 2-year period, 18 of 40 nests (45%) were destroyed.
Coyotes and fisher appeared to be the major predators on adult hens. Fisher have the ability to
28
knock turkeys out of a roost trees at night. Coyotes can be particularly destructive during the
nesting period because they are very active near the same farm and field areas where turkey hens
nest and raise their young. Evidence indicated that coyotes and fisher killed 18 radio hens. The
following were the causes of mortality of radioed hen turkeys during the 1987-1988 study: 11
coyotes, 7 fisher, 2 predators unknown, 1 great-horned owl, 2 road-kills and 1 natural injury.
Fourteen radioed hens left over from the summer of 1988 were monitored through the 1989
nesting season. Five of these 14 hens or 36% were lost to predation and one was killed by a car.
Evidence indicated that coyotes killed 3 hens and fisher killed 2 hens. The 1987-1988 telemetry
study confirmed the affinity of hen turkeys to nest near fields and then to use them as brood
habitat. The great majority of hens both years nested close to hay fields, pastures or overgrown
fields. During the summer of 1987 all nests were quite close to fields. The distance of nests to
fields varied from 10 to 200 feet and averaged 80 feet. Seven of 12 nest sites (58%) were within
30 feet of the edge of a field. Of the 3 re-nesting hens, 2 of their nests were in hayfields and one
on the brushy edge of a field. During the summer of 1988, 17 of 20 nests (85%) were within 100
feet of hayfields or pastures. Of these 17 nests, 6 nests were only 10 feet from a field edge. Two
nests were greater than 100 feet, but still close to fields. One nest was 150 feet and one nest 500
feet away from a field edge.
Several years after turkeys were introduced into southwestern New Hampshire in 1975, turkey
nests began to be reported in hayfields. By 1985 this was a common phenomenon throughout
the turkey range in the state. It became obvious that virtually all of these nests were second nest
attempts. There is not sufficient grass growth for cover in fields when hens establish their first
nests during early to middle April. During most years active dairy farms do their first hay
cutting the first week of June. Since approximately 1995 the great majority of dairy farms
destroy turkey nests each year when hay-mowing. Some farms report 4 to 6 nests mowed over,
and more hens are now being chopped up by mowers, rather than being flushed. The newer
tractors are larger with closed-in cabs and move faster. Many turkey nests are also lost from
mowing in fields other than dairy farms. There appears to be little solution to this increasing loss
in numbers of turkey nests and hens. While flushing bars on tractors have been used for years in
the mid-western states to flush pheasants and ducks, they have never been a tradition in New
England states. During summer 1987 the distance of nest sites N=13 from winter capture sites
varied from 14 mile to 2 ¾ miles. Six nests from western New Hampshire averaged 1.77 miles
and 7 nests from eastern New Hampshire averaged 1.00 miles. The combined average was 1.81
miles. Several hens traveled long distances of 24, 18 and 9 miles. This tendency of wild turkeys
to rapidly expand their range into new habitat is confirmation of why a small New England state
needs relatively few turkey transplants to develop a statewide turkey population. During summer
1988 distance of nest sites from the capture/wintering sites of 22 radioed hens was an average of
2.38 miles. The eastern New Hampshire hens moved significantly lesser distances or an average
of 1.24 miles, as compared to 2.06 miles for the western New Hampshire hens. Long distance
movements were 3 hens crossing the Connecticut River into Vermont to nest, moving 17, 6 and 6
miles respectively. Another hen moved 15 miles north.
2001 - 2002 Winter Radio Telemetry Study of Hen Turkeys in Sullivan County
The major objective of this study was to determine the influence of food availability and
supplemental feeding on winter survival and population dynamics of northern wild turkeys. The
following is a brief summary of the two years of research: During winter 2001 a total of 235
29
turkeys were trapped, of which 25 hens were radioed. During winter 2002 a total of 182 turkeys
were trapped, and another 25 hens radioed. Different amounts of grain were given to various
groups of these turkeys in order to measure and compare their energy expenditure, weight loss,
activity and winter home ranges. The radioed hens were injected with double-labeled water.
Four distinct flocks were trapped and re-trapped after a 15-22 day period, and the energy
expenditures calculated. During winter 2001, 19 of 25 (76%) were recaptured, and 13 of 25
(52%) during winter 2002. Turkeys were exposed to a hard winter 2001, with frequent
snowstorms and snow depths of 43-85 cm, which limited ground forage and turkey mobility. The
winter of 2002 had minimal snow, which resulted in much bare ground conditions and reduced
use of feeding sites. As a result, winter home ranges were 6-33 ha in 2001, versus 22-283 ha in
2002. Most turkeys maintained weight to +0.1kg during the trial period. Body weight of both
juveniles and adult hens were about 5% less in 2001 than 2002. Mean body fat was similar
across treatment groups. Mean body fat was about 417 gm in juvenile hens, and 657 gm in adult
hens. Fat deposits represented 12 and 17 days of their required energy demands or FMR (Field
Metabolic Rate), respectively. Despite dramatic differences in environmental conditions between
the hard and easy winter, energy expenditure was similar both years and among the treatment
groups. In hard winter 2001, turkeys adapted to severe conditions by restricting distances moved
and activity, and by remaining close to the feeding sites.
Bio-energetic measurements during the two different winters point to several key factors
concerning the winter ecology of wild turkeys: The FMR of juvenile and adult hens was
remarkably similar and relatively low during two disparate winters, indicating that they seem
adapted for low energy expenditure regardless of winter conditions. Most hens maintained their
energy balance during the severe winter, indicating that the supplemental grain provided
maintenance energy when natural foods were not available. The only treatment group that
experienced an energy deficit had only minimal food available in the corn kernels found in some
old manure piles. Although turkeys have appreciable fat deposits, extended periods (two weeks)
without access to food will probably result in mortality, with juveniles succumbing first. Food
availability is the key habitat factor influencing winter survival of northern wild turkeys.
The two years of metabolic research on free-ranging flocks of wild turkeys in various towns in
northern Sullivan County was successfully concluded. Turkeys lower their daily energy
expenditure and behave similar to wintering deer by: 1) using their body fat reserves, 2) reducing
distances moved, and 3) staying (roosting) near the food source. Without the abundance of
backyard birdfeeders, severe winters with long-lasting deep snow cover could be devastating to
turkey flocks in New Hampshire, with significant starvation losses.
2001 – 2002 Study of Home Range, Nesting Ecology and Survival
A 2-year study in northern New Hampshire during 2001 and 2002 monitored 45 radioed hens in
several towns in western Grafton County along the Connecticut River Valley and some adjacent
towns on the Vermont side of the Connecticut River. Survival of hens was similar to rates
reported in other northern states. Survival was lowest during spring (76%) when hens were
highly vulnerable, as most mortality (89%) was associated with incubation and brood rearing
during spring and summer. Twelve of 44 hens survived > one year, yielding a sample of 56 hens
to calculate survival rates. Nineteen known mortalities occurred during the study. Two died
during the winter, 12 during the spring and 5 during summer. Twelve or 63% of hen mortality
30
occurred during reproductive efforts (May-July). Most were from predation: 3 hens killed
during laying, 6 hens during incubation on nests and 3 hens during brood rearing.
Predation included 5 by coyotes, 2 by red fox, 2 by bobcats, 1 by great-horned owl, and 4 were
unknown. Other deaths were 2 from car kills, 1 from hay mowing, 1 from fence entanglement
and 1 unknown. Overall productivity of nesting hens in this study was lower than expected. The
nesting rates of adult hens (88%) and juvenile hens (58%) were lower than that in other northern
states. The average clutch size of 10 eggs was similar to that from other states, as was nesting
success (52%), degree of re-nesting (63%), and the hatching success rate (60%) from re-nests.
The survival rate of poults at 0 to 14 days post-hatch was 38%, and at 0 to 21 days post-hatch
was 32%. Poult survival was 39% lower in 2002 when spring rainfall was abnormally high, than
in 2001 when spring weather was normal.
Annual home ranges of radioed hens averaged 5,745 acres (9.3 sq. mi.), similar to that for hens
reported in other studies. Winter home ranges in 2001 of 14.8 acres, and in 2002 of 143.3 acres
were among the lowest reported in from other states. These small home ranges are a result of the
severe winter conditions in northern New England, and the turkey dependence and use of
agricultural food on dairy farms in northern New Hampshire. Essentially, these home ranges
represented the small area of flocks moved from the trench silos and/or manure piles to roost
sites. The average dispersal distance from wintering site to nesting site of radioed hens was 2.48
miles for adult hens and 6.57 miles for juvenile hens, and both were similar to the distances
measured in other northern states.
2004 – 2005 Winter Agricultural Damage by Wild Turkeys in New Hampshire
This research study was started during spring/summer 2004 and will continue during winter
2005. It was proposed by the Fish & Game Department and Wildlife Services, funded with a
grant from the Wildlife Services Agency of the United States Department of Agriculture
(USDA) based in Concord, and implemented by the University of New Hampshire. The
Research objectives are: identify those farms experiencing winter congregations of wild turkeys;
identify specific concerns of those farmers; test for the presence of Salmonella in turkey fecal
samples collected at a sample of farms during winter 2004-2005; and describe and contrast the
adjacent forest habitat at farms.
Large flocks of turkeys at dairy farms from four counties along the Connecticut River Valley
have raised concerns about the local and seasonal density of wild turkeys. Some farmers have
reported damage to or use of corn ensilage in bunker silos during the winter months by flocks of
100 or more turkeys. Some dairy farmers have expressed concerns about the potential spread of
disease to cows from turkey feces, particularly Salmonellosis. Some dairy farmers from other
states in the Northeast have similar concerns.
Farms with large wintering flocks of wild turkeys were identified by the Fish & Game
Department. The study area was divided into two regions, the Northern Region (north of
Lebanon) with 12 farms, and the Southern Region (south of Lebanon) with 10 farms. During
July 2004 research technicians met farm managers and gave them a survey of 22 questions that
included trends and observations about turkeys and other wildlife, damage and concerns. The
technicians also mapped turkey feeding and roosting sites.
Of the 22 farms surveyed, size of winter flocks was: 25 to 50 turkeys (23%), 51 to 100 (23%),
and greater than 100 turkeys (32%). Forty-five percent of the farms fed spoiled ensilage to
31
turkey flocks, left some standing corn and spread manure in fields in order to help wintering
turkeys and to help keep turkeys from feeding in the bunker silos. The majority of farmers
(82%) had a positive or neutral attitude toward wild turkeys, but 25% of Northern farms had a
negative attitude compared to 10% of Southern farms. The two main concerns of dairy farmers
were disease (55%), and feed contamination (41%). The most popular response by farmers for
methods to control winter flock congregations was increased hunting opportunity and bag limits.
Other avian species identified as threats on farms included pigeons, blackbirds, starlings,
waterfowl and geese. When asked which wildlife species pose threats on their property, bear
was the most in the north (58%), and blackbirds and starlings in the south (70%).
2004 New Hampshire Residents’ and Hunters’ Opinions on the Status and Management of Big
Game Populations, (416 pp.)
This survey was conducted for the Fish & Game Department by Responsive Management of
Harrisonburg, Virginia, to determine public opinions on and attitudes toward populations and
management of the following big game species: deer, bear, moose and turkey. The study
entailed a telephone survey of 519 New Hampshire residents, which included 109 hunters.
Responses were favorable toward the Department, with a majority (63%) rating the
Department’s performance at 8 or higher, on a scale of 0 to 10. A majority (53%) of respondents
rated their interest in wildlife as high, 38% as medium, and 7% low. A majority (74%) knew a
moderate or great deal about wildlife in general. A majority (87%) approved of legal, regulated
hunting as a way to manage game populations: 64% strongly approved and 23% moderately
approved, while only 7% disapproved.
There is a 52-page segment of the report addressing the public attitudes toward wild turkey
management. The following is a brief summary of the survey findings. The following ratings
were given to the Department’s wild turkey program: 24% excellent, 28% good, 8% fair, 2%
poor and 38% didn’t know.
A majority (77%) of the hunter segment of respondents rated the turkey program in their county
as excellent or good because they thought the turkey population is at the right size. Only 10% of
hunters rated the program as fair or poor. A majority (61%) of respondents think the wild turkey
population in their county should remain the same; 12% think the population should be
increased, and 9% think it should be decreased. Of the hunter segment (109 hunters), 60% of
these hunters think the wild turkey population in their county should remain the same. Note: It
should be remembered that answers and attitudes from this type of survey might be somewhat
different if a significant portion of the 16,000 turkey hunters in New Hampshire were sampled.
The great majority of hunting license holders are not turkey hunters. Approximately 22 of the
109 hunters (20%) in the total of 519 respondents in the survey are estimated to have been turkey
hunters.
Each of these research studies has contributed significantly in learning about the ecology and
population dynamics of turkeys throughout the different regions of New Hampshire. Each has
led to a better understanding of how to protect and develop a sustainable turkey population
throughout the state, how to best manage turkey hunting seasons and how to reduce potential
conflict of turkeys with agricultural interests. New Hampshire, as well as neighboring Maine and
Vermont, has hard winter conditions, with long-lasting deep snow-cover. Since turkeys are
primarily ground feeders, lack of winter food sources has always been a primary concern. The
32
studies with captive turkeys contributed greatly to better understanding how turkeys can survive
hard winter conditions, how various winter foods contribute to energy needs, and what
conditions will likely result in mortality. The field research during the winters of 2000-2001 and
2001-2002 in Sullivan County measured turkey weight gain or loss and energy needs under
actual winter conditions with groups of free-ranging radioed turkeys. It was found that turkeys
had some winter survival behavior similar to deer, in that to conserve energy and weight loss
turkeys reduced their daily movements and roosted very close to the primary food source.
Several Viruses Present in Wild Turkeys in Northeastern States – Ted Walski
During November 3, 2011 was the first official record of the avian pox virus and/or
lymphoproliferative disease virus (LPDV) in New Hampshire, with two toms collected in the
town of North Haverhill (Grafton County). During the next three years the two viruses have
killed turkeys throughout NH, as well as the neighboring states. The turkey project biologist has
monitored and recorded cases each year. The hunting registration forms during the spring and
fall hunting seasons have helped in determining towns and sites with pox turkeys, as have reports
from the Public Internet Summer Brood Survey and the Public Internet Winter Flock Survey.
During October 2012 six turkey specimens were sent to the Veterinary Lab at UNH, and were
diagnosed as having both viruses. During the May 2013 hunting season 100+ turkey feet
donated by hunters from NH and Vermont were sent to the SCWDS Lab in Athens, Georgia. A
relatively high 71% tested positive for the LPDV virus. Appendix III provides additional
background information on the viruses in New Hampshire and the northeast.
2013 Evaluating a Monitoring Survey as a Management Tool for Eastern Wild Turkeys in NH
(78 pgs.)
The 2012 Public Internet Summer Brood Survey and the 2012 Public Internet Winter Flock
Survey added a new section or questionnaire to help assess public attitudes about wild turkeys in
the state. Data from these two surveys were compiled and analyzed as part of an M.S. Thesis by
a University of NH graduate student/Department employee. The public overwhelmingly liked
wild turkeys and supported the F&G Dept.’s efforts to census the number and distribution of
turkeys in the state. The opinion results were: strongly dislike (0.002%), dislike (0.003%),
neutral (8.45%), like (23.37%) and strongly like (71.70%).
2005 Winter Agricultural Damage by Wild Turkeys in New Hampshire (35 pgs.).
Summary: During July 2004 University research technicians met farm managers and gave them
a survey of 22 questions, and mapped turkey feeding and roosting sites at the farms. During the
winter of 2005 a university graduate student and the Department turkey project biologist
collected turkey droppings four times at these farms. These droppings were tested at the UNH
Veterinary Diagnostic Lab. No salmonella was found in droppings from these farms. The
university submitted a 35-page progress report: Winter Agricultural Damage by Wild Turkeys in
New Hampshire. The majority (82%) of farmers had a positive or neutral attitude
towards wild turkeys. The species posing the most threat to their property were bears in the
north (58%), and blackbirds/starlings in the south (70%).
Procedures: A formal study proposal was submitted during spring 2004. It was proposed by
the Fish & Game Department and Wildlife Services (former Animal Damage Control), and
33
implemented by the University of New Hampshire. Farms with large wintering flocks of wild
turkeys were identified by several biologists from the Fish & Game Department. The study area
was divided into two regions, the Northern Region (north of Lebanon) with 12 farms, and the
Southern Region (south of Lebanon) with 10 farms. During July 2004 research technicians met
farm managers and gave them a survey of 22 questions that included trends and observations
about turkeys and other wildlife, damage and concerns. The technicians also mapped turkey
feeding and roosting sites.
Droppings were collected at the sample of dairy farms during the 4 winter months of winter
2005, by a university graduate student, assisted by the F&G Dept. turkey project biologist. The
droppings were examined at the UNH Veterinary Diagnostic Lab at Durham, New Hampshire.
Results: Of the 22 farms surveyed, size of winter flocks was: 25 to 50 turkeys (23%), 51 to 100
(23%), and greater than 100 turkeys (32%). Forty-five percent of the farms fed spoiled ensilage
to turkey flocks, left some standing corn and spread manure in fields in order to help wintering
turkeys and to help keep turkeys from feeding in the bunker silos. The majority of farmers
(82%) had a positive or neutral attitude toward wild turkeys, but 25% of northern farms had a
negative attitude compared to 10% of southern farms. The two main concerns of dairy farmers
were disease (55%), and feed contamination (41%). The most popular response by farmers for
methods to control winter flock congregations was increased hunting opportunity and bag limits.
Other avian species identified as threats on farms included pigeons, blackbirds, starlings,
waterfowl and geese. When asked which wildlife species pose threats on their property, bear
was the most in the north (58%), and blackbirds and starlings in the south (70%).
Conclusions: The majority of dairy farmers had a positive or neutral attitude toward wild
turkeys. This research study should help greatly in reducing the fears of dairy farmers about
disease transmission and feed contamination from wild turkeys.
G. SUMMARY AND CONCLUSIONS
The pre-settlement population in New Hampshire was estimated to have been approximately
5,000 wild turkeys, mostly in the southern half of the state. The range pretty much followed that
of the oak/chestnut forest. Settlement caused most towns to become about 85% cleared. There
were no resource agencies to protect and manage wildlife, and most wild turkeys were extirpated
by the end of the Revolutionary War.
Effective restoration did not begin until the 1960s when the waterfowl cannon net was adapted
for capturing wild turkeys and the Northeast Wild Turkey Technical Committee was formed to
yearly meet and discuss turkey research and management findings and needs. The two member
states of New York and West Virginia trapped wild turkeys and sent them to various New
England states. The 1969-1970 transplant of 27 West Virginia turkeys to New Hampshire failed
because of a combination of reasons: these turkeys came from a state with less severe winter
conditions, there was no farmland at the release area, and New Hampshire experienced two of
the severest winters of the century. The 1975 release of 25 New York turkeys was quite
successful because the release was in good farmland and these turkeys were used to deep snow
winters in the Allegheny Mountains. Most of the subsequent 15 transplants within New
Hampshire did well. Transplanting turkeys within the state was completed in 1995. There are
now some turkeys in every town in all 10 counties.
34
Legislation was passed in 1977 to give the Fish and Game Department Director the authority to
set seasons and hunting regulations, and to prohibit the importation, propagation, sale or release
of undesirable game farm turkeys. A biologist was assigned to spend a major portion of his
yearly work effort on turkey restoration, management and research. A turkey hunting permit fee
was established to help pay for this work. A limited turkey season was initiated in 1980 with the
first spring gobbler season by a lottery drawing. Hunters were allocated to hunt in four different
zones in southwestern New Hampshire. A first fall archery season was allowed in 1985 because
archery allowed numerous man-days of hunting recreation with little impact on the turkey
population. As the turkey population expanded in range and numbers from turkey transplants,
more of the state was open to hunting. The need for a lottery and allocation of hunters to zones
was not needed after only several years. It took the first ten hunting seasons to reach a level of
1,000 permit-holders and a harvest of 100 gobblers harvested. After that the turkey population,
the number of hunters participating, the turkey harvest and the popularity of turkeys grew
rapidly. The spring 2004 season harvest was 2,700 gobblers and there were an estimated 16,000
permit-holders. A limited one-week fall shotgun season could soon be considered for various
management units in western New Hampshire.
During 1989 a 31-page draft of a Wild Turkey Assessment report was prepared, but never
finalized, because the Chief of the Wildlife Division retired and there were Department budget
problems. This report was to be a management plan for the years 1990-1995. This report dealt
with all the population, habitat, harvest and other concerns in the current assessment for the next
10 years. Several major objectives were: To develop a wild turkey population in all regions of
the state with suitable habitat; to provide hunting opportunity with both a spring and fall hunting
season; to reach a statewide population of 4,000 to 5,000 wild turkeys; to have 5,000 permitholders per year, resulting in 55,000 man-days of hunting recreation per year. Other objectives
were: to educate the general public and landowners about turkey ecology and habitat needs; to
determine the yearly progress of turkeys at transplant sites; to determine the general status of the
statewide population by winter flock census and summer brood survey; to annually monitor the
spring and fall season by use of permit and registration stations and analyze the results; to utilize
the ear-marked turkey fund derived from the sale of turkey hunting permits for habitat work,
management and research; to educate the hunters about turkey hunting methods; to increase the
numbers of wild turkeys until the carrying capacity is reached; to allow a fall shotgun season
when and if regional turkey populations are high enough to absorb a fall gun season. All the
above objectives were reached except for the last two. However, a fall shotgun season is now
possible for wildlife units in western New Hampshire and the carrying capacity for turkeys in all
parts of the state may soon be reached by the year 2010.
In 1989, or 15 years following the initial successful release of 25 New York turkeys, the
statewide population was estimated at 2,500 wild turkeys and the maximum “projected” wild
turkey population for the year 2000 was 8,125 turkeys. However, by 1996 the population was
already 8,000 turkeys and 18,000 turkeys in year 2000. The current 2004 population was
estimated to be 26,000 wild turkeys. The “projected” statewide population by the year 2015 or
the end of the new 10-year Turkey Management Plan is 38 to 40,000 wild turkeys. The
neighboring states of Vermont and Connecticut are now at estimated populations of 40,000. It is
not unreasonable to assume New Hampshire could reach this figure, with the density of turkeys
per management units varying from 2 or 3 in the northern and 5 to 7 turkeys per square mile in
the southern half to two-thirds of the state.
35
All counties or management units of New Hampshire have some turkey habitat, some much
more than others. Large Coos County in the north has the least habitat because it has very little
field or farmland and little oak type forest. The White Mountain National Forest area in the
north-central regions will also have low turkey numbers because it is very mountainous with
deep snow-cover and little winter food. The most limiting factor for turkey numbers throughout
the state is access to winter food. Plants that can provide foods above the deep snow-cover, such
wild apple trees and sumac, are relatively limited because most towns are approximately 84%
forested. Dairy farms are synonymous with large turkey flocks because the corn wastage in the
manure spreading and manure piles, and the corn ensilage in the bunker and pit silos have
provided winter food and the fields associated with farmland have provided the best summer
turkey brood habitat. However, since the 1980s the state has lost the majority of its dairy farms.
There are now less than 200 dairy farms remaining in the state. The big factor in recent years,
which has allowed the turkey population to grow and expand is the proliferation of backyard
birdfeeders.
Seven turkey research studies have been coordinated between the Fish and Game Department
and the University of New Hampshire between 1980 and 2003. Much has been learned about
nesting habitat and degree of reproductive success, home range size and movements, winter
range use, causes of mortality and food usage. Numerous radioed hen turkeys have been
monitored and numerous other turkeys banded. This work with tagged turkeys has taken place in
all ten counties in the state.
Hunting season lengths and bag limits can readily be adjusted by wildlife management units, and
serve to control large turkey populations if problems develop with agricultural interests and in
developed or urban areas. The big limiting factor of winter food scarcity seems to have been
removed by the behavior of every turkey flock going to backyard birdfeeders during the critical
period of deep snow-cover. The Department will continue to educate the public about wild
turkey ecology and population dynamics and to stress the importance of fields and open land for
wild turkey habitat.
Summary and Conclusions for 2005-2014:
1. One goal was to reach a statewide population of 40,000 turkeys. There was an estimated
population of 26,900 turkeys in 2004. The projected population for 2015 was 40,449
turkeys. The estimated population as of 2014 was 39,060 turkeys. Therefore, the goal has
been reached.
2. It was predicted that the turkey carrying capacity throughout the state would be reached by
2014. The current estimated turkey population of 40,000 may be about maximum. However,
after an above reproductive summer, the population might reach 50,000 turkeys. Likewise,
after a poor hatching year(s) the population could drop to 30,000 turkeys.
3. Another goal was to provide some fall shotgun season in WMUs with the better turkey
population densities and spring harvests. Since 2006 12 of the 18 WMUs have had a 5-day
fall shotgun season. The six northern WMUs may continue without a fall shotgun season
because of poorer habitat and a lower turkey population.
36
4. Another goal was to have a special season for young turkey hunters. During 2004 the
popular Youth Hunt was initiated, it takes place during the weekend before the start of the
regular season, and has an average harvest of 13.2% of the total spring harvest.
5.
In recent years the spring gobbler season harvest seems to have leveled off at approximately
4,000 gobblers and 20,000 turkey permit-holders.
6. The major limiting factor for turkeys in New Hampshire was winter food scarcity. This
obstacle seems to have been significantly reduced because it has been observed that all
turkey flocks go to backyard birdfeeders during critical periods of deep snowcover. During
1984 there were 435 dairy farms throughout the state, and only 130 during 2014. Backyard
birdfeeders are now the major winter food source.
37
Table 1. Wild turkey range and projected population density in New Hampshire as of
1990.
County
Cheshire
Sullivan
Hillsboro
Merrimack
Belknap
Strafford
Rockingham
Grafton (1)
Carroll
Coos
Total
County Size
(sq. mi.)
Occupied
Percent of
Turkey Range County
(sq. mil)
Occupied
Estimated
Turkey
Population
Turkey
Density Per
Square Mile
720
540
890
930
400
380
690
595
-----
612
459
596
623
120
190
276
242
-----
85%
85%
66%
66%
30%
50%
40%
15%
-----
800
500
355
150
90
120
300
200
-----
1.11
0.92
0.4
0.16
0.23
0.32
0.44
0.83
-----
5,145
3,118
NA
2,515
Mean=0.81
(1) Acreage only includes the western one-third of the county. The eastern two thirds were not
considered to constitute turkey habitat.
Table 2. Maximum projected supportable wild turkey population for New Hampshire,
projected in 1989 for the year 2000.
Square Miles
of Land Area
% of Areas
Constituting
Habitat
Square Miles
of Turkey
Habitat
Maximum
Expected Turk
Population
Cheshire
Sullivan
Hillsboro
Merrimack
Belknap
Strafford
Rockingham
Grafton
Carroll
Coos
720
540
890
930
400
380
690
1616
944
1673
100%
100%
100%
100%
100%
100%
100%
33%
33%
0%
720
540
890
930
400
380
690
535
310
---
1440
810
1335
1395
400
760
1035
800
150
---
2
1.5
1.5
1.5
1
2
1.5
1.5
0.5
Total
9000
60%
5395
8125
Mean=1.5
County
Turkeys per
Square Mile
This table was prepared in 1989. It provides insight into our turkey status and expectations at that
time. The estimated pre-colonization turkey population estimate was 5,550 turkeys over 30% of
the state (2,760 miles) in southern portions of the state. Density on occupied ranges was 2.0
birds per square mile.
38
Table 3. Estimated 2004 wild turkey population per wildlife management unit and
projected wild turkey population for 2015, in New Hampshire.
Wildlife
Management
Unit (WMU)
Square Miles
of Turkey
Habitat*
Estimated
Turkey
Population for
2004
A
B
C1
C2
D1
D2
E
F
G
H1
H2
I1
I2
J1
J2
K
L
M
534
342
205
245
234
475
780
479
650
402
697
358
378
472
819
637
494
690
150
160
100
260
1070
2940
420
770
2360
2920
3550
1710
1570
1530
2380
3000
1060
950
0.28
0.47
0.49
1.06
4.57
6.19
0.54
1.61
3.63
7.26
5.09
4.78
4.15
3.24
2.91
4.71
2.15
1.38
1068
684
615
735
1404
3325
1560
1437
3250
2814
4182
2148
2268
2124
3685
3822
2223
3105
2
2
3
3
6
7
2
3
5
7
6
6
6
4.5
4.5
6
4.5
4.5
Total
8891
26900
3.03
40449
Mean=4.55
*Total land area
39
Turkey
Density per
Square Mile
2004
Projected
2015 Turkey
Population
Projected
Turkey
Density Per
Sq. Mi. 2015
Table 4. A history of turkey transplants/releases in New Hampshire.
Figure 1 Map
Reference
Number
Year of
Transplant
1
1
2
3
4
5
6
7
8
9
10
11
12
13
1969
1970
1975
1978
1980
1979
1979
1979
1979
1984
1986
1992
1993
1993
1983
1993
1994
1995
14
15
16
Town Of Release
Number
of Turkeys
Released
County
of Release
Nottingham/Deerfield
26*
Rockingham
Walpole
Lyndeboro
New Boston
Pittsfield/Gilmanton
Lee/Durham
Brentwood/Exeter
Boscawen/Webster
Chester/Derry
Weare/Dunbarton
Canterbury
Chester
Kensington
Kensington
Strafford
Moultonboro
Sanbornton
27
16
7
25
21
25
17
12
25
25
20
10
5
13
35
36
Cheshire
Hillsborough
Hillsborough
Merrimack/Belknap
Strafford
Rockingham
Merrimack
Rockingham
Hillsborough/Merrimack
Merrimack
Rockingham
Rockingham
Rockingham
Strafford
Carroll
Belknap
Total
* This release failed
344
The 1969-1970 transplant was from West Virginia and the 1975 transplant was from New York. The
remainder of transplants consisted of birds trapped and relocated within New Hampshire.
Table 5. Data from Public Internet Winter Flock Survey (6 years)
Year
# of Flock Reports
Statewide
Total Turkeys
Reported
Average Number
Per Flock
2009
2010
2011
2012
2013
2014
6 yr. Averages
1528
1291
1497
1180
1787
1520
Avg. = 1,467
10414
19050
27521
20295
28389
21352
23,500
15.66
14.89
18.38
17.45
15.89
14.05
Avg. = 15.7
40
Table 6. Data from Public Internet Summer Turkey Brood Survey (4 years)
Year
# of Brood Reports
Statewide
2011
2012
2013
2014
4 year Averages =
808
924
1676
724
Avg. = 1,033
Aug. poults per hen
Average - Statewide
4.38
3.84
3.33
3.40
Avg. = 3.74
All Summer, poults per
hen Avg. Statewide
4.79
4.06
3.32
3.81
Avg. = 4.00
Table 7. Estimated 2014 Wild Turkey Population per WMUs
Unit
A
B
C1
C2
D1
D2
E
F
G
H1
H2
I1
I2
J1
J2
K
L
M
TOTALS
Sq. miles of turkey
Habitat
Estimated turkey
Population
534
342
205
245
234
475
780
479
650
402
697
358
378
472
809
637
494
690
8,891
480
250
220
280
1,020
2,340
340
640
2,570
2,950
3,610
1,590
1,760
1,660
5,990
4,900
4,060
4,400
39,060
41
Turkey population
Per square mile
0.90
0.71
1.07
1.14
4.36
4.93
0.44
1.34
3.95
7.34
5.18
4.44
4.66
3.52
7.31
7.69
8.22
6.38
4.39 average
Table 8. Turkey habitat* by Wildlife Management Unit (WMU) in New Hampshire.
Total
WMU
Sq Miles
A
584.6
B
346.2
C1
205.7
C2
257.4
D1
241.2
D2
483.9
E
782.8
F
483.4
G
672.3
H1
409.8
H2
719.7
I1
368.0
I2
396.9
J1
507.2
J2
929.3
K
657.2
L
513.9
M
722.4
STATE 9282.1
Land
Sq Miles
569.9
342.2
204.9
244.5
234.4
475.4
779.9
479.0
649.6
401.8
697.3
358.0
377.7
471.8
818.8
637.1
494.0
690.2
8926.4
% of WMU
That is Land
97.5
98.8
99.6
95.0
97.2
98.2
99.6
99.1
96.6
98.1
96.9
97.3
95.2
93.0
88.1
96.9
96.1
95.5
96.2
Sq. Miles of Land
That Met Turkey
Guidelines
465.8
281.8
174.4
179.6
193.1
425.1
574.5
403.6
556.3
354.8
626.6
317.9
328.0
428.2
733.2
569.9
412.2
530.7
7555.6
% of Land That
Met Turkey
Habitat Guidelines
81.7
82.3
85.1
73.5
82.4
89.4
73.7
84.3
85.6
88.3
89.9
88.8
86.8
90.8
89.5
89.5
83.4
76.9
84.6
*Habitat data were generated in 2001. Habitat features included agricultural lands,
all forest classes except spruce/fir, other/cleared lands, bedrock/vegetated, and
forested wetlands.
42
Table 9. Square miles of cover type by wildlife management unit (WMU). Estimates
derived using 2001, GRANIT Land Cover data based on classification of Landstat
Thematic Mapper Imagery.
WMU
Sq. Mi.
Land
Area*
Sq. Mi.
Crops
A
B
C1
C2
D1
D2
E
F
G
H1
H2
I1
I2
J1
J2
K
L
M
534
342
205
244
234
475
780
479
650
402
697
358
378
472
819
637
494
690
0.2
0.7
0
0.1
1.7
2.9
0.3
1.2
0.9
2.5
2.8
2.8
0.4
0.1
1.6
2.7
1.6
2.4
Sq. Mi.
Sq. Mi.
Sq. Mi.
Other
Hay/Pasture Beech/Oak Hardwoods
6.2
3.9
1.2
1.3
5.2
14.6
4.1
4.3
15.4
14.1
18
10.4
6.7
4.9
17.6
16.6
11.9
16.9
36.8
24.3
19.4
16.4
9.1
38.8
83.3
79.9
110.9
52.1
118.7
68.4
67
68.1
132.4
98.6
52.6
53.1
182.9
114.1
78.4
61.6
35.4
82.8
164.9
95.5
95.3
39.5
44.1
20.9
36.7
50.5
55.3
14.8
25.8
28
Sq. Mi.
Conifers
Sq. Mi.
Developed
Land
90.6
52.4
28.5
54.8
41.9
75.6
189.1
90.8
126
76.1
102.1
63
70.3
77
93.3
103.2
39.1
41.3
0.5
0.4
0.1
0.3
0.4
0.5
1.2
0.8
2.1
2.1
2.3
1.4
0.8
1.6
3
3.4
4.4
11.4
Table 10. Food Usage Categories by Turkey Flocks Statewide – Winter 2014
Food category
Number of
Observations
Percentage of
Total Observations
Acorns/beechnuts
Apples/crabapples
Birdfeeder
Corn/grain
Corn in manure
41
77
432
135
11
5.6%
10.6%
59.4%
18.6%
1.5%
Corn in ensilage
Standing corn
Dried berries/
Fruits on shrubs
TOTAL
(unknown foods)
10
5
1.4%
0.6%
2
727
(181)
0.2%
100.0%
43
78.0% fed by people
3.5% corn from
agriculture
Table 11. A comparison of season results in New Hampshire from 1980 through 1989.
# of Days
Turkey Kill
Permits Sold
Est. Persons
Hunting
% Success
Rate
Juvenile:Adult
Harvest
Percent Kill
Opening Day
Avg. ManDays
Hunting
Towns with
Turkeys
Taken
Towns Visited
By Hunters
1980
1981
1982
1983
1984
1985
1986
1987
1988
1989
May
10-18
May
16 24
May
5-23
May
5-22
May
8-27
May
8-27
May
7-31
May
6-31
May
4-31
May
3-31
9
31
708
637
9
27
1,272
1,090
19
40
1,203
1,022
18
72
1,128
918
20
51
871
740
20
61
758
644
25
89
862
776
26
86
857
771
28
91
875
787
28
142
1,121
1,009
5.0
2.5
3.8
7.8
6.9
9.5
11.5
11.0
11.6
14.1
0.45
0.69
0.86
0.72
1.32
1.26
1.23
1.40
1.62
1.58
29
30
35
16
43
25
43
26
26
26
4.2
3.6
4.8
5.0
5.6
5.4
5.7
6.8
5.7
11
9
17
21
17
19
25
25
35
24
34
23
21
29
41
41
52
55
44
---
38
---
Table 12. Spring Season Harvests 1990-2014
Year
1994
1995
1996
1997
1998
1999
2000
2001
2002
2003
2004
2005
2006
2006
2008
2009
2010
2011
2012
2013
2014
Total
10 yr average
Percent
Youth Hunt Kill
(% of Total)
N/A
N/A
N/A
N/A
N/A
N/A
N/A
N/A
N/A
N/A
321 (11.9%)
389 (13.0%)
437 (12.4%)
454 (12.4%)
579 (14.1%)
570 (14.1%)
541 (14.7%)
521 (14.2%)
480 (12.4%)
590 (13.1%)
471 (12.1%)
5032
503
13.2
Number of
Permits Sold
3,654
4,935
6,096
6,797
7,949
10,024
11,662
13,936
16,065
16,485
17,653
18,626
19,641
19,388
18,683
18,520
18,380
18,643
18,694
20,062
N/A
45
Total Spring Harvest
334
539
690
757
1,015
1,378
1,883
2,260
2,631
2,599
2,706
3,042
3,559
3,651
4,107
4,056
3,669
3,672
3,876
4,550
3,885
38,067
3,807
Table 13. New Hampshire Spring Turkey Harvest by WMU for 2005-2014
Unit
2005
2006
A
B
C1
C2
D1
D2
E
F
G
H1
H2
I1
I2
J1
J2
K
L
M
Totals
Closed Closed
17
36
28
23
14
41
120
129
337
399
48
48
83
83
269
288
336
320
370
407
174
194
193
228
180
208
295
356
343
412
131
184
114
176
3042
3559
2007
2008
2009
2010
2011
2012
2013
2014
10 year
average
23
23
11
25
110
351
44
98
281
351
428
204
187
196
429
461
204
206
3651
14
39
12
28
123
378
47
101
307
353
467
212
224
206
500
486
285
308
4107
34
37
16
29
101
352
35
94
301
337
505
242
192
199
530
487
289
264
4044
22
26
14
23
82
308
37
82
279
340
409
188
174
181
471
472
261
296
3669
30
19
13
19
83
236
37
64
244
299
431
181
172
152
512
529
311
338
3672
47
34
13
26
99
213
23
78
265
274
371
196
182
165
532
535
393
425
3876
62
41
18
33
114
270
47
83
324
337
449
199
202
212
676
571
455
456
4550
48
25
22
28
102
234
34
64
257
295
361
159
176
166
599
490
406
440
3906
47.7
29.7
17.0
26.6
106.3
307.8
40.0
83.0
281.5
324.2
419.8
174.9
193.0
186.5
490.0
478.6
291.9
302.3
3808
Table 14. Age Classes of Spring Gobbler Harvest (2005-2014)
Year
1 yr old
2 yr old
3 yr old
4 yr old
5+ yr old
Juvenile to
tom ratio
2005
2006
2007
2008
2009
2010
2011
2012
2013
2014
10 yr avg.
52.6%
36.4%
32.6%
38.4%
35.5%
25.0%
44.1%
31.7%
32.8%
30.8%
36.0%
30.5%
40.4%
40.9%
37.7%
40.4%
49.8%
32.0%
39.0%
39.0%
38.6%
40.3%
13.1%
19.4%
19.7%
17.9%
18.5%
19.9%
17.5%
23.3%
22.4%
22.5%
19.4%
2.9%
3.7%
5.7%
5.1%
4.9%
4.7%
5.7%
5.3%
5.4%
5.6%
4.9%
0.9%
0.005%
1.1%
0.70%
0.67%
0.60%
0.70%
0.78%
0.84%
1.00%
0.73%
1.11 to 1.00
0.53 to 1.00
0.48 to 1.00
0.63 to 1.00
0.55 to 1.00
0.33 to 1.00
0.79 to 1.00
0.46 to 1.00
0.49 to 1.00
0.45 to 1.00
0.58 to 1.00
46
Table 15. Fall Archery Turkey Harvest in New Hampshire 1993-2004.
Year
1993
1994
1995
1996
1997
1998
1999
2000
2001
2002
2003
2004
Total
# of Towns
Total Turkeys # Females # Males # Unknown Registering Turkeys
22
43
132
48
115
76
244
81
256
202
270
342
1,831
18
32
87
34
84
45
164
53
175
133
168
205
1,198
4
10
41
14
31
30
76
25
81
69
102
139
620
-1
4
--1
4
3
----13
17
31
62
34
69
45
108
55
130
107
145
150
Season dates are September 15 – December 15 (concurrent with the fall deer archery season).
Table 16. Fall Archery and Fall Shotgun Turkey Season Harvests 2005 - 2014
Year
2005
2006
2007
2008
2009
*2010
2011
2012
2013
2014
Total
9 yr avg.
Archery
Harvest
% of
Total
Shotgun
Harvest
% of
Total
Total Fall
Harvest
296
208
418
207
198
291
211
350
313
189
2681
261
37.6%
-53.3%
54.9%
41.1%
40.2%
28.8%
32.8%
33.1%
36.6%
29.9%
-122
343
297
294
719
432
706
542
443
3898
433
62.4%
-31.3
45.1
58.9
59.8
71.2
67.2
66.9
63.4
70.1
296
390
761
504
492
1010
643
4056
855
632
6343
634
*Opened J1, J2, L and M
47
48
49
50
Figure 4. 1980-2014 Spring Turkey Kill and Kill per Square Mile By Wildlife Management
Unit and Statewide.
51
Figure 4. 1980-2014 Spring Turkey Kill and Kill per Square Mile By Wildlife Management
Unit and Statewide (cont.).
52
Figure 4. 1980-2014 Spring Turkey Kill and Kill per Square Mile By Wildlife Management
Unit and Statewide (cont.).
53
Figure 4. 1980-2014 Spring Turkey Kill and Kill per Square Mile By Wildlife Management
Unit and Statewide (cont.).
54
Figure 4. 1980-2014 Spring Turkey Kill and Kill per Square Mile By Wildlife Management
Unit and Statewide (cont.).
55
Figure 4. 1980-2014 Spring Turkey Kill and Kill per Square Mile By Wildlife Management
Unit and Statewide (cont.).
56
Figure 4. 1980-2014 Spring Turkey Kill and Kill per Square Mile By Wildlife Management
Unit and Statewide (cont.).
57
Figure 4. 1980-2014 Spring Turkey Kill and Kill per Square Mile By Wildlife Management
Unit and Statewide (cont.).
58
Figure 4. 1980-2014 Spring Turkey Kill and Kill per Square Mile By Wildlife Management
Unit and Statewide (cont.).
59
Figure 4. 1980-2014 Spring Turkey Kill and Kill per Square Mile By Wildlife Management
Unit and Statewide (cont.).
60
Appendix I. New Hampshire Turkey Wildlife Management Units.
61
APPENDIX II. New Hampshire Wild Turkey Studies.
Good, P.L. 1982. Winter habitat of the wild turkey in southeastern New Hampshire. M.S. Thesis,
Univ. of New Hampshire, Durham. 61 pp.
Thomas, G.E. 1989. Nesting ecology and survival of hen and poult eastern wild turkeys in southern
New Hampshire, M.S. Thesis, Univ. of New Hampshire, Durham. 67 pp.
Decker, S.R. 1988. Nutritive quality and metabolizable energy of eight wild turkey winter foods in New
Hampshire. M.S. Thesis, Univ. of New Hampshire, Durham. 37 pp.
Oberlag, D.F. 1989. The influence of season and temperature on metabolism of eastern wild turkeys in
New Hampshire. M.S. Thesis, Univ. of New Hampshire, Durham. 57 pp.
Coup, R.N. 1996. Winter field metabolic of rate of wild turkeys in New Hampshire. M.S. Thesis, Univ.
of New Hampshire, Durham. 66 pp.
Hamel, J.P. 2002. Influence of winter supplemental feeding on the winter bioenergetics and reproduction
of eastern wild turkeys in New Hampshire. M.S. Thesis, Univ. of New Hampshire, Durham. 105 pp.
Timmins, A.A. 2003. Seasonal home range, nesting ecology and survival of eastern wild turkeys in
northern New Hampshire. M.S. Thesis, Univ. of New Hampshire, Durham. 87 pp.
Pekins, P., Heubner J., Beane L. 2004. Winter agricultural damage by wild turkeys in New Hampshire.
Progress Report, Univ. of New Hampshire.
62
Appendix III. Several Viruses Present in Wild Turkeys in Northeastern States
Ted Walski
Turkey Project Biologist
Feb. 20, 2013
In New Hampshire, as well as in the other New England states, New York, New Jersey and Pennsylvania,
sick turkeys have been noted and specimens collected and sent to state veterinary labs. One virus is
Avian Pox Virus which has been present in more southern states for decades, and the second virus is
Lymphoproliferative Disease Virus (LPDV), which has only been detected in wild turkeys during the past
several years.
The symptoms are similar for both viruses. Lesions or wart-like, yellow, pussy protruberances develop
around the neck/head area. The growths may accumulate around the eyes, making it difficult for the
turkey to see, and hence become more vulnerable to predators. The growth
may also get into the throat, making it more difficult to ingest food. Some of the turkeys picked up had
lost considerable weight, to as much as one-third or more of normal weight. They can become relatively
easy to catch because of a weakened condition.
Avian pox is an infectious viral disease of numerous bird species. The old term “fowl pox” was used for
turkeys and chickens. This virus does not appear to be one of the more lethal diseases or marked die-offs
would have occurred in the past in more established southern turkey states. Among wild turkeys
mosquitoes are probably the most important transmission route. The wet year of 2011 in New Hampshire
was notable for numerous hatches of mosquitoes.
The first case of the new LPDV was reported only in 2009 in the United States. It was previously
reported in domestic turkeys in the United Kingdom and the Middle East. This virus is now also present
in New England. The six turkey specimens sent during October 2012 to the veterinary lab at UNH in
Durham were diagnosed as having both viruses. The head/neck lesions are symptomatic of both viruses;
however LPDV often has lumpy growths on the toes of the turkey’s feet.
The “potential” impact of these two viruses on wild turkeys in New Hampshire and other states is
currently unknown. The first two sick turkeys were collected in N. Haverhill, NH during October 2011.
Then a scattering of turkeys were noted or collected having the virus from 21 towns throughout NH
during the year 2012. During the 2012 fall hunting season 1,000+ turkeys were registered. There is a
section on the form where any abnormalities are to be recorded. Forms from seven towns reported
turkeys with the avian pox lesions.
During the start of the May 2013 spring gobbler season, biologists will be present at perhaps 10-12
registration stations throughout the state to ask hunters to donate the feet of their turkey or a 4-inch
section above the spur up to the leg joint. The goal is to collect 50 turkey feet, 5 feet from each of the 10
counties. These samples will be sent to the disease center in Georgia. Analysis of bone marrow will help
to determine the prevalence of the virus in a region’s or state’s wild turkey population. Hunters are urged
to cooperate with this study. They are also encouraged to report to one of the 4 regional Fish & Game
Dept. offices (Keene, Durham, New Hampton, Lancaster) any sick-looking turkeys they see or hear of
during the hunting season, scouting or anytime of the year.
Note: These viruses and the turkey’s meat pose no threat to humans.
Incidence of Pox Viruses in Turkeys During Year 2014
From January 2014 through December 2014 the turkey project biologist recorded 25 towns throughout
NH, which had sites with pox turkeys. Age of the sick turkeys was usually an adult, and somewhat more
63
hens than toms. Multiple individuals in a flock were rarely reported with pox lesions, but rat her one
individual in a flock.
The 2014 Winter Public Internet Flock Survey was another source from which to record pox turkeys from
around the state. There were only 18 towns with pox reports. Most of these reports came from
southeastern NH – 9 sites in Rockingham Count y and 6 sites in Strafford County.
The hunting season turkey registration forms are another source from which to detect pox incidence
around the state. The May 2014 Spring Gobbler Season had five pox turkeys recorded in the harvest.
The 2014 Summer Public Internet Brood Survey was another source of pox incidence. Only 5 of 724
respondents 0.007%, or less than 1% reported virus lesions in the head/neck area. Three of these towns
were from southeastern New Hampshire, and two towns from southwestern NH.
It appears the prognosis of turkeys with the lesions on the head is not good. The majority of the turkeys
reported already have substantial blockage of the vision in one or both eyes, and can often be captured by
humans. Predators may remove a percentage of these turkeys at an earlier stage. It is not known if any of
these turkeys ever recover. Monitoring of specific individual turkeys at various sites would take a
significant amount of time.
64
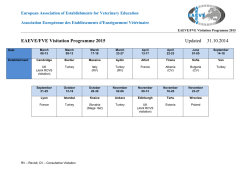
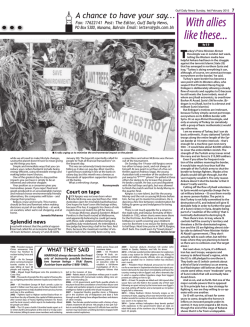
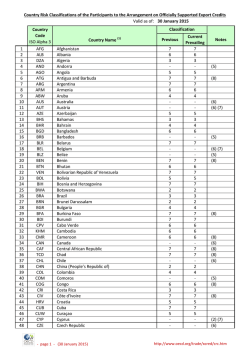
© Copyright 2026