
Stock Market Indicators: Bull/Bear Ratios
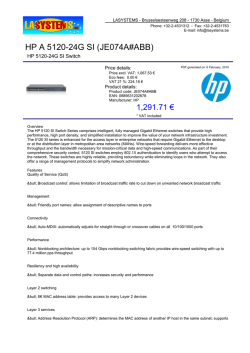
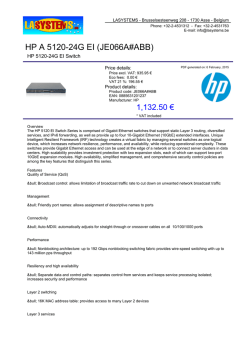
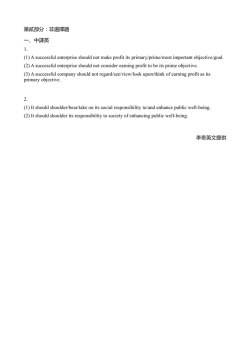
Stock Market Indicators:
Bull/Bear Ratios
Yardeni Research, Inc.
February 4, 2015
Dr. Edward Yardeni
516-972-7683
[email protected]
Joe Abbott
732-497-5306
[email protected]
Debbie Johnson
480-664-1333
[email protected]
Mali Quintana
480-664-1333
[email protected]
Please visit our sites at
www.yardeni.com
blog.yardeni.com
thinking outside the box
Table Of Contents
Table Of Contents
S&P 500
Bull/Bear Ratio Over 3.0
Bull/Bear Ratio Under 1.0
Bull/Bear Ratio Under 1.0 & Over 3.0
AAII Sentiment
Bull/Bear Ratio vs. Consumer Confidence
February 4, 2015 / Stock Market Indicators: Bull/Bear Ratios
1
2
3
4
5
6
Yardeni Research, Inc.
www.yardeni.com
S&P 500
Figure 1.
5
5
INVESTORS INTELLIGENCE BULLS & BEARS
Bull/Bear Ratio
4
4
Ratio
3.26
3.01
Jan 27
Feb 3
2/3
3
3
2
2
1
1
0
0
87
88
89
90
91
92
93
94
95
96
97
98
99
00
01
02
03
04
05
06
07
08
09
10
11
12
13
14
15
16
80
80
Jan 20
Jan 27
Feb 3
Bulls
70
Bulls
49.0
53.1
49.0
Bears
Bears
17.4
16.3
16.3
70
60
60
50
50
2/3
40
40
30
30
20
20
10
10
87
88
89
90
91
92
93
94
95
96
97
98
99
00
01
02
03
04
05
06
07
08
09
10
11
12
13
14
15
16
50
45
50
45
Correction Camp
40
40
2/3
35
35
30
30
25
25
20
20
15
15
10
10
yardeni.com
5
87 88 89 90 91 92 93
Source: Investors Intelligence.
94
95
96
97
98
99
00
01
02
03
Page 1 / February 4, 2015 / Stock Market Indicators: Bull/Bear Ratios
04
05
06
07
08
09
10
11
12
13
14
15
5
16
Yardeni Research, Inc.
www.yardeni.com
Bull/Bear Ratio Over 3.0
Figure 2.
2600
2400
2200
2000
1800
1600
S&P 500 INDEX vs. BULL/BEAR RATIO OF
3.0 OR MORE*
(ratio scale)
2600
2400
2200
2000
1800
1600
2/3
1400
1400
1200
1200
1000
1000
yardeni.com
800
600
400
800
600
400
200
200
87
88
89
90
91
92
93
94
95
96
97
98
99
00
01
02
03
04
05
06
07
08
09
10
11
12
13
14
15
16
* Red shaded areas indicate Bull/Bear Ratio equal to or greater than 3.0.
Source: Standard & Poor’s Corporation and Investors Intelligence.
Figure 3.
21600
21600
DOW JONES INDEX vs. BULL/BEAR RATIO OF
3.0 OR MORE*
(ratio scale)
17600
13600
2/3
17600
13600
9600
9600
yardeni.com
5600
1600
5600
1600
87
88
89
90
91
92
93
94
95
96
97
98
99
00
01
02
03
04
05
06
07
08
09
10
11
12
13
14
15
16
* Red shaded areas indicates Bull/Bear Ratio equal to or greater than 3.0.
Source: Wall Street Journal and Investors Intelligence.
Page 2 / February 4, 2015 / Stock Market Indicators: Bull/Bear Ratios
Yardeni Research, Inc.
www.yardeni.com
Bull/Bear Ratio Under 1.0
Figure 4.
2600
2400
2200
2000
1800
1600
S&P 500 INDEX vs. BULL/BEAR RATIO
OF 1.0 OR LESS*
(ratio scale)
2600
2400
2200
2000
1800
1600
2/3
1400
1400
1200
1200
1000
1000
800
800
600
600
400
400
yardeni.com
200
87
88
89
90
91
92
93
94
95
96
97
98
99
00
01
02
03
04
05
06
07
08
09
10
11
12
13
14
15
200
16
* Green shaded areas indicate Bull/Bear Ratio equal to or less than 1.0.
Source: Standard & Poor’s Corporation and Investors Intelligence.
Figure 5.
21600
21600
17600
2/3
DOW JONES INDEX vs. BULL/BEAR RATIO
OF 1.0 OR LESS*
(ratio scale)
13600
17600
13600
9600
9600
5600
5600
yardeni.com
1600
87
88
89
90
91
92
93
94
95
96
97
98
99
00
01
02
03
04
05
06
07
08
09
10
11
12
13
14
15
1600
16
* Green shaded areas indicates Bull/Bear Ratio equal to or less than 1.0.
Source: Wall Street Journal and Investors Intelligence.
Page 3 / February 4, 2015 / Stock Market Indicators: Bull/Bear Ratios
Yardeni Research, Inc.
www.yardeni.com
Bull/Bear Ratio Under 1.0 & Over 3.0
Figure 6.
40
40
S&P 500 INDEX
LESS 200-DMA vs.
BULL/BEAR RATIO OF 3.0 OR MORE*
20
20
yardeni.com
2/3
0
-20
0
-20
S&P 500 Minus 200-Day Moving Average
Divided by S&P 500
(percent)
-40
-40
87
88
89
90
91
92
93
94
95
96
97
98
99
00
01
02
03
04
05
06
07
08
09
10
11
12
13
14
15
16
* Red shaded areas indicates Bull/Bear Ratio equal to or less than 3.0.
Source: Standard & Poor’s Corporation.
Figure 7.
40
40
S&P 500 INDEX
LESS 200-DMA vs.
BULL/BEAR RATIO OF 1.0 OR LESS*
20
20
yardeni.com
2/3
0
-20
0
-20
S&P 500 Minus 200-Day Moving Average
Divided by S&P 500
(percent)
-40
-40
87
88
89
90
91
92
93
94
95
96
97
98
99
00
01
02
03
04
05
06
07
08
09
10
11
12
13
14
15
16
* Green shaded areas indicates Bull/Bear Ratio equal to or less than 1.0.
Source: Standard & Poor’s Corporation.
Page 4 / February 4, 2015 / Stock Market Indicators: Bull/Bear Ratios
Yardeni Research, Inc.
www.yardeni.com
AAII Sentiment
Figure 8.
100
100
AAII SENTIMENT INDEX FOR STOCKS
AAII Bull Ratio*
75
75
1/28
50
50
25
25
0
0
2005
2006
2007
2008
2009
2010
2011
2012
2013
2014
2015
5
5
4
4
AAII Bull/Bear Ratio
3
3
1/28
2
1
2
1
0
0
2005
2006
2007
2008
2009
2010
2011
2012
2013
2014
2015
80
80
Bulls
70
70
Bears
60
60
50
50
1/28
40
40
30
30
20
10
20
Jan 21
Jan 28
Latest Readings
Bulls
Bears
37.1
30.8
44.2
22.4
10
yardeni.com
0
2005
2006
2007
2008
2009
2010
2011
* AAII Bull Ratio is the percent of bulls over the percent of bulls plus percent of bears.
Source: American Association of Individual Investors (AAII).
Page 5 / February 4, 2015 / Stock Market Indicators: Bull/Bear Ratios
2012
2013
2014
0
2015
Yardeni Research, Inc.
www.yardeni.com
Bull/Bear Ratio vs. Consumer Confidence
Figure 9.
4.5
140
BULL/BEAR RATIO & CONSUMER CONFIDENCE
4.0
120
3.5
1/27
3.0
100
2.5
80
2.0
1.5
60
Bull/Bear Ratio
(4-week average)
1.0
40
Consumer Confidence
Expectations Index
.5
yardeni.com
.0
2000
2001
2002
2003
2004
2005
2006
2007
2008
2009
2010
2011
2012
2013
2014
20
2015
Source: New York Board of Trade, Commodity Futures Trading Commission, and the Conference Board.
Figure 10.
4.5
70
BULL/BEAR RATIO & CONSUMER COMFORT INDEX
4.0
60
3.5
1/27
3.0
50
2.5
2.0
40
1.5
Bull/Bear Ratio
(4-week average)
1.0
30
Consumer Comfort Index
.5
yardeni.com
.0
2000
2001
2002
2003
2004
2005
2006
2007
2008
2009
2010
2011
2012
2013
2014
20
2015
Source: New York Board of Trade, Commodity Futures Trading Commission, and Bloomberg.
Page 6 / February 4, 2015 / Stock Market Indicators: Bull/Bear Ratios
Yardeni Research, Inc.
www.yardeni.com
Copyright (c) Yardeni Research, Inc. 2015. All rights reserved. The information
contained herein has been obtained from sources believed to be reliable, but is not
necessarily complete and its accuracy cannot be guaranteed. No representation or
warranty, express or implied, is made as to the fairness, accuracy, completeness, or
correctness of the information and opinions contained herein. The views and the other
information provided are subject to change without notice. All reports posted on
http://blog.yardeni.com
www.yardeni.com, blog.yardeni.com,
and YRI’s Apps for iPads and iPhones are issued
without regard to the specific investment objectives, financial situation, or particular needs
of any specific recipient and are not to be construed as a solicitation or an offer to buy or sell
any securities or related financial instruments. Past performance is not necessarily a guide
to future results. Company fundamentals and earnings may be mentioned occasionally, but
should not be construed as a recommendation to buy, sell, or hold the company’s stock.
Predictions, forecasts, and estimates for any and all markets should not be construed as
recommendations to buy, sell, or hold any security--including mutual funds, futures
contracts, and exchange traded funds, or any similar instruments.
The text, images, and other materials contained or displayed on any Yardeni Research, Inc.
product, service, report, email or website are proprietary to Yardeni Research, Inc. and
constitute valuable intellectual property. No material from any part of www.yardeni.com,
http://blog.yardeni.com
blog.yardeni.com,
and YRI’s Apps for iPads and iPhones may be downloaded, transmitted,
broadcast, transferred, assigned, reproduced or in any other way used or otherwise
disseminated in any form to any person or entity, without the explicit written consent of
Yardeni Research, Inc. All unauthorized reproduction or other use of material from Yardeni
Research, Inc. shall be deemed willful infringement(s) of this copyright and other proprietary
and intellectual property rights, including but not limited to, rights of privacy. Yardeni
Research, Inc. expressly reserves all rights in connection with its intellectual property,
including without limitation the right to block the transfer of its products and services and/or
to track usage thereof, through electronic tracking technology, and all other lawful means,
now known or hereafter devised. Yardeni Research, Inc. reserves the right, without further
notice, to pursue to the fullest extent allowed by the law any and all criminal and civil
remedies for the violation of its rights.
The recipient should check any email and any attachments for the presence of viruses.
Yardeni Research, Inc. accepts no liability for any damage caused by any virus transmitted
by this company’s emails, website, blog and Apps. Additional information available on
request.
[email protected]


© Copyright 2026