
oatao.univ-toulouse.fr
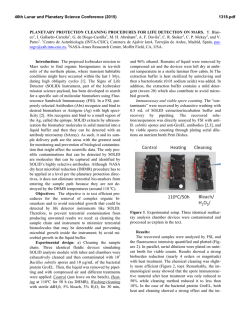
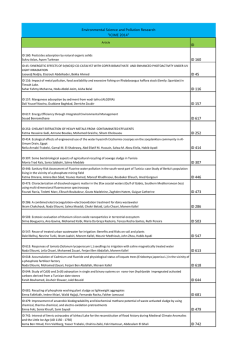
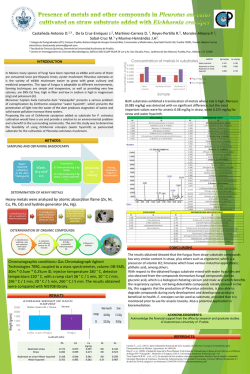
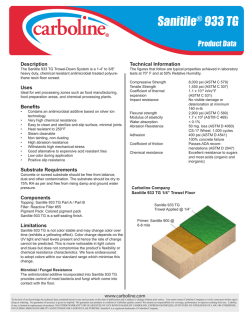
Open Archive Toulouse Archive Ouverte (OATAO)
OATAO is an open access repository that collects the work of Toulouse researchers and
makes it freely available over the web where possible.
This is an author-deposited version published in: http://oatao.univ-toulouse.fr/
Eprints ID: 5647
To link to this article: DOI:10.1016/J.BIORTECH.2009.11.076
URL: http://dx.doi.org/10.1016/J.BIORTECH.2009.11.076
To cite this version: Cercado Quezada, B. and Délia, Marie-Line and
Bergel, Alain (2010) Testing various food-industry wastes for electricity
production in microbial fuel cell. Bioresource Technology pp. 2748-2754.
ISSN 0960-8524
Any correspondence concerning this service should be sent to the repository
administrator: [email protected]
Testing various food-industry wastes for electricity production in microbial fuel cell
Bibiana Cercado-Quezada, Marie-Line Delia, Alain Bergel *
Laboratoire de Génie de Chimique, CNRS – Université de Toulouse, 4, Allée Emile Monso, P.O. Box 74233, 31430 Toulouse Cedex 4, France
a b s t r a c t
Three food-industry wastes: fermented apple juice (FAJ), wine lees and yogurt waste (YW) were evaluated in combination with two sources of inoculum, anaerobic sludge and garden compost, to produce
electricity in microbial fuel cells. Preliminary potentiostatic studies suggested that YW was the best candidate, able to provide up to 250 mA/m2 at poised potential +0.3 V/SCE. Experiments conducted with
two-chamber MFCs confirmed that wine lees were definitely not suitable. FAJ was not able to start an
MFC by means of its endogenous microflora, while YW was.
Both FAJ and YW were suitable fuels when anaerobic sludge or compost leachate was used as inoculum
source. Sludge-MFCs had better performance using YW (54 mW/m2 at 232 mA/m2). In contrast, compostleachate MFCs showed higher power density with FAJ (78 mW/m2 at 209 mA/m2) than with YW
(37 mW/m2 at 144 mA/m2) but YW gave more stable production. Under optimized operating conditions,
compost-leachate MFCs fueled with YW gave up to 92 mW/m2 at 404 mA/m2 and 44 mW/m2 in stable
conditions.
1. Introduction
Microbial fuel cells (MFCs) are electrochemical devices that use
the metabolic activity of microorganisms to oxidize fuels, generating electric current by direct or mediated electron transfer to electrodes (Rabaey et al., 2007; Schröder, 2007). In the anodic
compartment, organic matter is oxidized by microbial metabolism,
which transfers the electrons to the anode. In the cathodic compartment, oxygen or oxidized compounds are reduced either via
an abiotic process or by microbially mediated reduction (He and
Angenent, 2006).
Early studies on fuels in MFCs dealt with low molecular weight
substrates, carbohydrates like glucose, fructose, xylose, sucrose,
maltose and trehalose (Chauduri and Lovley, 2003; Kim et al.,
2000), organic acids like acetate, propionate, butyrate, lactate, succinate and malate (Bond and Lovley, 2005; Holmes et al., 2004; Min
and Logan, 2004), alcohols like ethanol and methanol (Kim et al.,
2007) and inorganic compounds like sulfate (Rabaey et al., 2006).
Later, the interest in complex substrates led to tests on starch, cellulose, dextran, molasses, chitin and pectin (Melhuish et al., 2006;
Niessen et al., 2005, 2006; Rezaei et al., 2007). In parallel, the use of
domestic wastewater as fuel and microbial source was largely reported (Liu et al., 2004; Rabaey et al., 2005). Research on domestic
wastewater was extended to a large variety of industrial wastewaters, e.g. from starch (Gil et al., 2003) and wastewaters coming
from the meat packing industry (Heilmann and Logan, 2006),
* Corresponding author. Tel.: +33 5 34 61 52 48; fax: +33 5 34 61 52 51.
E-mail address: [email protected] (A. Bergel).
swine farms (Min et al., 2005) and cereal- (Oh and Logan, 2005)
and potato-producing units (Rabaey et al., 2005). Solid agricultural
wastes such as corn stover (Zuo et al., 2006) and manure (Scott and
Murano, 2007) have also been tested as fuel after being pretreated.
Numerous variants of the experimental conditions affected the results but the power density obtained in these studies was generally
in the range of 1–3600 mW/m2, with most values lying between 10
and 1000 mW/m2.
The choice of the inoculum source is a key parameter in MFC
design. The most common sources of electroactive microorganisms
have been domestic wastewater, activated and anaerobic sludge
and marine sediments (Erable et al., 2009; Kim et al., 2007; Liu
et al., 2004; Rezaei et al., 2007). Alternative sources have been reported: heat treated soils (Niessen et al., 2006), garden compost
(Parot et al., 2008a), manure (Scott and Murano, 2007) and rumen
(Rismani-Yazid et al., 2007). However, very little research has
investigated electroactive native microflora in agro-industrial
wastes although numerous agro-industrial wastes are rich in
mixed populations.
The present work tested three kinds of waste coming from different sectors of the agricultural and food industries: fermented
apple juice (FAJ), wine lees (WL) and yogurt wastewater (YW).
Each waste was tested for its possible capacity to form electroactive biofilms from its endogenous flora. The same wastes were then
tested as fuels to feed bioanodes that were formed with two different sources of inoculum: anaerobic sludge and garden compost.
Anaerobic sludge (actually aerobic sludge driven to anaerobic conditions during an acclimating period) was chosen because of its
common use as MFC inoculum. Bioanodes formed in garden
compost have shown efficient electroactive properties with acetate
(Parot et al., 2008b) and have revealed a rich microbial flora with
remarkable electroactive capabilities (Parot et al., 2009). It was
consequently expected that such bioanodes might be appropriate
for a large variety of different substrates.
2. Methods
2.1. Waste media
To simulate a leachate of apple farm wastes, fermented apple
juice (FAJ) was prepared by pressing Braeburn 65/75 apples; the
juice was fermented in a sealed container at room temperature
for at least 15 days. Flasks of 500 mL were filled and stored at
3 °C. Lees coming from the wine making process (WL) were obtained from a local wine grower. Yogurt waste (YW) was collected
from the yogurt production line of a local dairy. Samples of both
substrates were stored in 1.5 L plastic bottles at 3 °C or were
deep-frozen for long-term storage.
When indicated, the media were diluted (1:20) with the buffer
solution described below. pH and conductivity were systematically
measured using a Schott Gerate pH-meter CG 882 and a Metrohm
660 conductimeter (Swiss). Total chemical oxygen demand (COD)
was measured in anolytes and raw substrates following the standard method 8000 for 0–1500 mg COD/L (HACH France S.A.S.).
Characteristics of the raw media and after dilution are reported
in Table 1.
2.2. Inoculum sources and acclimation
Aerobic sludge was obtained from an urban wastewater treatment plant. Sludge was distributed in fully filled, closed 0.5 L bottles and acclimated to the different waste media by daily addition
of 1 mL of raw substrate with a syringe placed in the screw cap.
Substrate was added daily for 16 days and the whole acclimatizing
period was one month. During the acclimating period, the sludge
evolved rapidly to anaerobic conditions; for this reason we refer
to anaerobic sludge in what follows.
The microbial flora was extracted from the garden compost by
lixiviation. 10 mM NaCl solution was added to 1 L of compost to
give a final volume of 3 L. This mixture was placed in 2 or 3 L Erlenmeyer flasks, stirred for 24 h and then filtered through felt cloth.
The filtrate was placed in 0.5 L fully filled flasks and acclimated
by addition of 1 mL waste media twice a week for 30 days; it
was used one month after the last addition.
2.3. Electrochemical tests
The experimental unit was a cap-sealed three-electrode
cell of 50 mL, or 500 mL when indicated, with graphite felt
(2 2 0.5 cm, RVG, Carbone Loraine, France) as the working
electrode, an Ag/AgCl or an Standard Calomel Electrode (SCE) reference electrode and a platinum mesh (2 5 cm) as counter
electrode.
Chronoamperometry was performed at different potentials and
cyclic voltammetry was recorded in the range ÿ1.0 to +1.0 V/SCE at
10 mV/s in triplicate, using an SVP multichannel potentiostat (BioLogic Science Instruments; EC/Lab 2.0 software).
2.4. Microbial fuel cell studies
The two-chamber MFC was similar to the design already reported (Min et al., 2005). Two culture flasks (500 mL) were connected by a glass tube with a proton exchange membrane (3 cm
diameter) in the middle (Ultrex, CMI-7000 Membranes International, Inc., USA). Graphite felt (2 5 0.5 cm or 2 2 0.5 cm,
RVG, Carbone Loraine) and platinum mesh (2 5 cm) were used
as the anode and cathode respectively. Anolyte and catholyte had
a volume of 500 mL. Four kinds of anolyte systems were used as
follows:
(a) diluted substrate without exogenous inoculum;
(b) anaerobic sludge or compost leachate as inoculum with
sodium acetate 2 mM as model substrate;
(c) sludge inoculum fed with different diluted substrates;
(d) compost leachate inoculum fed with different raw
substrates.
The catholyte consisted of NaCl phosphate buffer (g/L): Na2HPO4, 2.75; NaH2PO4, 3.67; NaCl, 0.584 g/L; pH 6.7, conductivity
5.2 mS/cm. This buffer solution was also used in substrate dilutions. Gas diffusers were placed in both compartments to inject
nitrogen into the anodic compartment and air into the cathodic
compartment when indicated. Nitrogen was supplied from a laboratory line and air was supplied by an aquarium pump (1.5–2 L/
min). Anolyte and catholyte were stirred with magnetic barrels
(350 rpm).
The electrical circuit was closed with an external resistance of
1000 X. The cell potential drop Ucell (V) was recorded with a multimeter (Integra series 2700, Keithley Instruments, Inc., USA) interfaced with a computer. Current density J (A/m2) was calculated as
J = Ucell/(R Ag), where R (X) is the external resistance and Ag (m2) is
the anode projected surface area. The power density (W/m2) was
measured as a function of current density by varying the external
resistance from 100 to 56 324 X over a 3-min period.
2.5. Scanning electron microscopy (SEM)
SEM micrographs were taken with a Leo 435VP microscope
(Germany) using the software SRV-32. Samples were fixed with
4% glutaraldehyde solution, post-fixed with 2% OsO4 solution,
gradually dehydrated with acetone 50%, 70%, 100% solutions, and
finally coated with gold to be observed in SEM at 7.5 kV.
3. Results and discussion
3.1. Formation of electroactive biofilms under chronoamperometry
with three different waste media (FAJ, WL and YW)
Chronoamperometry of three waste media: fermented apple
juice (FAJ), wine lees (WL) and yogurt waste (YW) was performed
at different potential values in the range +0.3 to +0.7 V/SCE with
Table 1
Characteristics of raw and diluted substrates.
a
b
Substrate
Conductivitya
mS/cm
pHa
CODa
mg/L
Dilution
CODb
mg/L
Conductivityb
mS/cm
pHb
FAJ
WL
YW
4.20
1.45
4.82
4.01
3.69
4.05
52 514 ± 19 926
349 250 ± 39 527
136 542 ± 37 983
1:20
1:20
1:20
3501 ± 2510
10 843 ± 3904
8169 ± 2568
4.77
5.12
4.53
6.14
6.06
6.15
Raw substrate.
Diluted substrate.
B
300
+0.3V/SCE
Current density (mA/m²)
Current density (mA/m²)
A
+0.5V/SCE
240
+0.7V/SCE
180
120
60
0
0
5
10
15
20
25
30
35
time (d)
2500
2000
1500
t=0d
1000
t = 20 d
500
0
-500
-1.5
-1
-0.5
0
0.5
1
1.5
-1000
-1500
Potentiel (V vs. SCE)
Fig. 1. Electroactivity in raw YW. (A) Chronoamperometry at poised potentials +0.3, +0.5 and +0.7 V/SCE. (B) Cyclic voltammetry performed initially and after 20 days with
electrode poised at +0.5 V/SCE.
graphite felt electrodes. Media were used as obtained, without
dilution. As soon as electrodes were polarized, FAJ and WL gave
significant current density, which rose with rising imposed potential and then dropped continuously with time to lower values
around 50 mA/m2 whatever the potential value. This behavior indicated the presence of a soluble compound that was initially oxidized and progressively consumed, but it did not indicate any
formation of electrochemically active biofilm.
In contrast, the current generated in raw YW (Fig. 1A) at +0.3
and +0.5 V/SCE rose after 5 days lag-time up to value around
250 mA/m2. Such a trend in current has commonly been identified
as characteristic of the formation of an electroactive microbial biofilm on the electrode surface (Dulon et al., 2007). Biofilm formation
was delayed at higher potential value (+0.7 V/SCE). As already reported, too high a potential value can be detrimental to biofilm formation or lower the reproducibility of the results (Parot et al.,
2008a).
Voltammograms plotted at the beginning of the experiment (Fig
1 B) showed an oxidation wave that reached its maximal current
value from around +0.7 V/SCE. Occurrence of this oxidation reaction can explain why chronoamperometry performed at +0.7 V/
SCE led to fast modification of the composition of the medium in
the vicinity of the electrode in a way that was unfavorable to biofilm formation. The oxidation wave was no longer observed on the
voltammograms plotted at the end of the 20 days’ polarization. The
oxidation reaction that appeared from around ÿ0.3 V/SCE can be
attributed to a biofilm-driven process. On the reduction side, the
peak observed at ÿ0.6 V/SCE on the initial curve was due to the
reduction of dissolved oxygen trapped in the felt fibers, as was observed in control voltammograms (data not shown). The reduction
wave that started near 0 V/SCE after the 20 days of polarization
was due either to a biofilm-driven reduction process or to the
reduction of components that formed during chronoamperometry.
It can be concluded that FAJ and WL did not contain an endogenous microflora able to support the development of electroactive
biofilms, while YW presented promising capabilities that led to
current densities of up to 250 mA/m2 at +0.3 V/SCE.
3.2. Formation of electroactive biofilms under chronoamperometry
with two inoculum sources (sludge and compost leachate)
Two sources of inoculum were used, anaerobic sludge and compost leachate. Actually, efficient bioanodes have been formed in
garden compost (Parot et al., 2008a) but it has not yet been possible to use these biofilms out of the compost medium in which they
were formed. For this reason, the bioanodes were formed in compost leachate here, i.e. in filtrate that was obtained by lixiviating
garden compost with a saline solution (see Methods section). Chronoamperometry was performed in 500 mL compost leachate or in
50 mL anaerobic sludge suspension, both with 10 mM NaCl added.
No acetate or other substrate was added.
Compost leachate tested at different potential values gave the
three-phase current–time curves (lag-time, exponential increase,
plateau) that indicated formation of an electroactive biofilm.
Anaerobic sludge showed a faster current increase, almost linear
from the beginning of the experiment. This behavior can be explained by the quite long acclimating period in closed flasks (see
Methods section). Anaerobic sludge gave higher maximal current
density, which was reached in a shorter period (110 mA/m2 at
+0.7 V/SCE, day 6) than for compost leachate (70 mA/m2 at
+0.6 V/Ag/AgCl, day 10). These results confirm the capacity of both
media to be the source of efficient electroactive microbial species
and suggest that biofilm microbial populations coming from
wastewater may be more promising than those from compost.
3.3. Yogurt wastewater (YW) as inoculum and substrate in MFC
Following the results obtained with YW alone in Section 3.1,
YW were tested for their capacity to form an MFC by themselves.
The anode compartment was filled with YW diluted 1:20 v/v in
buffer solution and the cathode compartment contained the buffer
only. The electrical circuit was closed with a 1000 X external resistance. The power density increased with time to a maximal value
of 1.9 mW/m2 (49.4 mA/m2) at the 6th day, then fell slowly to
0.3 mW/m2 (18.6 mA/m2) at the 13th day and kept this value for
5 days.
Polarization curves, which were recorded periodically during
the test by changing the value of the external resistance, showed
maximal power density of 3.9 mW/m2 at current density of
22 mA/m2 on the 8th day. This maximal power density remained
small compared to the high current density (up to 250 mA/m2) observed under chronoamperometry (Section 3.1). The anode potential was measured during MFC operation vs. an Ag/AgCl reference
electrode placed in the anode compartment. The polarization
curves recorded by varying the value of the external resistance
indicated that the open circuit potential was around ÿ0.5 V and
did not change significantly during MFC operation. The anode
worked in the potential range from ÿ0.35 to ÿ0.25 V during MFC
operation, i.e. very far from the potential values used for chronoamperometry tests (+0.3 to +0.7 V vs. SCE). The biofilm consequently remained in the MFC configuration far from its full
capacity. Besides, biofilm formed under poised potential may develop different electrochemical behavior than biofilms formed in
MFC conditions.
In order to compare the electrochemical activity of the inoculum sources, MFCs were implemented with anaerobic sludge and
compost leachate in the anode compartment. Anolytes were added
with NaCl 10 mM to improve ionic conductivity. MFCs operated
first for several days without any addition of supplementary substrate, with a 1000 X external resistance. The current first increased, corresponding to biofilm formation, and then decreased
back to zero, similarly to a cell discharge. When the current was
back to around zero, 2 mM sodium acetate was added. In both
cases, the current density increased very fast and returned close
to zero after around 3 or 6 days for the compost-leachate MFC
and the sludge-MFC respectively (Fig. 2). The sudden diminution
of current observed at days 3 or 6 has commonly been noted in
MFC supplied with acetate (Liu et al., 2005). The complete consumption of the substrate resulted in sharp current diminution
after a stable plateau and not to a progressive current diminution
that would follow the progressive depletion of acetate in the bulk.
This means that the rate-limiting step does not linearly depend on
the substrate concentration.
The sludge-MFC gave higher performance (J in the range from
120 to 210 mA/m2, Coulombic efficiency 9.6%) than the compostleachate MFC (J from 100 to 160 mA/m2, Coulombic efficiency
4.7%). The current densities obtained were in approximately the
same ratio as the values obtained under chronoamperometry but
had higher values (Section 3.2), which is consistent because acetate
was added in the MFC experiments and not in the chronoamperometry tests.
3.5. Sludge-MFC fed with FAJ, WL and YW
Current density (mA/m²)
Studies on MFC with complex substrates generally use diluted
solutions. Heilmann and Logan (2006) diluted meat packing wastewater 1:4, Oh and Logan (2005) diluted cereal wastewater from
5950 to 595 mg COD/L, Zuo et al. (2006) diluted corn stover hydrolysates from 82 200 to 1000 mg COD/L. Complex industrial wastes
are generally diluted to avoid undesirable planktonic metabolisms
that may compete with the biofilm-catalyzed electricity generation
and also to decrease fouling on electrode and membrane surfaces.
The three waste media FAJ, WL and YW, were consequently tested
here after 1:20 v/v dilution with phosphate buffer 50 mM containing 10 mM NaCl. This dilution ratio was chosen also because it
brought to neutrality the dairy wastes, which generally represent
most favorable environmental condition for microorganisms.
Three sludge-MFC systems were implemented with FAJ, WL or
YW in the anode compartment. Anolytes were composed of
250 mL acclimated sludge (see Methods section) and 250 mL of
diluted substrate. The resulting initial CODs in anolytes were
7600, 20 200 and 14 300 mg/L for FAJ, WL and YW respectively.
MFCs operated at 1000 X without appreciable current generation
for 16 days (<5 mW/m2). MFCs were kept for another month on
open circuit for further acclimation of the inoculum sources to
the substrate media and ‘‘spontaneous” COD removal. Thereafter,
the electrical circuit was closed again through the 1000 X resistor
(day 0 in Fig. 3), anolyte and catholyte were stirred at 350 rpm
(from 8th day), and raw substrate was added sequentially at the
14th, 15th and 16th days. Neither nitrogen nor air flowed into
the MFC.
Stirring improved MFC performance instantaneously with FAJ
but not with YW. There was certainly no longer any substrate that
could be metabolized by microorganisms in the YW-fed MFC.
Power density increased with the first two additions of 1 mL raw
substrate up to plateau values around 35 mW/m2 with YW and
15 mW/m2 with FAJ. WL never gave appreciable power density (always <0.25 mW/m2). The last addition of 2 mL raw substrate did
not increase the power for FAJ and YW. Similar saturation profiles
have been reported by numerous authors: electricity generation is
dependent on fuel concentration until a plateau is reached. This
saturation value can be attributed to a maximum rate of electron
transfer reached by the metabolic mechanisms and/or by an increase in alternate electron acceptors that compete with the anode
(Catal et al., 2008; Gil et al., 2003; Kim et al., 2007; Lee et al., 2002;
Liu et al., 2005; Min and Logan, 2004; Zuo et al., 2006). At the end
of the experiment, polarization curves were recorded by changing
the external resistance in order to determine the maximal power
density that could be reached by each MFC. The values reported
in Table 2 confirm that anaerobic sludge is promising source of
electrochemical biocatalysts to enlarge the variety of fuels for
50
Power density (mW/m²)
3.4. Sludge-MFC and compost-leachate MFC fed with acetate
40
c
FAJ-MFC
YW-MFC
30
d
20
b
a
10
0
0
4
8
12
16
20
24
28
time (d)
Fig. 3. Effect of substrate addition in sludge-MFC fueled with fermented apple juice
(FAJ) and yogurt waste (YW). (a) Stirring at 350 rpm. Substrate addition: (b) 1 mL,
(c) 1 mL and (d) 2 mL. Dashed line at day 20 indicates change of the anolyte
(replacing 450 mL with substrate).
250
Sludge-MFC
200
Compost leachate-MFC
Table 2
Maximal power density and correlated current density extracted from polarization
curves in MFC inoculated with anaerobic sludge and fed with FAJ, WL and YW. Time
corresponds to power density evolution depicted in Fig 3.
150
100
Time,
days
50
0
0
2
4
6
8
time (d)
Fig. 2. Current density vs. time in sludge-MFC and compost-leachate MFC with
sodium acetate 2 mM. (R = 1000 X, Ag = 10 cm2). The curves start just after the
addition of acetate.
8
14
15
21
22
27
FAJ
WL
YW
Pmax,
mW/m2
J,
mA/m2
Pmax,
mW/m2
J,
mA/m2
Pmax,
mW/m2
J,
mA/m2
10.2
15.1
26.9
19.9
43.7
27.5
56.8
69.1
123.0
79.5
117.7
124.3
0.5
0.7
0.8
0.6
0.4
10ÿ4
5.2
6.3
6.6
5.7
3.4
1.8
2
12.8
30.2
53.8
24.4
4.6
14.5
84.7
130.4
231.9
117.3
28.7
A
0.8
E anode (V vs. Ag/AgCl)
The two substrates that gave the best performance in the
sludge-MFC (Section 3.5), FAJ and YW, were tested in MFCs inoculated with leachate from garden compost. The anode compartments were filled with 500 mL previously acclimated compost
leachate (see Methods section) and the external circuit was closed
with a 1000 X resistance for 6 days in order to ‘‘discharge” the cell
from the substrate contained in the inoculum. Then 1 mL of raw
FAJ or YW was added to each cell. Fig. 4 gives the power density
obtained, starting from the addition of the substrate.
With neither air nor nitrogen sparging, the first FAJ addition resulted in a power peak up to P = 62 mW/m2, which returned to
zero in less than 1 day (Fig. 4A). The Coulombic efficiency corresponding to this peak was around 1% with respect to the COD contained in the added aliquots. This suggests that the components
that contributed to current generation in FAJ were easily utilized
by the compost microorganisms (immediate increase of power
density) but at low concentration (low value of Coulombic efficiency). In contrast, the first addition of YW did not induce any
significant power increase from the baseline, around 20 mW/m2
(Fig. 4B).
The second substrate addition was simultaneous with air sparging in the cathode compartment (day 4). It resulted in a similar 1day peak with FAJ. The cathode reaction consequently did not affect this MFC. The second YW addition provoked an immediate in-
0.6
100
Anode potential
Air
0.4
80
N2
60
0.2
0
40
-0.2
20
-0.4
0
-0.6
0
2
4
6
time (d)
8
10
12
Power density (mW/m²)
FAJ -MFC power density
B
0.3
0.2
80
Air
N2
60
0.1
0
40
-0.1
-0.2
-0.3
20
YW-MFC power density
-0.4
Power density (mW/m²)
3.6. Compost-leachate MFC fed with FAJ and YW
crease of the power. In this case, air sparging in the cathode
compartment significantly improved the behavior of the cell, indicating that the cathode introduced a limitation step in the YW-fed
MFC. The power provided decreased from days 4 to 5 and it rose
again at day 5 when nitrogen was bubbled into the anode compartment. This behavior clearly indicated that oxygen diffused though
the membrane to the anode and disturbed the anode functioning,
while nitrogen bubbling restored its full performance. The anode
compartment likely contained facultative anaerobic microorganisms that were able to switch their metabolism from anode respiration to aerobic respiration. At the end of the experiment, the
anode potential (Ea) varied towards negative values, indicating
an improvement in anode efficiency.
In the FAJ-fed MFC, nitrogen sparging at day 5 did not have any
effect on the power provided because compounds able to be
metabolized had already been consumed at day 5. In contrast,
the third FAJ addition (day 7) no longer resulted in a 1-day power
peak but in stable power. The 2-day nitrogen sparging before the
third FAJ addition likely modified the composition of the microbial
population on the electrode surface, which became able to metabolize a larger range of organic compounds contained in the FAJ
medium, confirming the beneficial effect of strict anaerobic conditions for both MFCs.
After continuous nitrogen (anode) and air (cathode) sparging,
the power generation was stable in both MFCs. An ultimate substrate addition was made to verify the saturation value and determine the maximal power density provided in stationary conditions
at 1000 X, which were 23 mW/m2 for FAJ-fed MFC and 44 mW/m2
for YW-fed MFC. The polarization curves (Fig. 5) gave maximal values around 64 mW/m2 (at 253 mA/m2) and 92 mW/m2 (at 404 mA/
m2) respectively.
Strict control of simultaneous cathode aeration and anode deoxygenation are the main parameters that optimize MFC performance. These results obtained with similar compost-leachate
MFCs also indicate that MFCs, even inoculated from the same
source, can have different behaviors depending on the nature of
the fuel. Such observations can explain, for instance, the discrepancies reported in the literature about the effect of aeration. It has often been observed that power density decreased as the air flow
rate increased. Forcing air through a cathode tube has been shown
to result in cell voltage reduction by 25% in an MFC inoculated and
fed with wastewater (Liu et al., 2004). In a test using 0–200 mL/
min air flow rates, the power density of a similar MFC was reduced
from 60 to 40 mW/m2 (Min and Logan, 2004) but, conversely to
these reports, Gil et al. (2003) showed a sharp current increase
resulting from aeration of the cathode compartment at 100 mL/
E anode (V vs. Ag/AgCl)
MFC towards food-industry wastes, even though some substrates,
such as WL, remain quite recalcitrant.
A second experimental campaign was carried out by removing
450 mL of the solution from the anodic compartment and replacing
it by fresh diluted substrate (1:20 v/v). The power density diminished continuously from 34 to 3 mW/m2 with YW, while the MFC
with FAJ kept the same power density of 13–14 mW/m2. The
reduction of power density in the MFC fueled with YW can be explained by a rise in fermentable compounds that favored fermentative microbial metabolisms against electron transfer to the
anode (Freguia et al., 2007). Competitive fermentation processes
did not occur with FAJ, probably because the fermentation process
had already been completed during the preparation of the substrate. The maximal power density (Pmax) obtained during
1000 X operation and correlated current densities (J), measured
by varying the value of the external resistance, confirmed the conclusions (Table 2): sludge-MFC fed with YW had the best performance and YW was optimally exploited at low concentration of
substrate.
Anode potential
-0.5
0
0
2
4
6
8
10
12
time (d)
Fig. 4. Effect of substrate addition, nitrogen (anode) and air (cathode) sparging on compost-leachate MFCs. (A) FAJ-fed MFC, (B) YW-fed MFC. Arrows indicate additions of
1 mL raw substrate. R = 1000 X, Ag = 10 cm2.
(Senior researcher CNRS-LGC) and Dr. Basseguy (Senior researcher
CNRS-LGC) for their efficient help.
Power density (mW/m²)
100
80
60
Appendix A. Supplementary data
40
Supplementary data associated with this article can be found, in
the online version, at doi:10.1016/j.biortech.2009.11.076.
FAJ - MFC
20
YW - MFC
0
References
0
200
400
600
800
Current density (mA/m²)
Fig. 5. Power density recorded with various external resistances for compostinoculated MFC fed with fermented apple juice (FAJ) or yogurt waste (YW).
min in an MFC enriched over 3 years by feeding with starch processing wastewater.
3.7. SEM observations
Electrodes from sludge-MFC and compost-leachate MFC fed
with YW were observed by SEM after 35 days of operation. The
graphite fibers were poorly and non-uniformly colonized by bacteria. Dense microbial clusters with obvious formation of exopolymeric substances were rare, generally located only at the
external electrode surface and not on the inner fibers. Fiber colonization was low with both inoculums similarly to that observed by
other authors (Lee et al., 2003). Bacteria appeared to be predominantly coccus shaped as has also been mentioned by Liu and Logan
(2004). Nevertheless, whatever the nature of the bioanodes, overall
colonization appeared to be very poor. There is much room for
improving MFC performance by promoting biofilm colonization
onto anodes, as has been demonstrated in MFC with single or
mixed cultures (Bond and Lovley, 2005; Ren et al., 2007).
4. Conclusions
Fermented apple juice, wine lees and yogurt waste were investigated here as possible fuels for MFC. Wine lees were definitely
not suitable; yogurt waste was able to start an MFC with its endogenous microflora, while fermented apple juice was not. Nevertheless both FAJ and YW can be used in MFC using anaerobic sludge
or compost leachate as inoculum source. Performance was drastically influenced by nitrogen/oxygen sparging in the anodic/cathodic compartments. Under optimized conditions, compost-leachateinoculated MFC fed with yogurt waste provided stable power density around 44 mW/m2 (maximal value 92 mW/m2 at 404 mA/m2).
Using microflora coming from garden compost or from sludge revealed both efficient to exploit food-industry wastes as fuels. The
low colonization of the graphite felt anode indicated that significant improvement can be expected by increasing microbial settlement on the electrode surface. Operating without addition of any
buffer to the anode solution is another important direction to be
investigated to progress towards economically-efficient set-ups.
Acknowledgements
B. Cercado Quezada is supported by the European Union Programme of High Level Scholarships for Latin America (Program Alban), scholarship No. E06D101223MX. The authors gratefully
thank L. Etcheverry (Engineer CNRS-LGC), B. Erable (Researcher
CNRS-LGC), ML. de Solan (Microscopy manager at LGC), Dr. Albasi
Bond, D.R., Lovley, D.R., 2005. Evidence for involvement of an electron shuttle in
electricity generation by Geothrix fermentans. Appl. Environ. Microbiol. 71 (4),
2186–2189.
Catal, T., Li, K., Bermek, H., Liu, H., 2008. Electricity production from twelve
monosaccharides using microbial fuel cells. J. Power Sources 175, 196–200.
Chauduri, S.K., Lovley, D.R., 2003. Electricity generation by direct oxidation of
glucose in mediator less microbial fuel cells. Nat. Biotechnol. 21 (10), 1229–
1232.
Dulon, S., Parot, S., Delia, M.L., Bergel, A., 2007. Electroactive biofilms: new means
for electrochemistry. J. Appl. Electrochem. 37, 173–179.
Erable, B., Etcheverry, L., Bergel, A., 2009. Increased power from a two-chamber
microbial fuel cell with a low-pH air cathode compartment. Electrochem.
Commun. 11, 619–622.
Freguia, S., Rabaey, K., Yuan, Z., Keller, J., 2007. Electron and carbon balances in
microbial fuel cells reveal temporary bacterial storage behaviour during
electricity generation. Environ. Sci. Technol. 41 (8), 2915–2921.
Gil, G., Chang, I., Kim, B., Kim, M., Jang, J., Park, H., Kim, H., 2003. Operational
parameters affecting the performance of a mediator-less microbial fuel cell.
Biosens. Bioelectron. 18, 327–334.
He, Z., Angenent, L.T., 2006. Application of bacterial biocathodes in microbial fuel
cells. Electroanalysis 18 (19–20), 2009–2015.
Heilmann, J., Logan, B., 2006. Production of electricity from proteins using a
microbial fuel cell. Water Environ. Res. 78 (5), 531–537.
Holmes, D.E., Bond, D.R., Lovley, D.R., 2004. Electron transfer by Desulfobulbus
propionicus to Fe(III) and graphite electrodes. Appl. Environ. Microbiol. 70 (2),
1234.
Kim, N., Choi, Y., Jung, S., Kim, S., 2000. Effect of initial carbon sources on the
performance of microbial fuel cells containing Proteus vulgaris. Biotechnol.
Bioeng. 70 (1), 109–114.
Kim, J.R., Jung, S.H., Regan, J.M., Logan, B., 2007. Electricity generation and microbial
community analysis of alcohol powered microbial fuel cells. Bioresour. Technol.
98, 2568–2577.
Lee, S., Choi, Y., Jung, S., Kim, S., 2002. Effect of initial carbon sources on the
electrochemical
detection
of
glucose
by
Gluconobacter
oxydans.
Bioelectrochemistry 57, 173–178.
Lee, J., Phung, N., Chang, I., Kim, B., Sung, H., 2003. Use of acetate for enrichment of
electrochemically active microorganisms and their 16S rDNA analyses. FEMS
Microbiol. Lett. 223, 185–191.
Liu, H., Logan, B.E., 2004. Electricity generation using an air-cathode single chamber
microbial fuel cell in the presence and absence of a proton exchange membrane.
Environ. Sci. Technol. 38 (14), 4040–4046.
Liu, H., Ramnarayanan, R., Logan, B.E., 2004. Production of electricity during
wastewater treatment using a single chamber microbial fuel cell. Environ. Sci.
Technol. 38 (7), 2281–2285.
Liu, H., Cheng, S., Logan, B., 2005. Production of electricity from acetate or butyrate
using a single-chamber microbial fuel cell. Environ. Sci. Technol. 39 (2), 658–
662.
Melhuish, C., Ieropoulos, I., Greenman, J., Horsfield, I., 2006. Energetically
autonomous robots: food for thought. Auton. Robot. 21 (3), 187–198.
Min, B., Logan, B.E., 2004. Continuous electricity generation from domestic
wastewater and organic substrates in a flat plate microbial fuel cell. Environ.
Sci. Technol. 38 (21), 5809–5814.
Min, B., Kim, J.R., Oh, S.E., Regan, J., Logan, B., 2005. Electricity generation from
swine wastewater using microbial fuel cells. Water Res. 39, 4961–4968.
Niessen, J., Schröder, U., Harnisch, F., Scholz, F., 2005. Gaining electricity from in situ
oxidation of hydrogen produced by fermentative cellulose degradation. Lett.
Appl. Microbiol. 41, 286–290.
Niessen, J., Harnisch, F., Rosenabaum, M., Schröder, U., Scholz, F., 2006. Heat treated
soil as convenient and versatile source of bacterial communities for microbial
electricity generation. Electrochem. Commun. 8, 869–873.
Oh, S., Logan, B., 2005. Hydrogen and electricity production from a food processing
wastewater using fermentation and microbial fuel cell technologies. Water Res.
39, 4673–4682.
Parot, S., Delia, M.L., Bergel, A., 2008a. Acetate to enhance electrochemical activity of
biofilms from garden compost. Electrochim. Acta 53, 2737–2742.
Parot, S., Delia, M.L., Bergel, A., 2008b. Forming electrochemically active biofilms
from garden compost under chronoamperometry. Bioresour. Technol. 99, 4809–
4816.
Parot, S., Nercessian, O., Delia, M.L., Achouak, W., Bergel, A., 2009. Electrochemical
checking of aerobic isolates from electrochemically active biofilms formed in
compost. J. Appl. Microbiol. 106, 1350–1359.
Rabaey, K., Clauwaert, P., Aelterman, P., Verstraete, W., 2005. Tubular microbial fuel
cells for efficient electricity generation. Environ. Sci. Technol. 39 (20), 8077–
8082.
Rabaey, K., Van de Somperl, K., Magnien, L., Boon, N., Aelterman, P., Caluwaert, P., De
Schamphelaire, L., Pham, H., Vermeulen, J., Verhaege, M., Lens, P., Verstraete, W.,
2006. Microbial fuel cells for sulfide removal. Environ. Sci. Technol. 40 (17),
5218–5224.
Rabaey, K., Rodriguez, J., Blackall, L.L., Keller, J., Gross, P., Batstone, D., Verstraete, W.,
Nealson, K.H., 2007. Microbial ecology meets electrochemistry: electricitydriven and driving communities. ISME J. 1, 9–18.
Ren, Z., Ward, T.E., Regan, J.M., 2007. Electricity production from cellulose in a
microbial fuel cell using a defined binary culture. Environ. Sci. Technol. 41,
4781–4786.
Rezaei, F., Richard, T.L., Brennan, R.A., Logan, B.E., 2007. Substrate-enhanced
microbial fuel cells for improved remote power generation from sedimentbased systems. Environ. Sci. Technol. 41, 4053–4058.
Rismani-Yazid, H., Christy, A.D., Dehority, B.A., Morrison, M., Yu, Z., Tuovinen, O.H.,
2007. Electricity generation from cellulose by rumen microorganisms in
microbial fuel cells. Biotechnol. Bioeng. 97 (6), 1398–1407.
Schröder, U., 2007. Anodic electron transfer mechanisms in microbial fuel cells and
their energy efficiency. Phys. Chem. Chem. Phys. 9, 2619–2629.
Scott, K., Murano, C., 2007. Microbial fuel cells utilizing carbohydrates. J. Chem.
Technol. Biotechnol. 82, 92–100.
Zuo, Y., Maness, P., Logan, B., 2006. Electricity production from steam-exploded corn
stover biomass. Energ. Fuel. 20, 1716–1721.

© Copyright 2026