
Fast Stereovision by Coherence Detection
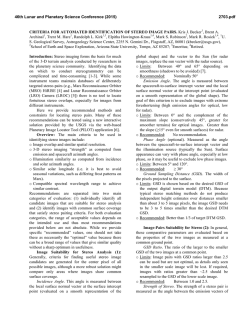
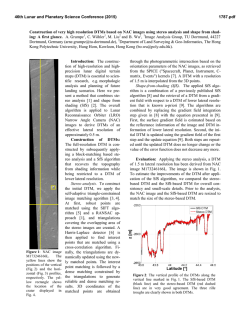
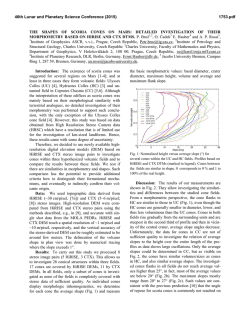
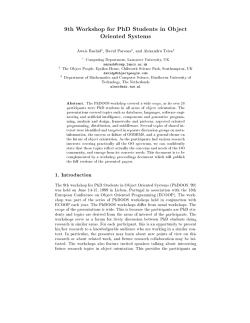
Fast Stereovision by Coherence Detection
R.D. Henkel
Institute of Theoretical Neurophysics,
University of Bremen
Postfach 330 440
D-28334 Bremen, Germany
Email: [email protected]
Abstract
In human stereovision, a vivid sensation of depth is created by the
small relative displacements of objects in the retinal images of the left
and right eye. Utilizing only two di erent views of a scene, the range of
disparities which simple disparity units can estimate is severely limited
by aliasing e ects. A new computational approach to stereo vision utilizes these aliasing e ects in a coherence detection scheme to allow the
calculation of dense disparity maps over a large range of disparities with
plausible biological hardware. The fast, non-iterative algorithm creates
within a single network structure simultaneously a disparity map exhibiting hyperacuity, a veri cation count of the disparity data and fuses the
left and right input images to the cyclopean view of the scene.
1 Introduction
The structure of 3D-space is hidden in the small relative displacements between
the left and right view of a scene (disparities). Beside the small displacements
of image parts, numerous other image variations occur between the two stereo
views, making the reliable computation of disparities a nontrivial problem. Sensor noise and di erent transfer functions of the left and right imaging system
introduce stochastic signal variations, whereas the varying view geometry leads
to a variety of systematic image variations, including occlusion e ects and foreshortening. In addition, since most object surfaces in real-world scenes display
specular re ection, the intensities observed by the imaging systems are not directly correlated with the object surfaces, but nearly always have a viewpoint
dependent component which moves independently of the surface in question.
Classical approaches to stereo vision try to counteract this whole set of
distorting signal variations with two basic algorithmic paradigms, known as
feature- and as area-based approaches 1]. In feature-based stereo algorithms,
the intensity data is rst converted to a set of features assumed to be a more
stable image property than the raw intensities. The matching stage operates
only on these extracted image features. In contrast, area-based approaches
compare directly intensity values within small image patches of the left and
right view, and try to maximize the correlation between these patches. To
assure stable performance, area-based stereo algorithms need suitably chosen
correlation measures and a su ciently large patch size.
Both types of stereo algorithms create computational problems which can be
directly attributed to the basic assumptions inherent in these approaches. For
example, only a few speci c feature-classes are generally utilized in feature-based
algorithms. Therefore most areas of the stereo images end up in the \no feature
present"-class, which is not considered further in the matching process. This
leads to a tremendous data reduction which speeds up processing, but makes
it impossible to calculate disparity estimates for most of the image regions. In
order to obtain dense disparity maps, one is forced to interpolate these missing
values.
To complicate matters further, every feature detected in the left image can
potentially be matched with every feature of the same class in the right image.
This is the classical \false matches"-problem, which is basic to all feature-based
stereo algorithms. The problem can only be solved by the introduction of additional constraints to the nal solution of the matching problem.
These constraints are usually derived from reasonable assumptions about
the physical properties of object surfaces, and rule out certain combination
of matches. Classical constraints include the uniqueness of a match, gural
continuity and the preserved ordering of matches along horizontal scanlines 2].
In conjunction with the features extracted from the images, constraints de ne a
complicated error measure which can be minimized by direct search techniques
or through cooperative processes.
The problems inherent to feature-based stereo algorithms can simply be
reduced by increasing the number of features classes considered in the matching
process. In the extreme case, one might utilize a continuum of feature-classes.
For example, the locally computed Fourier phase can be used for classifying
local intensity variations into feature-classes indexed by the continuous phase
value 3].
Using such a continuum of feature-classes, with the feature index derived
from some small image area, is very similar to standard area-based stereo algorithms. In these algorithms, not only a single feature value, but the full vector
of image intensities over a small image patch is used for matching.
Classical area-based approaches minimize the deviation or maximize the correlation between patches of the left and right view. A large enough patchsize
assures a stable performance (via the central-limit theorem). The computation of the correlation measure and the subsequent maximization of this value
turns out to be a computationally expensive process, since extensive search is
required in con guration space. This problem is usually solved within hierarchical approaches, where disparity data obtained at coarse spatial scales is used
to restrict searching at ner scales. However, for generic image data there is no
guarantee that the disparity information obtained at the coarse scales is valid.
The disparity estimate might be wrong, might have a di erent value than at
ner scales, or might not be present at all. Thus hierarchical approaches will
fail under various circumstances.
A third way for calculating disparities is known as phase-based methods
4, 5]. These approaches derive Fourier-phase images from the raw intensity
data. Extraction of the Fourier phase can be considered as a local contrast
equalization reducing the e ects of many intensity variations between the two
stereo views. Algorithmically, these approaches are in fact gradient-based op2
optical flow
ϕ
disparity calculations
ϕ
ϕ
t0
Left
t1
Right 1
t2
t
t
correct
Right 2
t
correct
wrong
Figure 1: The velocity of an image patch manifests itself as the main texture
direction in the space-time ow eld traced out by the intensity pattern in time
(left). Sampling such ow patterns at discrete time points can create aliasing
e ects which lead to wrong estimates if the velocity of the ow is too fast (right).
Using optical ow estimation techniques for disparity calculations, this problem
is always present, since only the two samples obtained from the left and right
eye are available for ow estimation.
tical ow methods, with the time-derivative approximated by the di erence
between the left and right Fourier-phase images 6]. The Fourier phase exhibits wrap-around, making it again necessary to employ hierarchical methods
| with the already discussed drawbacks. Furthermore, additional steps have
to be taken to ensure the exclusion of regions with ill-de ned Fourier phase 7].
The new approach to stereo vision presented in this paper rests on simple
disparity estimators which also employ classical optical ow estimation techniques. However, essential to the new approach are aliasing e ects of these
disparity units in connection with a simple coherence detection scheme. The
new algorithm is able to calculate dense disparity maps, veri cation counts and
the cyclopean view of the scene within a single computational structure.
2 Coherence Based Stereo
The estimation of disparity shares many similarities with the computation of
optical ow. But having available only two discrete \time"-samples, namely
the images of the left and right view, creates an additional problem in disparity
estimation. The discrete sampling of visual space leads to aliasing e ects which
limit the working ranges of simple disparity detectors.
For an explanation consider Figure 1. If a small surface patch is shifted over
time, the intensity pattern of the patch traces out a corresponding ow pattern
in spacetime. The principal texture direction of this ow pattern indicates the
velocity of the image patch. It can be estimated without di culty if the intensity
data for all time points is available (Fig. 1, left). Even if the ow pattern can
not be sampled continuously, but only at some discrete time points, the shift can
be estimated without ambiguity if this shift is not too large (Fig. 1, middle).
However, if the shift between the two samples exceeds a certain limit, this
becomes impossible (Fig. 1, right). The wrong estimates are caused by simple
aliasing in the \time"-direction; an everday example of this e ect is sometimes
3
seen as motion reversal in movies.
To formalize, let IL (') be the image intensity of a small patch in the left
view of a scene with corresponding Fourier transform IL (k'). Moving the left
camera on a linear path to the position of the right camera, we obtain a local
ow- eld very similar to Figure 1, namely: I ('; ) = IL (' + d ). Here d
is the disparity of the image patch and the shift parameter runs from 0
to 1. The Fourier transform of I ('; ) follows from elementary calculus as
I (k' ; k ) = IL (k' ) (k ? dk'). Now, if the spectrum of IL (k' ) is bounded by
' , i.e. if IL (k ' ) = 0 for jk ' j > k ' , we nd
some maximum wavevector kmax
max
' .
as highest wavevector of the ow eld I (k' ; k ) in -direction kmax = dkmax
However, the maximal representable wavevector in this direction is given by
sampling theory as kmax = = . Since sampling in -direction is done with
a step size of
= 1, we obtain as an upper bound for sampling the ow eld
without aliasing e ects
(1)
jdj < k' = 12 'min :
max
Equation (1) states that the range of reliable disparities estimates for a
simple detector is limited by the largest wavevector present in the image data.
This size-disparity scaling is well-known in the context of spatial frequency
channels assumed to exist in the visual cortex. Cortical cells respond to spatial
frequencies up to about twice their peak wavelength opt , therefore limiting the
range of detectable disparities to values less than 1=4 opt . This is known as
Marr's quarter-cycle limit 8, 9].
Since image data is usually sampled in spatial direction with some xed re' which can be present in the
ceptor spacing ', the highest wavevector kmax
'
data after retinal sampling is given by kmax = = '. This leads to the requirement that jdj < ' | without additional processing steps, only disparities less
than the receptor spacing can be estimated reliably by a simple disparity unit.
Equation (1) immediately suggests a way to extend the aliasing limited working range of disparity detectors: spatial pre ltering of the image data before or
' , and in turn increases the disparduring disparity calculation reduces kmax
ity range. In this way, larger disparities can be estimated, but only with the
consequence of reducing simultaneously the spatial resolution of the resulting
disparity map.
Another way of modifying the disparity range is the application of a preshift
to the input data of the detectors before the disparity calculation. However,
modi cation of the disparity range by preshifting requires prior knowledge of
the correct preshift to be applied, which is a nontrivial problem. One could
resort again to hierarchical coarse-to- ne schemes by using disparity estimates
obtained at some coarse spatial scale to adjust the processing at ner spatial
scales, but the drawbacks inherent to hierarchical schemes have already been
elaborated.
Instead of counteracting the aliasing e ects discussed, one can utilize them
within a new computational paradigm. Basic to the new approach is a stack
of simple disparity estimators, all responding to a common view direction, with
each unit i having some preshift or presmoothing applied to its input data.
Such a stack might even be composed of di erent types of disparity units. Due
to random preshifts and presmoothing, the units within the stack will have
4
di erent and slightly overlapping working ranges of reliable disparity estimates,
max
Di = dmin
i ; di ].
If an object seen in the common view direction of the stack has true disparity
d, the stack will be split by the stimulus into two disjunct classes: the class C
of detectors with d 2 Di for all i 2 C , and the rest of the stack, C , where
d 62 Di . All disparity detectors 2 C will code more or less the true disparity
di d, but the estimates of detectors belonging to C will be subject to random
aliasing e ects, depending in a complicated way on image content and speci c
disparity ranges Di of the units. Thus, we will have di d dj whenever units
i and j belong to C , and random values otherwise. A simple coherence detection
within each stack, i.e. searching for all units with di dj and extracting the
largest cluster found will be su cient to single out C . The true disparity d in
the common view direction of the stack can be estimated as an average over the
detected cluster:
d
hdi ii2C :
The coherence detecting scheme has to be repeated for every view direction
and leads to a fully parallel algorithm for disparity calculation. Neighboring
disparity stacks responding to di erent view directions estimate disparity independently from each other.
Since coherence detection is based on analyzing the multi-unit activity within
a stack, the scheme turns out to be extremely robust against single-unit failure. As long as the density of disparity estimators remains high enough along
a speci c view direction, no substantial loss of network performance will be
noticed.
3 Computational Structure
A computational structure realizing coherence-based stereo is quite simple (Figure 2). Arranging identical disparity units into horizontal disparity layers, left
and right image data is fed into the network of disparity layers along diagonally
running data lines. Thus each disparity layer receives the stereo data with a
certain xed preshift applied. This varying preshift between disparity layers
leads to slightly di erent working-ranges of neighboring layers. Disparity units
stacked vertically above each other are collected into the disparity stacks which
are analyzed for coherently coding subpopulations of disparity units.
In most of the simulations reported below, responses of two disparity units
i and j in a given stack are marked as coherent with each other whenever
jdi ? dj j < = 0:3 ? 0:5. Only the largest cluster found in each stack is read
out by the coherence mechanism.
This type of coherence detection can be realized easily with biological hardware, for example with neuronally implemented limit-cycle oscillators 10]. Assuming appropriate links structures, these neural oscillators will synchronize
their responses, but only if they code approximately the same stimulus value
11]. A valid disparity estimate would show up in such a network as a strong
coherent neuronal signal.
For the disparity estimators, various circuitry can be used. In the simulations
reported below, units based on motion-energy ltering 12, 13, 14], units based
on standard optical ow estimation techniques 6] and units based on algorithms
5
disparity planes
far
0
near
left data
ϕ
right data
disparity data
ϕR
L
Figure 2: The network structure for calculating stereo by coherence detection.
Simple disparity estimators are arranged in horizontal layers, which have slightly
overlapping working ranges. Image data is fed into the network along diagonal
running data lines. Within each of the vertical disparity stacks, coherently
coding subpopulations of disparity units are detected, and the average disparity
value of these pools is nally read out by the mechanism.
for the estimation of principal texture direction 16] were utilized. All these
disparity estimators can be realized by simple spatial lter operations combined
with local nonlinearities; at least the units based on motion-energy ltering are
currently discussed as models for cortical processing by complex cells.
The structure of the new network resembles super cially earlier cooperative
schemes used to disambiguate false matches 8, 15], but the dynamics and the
link structures of the new network are quite di erent. In the new scheme,
the disparity stacks do not interact with each other; thus no direct spatial
facilitation of disparity estimates is taking place. Such a spatial facilitation is a
central ingredient of almost all other cooperative algorithms. Some small spatial
facilitation enters coherence-based stereo only through the spatially extended
receptive elds of the elementary disparity units used.
Interaction in the coherence detection occurs only along the lines de ning
the disparity stacks. Essentially, this interaction is of the excitatory type, while
usual cooperative schemes have either none or inhibitory interactions along
such lines. Furthermore, coherence detection is a fast and non-iterative process, whereas classical cooperative algorithms require many iterations before
approaching some steady state.
Finally, the disparity units in classical cooperative schemes are basically
binary units, indicating the existence or non-existence of a possible match.
In coherence-based stereo, the disparity units are disparity estimators, giving
back a guess of what value the correct disparity might have. For this reason,
the disparity maps obtained by classical cooperative schemes and by the new
coherence-based stereo algorithm have a very di erent quality: classical schemes
return integer-valued maps, whereas the maps obtained with the new scheme
have continuous values, displaying hyperacuity (i.e. sub-pixel precision).
Since coherence detection is an opportunistic scheme, extensions of the neu6
A
B
Figure 3: The performance of coherence-based stereo on classical testimages. A)
The Pentagon. The overpasses are recovered well in the disparity map, and also
some of the trees in the center of the building are visible. B) Renault automobile
part. Even for the relative structureless background a good disparity estimate
could be obtained. Both disparity maps were calculated with an input image
size of 256x256 pixels.
ronal network to multiple spatial scales and to combinations of di erent types
of disparity estimators is trivial. Additional units are simply included in the
appropriate coherence stack. The coherence scheme will combine only the information from the coherently acting units and ignore the rest of the data. For
example, adding units with asymmetric receptive elds 17] will result in more
precise disparity estimates close to object boundaries.
Presumably, this is the situation in a biological context: various disparity
units with rather random properties are grouped into stacks responding to common view directions. The coherence-detection scheme singles out precisely those
units which have detected the true disparity. The responses of all other units
are ignored.
4 Results
Figure 3 shows some results calculated with the new algorithm on two classical
testimages. Data from several spatial scales was combined in each disparity
stack to yield the nal disparity maps. The results obtained with coherencebased stereo on these standard testimages are comparable to usual area-based
approaches. The resulting disparity maps are dense with clearly de ned object
7
A
B
C
D
E
F
G
Figure 4: When enough image detail is present, disparity is estimated by the new
algorithm with subpixel precision (E). In other image areas, a low a veri cation
count (F) indicates unreliable estimates. This can be used to mask unreliable
data (G). A simple superposition of the left and right input pictures displays
double contours (C), but the coherence detection scheme is able to fuse both
stereo pictures to the cyclopean view of the scene (D). Note the change of
perspective between the left and right input image and the cyclopean view.
borders.
Within the new coherence-based stereo algorithm, a simple veri cation count
can be derived from the relative number of coherently acting disparity units
in each stack, i.e. by calculating the ratio N (C )=N (C C ), where N (C ) is the
number of units in class C . The veri cation count can be used to mark unreliable
estimates.
Arti cial stimuli, as well as images taken in technical context, are sometimes
composed of large structureless regions. In those areas where the sensor noise
is stronger than the intensity variation correlated with the object surfaces, a
reliable estimation of disparities becomes impossible (parts of Figure 4E). With
coherence-based stereo, these areas can be detected by a low veri cation count
(Figure 4F). Using the veri cation count for masking all unreliable disparity
estimates, coherence-based stereo can mimic a standard feature-based algorithm
when confronted with di cult data (Figure 4G).
However, in contrast to classical feature-based approaches, none of the usual
constraints basic to feature-based algorithms are explicitly build into the coherence detecting network. Also, with coherence-based stereo, disparity estimates
will be obtained in all image areas with su cient structure, regardless of the
type of features present there. This is not the case with classical feature-based
algorithms, where one gets estimates only in image regions with the preselected
type of features.
As Figures 4E-G show in comparison to Figures 4A-B, the maps which are
output by the coherence-based stereo algorithm are neither aligned with the left
nor with the right view of the scene. This is a direct result of the network structure used (cmp. Figure 2). The diagonally running data lines in the network
correspond to the lines of sight from the left and right eye positions, but the
coherence detection is done within the vertical disparity stacks of the network.
8
A
B
C
Figure 5: The new scheme works well with very di erent source images. A)
Filling-in occurs in sparse random-dot-stereograms from coarser spatial channels
(top: stereo pair with 3% black dots, bottom right: true disparity, bottom left:
calculated disparity). B) Images without any localized image-features are also
handled well. C) Dense disparity maps are obtained for image data of natural
scenery, which usually has su cient detail for disparity estimation in all image
areas.
The links de ning these stacks split the angle between the left and right data
lines in half. Reprojecting data lines and coherence-detecting links back into
3D-space shows that the disparity stacks actually analyze the image data along
view lines splitting the angle between left and right view directions in half, i.e.,
along the cyclopean view direction. Therefore, any data which is output by
the coherence-based stereo algorithm is aligned with the cyclopean view of the
scene.
It is very easy to obtain the cyclopean view of the scene itself. Let IiL and
R
Ii be the left and right input data of disparity unit i, respectively. A simple
summation over all coherently coding disparity units,
I C = IiL + IiR i2C ;
gives the image intensities of the cyclopean view (Figure 4D).
Interestingly, the image constructed in this way is not severely distorted
even in areas where the disparity estimate is poor. Note that the fusion of left
and right input image to the cyclopean view is not an interpolation between
the left and right image data. This can be seen by observing the change in
perspective between the calculated cyclopean view and the left and right input
images. The simple superposition of both stereo images (Figure 4C) displays in
addition double contours which are absent in the cyclopean view.
Coherence-based stereo works equally well with very di erent source images.
In its multi-scale version, the coarser spatial channels interpolate disparity values at ner spatial channels when no estimate can be obtained there. Figure 5A
displays results of a disparity calculation with a random-dot stereogram having
only a pixel density of 3%. Due to lling-in, the true disparity map is recovered
to a large extent even in image areas with no detail. In contrast to other cooperative schemes, the lling-in occurs in coherence-based stereo instantaneously;
9
no iterative re nement or propagation of disparity values is necessary as with
other approaches.
As already mentioned, various types of disparity estimators can be used
within the basic algorithm. Fig. 5B shows results obtained with a disparity
unit based on an algorithm for the estimation of principal texture direction.
Classical feature-based stereo algorithms would fail with this stimulus set, since
the stereo data lacks any localized images features 18]. Finally, in Fig. 5C,
a disparity map obtained from an outdoor scene is shown. Natural imagery
usually has su cient detail present in all image areas and at all spatial scales,
so dense and stable disparity maps can be obtained with the coherence-based
stereo algorithm.
Acknowledgements
Fruitful discussions and encouraging support from H. Schwegler is acknowledged. Image data is supplied by Gerard Medioni, USC Institute for Robotics
and Intelligent Systems (Image 3B), the Kiel Cognitive Systems Group, G. Sommer, Christian-Albrechts-University of Kiel (Fig 4), by the Max-Planck-Institute
for Biological Cybernetics, AG Bultho , (Fig 5B), and Bob Bolles, AIC, SRI
International (Fig 5C).
References
1] U. R. Dhond and J. K. Aggarwal, Structure from Stereo - A Review, IEEE
Trans. Syst., Man and Cybern. 19, 1489{1510, 1989.
2] J. P. Frisby, Stereo Correspondence and Neural Networks, in \Handbook of
Brain Theory", ed. M. A. Arbib, 937{941, MIT Press 1995.
3] J. Weng, Image Matching Using the Windowed Fourier Phase, Int. J. of
Comp. Vis. 3, 211{236, 1993.
4] T.D. Sanger, Stereo Disparity Computations Using Gabor Filter, Biol. Cybern. 59, 405{418, 1988.
5] M. R. M. Jenkin and A. D. Jepson, Recovering Local Surface Structure
through Local Phase Di erence Methods, CVGIP 59, 72{93, 1994.
6] J. L. Barron, D.J. Fleet and S. S. Beauchemin, Performance of Optical
Flow Techniques, Int. J. Comp. Vis. 12, 43{77, 1994.
7] D.J. Fleet and A. D. Jepson, Stability of Phase Information, IEEE Trans.
Patt. Anal. Mach. Intel. 15, 1253{1268, 1993.
8] R. Blake and H. R. Wilson, Neural Models of Stereoscopic Vision, TINS
14, 445{452, 1991.
9] D. Marr and T. Poggio, A Computational Theory of Human Stereo Vision,
Proc. R. Soc. Lond. B 204, 301{328, 1979.
10] H. R. Wilson and J. D. Cowan, Excitatory and inhibitory interactions in
localized populations of model neurons, Biophys. J. 12, 1{24, 1972.
10
11] R.D. Henkel, Segmentation in Scale Space, in: "Computer Analysis of Images and Pattern, CAIP '95 Proceedings", LNCS 970, 41{48, Springer
1995.
12] N. Qian and Y. Zhu, Physiological Computation of Binocular Disparity, to
appear in Vision Research '97.
13] G. C. DeAngelis, I. Ohzawa, and R. D. Freeman, Depth is Encoded in
the Visual Cortex by a Specialized Receptive Field Structure, Nature 11,
156{159, 1991.
14] E. H. Adelson and J. R. Bergen, Spatiotemporal Energy Models for the
Perception of Motion, J. Opt. Soc. Am. A 2, 284{299, 1985.
15] K. Prazdny, Detection of Binocular Disparities, Biol. Cybern 52, 93{99,
1985.
16] J. Bigun, G. H. Granlund and J. Wiklund, Multidimensional Orientation
Estimation with Application to Texture Analysis and Optical Flow, IEEE
Trans. Patt. Anal. and Mach. Intl. 13, 775{790, 1991.
17] A. Fusiello, V. Roberto, and E. Trucco, A Symmetry-based Stereo Algorithm, Research report udmi/53/96/rr, submitted to CVPR 97, Machine
Vision Lab, University of Udine, Italy, 1996.
18] P. A. Arndt, HP. A. Mallot, H. H. Bultho , Human stereovision without
localized image features, Biol. Cybern. 72, 279{293, 1995.
11

© Copyright 2026