
Introduction to radio propagation and indoor propagation and a
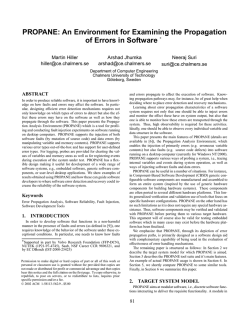
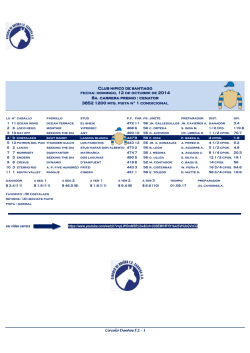
Rev. 1.0 An Introduction to Radio Waves Propagation: Generic Terms, Indoor Propagation and Practical Approaches to Path Loss Calculations, Including Examples By Adi Shamir1 Abstract: Estimating propagation path loss is required in order to predict the performance of a wireless system in its working environment. Free-space propagation loss calculation is explained. An empirical model is suggested for indoor path loss prediction. Theoretical calculation of reflection and transmission coefficients of electromagnetic waves from dielectric medium is shown as a tool for prediction of reflection and transmission losses. Simulative calculation is presented for demonstrating prediction of propagation loss through finite thickness walls. Simulation of the ‘2 ray model’ is presented to demonstrate the effect of antenna height on propagation loss, as an example of the ‘dominant path’ approach. Examples and simulations are given for a working frequency of 2.4GHz 1 Introduction Most wireless application designers are commonly interested in the basic questions of ‘what is the maximum distance for which the wireless channel is going to work’, or ‘is there going to be a communication link between 2 stations, if I place one here and another there…’. Unfortunately, answering these sorts of questions is not as easy as asking them. The simplest approach towards answering the above questions, is by comparing 2 things: a) the dynamic range of the system in hand, and b) the electromagnetic waves propagation loss. The dynamic range is a characteristic of the system that is well known to the designer. It determines the maximum power loss that is allowed throughout the communication channel (between transmitter and receiver), while still maintaining the communication link. The main characteristics that determine the dynamic range are the transmission power and receiver sensitivity. For example, if a system is said to have an 80dB dynamic range, it means that, in practice, the receiver can detect a power level 80 dB lower than the transmission power. Accordingly, a system having a transmission power of 10dBm can detect signals at a level not lower than –70dBm. The propagation loss is the part of the energy that is lost throughout the propagation path. The propagation path is the path through which the electromagnetic waves travel, from their origin at the physical location of the transmitter, until they reach the receiver location. For example, if at a certain path the propagation loss is 50 dB, and we have a 10dBm transmitter, the power level at the receiver will be –40dBm. © 2002, RFWaves Ltd. Page 1 of 21 Radio Propagation Rev. 1.0 Although the theoretical laws of physics describe very accurately the different aspects of electromagnetic wave propagation, it is vital to understand that the complexity of practical life makes the actual propagation loss very difficult to predict. In an ideal ‘freespace’ scenario, the traveling wave can be described as propagating in a direct ray from the transmitter to the receiver. However, most applications in today’s short range RF scene operate in environments that are far different from the ideal free-space scenario. Effects such as reflections or scattering of waves from floor, ceiling, walls, furniture and various objects lead to a situation in which the wave arriving at the receiver location is a result of interference between waves traveling through different paths (‘multipath propagation’). This interference can be either constructive or destructive, resulting in an increase or decrease of received power compared to the ideal free-space propagation. Energy absorbing objects that exist in any of the traveling wave’s path, such as walls, doors, and even the human body can also dramatically affect the propagation loss. Things get even more complicated when the systems themselves are mobile, which means that the coordinates in space of either the transmitter, receiver or both change with time, and therefore the propagation loss constantly changes. Many numerical tools and computational methods have been developed in order to help designers predict wave propagation loss in various environments. Such tools usually require substantial computational and financial resources. In many cases though, it is quite sufficient for the designer to use very simple models for propagation loss prediction. Such models will be described in detail in this article. 2 Free-Space Propagation As noted before, when an electromagnetic wave travels in free space, its path is described as a direct ray connecting the transmitter and receiver. In order to calculate the free-space propagation loss, it is possible to use the Ferris Transmission equation: P λ (2.1) r = g t ⋅ g r ⋅ Pt 4πR 2 Where: Pr is the received power, Pt is the transmitted power, gt and gr are the gain values of the transmitting and receiving antennas, respectively, and R is the physical distance between the transmitter and the receiver. The power in this model drops as the inverse square of the distance between the transmitter and the receiver; so, for example, when the distance increases by a factor of 2, the received power drops by 4. Equation 2.1 can be transformed into its more familiar form in a logarithmic scale, and the propagation loss in dB units can be written as: R 4πR (2.2) PL = −Gr − Gt + 20 log = Gr + Gt + 22 + 20 log λ λ © 2002, RFWaves Ltd. Page 2 of 21 Radio Propagation Rev. 1.0 Where Gr and Gt are the receiving and transmitting antenna gain values in dB, respectively, R is the distance between the transmitter and the receiver, and λ is the wavelength. Applying a wavelength of 12.3 cm (frequency = 2.44GHz) to Equation 2.2 yields: (2.3) PL2.44 = −Gr − Gt + 40.2 + 20 log( R) Where R is the distance in meters. Figure 2-1: Free-space Propagation Loss at 2.44GHz, shows the propagation loss in free space at a frequency of 2.44GHz assuming 0dBi antennas on both sides of the channel. (Gr = Gt=0). It can be seen in Figure 2-1: Free-space Propagation Loss at 2.44GHz that 40.2 dB of power are lost over the first meter. Whenever the distance increases by a factor of 10, 20 dB more of power are lost. Whenever the dynamic range of a system is given, Equation 2.3 can be solved for R and the maximum distance can be calculated. For example, a 2.44GHz system with a dynamic range of 80dB and zero dBi antennas can reach a distance of about 79[m] in free space. Figure 2-1: Free-space Propagation Loss at 2.44GHz © 2002, RFWaves Ltd. Page 3 of 21 Radio Propagation Rev. 1.0 It is important to note that the antenna gain is a directive property of the antenna, and must be determined according to the orientation of the antennas in space relative to the direction of propagation, when applying the above equations. It is also important to note that this model assumes that the antennas are polarizationmatched. Meaning, that there are no losses due to difference in antenna polarization. If the antennas are not polarization-matched, another loss factor has to be added to the equation. Generally, for an ideally linearly polarized antennas, the polarization loss is proportional to the square of the cosine of the angle between both polarization directions. So, for example, if 2 dipole antennas are placed at an angle of 45 degrees relative to each other, the polarization loss factor is around –3dB. The free-space propagation model is only a good approximation of real propagation loss in cases where the receiving and the transmitting antennas are close enough to each other, so that the distance between them is much smaller than the distance to any reflecting object. For instance, in an outdoor environment, it will be accurate only when the antennas are closer to each other than their height above the ground, so that the wave reflected from the ground loses its significance and does not interfere with the direct wave. When this is not the case, different models need to be applied, as will be explained in the following sections. 3 Indoor Propagation In today’s short range RF scene, many applications are targeted to operate in an indoor environment, such as residential homes or office buildings. As mentioned before, predicting propagation loss in such environments is very complicated. The main problem with numerical simulation tools used for that purpose, besides the financial and computational resources they require, is the fact that they are capable of simulating only specific site scenarios. They require, as part of the input data, a physical description of the site and the results, although being very accurate, will apply only to that site, and each time only to one position of the transmitter and receiver. Therefore, a more general and simple method of modeling is required. The most common method of predicting indoor propagation loss is by using empirical models. The empirical model is based on actual measurements made in a typical environment, that is similar to the one in which the system is commonly needed to operate. In practice, a transmitter and receiver are placed at various locations in the environment, at various distances apart, and the power loss is measured. A large amount of data is collected, and the power loss is plotted as a function of the distance between the transmitter and the receiver. Numerical curve fitting is then performed over the sampled points. The average behavior usually indicates that the power drops at a much higher rate than it does for the free-space propagation model. Whereas in the free-space model the power drops as the inverse square of the distance, the indoor empirical models show that the © 2002, RFWaves Ltd. Page 4 of 21 Radio Propagation Rev. 1.0 power in an indoor environment drops by a power of about 3 to 4 of the distance. The reason for that is destructive interference caused by various waves traveling through different paths to reach the receiving antenna, plus losses due to those waves encountering various objects in their paths. For example, a direct wave, a wave reflected from the floor, a wave reflected from the ceiling, waves reflected from walls and furniture, a wave propagating through a wall, etc. Figure 3-1: Indoor Propagation Loss in 2.4GHz – Experimental Result shows the result of an experiment performed in the RFWaves office in Israel. The inner walls of the office are made of gypsum boards. The transmitting and receiving antennas were placed at various locations in the office, at a height of 1 meter above the ground, and the power loss was measured. The frequency on which the measurements were made was 2.4GHz. The results were plotted as a function of the logarithm of the distance between the transmitter and the receiver. A linear fit using the minimal squares method was performed over the results and yielded the following approximation for the propagation loss in dB: (3.1) PLindoor − 2.4 ghz = 40 + 31log( R) ± 8 Where R is the distance in meters between the transmitter and the receiver. As was the case for the free-space formula (Equation 2.3), when the dynamic range is known, Equation 3.1 can be solved for R and will yield the maximum distance for the system in an indoor environment similar to the one in which this experiment was made. It can be seen from Figure 3-1: Indoor Propagation Loss in 2.4GHz – Experimental Result that, as in the free-space model for 2.4GHz, the first meter yields a 40 dB loss. This is because measurements were made where the antennas height above the ground was about 1 meter and so the free-space model is applicable. The issue of antenna height will be discussed in detail in section 6. However, unlike in the free-space propagation model, when we advance to a distance of 10 meters, we lose another 31 dB, which is 11 dB more than we lose at the same distance in free-space. From a different point of view, assuming we have a system with a dynamic range of 80 dB, solving Equation 3.1 for R shows that our systems will now operate to a distance of about 19.5[m], whereas the result we got for the free-space model based on Equation 2.3 was almost 80 meters! The factor 31 in Equation 3.1 means that the power now drops with distance, at a power of 3.1, which is much faster than in the free-space propagation model where the factor is 2. Due to the fact that this experiment can be made in different environments, with different conditions (such as different height of the ceiling, different materials of floor and walls, etc.) different experiments can yield different values for that factor. Numerous values can be found in the professional literature, mostly ranging from 3 to 4. © 2002, RFWaves Ltd. Page 5 of 21 Path Loss Radio Propagation Rev. 1.0 90 85 80 75 70 65 60 55 50 45 40 1 10 100 Distance[m] - logarithmic scale Figure 3-1: Indoor Propagation Loss in 2.4GHz – Experimental Result The reader must have noticed the 8dB error obtained in this experiment. This is a typical error for such models, and has to be taken into account when applying the empirical model to obtain the value of the propagation loss. There are 3 main reasons for this phenomenon: Different spots in the environment where the measurements were made may indeed yield a different result; although the distances are the same. This is because the various propagation paths depend on the physical characteristics and architecture of the environment in which the measurements are made. Fading effects in space: It can be observed that a small change in the coordinates of the receiver or transmitter in space, within fractions of a wavelength, can result in a significant change in the received power, within a range of 10dB. This happens when moving from ‘dead zones’, where destructive interference between propagation paths occurs, and the received power decreases, to zones where constructive interference occurs and the received power increases. These ‘deeps’ and ‘peaks’ are located in a resolution of the order of magnitude of around half a wavelength. This phenomenon is also known as ‘fast fading’ due to the high density of the variations. Figure 3-2: Fast Fading in an Indoor Environment – Simulation shows a simulation of this kind of behavior based on the presented indoor empirical model. The nature of this phenomenon can be described as random fluctuations of the signal power in space around an average value with some statistical distribution around that value. Fading effects in time: Even when the positions of the receiver and transmitter remain constant in space, the received signal seems to vary in time. The typical time constant for these fluctuations is a typical human time constant (seconds), and they originate from the dynamic nature of the environment, mainly due to human movements, opening and closing of doors, moving vehicles etc. The human movements affect the different propagation paths and therefore the propagation loss. © 2002, RFWaves Ltd. Page 6 of 21 Radio Propagation Rev. 1.0 Figure 3-2: Fast Fading in an Indoor Environment – Simulation To summarize this section, the empirical model for indoor propagation is a practical approach to estimate propagation loss in an indoor environment. However, although this method is practiced very often, it is important to remember that this is only a general averaging approach, which may not always reflect real life. When more accurate results are needed, numerical simulations must be made using the specific site information. An alternative approach to simulation, is calculating the propagation loss using the dominant path approach. This approach takes into account the interference between the most dominant propagation paths, i.e., the ones with the minimum propagation loss. For example, in an outdoor environment, the most dominant paths are usually the direct path, and path of the wave reflected from the ground. In General the superposition of the fields originating from the various dominant paths must include the amplitude and phase of the field arriving to the receiver from each path, as indicated by equation 3.2: (3.2) Etotal = ∑ E n e iϕ n n Where the sum goes through all the dominant paths, En is the field amplitude of the wave of path n and φn is the phase of that wave. In order to calculate the path loss through various paths when using the dominant path approach, it is necessary to know the propagation loss due to reflection and transmission of waves from and through various materials. This will be explained in detail in the following sections. © 2002, RFWaves Ltd. Page 7 of 21 Radio Propagation Rev. 1.0 4 Transmission and Reflection With Dielectric Materials A traveling electromagnetic wave that incidents a dielectric material, is partially reflected and partially transmitted (refracted) into the dielectric medium. In accordance with the conservation of energy, the sum of the power of the reflected and refracted waves must be equal to the energy of the incident wave. Furthermore, an electromagnetic wave traveling through a dielectric medium loses part of its energy due to the dissipation caused by polarization of the dielectric material by the wave’s electric field. Most often, when attempting to estimate propagation loss in complex environments, it is necessary to calculate the amount of reflected or transmitted energy from or through various objects. As indicated in the previous section, this is useful when trying to estimate propagation loss using the dominant path approach. A common example is the energy lost due to penetration of an electromagnetic wave through a wall, which will be discussed in further detail in section 5. Another example is the energy of a wave reflected from the ground on the propagation path, which will be discussed in section 6. When estimating the reflected or transmitted energy, it is necessary to calculate the field or power reflection and transmission coefficients. These coefficients depend on the dielectric properties of the dielectric medium, which are defined by its dielectric constant. This constant is usually written as a complex number (Equation 4.1), where the imaginary part is responsible for dissipation of energy when the wave travels through the dielectric medium. (4.1) ε r = ε r '+iε r ' ' The imaginary part is highly frequency-dependent, and is usually much smaller than the real part. In many cases it can be neglected in the analysis. Some dielectric constants (real part) of common materials in an indoor scenario appear in Table 0-1. The imaginary part for these materials is around 0.1 at the GHz scale. It is important to mention that these values are not well defined. For example, an outer concrete wall that is exposed to rain may have a higher dielectric constant than one that remains dry. Table 0-1: Dielectric Constants of Various Materials Glass 4-10 4.1.1.1 Marble 12 Concrete 4-6 Gypsum board 3 Wood 1.5-2 Formica 4 Water 80 Ground 5-30 The reflection and transmission coefficients also depend on the angle of incidence and polarization of the incident wave, as will be explained immediately. © 2002, RFWaves Ltd. Page 8 of 21 Radio Propagation Rev. 1.0 Assuming a plane wave traveling through air (ε=1) to a planar boundary of a medium having some dielectric constant ε (Figure 4-1). It is well known, that in order to satisfy the boundary conditions imposed by Maxwell’s equations on the planar boundary, the angle of reflection must be equal to the angle of incidence. In addition, Snell’s law must also be satisfied, so that the connection between the angle of incidence and the angle of transmission is: (4.2) sin θ = ε sin θ T Where θ is the angle of incidence and θT is the angle of transmission. θ θ ε θt Figure 4-1: A Wave incidents Dielectric Medium Remembering the fact that a traveling electromagnetic wave propagating in a certain direction is described by electric and magnetic periodic fields, both in the same phase, perpendicular to each other and to the direction of propagation, there are 2 possible polarizations for the incident electric field. TE polarization (transverse electric) is when the electric field is perpendicular to the plane of incidence (defined by the directions of the incident, transmitted and reflected waves) and the magnetic field is parallel to it, whereas TM polarization (transverse magnetic) is when the magnetic field is perpendicular to the plane of incidence and the electric field is parallel to it. In order to produce TM polarization, it is possible to place a transmitting monopole antenna vertically to the planar boundary, whereas placing a dipole antenna parallel to the planar boundary can produce TE polarization. Figure 4-2 shows the difference between TE and TM polarizations. © 2002, RFWaves Ltd. Page 9 of 21 Radio Propagation Rev. 1.0 TM Polarization TE polarization E H Propagation H Direction Propagation E ε Direction ε Figure 4-2: TE and TM Polarization The reflection coefficient for TE polarization is given by the following equation: (4.3) ΓTE = cosθ − ε cosθ T cosθ + ε cosθ T The transmission coefficient for TE polarization is given by: (4.4) TTE = 2 cosθ cosθ + ε cosθ T Figure 4-3: Reflection Coefficient For TE Polarization shows the reflection coefficient as a function of the incident angle for TE polarization, and various values of the dielectric constant. In TM polarization, the reflection coefficient is given by: (4.5) ΓTM = ε cosθ − cosθ T ε cosθ + cosθ T And the transmission coefficient for TM polarization is given by: (4.6) TTE = 2 ε cosθ ε cosθ + cosθ T Figure 4-4: Reflection Coefficient for TM Polarization shows the reflection coefficient as a function of the incident angle for TM polarization, and various values of the dielectric constant. In all the above equations for the reflection and transmission coefficients (4.3-4.6) θ is the angle of incidence, θT is the angle of transmission determined by Snell’s law (Equation 4.2), and ε is the dielectric constant of the medium. © 2002, RFWaves Ltd. Page 10 of 21 Radio Propagation Rev. 1.0 It can be seen, from the reflection coefficient at TM polarization as appears in Figure 4.4, that there is a certain angle, where no reflection occurs. This angle is called Brewster’s angle, and it equals: (4.7) θ B = arctan ε It is important to mention that the reflection coefficients presented above determine the ratio between the amplitudes of the incident and reflected electric fields. The fraction of the average reflected power is therefore given by the square of the reflection coefficient. (4.8) Preflected = Pincident Γ 2 And the transmitted power is given by: 2 (4.9) 1 − Γ = ε T 2 Figure 4-3: Reflection Coefficient For TE Polarization © 2002, RFWaves Ltd. Page 11 of 21 Radio Propagation Rev. 1.0 Figure 4-4: Reflection Coefficient for TM Polarization The average fraction of reflected power in a logarithmic scale (dB units) can therefore be derived from the reflection coefficient by: (4.10) Γdb = 20 log Γ This calculation can be used when calculating propagation loss due to reflection, and added to the free-space logarithmic propagation equation (Equations 2.2-2.3). It can be observed from the expressions for the reflection coefficients that, for a direct wave (zero angle of incidence), there is no distinction between TM and TE polarizations, which is obvious from symmetry. Figure 4-5 shows the average fraction of reflected and transmitted power in a dB scale, for a case of a direct wave as a function of the dielectric constant. It is clear from Figure 4-5: Power Transmission/Reflection Coefficient for Direct Waves that the smaller the dielectric constant, the more energy is transmitted and less is reflected. For high dielectric constants, most of the energy is reflected and only a small amount is transmitted. For a dielectric constant of around 34, (like wet ground, for instance) half of the energy (3dB) is transmitted and half reflected. Figure 4-6: Reflection Power Loss of a Direct Wave – Common Indoor Materials shows the reflection coefficient in a dB scale for some common materials, in an indoor environment. It can be seen, for example, that a gypsum board wall is not reflective at all, and around 10 dB are lost on direct reflection, whereas a marble floor is a lot more reflective and only 5 dB of loss occurs on direct reflection. Again, it must be noted that the examples in this figure are rather general. For example, a glass with metal plating, a concrete wall with metal reinforcement, or a wet wooden floor can be highly reflective and show a different reflection coefficient. © 2002, RFWaves Ltd. Page 12 of 21 Radio Propagation Rev. 1.0 Figure 4-5: Power Transmission/Reflection Coefficient for Direct Waves Marble Concrete Glass Gypsum board Woo Figure 4-6: Reflection Power Loss of a Direct Wave – Common Indoor Materials This analysis assumes that the dielectric medium is a half infinite medium. It gives quite good results for the reflection coefficient when the dielectric layer is fairly thick or when the energy dissipation through the wall (caused by the imaginary part of the dielectric constant) is high. Whenever it is required to estimate transmission or reflection coefficients from / through thin layers, a more complicated approach has to be taken, as © 2002, RFWaves Ltd. Page 13 of 21 Radio Propagation Rev. 1.0 will be explained in the next section. In such cases, we must consider the reflections from the inner parts of the wall, which interfere with the main reflected wave. This causes strong dependence of the reflection coefficient on the thickness of the wall. However, when the wall is thick enough, and the attenuation factor (imaginary part of the dielectric constant) is large enough, the attenuation dampens the inner reflections and the infinitely thick layer analysis is a good estimation of reality when calculating the reflection coefficient. Summarizing this section, it is possible to estimate the propagation loss of a reflected wave by knowing the dielectric qualities of the reflecting material and therefore the reflection coefficient. It is also possible to know the amount of transmitted energy, which can sometimes be used to place a minimum loss for propagation through finite thickness layers, such as walls and floors. Transmission through dielectric layers will be discussed in greater detail in the next section. 5 Effects of Walls and Floors In an indoor environment, when several walls or floors separate the transmitter and receiver, it is important to estimate the path loss through the walls / floors and include it in the path loss calculation. Theoretically, a wall or floor can be analyzed as one or more layers of dielectric material, parallel to each other, each having a finite thickness and a complex dielectric constant depending on the material from which the layer is made. When an electromagnetic wave hits the wall, standing waves will be set up inside the wall. The wall can then be treated as a transmission line with impedance mismatch junctions in the layer separation points, including the 2 outer layers that interface with free air. Applying Snell’s law (Equation 4.2) on each of the layers shows that the angle of transmission from the wall into the air on its opposite side is equal to the angle of incidence. The reflection and transmission coefficients can then be calculated and the results are a function of the angle of incidence, the dielectric properties of the wall and the polarization of the incident wave. The calculation method will not be described here. Figure 5-1 and Figure 5-2 present simulations of reflection and transmission coefficients, respectively, at 2.44GHz for a 0.3m thick brick wall of dielectric constant 4-0.1i for both TE and TM polarizations. It can be seen in Figure 5-1 and Figure 5-2, that for this © 2002, RFWaves Ltd. Page 14 of 21 Radio Propagation Rev. 1.0 Figure 5-1: Reflection Coefficient of a Brick Wall, 2.44GHz, ε=4-0.1i Figure 5-2: Transmission Coefficient of a Brick Wall, 2.44GHz, ε=4-0.1i specific case, not more than 2 dB of power are lost in transmission through the wall at both polarizations, when the angle of incidence is lower than 60 degrees. It can also be seen that high losses appear in TM polarization when the angle is higher than 60 degrees. Another interesting thing to point out is the perfect transmission that appears in TE © 2002, RFWaves Ltd. Page 15 of 21 Radio Propagation Rev. 1.0 polarization at an angle of 65 degrees, where the wall appears almost invisible due to a resonance phenomenon. 6 Antenna Height Affection – 2-Ray Model When transmitting and receiving antennas are placed above a reflective surface, a significant degradation of received signal is observed. This can be analytically described by the ‘2-ray model’. This model treats the received power as an interference of 2 waves – a direct wave and a reflected wave, as drawn in Figure 6-1. Basically, this is a simple application of the dominant path approach explained in section 3, where the 2 dominant paths of propagation are the direct wave and the one reflected from the ground. Direct wave Reflected ε Figure 6-1: 2-ray Model The direct wave is treated as a free-space propagating wave and its propagation loss can be calculated as described in section 2, whereas the reflected wave is treated using the reflection coefficients described in section 4. The angle of incidence for the reflected wave is related to the distance between the antennas and their heights above the reflecting surface. The reflection coefficient, as we saw earlier, depends on the angle of incidence, the dielectric properties of the surface, and the polarization of the incident wave. The interference between the 2 waves must take into account the phase difference caused by the difference in distance covered by both waves. An additional 180 degrees phase shift must also be added to the reflected wave as its phase changes direction during reflection. Figure 6-2 and Figure 6-3 present simulation results of the propagation loss using the 2ray model, for a formica surface, with a dielectric constant of 4. This can be related to a practical situation in which the antennas are placed on an office table, or above a polished wooden floor. The propagation loss is described as a function of the distance between the transmitter and the receiver. The simulated frequency is 2.4GHz. Figure 6-2 describes the case where both antennas are at a height of 0.5 m and Figure 6-3 describes the case where the antennas are at a 5 cm height. The obtained path loss has minimum and maximum points. These are seen clearly in Figure 6-3 and are a result of the phase shifts between the 2 paths that create zones of © 2002, RFWaves Ltd. Page 16 of 21 Radio Propagation Rev. 1.0 constructive and destructive interference. In order to guarantee a communication link, it is essential to make sure that the system’s dynamic range covers the deepest minima, whenever it falls within the range of operation. It can be proved mathematically, that at a certain distance, often called ‘the breakpoint distance’, the last maxima occurs, and the received power starts degrading like 1/R4 instead of 1/R2 as in free space. This is caused when the distance covered by both reflected and direct waves is almost equal, and the reflected wave goes through a complete phase shift. In this situation, the reflection is almost total, and both waves show destructive interference. The breakpoint distance is given by: (6.1) Rbreakpo int = 4h1 h2 λ Figure 6-2: 2-Ray Propagation Loss, 2.44GHz, ε=4, h1=h2=0.5m © 2002, RFWaves Ltd. Page 17 of 21 Radio Propagation Rev. 1.0 Figure 6-3: 2-ray Propagation Loss, 2.44GHz, ε=4, h1=h2=5cm For example, implementing Equation 6.1 in a frequency of 2.4GHz, when both antennas are 0.5m above ground, the breakpoint distance is around 8m. At a height of 5cm, the breakpoint distance is 8cm. Figure 6-3 shows that beyond the breakpoint distance, TM polarization is better than TE polarization in terms of propagation loss. Concluding this part, the 2-ray model predicts the appearance of dips and peaks before we reach the breakpoint distance. Beyond it, we observe a high degradation of the signal. Therefore, the closer the antennas are to the surface, the closer the breakpoint distance and the higher the signal power decrease. 7 Summary The complexity of wave propagation in a non-ideal environment has been presented, with an attempt to show a practical approach to propagation loss estimation in such an environment, which is very important in order to estimate a communication system’s performance. The ideal free-space propagation model was presented. An empirical model for predicting propagation loss in an indoor environment was suggested, and compared to the free-space model. It showed higher degradation of the signal with distance, and, as an averaging approach, it also showed a relatively large prediction error. The concept of reflection and transmission losses was presented via the calculation of transmission and reflection coefficients of waves, which incident dielectric materials. It was shown that the reflection and transmission coefficients are highly dependent on the dielectric properties of the © 2002, RFWaves Ltd. Page 18 of 21 Radio Propagation Rev. 1.0 matter, the wave polarization and the angle of incidence. A simulation was presented to demonstrate propagation loss and reflections from finite thickness layers, such as walls. It was shown that the wall width and inner structure strongly influence the results. Finally, a simulation of the ‘2-ray model’ was presented in order to show the effect of antenna height on the propagation loss. It was shown that the reflected wave causes severe degradation of the signal due to its interference with the directly propagating wave. The 2-ray model was shown as a demonstration of the ‘dominant path’ approach, which uses the most dominant propagation paths in order to estimate propagation losses. The 2-ray model showed a high degradation of the signal due to the interference with the wave reflected from the ground. The models presented in this article can be applied with relatively minimal effort, when attempting to predict propagation loss in a complex environment, and give the RF system designer a probable answer to the question of what is the maximum distance over which the system in hand will work in a given environment. References H.L Bertoni , “Radio propagation for modern wireless systems”, Prentice Hall Inc, 2000 C.A Balanis, “Antenna theory – analysis and design”, 2nd edition J.W & Sons 1997, Chapter 2 “Fundamental parameters of antennas” J.D. Jackson, “Classical Electrodynamics”, 3rd edition, J.W & Ssons 1999 , Chapter 7 “Plane electromagnetic waves and wave propagation” Hiroyuki Arai, “Measurement of mobile antenna systems”, Artech House Inc, 2001 © 2002, RFWaves Ltd. Page 19 of 21 Radio Propagation Rev. 1.0 © Copyright 2002, RFWaves Ltd. All rights reserved Permission is given to review and use the material in this publication for personal reference only and the said material cannot be copied, modified, used, distributed or reproduced in any way without the prior written consent of RFWaves Ltd. RFWaves Ltd. provides the information contained in this publication "as is" and without any warranties. RFWaves Ltd. disclaims all express and implied warranties. In no event RFWaves Ltd. shall be liable for any loss of profit and/or business, nor for any incidental or consequential damages of any kind. RFWaves Ltd. may make changes to the material contained in this publication at any time without notice and without obligation. The Company’s products are covered by one or more of the following: Taiwan Patent No. 155994, USA Patent No. 6,535,545. Other patents pending. For more information please contact: RFWaves Ltd. 1c Yoni Netanyahu St. Or-Yehuda 60376 Israel Tel: +(972)-3-6344131 Fax: +(972)-3-6344130 E-mail: [email protected] Website: www.rfwaves.com © 2002, RFWaves Ltd. Page 20 of 21 Radio Propagation Rev. 1.0 1 Mr. Adi Shamir ([email protected]) graduated from the physics faculty of Tel Aviv University and is working as a senior RF Engineer in RFWaves (www.rfwaves.com). © 2002, RFWaves Ltd. Page 21 of 21


© Copyright 2026