
Jorge Perez-Lopez - Association for the Study of the Cuban Economy
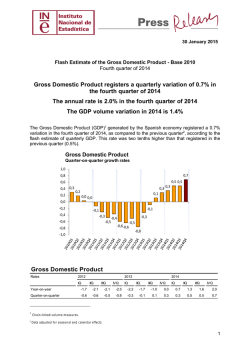
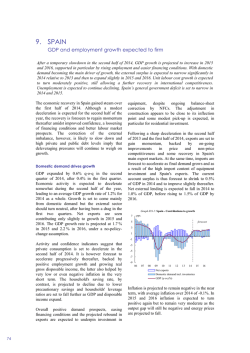
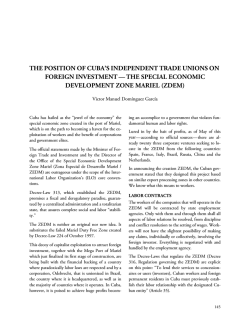
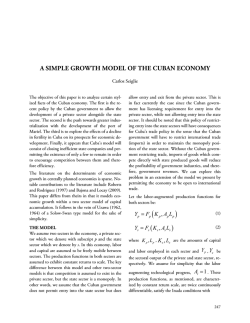
THE INSTITUTIONAL STRUCTURE OF PRODUCTION IN THE CUBAN ECONOMY Ernesto Hernández-Catá This paper presents estimates of Cuba’s gross domestic product (GDP) for the three principal sectors of the economy: the government, the state enterprises, and the non-state sector. It estimates government GDP on the basis of fiscal data and derives non-state GDP from a combination of employment and productivity data. Estimates for the state enterprises’ GDP are obtained as residuals. The article finds that the pronounced tendency for government output to increase faster than GDP since the late 1990s was reversed beginning in 2009, as the share of non-state production increased sharply. Nevertheless, the private share in the economy remains very low by international standards and particularly in comparison to most countries in transition from central planning. The results also indicate that the output of state enterprises tends to be crowded out by current government expenditure. The paper derives estimates for gross national income and finds that income is lower than GDP in the government sector because of interest payments on Cuba’s external debt. By contrast, national disposable income exceeds production in the non-state sector owing to remittances from Cubans residing abroad. THE INSTITUTIONAL STRUCTURE OF GROSS DOMESTIC PRODUCT The paucity of statistical information on several aspects of the Cuban economy is a serious problem and a challenge for researchers. To give a couple of exam- ples: comprehensive data on the balance of payments have not been published since 2011; the breakdown between controlled and free prices is not publicly available; and the balance sheets of the Central Bank of Cuba, the commercial banks and the banking system are unpublished.1 The lack of data complicates the analysis of several important aspects of the Cuban economy — for example any quantitative analysis of assets denominated in convertible pesos (CUCs) is extremely difficult if not impossible. In the area of the national accounts, the information provided by the National Statistical Office (ONE) is fairly extensive, although some important pieces are missing. In particular, there is no breakdown of the gross domestic product by institutional sector, and therefore separate information on production in the state enterprise and the non-state sectors of the economy is unavailable. Method This article presents rough estimates of Cuba’s GDP in the government, the state enterprises, and the non-state sector (which includes the private and the cooperative sub-sectors). The method is indirect inasmuch as many variables are proxies constructed on the basis of other variables that are logically related but are based on different methodologies. Sometimes the methods of lieutenant Columbo and inspectors Maigret and Montalbano had to be used; and resorting to guestimates was occasionally unavoidable. For 1. The only exception is the once-and-for-all publication of a summary balance sheet of the Central Bank of Cuba for 2009 and 2010. The occasion was a bond issue in international markets by the Central Bank of Cuba. See Luis (2013). 224 The Institutional Structure of Production in the Cuban Economy all these reasons, the estimates presented in this article must be interpreted with caution. Figure 1 and Table 1 show the main results of the exercise. • In Table 1, line 1 shows total GDP in current prices. It is based on data published by ONE from 1996 on; and on author’s estimates based on CEPAL (2000) from 1989 to 1995.2 • Line 2 is the GDP of the government, estimated as the sum of two components: (1) current government expenditure; and (2) government investment. Both series are published in ONE’s fiscal tables under the heading of “state government,”3 which includes the central, provincial and local governments but not, the state enterprises. Budget numbers are used for two reasons. First, there is no data on government investment on a national income and product account (NIPA) basis. Second, there is no separate data on the government’s net external position, which is substantial and has been growing rapidly in recent years reflecting transactions with Venezuela. In sum, it is impossible to construct data for government GDP on a NIPA basis. • The Cuban authorities do not publish data on GDP in the non-state sector. In line 3a of Table 1, this variable is estimated by (1) multiplying cooperative employment by the average productivity of labor in agriculture; (2) multiplying private employment by productivity in the nonagricultural sector; and (3) adding up these two estimates. (A detailed description of this procedure is provided in Annex A.) The rationale for • this approach is two-fold: (1) cooperative jobs are agricultural while private jobs are in a variety of sectors, as shown in Annex B; and (2) labor productivity in agriculture, and most particularly in the cooperative sector, is much lower than in other sectors. Output in the state enterprise sector (lines 3 and 3b) is obtained as a residual and therefore inherits errors and omissions in the estimates for the other sectors. Historical Context After the elimination of Soviet assistance, government GDP falls abruptly in the first half of the 1990s4 reflecting the collapse of investment and the unavoidable cut in current expenditure following the recession-induced collapse in fiscal revenue. Government GDP recovered in the second half of the decade (owing partly to the easing of fiscal constraints following the strong stabilization plan of 2003– 2004) and grew rapidly in the first half of the 2000s. It surged in 2005, partly as a result of a gigantic (and most probably fictitious) rise in expenditure on public health;5 and continued to increase very rapidly through 2008 owing partly to the strong growth of government-sponsored exports of professional services to Venezuela. However, the government share stabilized in 2009 and fell in 2010-11, as part of the austerity program implemented by Raúl Castro’s administration after the financial crisis of 2008. The structure of government expenditure reveals one of the most disturbing aspects of Cuba’s recent economic history: the weakness of capital formation. While government current spending expands from 34% of GDP in 1989 to 52% in 2009, the share of government investment falls during the same period 2. GDP data for the period 1989–1995 were obtained by splicing several series with equal percentage changes but different levels so as to generate a single, homogeneous series with no breaks. 3. Current government expenditure is what ONE labels “budgeted expenditures” (actividades presupuestadas). It includes health, education, defense & internal order, social security, administration, housing and communal services, productive sphere, culture and arts, science and technology, sports, and “other activities.” It does not include subsidies to enterprises. 4. It is important to note that this refers to production on a NIPA basis. Total government spending on a budget basis increased during that period because of a surge in subsidies to cover enterprise losses. 5. Health expenditures increased rapidly during the first decade of the XXI century, reflecting in part the growth of services provided by Cuban medical personnel in Venezuela. Even so, the 51% increase registered in 2005 is simply not credible. See Hernández-Catá (2013a). 225 Cuba in Transition • ASCE 2014 Table 1. Cuba: Structure of Gross Domestic Product by Institutional Sectors 1989 1995 2000 2005 2006 2007 2008 2009 2010 2011 1 Gross Domestic Product 21536 23930 30423 (in millions of pesos, at current prices) 42644 52743 58064 60806 62079 64328 68990 2 2a 2b Government Current expenditure Investment 10440 7380 3060 8255 6510 1745 10983 9233 1749 21823 18759 3064 26346 21525 4821 32293 27421 4872 36714 31764 4949 37607 32493 5114 35406 31511 3895 34694 30728 3966 3 3a 3b Rest of the economy Private and cooperative State enterprises 11096 1068 10028 15675 2758 12917 19440 5120 14320 20821 7740 13081 26397 8633 17763 25771 8988 16783 24092 9319 14773 24472 9127 15345 28922 9526 19396 34296 15875 18421 1 Gross domestic product 100 100 100 100 (In percent of total GDP) 100 100 100 100 100 100 2 2a 2b Government Current expenditure Investment 48.5 34.3 14.2 34.5 27.2 7.3 36.1 30.2 5.7 51.2 44.0 7.2 50.0 40.8 9.1 55.6 47.2 8.4 60.4 52.2 8.1 60.6 52.3 8.2 55.0 49.0 6.1 50.3 44.5 5.7 3 3a 3b Rest of the economy Privare and cooperative State enterprises 51.5 5.0 46.6 65.5 11.5 54.0 63.6 16.8 46.9 48.8 18.2 30.7 50.0 16.4 33.7 44.4 15.5 28.9 39.6 15.3 24.3 39.4 14.7 24.7 45.0 14.8 30.2 49.7 23.0 26.7 Source: Oficina Nacional de Estadísticas (various years), CEPAL (2000), and author's estimates. Figure 1. Institutional Composition of Gross Domestic Product (In percent of GDP) from 14% to 8% of GDP.6 The share of investment continues to fall, to less than 6% in 2011, but it jumps to 9% in 2012, for reasons that are not entirely clear. Economy-wide investment, which is available 6. The increase in government investment in 2012 (to 9.1% of GDP on a budget basis) is suspect, because total investment on a NIPA basis was only 8.6% of GDP in that year. Subtracting budget-based government investment from NIPA-based total investment for 2012 — an operation admittedly fraught with conceptual difficulties — thus implies a negative investment share of 0.5% for the nongovernment sector, which is difficult to conceive even allowing for methodological differences between the two series. 226 The Institutional Structure of Production in the Cuban Economy on a national accounts (NIPA) basis but only from 1996 on, falls in relation to GDP from 15% in 2006 to 8.6% in 2012. This ratio is very low by international standards, and this raises serious concern in view of the importance given to capital formation in the theoretical and the empirical literature on growth. By way of comparison, International Monetary Fund (IMF) data for 2012 show investment to GDP ratios of 19.8% for advanced economies, 32.2% for emerging market and developing economies, and 22.2% for Latin America and the Caribbean. The contribution of the non-state sector to the Cuban economy was very small at the end of Soviet area, but it picked up during the mid- and late 1990s, following the stabilization-cum-reform plan of 1994. The growth of the non-state sector tapered off and then fell during the first decade of the XXI century — a period of reaction against the reforms of the mid-1990s. But it surged in 2011–2012, boosted by the arrival of more than 400,000 employees (almost 8% of the labor force) transferred from the public sector as part of President Raúl Castro’s plan to deal with disguised unemployment and low productivity. During that period, government employment fell by almost half a million and, while most of that fall was absorbed by the private sector, some of it was reflected in a rise in open unemployment and a decline in the participation rate. In spite of the recent gains, the importance of the private sector in the Cuban economy remains very low compared with most other countries in the world, and notably with the countries in transition from former communist regimes. As shown in Table 2, the private share of GDP in most of these countries increased sharply during the 1990s and is currently in the range of 60% to 85%. Only the reactionary and incompetent regime of Belarus and the resource-rich sheikdom of Turkmenistan have managed to keep the private share below 45%. The point here is that the share of the private sector in the economy is an important factor in explaining economic growth during the transition period.7 The estimated share of state enterprise output recovered in 1991–95 from its post-Soviet slump but then stagnated for a few years and began a long decline that lasted through the remainder of the sample period. Historically there has been a tendency for the shares of current government spending and state enterprise outlays to be negatively correlated (see Figure 2). Apparently, enterprise outlays tend to be crowded out by government current expenditure, which seems to be given priority by the decision-makers.8 No such correlation was found between the government and the non-state shares of GDP, probably because the latter is determined mainly by political decisions to expand the sector (such as those adopted in 1994 and 2011) or to hinder its development through taxation and regulation (as occurred during the counter-reform of the 2000s). To summarize, the rising trend in the share of government output since the mid-1990s was interrupted in 2009 as part of a deficit-reduction plan. It increased again in 2012 owing to an unusually large (and, as noted above, rather suspect) increase in government investment which more than offset a continued decline in government current spending. The share of the non-state sector, which had stagnated for more than a decade, increased sharply in 2011–2012, but the state enterprise share appeared to resume its secular decline. THE INSTITUTIONAL COMPOSITION OF EMPLOYMENT Data on the structure of employment in Cuba is relatively well covered by ONE. It is broken down in two ways: according to the economic classification 7. Empirical evidence is provided in Hernández-Catá (2006). 8. An OLS regression of the state enterprise share of GDP (as dependent variable) against the share of government current expenditure yields an adjusted R2 of 0.934 and a slope coefficient of –0.92 associated with a t statistic of 7.7, suggesting an almost one-to-one crowding out of enterprise expenditure. These results are confirmed by using instrumental variable estimates. When the regression relates state enterprise output to total government expenditure (both as ratios to GDP), the adjusted R2 and the t-statistic for the slope coefficient are much lower. 227 Cuba in Transition • ASCE 2014 Figure 2. Cuba: Government Current Expenditure vs. Enterprise GDP (Percent of GDP) Table 2. Czech Republic Slovakia Estonia Hungary Latvia Lithuania Poland Bulgaria Croatia Slovenia Romania Khazakstan Russia Azerbaijan Serbia Ukraine Uzbekistan Belarus Turmenistan Cubad Private Share of GDP in Cuba and other Transition Countriesa (In percent) 1990b … … … … … 10 29 … … … … 5 25 10 … 10 10 5 10 5 1995 … 70 70 70 60 65 60 45 50 45 60 25 55 25 … 40 20 15 15 12 2000 … … 80 80 70 70 70 75 … 65 70 60 70 45 … 60 45 20 25 18 2005 … 80 80 80 70 75 75 75 65 65 70 65 65 45 … 65 45 25 25 18 2010 85 80 80 80 76 75 75 75 70 70 70 65 65 60 60 60 45 30 25 15 Per capita GDPc 27600 24100 21700 22119 18100 21400 20600 14100 17600 27800 12700 13500 17500 10400 10600 7300 3500 15500 8600 10200 Source: Per capita GDP is from Wikepedia (Central Intelligence Agency estimates). Private sector shares are from European Bank for Reconstruction and Development (various issues), except the Czech Republic. a. Countries with GDP above US$25,000 according to the World Bank. b. Data are for 1989, 1990 or 1991, whichever was available. c. In US dollars, on a purchasing power parity dollar basis. d. From Table 1. Includes private sector and cooperatives. 228 (which among other things allows the breakdown between the agricultural and non-agricultural sectors); and by type of institution. Table 3 shows the levels and shares of employment in (1) the public sector (central, provincial and local governments plus state enterprises) in line 1; and (2) the non-state sector (line 2). Employment in the state enterprises is not available separately, but a very rough indication of its magnitude can be obtained by ascribing to the government sector the category of “social and communal services” taken from the economic classification (line 1a). This category includes mostly health and education, but also defense & internal security, administration, science & technology, social security & assistance, culture & sports, and other community services. The residual, obtained by subtracting employment in the social and community services from total public employment, provides a very rough idea of employment in the state enterprises (line 2b). The statistical office disaggregates employment in the non-state sector between the private sector (line 2b); and cooperatives (line 2a), as shown in Figure 3. The private sector, in turn, includes self-employment and “other items.” Self-employment is non-agricultural, but there is no up-to-date breakdown between the agricultural and non-agricultural components of the “other items” — a breakdown that would have permitted a more precise mapping of the institutional and economic categories of private employment The Institutional Structure of Production in the Cuban Economy Table 3. Cuba: Institutional Structure of Employment 1989 1995 2000 2005 2006 2007 Overall economy 4356 4169 4379 4723 1 1a 1b Public sector Communal & social services Other 4127 ... ... 3495 1195 2300 3541 1772 1769 3786 1860 1926 3889 1950 1939 4036 2063 1973 2 2a 2b Non-state sector Cooperatives Private sector Self employment Other 229 65 164 25 139 674 349 326 138 188 838 323 515 361 153 937 271 666 169 496 866 257 609 153 456 832 242 590 138 451 1 1a 1b Public sector Communal & social services Other 94.7 ... ... 83.8 28.7 55.2 2 2a 2b Non-state sector Cooperatives Private sector Self employment Other 5.3 1.5 3.8 0.6 3.2 16.2 8.4 7.8 3.3 4.5 2008 2009 2010 2011 2012 5072 4985 5010 4902 4112 2100 2013 4250 2196 2054 4178 2154 2024 3873 2082 1791 3684 1945 1740 836 234 602 142 461 823 232 591 144 448 806 217 589 147 442 1137 209 929 392 537 1218 213 1005 405 601 80.9 40.5 40.4 (In percent of total employment) 80.2 81.8 82.9 83.1 83.8 39.4 41.0 42.4 42.4 43.3 40.8 40.8 40.5 40.7 40.5 83.8 43.2 40.6 77.3 41.6 35.7 75.2 39.7 35.5 19.1 7.4 11.8 8.3 3.5 19.8 5.7 14.1 3.6 10.5 16.2 4.4 11.8 3.0 8.9 22.7 4.2 18.5 7.8 10.7 24.8 4.3 20.5 8.3 12.3 (In thousands of employees) 4755 4868 4948 18.2 5.4 12.8 3.2 9.6 17.1 5.0 12.1 2.8 9.3 16.9 4.7 12.2 2.9 9.3 16.2 4.6 11.7 2.8 8.8 Source: Oficina Nacional de Estadísticas (various issues), CEPAL (2000), and author's estimates. Figure 3. Institutional Structure of Non-State Employment (in thousands of workers) and thus the construction of a sector-specific private productivity variable. In these circumstances, a second-best approach was adopted in this paper to estimate GDP in the private and non-state sectors, an approach that involves the use of agricultural productivity for cooperatives, and of non-farm productivity for the private sector (see details in Annex A). As not- ed earlier, the rationale for this procedure is that labor productivity is much smaller in agriculture than in other sectors. Moreover, there is evidence that (1) non-agricultural workers account for much of private employment; and (2) those agricultural workers included in the private sub-sector (i.e., individual private farmers and members of the Cooperatives for 229 Cuba in Transition • ASCE 2014 Credit and Services, or CCS) have considerably higher productivity and income than their counterparts in other agricultural cooperatives, such as the UBPCs (see Annex B). THE STRUCTURE OF NATIONAL INCOME ONE defines gross national income (GNI) as gross domestic product minus net factor income from abroad; this corresponds to the traditional concept of gross national product or GNP.9 In Cuba, net factor income includes some investment income by companies but it consists mostly of interest payments on the country’s external debt (which is serviced by the state). Therefore, net factor income has a consistently negative sign. ONE defines gross national disposable income (GNDI) as gross national income plus net current transfers from abroad. Transfers consist of: private remittances from Cubans residing abroad; net public donations from abroad (a relatively small item); and a fairly mysterious category which I have attributed to net Cuban government transfers to foreigners.10 To summarize: GNI = Gross national income GNDI = Gross national disposable income TR Net current transfers GDP + Gross domestic product = GNI + Gross national income OTR + Net official transfers tinued; information on exports and imports of goods and non-factor services is still available from the national income and product accounts, but data for factor income and current transfers are not. A few aspects of Table 4 are of note. • For the overall economy, GNDI is almost always smaller than GDP, as net factor payments abroad exceed net current transfer receipts (which alternates between net credits and net debits). Thus, Cuba has uses part of the income derived from domestic production and foreign remittances to service the interest on its external debt and, apparently, to finance official transfers to the rest of the world.11 • Lines 2, 2a and 2b in of table 4 derive GNDI for the non-state sector by adding private remittances, provided by Morales (2013), to the GDP of that sector.12 The effect is to raise disposable income substantially by supplementing earnings from production (mostly wages). As a result, the share of the non-state sector in GNI is significantly larger than its share in GDP, and reaches almost 23% in 2011.13 • Lines 3, 3a and 3b shows the income of the public sector (central, provincial and local governments plus state enterprises). It is obtained by adding net factor income and net official donations and transfers to the sector’s GDP. Net official transfers are calculated by subtracting Morales’ (2013) numbers for private remittances NFI Net factor income TR Net transfer income from abroad REM Private remittances Table 4 shows the transition from domestic product to national income. Most of the data was published in ONE’s reports until the year 2011, after which publication of balance of payments data was discon- 9. In its system of national accounts, the United Nations publishes a time series for national income in Cuba. The numbers are very close to those presented in Table 4: the root-mean-squared deviation between the two series is only 0.68%, and there is no indication of bias. 10. See Hernández-Catá (2013b) for an explanation of how these transfers are calculated. 11. Luis R. Luis has pointed out to me that my estimate for net official transfers abroad may be subject to an upward bias owing to the practice of converting peso values into dollars at par. If official transfers (a net debit item) are originally measured in pesos, conversion at 1 CUP per U.S. dollar would mean that total net current account transfers — and therefore GNI — are under-estimated. An alternative hypothesis is that these “official transfers” represent the counterpart of Cuba’s net current account position vis-à-vis Venezuela, i.e., the difference between exports of services to Venezuela and Cuban oil imports from that country. This would imply that these transactions are not matched by capital account transactions (i.e., borrowing), and therefore must be matched by unilateral current transfers. 12. This definition is not meant to capture the entire range of transfers from the government to the household sector. This would involve inter alia dealing with taxes, subsidies and transfers associated with free education and health. 13. According to Morales (2013), residents of Cuba received in-kind remittances from abroad to the tune of $2.5 billion in 2011, which would further increase total non-state income to $18 billion, or 26% of national disposable income. However, estimates of inkind transfers are not available for prior years. 230 The Institutional Structure of Production in the Cuban Economy Table 4. Cuba: Estimates of National Income by Institutional Sector 1989 1 1a 1b 1c 1c Total GDP plus: net factor income Gross national product (GNP) plus: net current transfers Gross national income 2 2a 2b GDP, non-state sector Plus: private remittances Income, non-state sector 3 GDP, public sector 3a plus: net factor income 3b plus: official transfers, net 3c Income, pubic sector a Public sectoa Non-state sector 1995 2000 21536 -338 21198 -48 21150 23930 -525 23405 470 23875 30423 -622 29801 740 30541 1068 100 1168 2758 414 3172 5120 987 6107 20468 -338 -148 19982 21172 -525 56 20703 25303 -622 -247 24434 94.5 5.5 86.7 13.3 80.0 20.0 2005 2006 2007 2008 (In millions of pesos, at current prices) 42644 52743 58604 60806 -633 -618 -960 -1055 42011 52125 57644 59751 -367 278 -199 482 41644 52403 57445 60233 7740 1144 8884 2009 2010 2011 62279 -1643 60636 235 60871 64328 -1432 63043 -196 63563 68990 -1064 67897 261 68792 8633 1251 9885 8988 1363 10351 9319 1447 10766 9156 1653 10809 9526 1920 11446 13298 2295 15593 34904 44109.55 -633 -618 -1511 -973 32760 42519 49616 -960 -1562 47094 51487 -1055 -1082 49350 53123 -1643 -1812 49668 54802 -1432 -2231 51139 55692 -1064 -2344 52284 (Shares of national income, in percent) 78.7 81.1 82.0 81.9 21.3 18.9 18.0 18.1 81.6 18.4 80.5 19.5 76.0 24.0 Source: Oficina Nacional de Estadísticas (various issues), Morales (2013), and and author's estimates. a. Central and local governments plus state enterprises. from total net current transfers as reported by ONE’s balance of payments through 2009. • CONCLUSIONS A number of tentative conclusions can be drawn from the results presented in this paper. • • The government share of GDP fell during the post-Soviet recession but then rose steadily all the way through 2009, reflecting the growth of current government expenditure. In the 2000s, government spending was boosted by rapidly growing exports of services to Venezuela. Investment by the government — which accounts for the bulk of economy-wide capital formation — collapsed after the elimination of Soviet assistance and has remained very low. The share of investment by all sectors also has been quite low in absolute terms and in comparison with the averages for other country groups, particularly for the emerging market and transition countries. By contrast the share of government current spending increased steadily through most of the sample period, although it declined markedly from 2010 to 2011 as part of the austerity program implemented after the financial crisis of 2008. • • Following the reform plan of 1993–94, the share of the non-state sector in GDP rose through the rest of the 1990s, from a very low level in the Soviet-dominated 1980s. It declined in the first decade of the XXIst century, but surged in 2011– 12 reflecting a large transfer of employees from the state sector. Nevertheless, the non-state and private sector shares of the economy remain very small by international standards and notably by the standards of the countries in transition. The relative importance of state enterprises appears to have declined markedly during the past two decades. To some extent this may have reflected the effects of booming services exports to Venezuela which boosted the output of the central government. In general, there is a statistically significant tendency for government current spending to crowd out the output of the state enterprises. Non-state output, on the other hand, is uncorrelated with government spending and appears to evolve mainly in response to official decisions to liberalize or to repress the sector. National income in the government sector is lower than GDP because of interest payments on the external debt and, possibly, because of official transfers abroad. 231 Cuba in Transition • ASCE 2014 • By contrast, income in the non-state sector exceeds GDP by a growing margin, essentially because of dollar remittances from Cuban-Americans abroad. Finally, there is a major problem whose resolution is beyond the scope of this article, but which must at least be noted. The Cuban authorities translate data for transactions denominated in foreign currency into Cuban pesos (CUPs) at the fixed exchange rate of one Cuban peso (CUP) per U.S. dollar. Under this convention (which is retained in this paper), dollar values are identical to peso values. Historically, however, the exchange value of the peso applicable to households has been much lower and it is currently CUP 24 per dollar. Clearly, the 1:1 exchange rate assumption introduces major distortions in the national accounts and in the balance of payments. For example, the peso value of many exports (nickel, sugar and tourism among others) is grossly under estimat- 232 ed, while the dollar value of most non-traded goods and services is over-estimated. In the income accounts, the dollar value of wages (mostly denominated in CUPs) is overestimated, while the peso value of private remittances is under-estimated — although this is offset by an under-estimation of the peso value of interest payments abroad. The task of disentangling all the elements of bias introduced by the use of a 1:1 conversion factor would be daunting. For the time being, the corresponding distortions have to be accepted, although they should be clearly recognized. The good news is that the Cuban authorities are in the process of unifying the existing multiple exchange rate system, too slowly hélàs, but fairly surely. Ultimately, one important result of this change will be the adoption of a single exchange rate for all transactions and all sectors, as well as for the purpose of statistical conversion. The Institutional Structure of Production in the Cuban Economy ANNEX A Estimating GDP in the Non-State Sector An important consideration in estimating non-state GDP is that productivity is radically different in the two main components of this sector: cooperative and private. As can be seen in Table A, productivity in agriculture (which dominates cooperative employment) rose very little from 1995 to 2011, and was just below 3 in 2012. By contrast productivity in the non-agricultural economy (which is more characteristic of private employment) has risen considerably over the sample period and is currently about 6 times higher than agricultural productivity. The task of constructing a time series for non-state GDP would be simple if employment data disaggregated by both institutional and economic categories were available. Unfortunately, the relevant information provided by ONE was discontinued after 2000, and the data provided by the International Labor Office (ILO) is only for the period 2006–2008 (see Annex B). Table A. 1. Using the economic classification, calculate the value of average labor productivity in agriculture (line 1c in Table A), and in the non-agricultural sector (line 2c), by dividing nominal GDP by employment in the corresponding sector. 2. Multiply cooperative employment (from Table 3) by agricultural productivity; and private employment by non-agricultural productivity. This yields estimates of GDP in the two sub-sectors (lines 3a and 3b). Estimation of Non-State GDP (GDP in millon cuban pesos at current prices, employment in thousand workers) 1989 Total GDP Total employment Average productivity 1a 1b 1c GDP in agriculture Employment in agriculture Average productivity 2a 2b 2c GDP outside agriculture Employment, non agricultural Average productivity 3a 3b 3c In those circumstances there is no alternative but to rely on a more indirect method based on two simplifying assumptions: (1) productivity in the cooperative sector can be approximated by the (low) agricultural productivity; and (2) productivity in the private sector can be approximated by the (higher) non-agricultural productivity. The specific steps involved in the calculation of non-state GDP follow directly from those assumptions. GDP in cooperatives Private GDP Total non-state sector 1995 2000 2005 2006 2007 2008 Economic classification 52743 58604 60806 4755 4868 4948 11.1 12.0 12.3 21536 4356 4.9 23930 4169 5.7 30423 4379 6.9 42644 4723 9.0 2147 721 3.0 1313 835 1.6 2018 1188 1.7 1861 956 1.9 1700 952 1.8 2181 912 2.4 19389 3635 5.3 22617 3334 6.8 28405 3192 8.9 40783 3766 10.8 51043 3803 13.4 56423 3955 14.3 1990 1995 2000 2005 194 875 1068 548 2209 2758 550 4583 5133 528 7212 7740 2009 2010 2011 2012 62079 5072 12.2 64328 4985 12.9 68990 5010 13.8 71017 4902 14.5 2211 919 2.4 2322 946 2.5 2230 922 2.4 2400 987 2.4 2716 944 2.9 58595 4029 14.5 59757 4127 14.5 62099 4063 15.3 66590 4024 16.5 68301 3958 17.3 Institutional classification 2006 2007 2008 2009 2010 2011 2012 569 8558 9127 525 9001 9526 508 15367 15875 612 17349 17960 459 8174 8633 579 8410 8989 563 8756 9319 Source: Oficina Nacional de Estadísticas (various issues), CEPAL (2000) and author's estimates Note: Average productivity in lines 1c, 2c and 3c is GDP divided by employment. Lines 3a and 3b are obtained by multiplying economy-wide productivity in the agricultural and non-agricultural sectors by employment in the cooperative and private sectors, respectively. In the institutional classification, cooperative GDP is based on agricultural productivity, and private GDP is based on non-agricultural productivity. 233 Cuba in Transition • ASCE 2014 be very large: jobs in mixed enterprises were reported to be 25,000 in 2000, the last year in which they were published, or about 5% of private employment. Provincial data for 2010 suggests that the number could now be somewhat larger (see Annex B). 3. Add up these two estimates to obtain a proxy for GDP in the non-state sector (line 3c). This is also the estimate reported in Table 1. Several observations can be made regarding these estimates. • • 234 First, the assumption that non-agricultural productivity can be used as a proxy for productivity in the private sector is restrictive, but it is unavoidable and arguably legitimate. There are reasons to believe that private jobs are much more productive than cooperative jobs: (1) we know that self-employment (an important part of private employment) is entirely non-agricultural; and (2) the evidence presented in Annex B indicates that the rest of private employment is either non-agricultural or involves high-productivity private farmers. It also includes the Credit and Services Cooperatives (CCS), where productivity is lower than in the private farms, but higher than in the other agricultural cooperatives Non-state GDP estimates are biased downward because employment in mixed enterprises, which is no longer published separately, is now included in the state sector. But this bias is unlikely to • Another source of downward bias is the fact (noted by Locay, 2003) that many workers who are effectively unemployed in the public sector are known to spend part of their time performing work for their own account. Furthermore, an unknown but probably significant share of private transactions are known to take place underground. It is unclear to what extent these activities may or may not be captured in the official measure of GDP. • The estimates of non-state GDP shown in Table A assume that workers transferred from the state to the non-state sector immediately acquire the skills required to operate in their new jobs at historical levels of productivity. If the learning process takes time, however, non-state GDP estimates for certain years (particularly 1994 and 2011–12) would suffer a temporary upward bias. The Institutional Structure of Production in the Cuban Economy ANNEX B On the Composition of Private Employment Non-state Employment in the Year 2000 Historically, non-state employment has been dominated by employment in the private sector, which includes self-employment and a residual category of “other private” workers. In turn, this residual category comprises: (1) an agricultural component consisting of private farms and Services and Credit Cooperatives (CCS)14; and (2) a non-agricultural component including self-employment, private salaried jobs, and other private jobs. Until the year 2000, the combined institutional/economic breakdown of private employment could be easily calculated (see Hernández-Catá 2003, particularly Table 3). After that, however, ONE discontinued the publication of a table that was required to perform this calculation. The procedure used to estimate the composition of non-state employment in 2000 involved subtracting, for each economic class, state employment (which was available separately at that time) from total employment. This procedure yielded the following composition of non-state jobs for the year 2000: agriculture, hunting forestry and fishing, 25.9%; commerce, restaurants & hotels, 15.1 %; manufacturing, 11.8%; construction, 4.3%; transportation, storage & communication, 4.3%; mining, 3.4%; community, social & personal services, 35.4%; and others, 3.6%.15 The data for 2000 are too distant to be of much use for constructing time series for a period running through 2012, but it is interesting to note that they attribute most jobs in the non-state sector to a variety of non-agricultural activities. However, these data have some problems. First, the number for “community and social services,” which is believed to correspond mostly to the government sector, appears to be too high. Second, subsequent revisions raised the original number for total employment in 2000 from 3,541 thousand to 4,379 thousand, increased the share of agriculture and reduced the share of the community, social & personal sector; this resulted partly from the inclusion of military employment in the total. Evidence from ILO Data The International Labor Office has published employment data by economic class for the entire Cuban economy and for the public sector, albeit only for the period 2006–2008.This makes it possible to establish the economic classification for the private sector which is summarized in Table B for the year 2008. The table shows that 36% of non-state sector employees work in a variety of non-agricultural jobs. Combining the economic distribution published by the ILO with ONE’s institutional data (second panel of Table B), it is possible to gauge the importance of agriculture in both the non-state and the private sector following the procedure described in the previous sub-section. On that basis, more than one half of private employment in 2008 was found to be in the non-agricultural sector. The proportion is probably much higher now, judging from the huge increase in self-employment in 2011–2012. Evidence from Provincial Data As mentioned earlier, ONE does not publish a detailed breakdown of nationwide private employment by economic categories. However, statistics for three provinces do provide some valuable data up to the year 2010. The three provinces are La Habana, Camagüey, and Santiago, which jointly accounted for 41% of private jobs in Cuba in that year. Table C summarizes the relevant information for the year 14. There is some justification for the inclusion of the CCS in the private (rather than the cooperative) sub-sector. These entities are less subject to severe bureaucratic interference than other cooperatives (like the Basic Units of Cooperative Production) and have somewhat greater managerial and price-setting autonomy. Not surprisingly, they are more productive. Private farmers earn much higher incomes than their counterparts in cooperatives and their inclusion in the private sector is undisputable. 15. The residual category includes: electricity, gas & water; finance, insurance & real estate; and joint ventures. 235 Cuba in Transition • ASCE 2014 Table B. Economic and Institutional Structure of Non-State Employment, 2008 Economic classification Non-state sector Agriculture, hunting & forestry Mining & quarrying Manufacturing Electricity Construction Trade, restaurants & hotels Transport, storage & communications Finance, insurance & real estate Community, social services Thousand workers 836 534 -2 43 22 59 39 114 62 -34 % of non-state employment 100.0 63.9 -0.3 5.1 2.6 7.1 4.7 13.6 7.4 -4.1 Institutional classification Non-state sector Cooperatives Private CSS plus private farmers Private non-agricultural 836 234 602 300 302 100.0 28.0 72.0 35.9 36.1 Source: International Labor Office (ILO), Oficina Nacional de Estadística, and author's estimates. Note: Note: Negative numbers reflect inconsistencies between total and state employment data. Economic classification obtained by subtracting public sector employment from total employment, using ILO data. Institutional classification: ONE and author's estimates. CSS + private farmers: estimated as the difference between agriculture, hunting and forestry’ in the ‘economic ‘classification, and ‘cooperatives’ in the institutional classification. Private non-agricultural is private employment minus employment in CSS and cooperatives 2010.16 For the 3 provinces combined, high-income private farmers accounted for 12.5% of private employment and the CCS for just over 28%. Non-agricultural employment thus accounted for 59% of private jobs, of which self-employment represented roughly 42%. To facilitate comparisons with Table 3 in this article, the private sector is defined here to exclude mixed enterprises (i.e., joint ventures). If they were included in the private sector, mixed enterprises would account for 17% of the private jobs in the three provinces. This compares with 5% estimated in Annex A for the entire economy in the year 2000. There are two possible explanations for the difference: (1) the share of mixed enterprises may have increased from 2000 to 2010; and (2) the 2010 share is probably higher for the three provinces than for the overall economy because Havana has a disproportionate share of employment in joint ventures. Table C. Distribution of Private Employment in 2010, by Province (in percent) 3 Provinces Havana Total private employment a 100 100 Credit and Services Cooperatives 28.3 29.9 Private farmers 12.5 8 Self employed 42.2 33.1 17 29 Otherb Memorandum item: Mixed enterprisesc 17 29 Camagüey Santiago 100 100 26.9 16.3 49.8 7 21.4 54.1 24.2 0.3 7 0.3 Source: ONE, Estadísticas Provinciales a. Excluding mixed enterprises b. Includes mercantile societies, associations and foundations, and family workers. c. In percent of total private employment including mixed enterprises Even though it is risky to make inferences for the country as a whole on the basis of information for three provinces only, the data in this Annex basically confirms that it is reasonable to identify private employment with the relatively high non-agricultural productivity, as assumed in the estimation of private GDP. 16. The provincial database includes some entertaining information. For example, the Province of Las Tunas reports that, in 2008, 16% of the self-employed worked in transportation, 10% in retail food sales and preparations, about 3% each in carpentry and message delivery and 5% in other identified categories including hairdressing and barber shops, shoe repairs, manicure shops, repair and recharging of lighters, clowns, and so on. This leaves 64% in unidentified activities for the analyst to guess what they are. 236 The Institutional Structure of Production in the Cuban Economy REFERENCES Comisión Económica para América Latina y el Caribe (CEPAL, 2000). La Economía cubana en los noventa. Fondo de Cultura Económica, México, D.F. European Bank for Reconstruction and Development (EBRD (various issues). Transition Indicators. London. Hernández-Catá, Ernesto (2003). “Output and Productivity in Cuba: Collapse, Recovery, and Muddling Through to the Crossroads.” Cuba in Transition — Volume 13. Washington: Association for the Study of the Cuban Economy. Hernández-Catá, Ernesto (2006). “Transition as an Inter-Sectorial Shift: Theory and Empirical Evidence for the Former Soviet Union.” Cuba in Transition — Volume 16. Washington: Association for the Study of the Cuban Economy. Hernández-Catá, Ernesto (2013a). “Accounting for the Growth of Real GDP in Cuba. An Exploratory Empirical Study.” In Economic Behavior, Game Theory, and Technology in Emerging Mar- kets. Bryan Christiansen and Basilgam Müslüm, editors. London: IGI editions. Hernández-Catá, Ernesto (2013b). “Another Cuban Statistical Mystery.” Ascecuba.org//blog. (September). International Labor Office (ILO) Database. Locay, Luis (2003). “Schooling vs. Human Capital: How Prepared is Cuba’s Labor Force to Function in a Market Economy?.” Cuba in Transition — Volume 13. Washington: Association for the Study of the Cuban Economy. Luis, Luis R. (2013). “Convertible pesos: how Strong is the Central Bank of Cuba?” Ascecuba.org// blog. Morales, Emilio (2013). “Cuba: $2.6 Billion in Remittances in 2012.” http://www.havanatimes.org/?p=94444. Oficina Nacional de Estadísticas e Información (ONE, various issues). Anuario Estadístico de Cuba. La Habana. Wikipedia (2013).”Per Capita GDP in the World.” U.S. Central Intelligence Agency estimates. 237


© Copyright 2026