
printmgr file - The Cushing™ Closed
Annual Report
November 30, 2014
THE CUSHING® MLP TOTAL RETURN FUND
Investment Adviser
Cushing® Asset Management, LP
8117 Preston Road
Suite 440
Dallas, TX 75225
(214) 692-6334
(888) 777-2346
www.cushingcef.com
www.swankcapital.com
Table of Contents
Shareholder Letter . . . . . . . . . . . . . . . . . . . . . . . . . . . . . . . . . . . . . . . . . . . . . . . . . . . . . . . . . . . . . . . .
Allocation of Portfolio Assets . . . . . . . . . . . . . . . . . . . . . . . . . . . . . . . . . . . . . . . . . . . . . . . . . . . . . . .
Key Financial Data . . . . . . . . . . . . . . . . . . . . . . . . . . . . . . . . . . . . . . . . . . . . . . . . . . . . . . . . . . . . . . .
Schedule of Investments . . . . . . . . . . . . . . . . . . . . . . . . . . . . . . . . . . . . . . . . . . . . . . . . . . . . . . . . . . .
Statement of Assets & Liabilities . . . . . . . . . . . . . . . . . . . . . . . . . . . . . . . . . . . . . . . . . . . . . . . . . . . .
Statement of Operations . . . . . . . . . . . . . . . . . . . . . . . . . . . . . . . . . . . . . . . . . . . . . . . . . . . . . . . . . . .
Statements of Changes in Net Assets . . . . . . . . . . . . . . . . . . . . . . . . . . . . . . . . . . . . . . . . . . . . . . . . .
Statement of Cash Flows . . . . . . . . . . . . . . . . . . . . . . . . . . . . . . . . . . . . . . . . . . . . . . . . . . . . . . . . . . .
Financial Highlights . . . . . . . . . . . . . . . . . . . . . . . . . . . . . . . . . . . . . . . . . . . . . . . . . . . . . . . . . . . . . .
Notes to Financial Statements . . . . . . . . . . . . . . . . . . . . . . . . . . . . . . . . . . . . . . . . . . . . . . . . . . . . . . .
Report of Independent Registered Public Accounting Firm . . . . . . . . . . . . . . . . . . . . . . . . . . . . . . . .
Trustees and Executive Officers . . . . . . . . . . . . . . . . . . . . . . . . . . . . . . . . . . . . . . . . . . . . . . . . . . . . .
Additional Information . . . . . . . . . . . . . . . . . . . . . . . . . . . . . . . . . . . . . . . . . . . . . . . . . . . . . . . . . . . .
1
5
6
7
10
11
12
13
14
16
24
25
27
The Cushing® MLP Total Return Fund
Shareholder Letter
The Cushing® MLP Total Return Fund
Dear Fellow Shareholder,
The Cushing MLP Total Return Fund (the “Fund”) generated negative returns for shareholders for the
twelve month period ended November 30, 2014. For the period, the Fund delivered a Net Asset Value
Total Return (equal to the change in net asset value per share plus the reinvested cash distribution paid
during the period) of -4.9%, versus a total return of 16.9% for the S&P 500 Index (Total Return). The
Fund’s Share Price Total Return (equal to the change in net share price per share plus the reinvested
cash distribution paid during the period) was a positive 11.9%, for the fiscal period ended
November 30, 2014 and differs from the Net Asset Value Total Return due to fluctuations in the discount of share price to NAV. The Fund’s shares traded at a 36.4% premium to NAV as of the end of
the period.
Industry Overview and Themes
For the bulk of the twelve month period ending November 30, 2014, fundamentals were quite favorable for the midstream master limited partnership (“MLP”) space. Key themes driving positive fundamentals included: 1) good earnings results, particularly for natural gas pipeline companies with
capacity available to take advantage of extreme winter weather in late 2013 and early 2014; 2) continuing supply takeaway announcements, such as new long-haul Bakken crude pipelines, a significant
ethane export terminal project, and numerous sizable natural gas pipeline project proposals related to
the Marcellus/Utica takeaway; 3) merger and acquisition activity and strategic restructurings spurred
by the pursuit of growth, including several “drop-down” transactions and proposals for MLP consolidation; 4) numerous initial public offerings (“IPOs”) and the ongoing “MLP-ification” trend (assets
moving into MLP structures), including an important announcement by an energy “major” to form an
MLP; and 5) positive fund flows into MLP-focused investment products. Continuing the trend of the
past few years, the rapid and dramatically shifting dynamics related to midstream infrastructure has
created both challenges and opportunities for individual MLPs.
The vast majority of energy infrastructure needed to support continued shale development is being
built and developed by MLPs. In addition to the significant capex backlogs of existing MLPs, we
believe the numerous announcements and filings for new MLPs in the past year alone highlight the
positive attributes of the MLP structure (assets moving into the MLP structure is a trend we have
historically referred to as the “MLP-ification” of the energy space). Noteworthy examples of “MLPification” this year included IPOsfrom large sponsors such as Royal Dutch Shell PLC (NYSE: RDS),
Antero Resources Corp. (AM), Dominion Resources, Inc. (NYSE: D), CONSOL Energy, Inc. (NYSE:
CNX), Noble Energy, Inc. (NYSE: NBL), Transocean Ltd. (NYSE: RIG), Westlake Chemical Corp.
(NYSE: WLKP), CenterPoint Energy, Inc. (NYSEL CNP) and OGE Energy Corp. (NYSE: OGE). We
believe the MLP structure remains a preferred vehicle to house midstream assets as well as a means to
unlock value, via the general partner and associated incentive distribution rights (“IDRs”), at the
parent/sponsor level.
Merger and acquisition activity was also elevated, including MLP consolidation, as larger MLPs
focused on M&A to further diversify and integrate their assets into new business areas as well as gain
access to new production regions. There were numerous acquisition/merger announcements this year,
1
including Williams Companies, Inc. (NYSE: WMB)/Williams Partners, L.P. (NYSE: WPZ) acquiring
Access Midstream Partners, L.P. (NYSE: ACMP), NGL Energy Partners, LP (NYSE: NGL) acquiring
Transmontaigne Partners, L.P. (NYSE: TLP), Kinder Morgan, Inc. (NYSE: KMI) acquiring Kinder
Morgan Energy Partners, LP (NYSE: KMP)/Kinder Morgan Management, LLC (NYSE: KMR)/
El Paso Pipeline Partners, LP (NYSE: EPB) and Targa Resources Corp. (NYSE: TRGP)/Targa
Resources Partners, LP (NYSE: NGLS) acquiring Atlas Energy, LP (NYSE: ATLS)/Atlas Pipeline
Partners, LP (NYSE: APL).
However, the positive fundamental landscape and investor sentiment changed significantly with the
precipitous decline in crude and natural gas liquids (“NGL”) prices beginning in the summer of 2014,
and prices were further aggravated by the OPEC (Organization of the Petroleum Exporting Countries)
decision in November 2014 to maintain its targeted crude production ceiling. Crude prices fell sharply
towards the end of the Fund’s fiscal year in large part, we believe, due to robust production, global
growth concerns, geopolitical issues and dollar strength.
This dramatic price decline sent shockwaves through the energy industry. For example, many exploration and production (“E&P”) companies materially lowered their 2015 cap-ex budgets (i.e. reducing
planned drilling and expected production growth) and indicated an intent to focus spending on higher
return areas within their respective footprint. According to Bentek’s internal rate of return (“IRR”)
estimates, most of the major oil plays in the U.S. yield IRRs between 20% and 30% at a wellhead price
as low as $60/bbl.1
It is important to note that this is an ongoing development affecting plays and companies/partnerships
in different ways and to different degrees (for example depending on the type of business, the location
of the asset, the customer, the type of contract, etc.). For the time being, many midstream MLP
management teams have stated they have yet to see volumetric impacts for their systems or anticipate
significant reductions in their backlog of organic growth projects. However, MLP investors have apparently re-priced MLP equities based not only on direct commodity price impacts (for those contracts
with commodity price sensitivity) but on anticipated throughput and/or project backlog reductions as
well. Subsectors that have performed worse on a relative basis over the past few months are generally
more commodity price sensitive and include Natural Gas Gatherers & Processors, Shipping, Coal,
Upstream MLPs, Variable Distribution MLPs, and General Partners. We expect continued volatility in
MLP trading until we get additional clarity into E&P cap-ex plans and commodity prices stabilize.
Fund Performance and Strategy
A number of key issues affected the Fund’s performance during the reporting period. In particular, the
Fund benefited from overweight positions and favorable stock selection in the Large Cap Diversified,
Natural Gas Gatherers and Processors, and Crude Oil and Refined Products subsectors. The rapid
decrease in commodity prices and the overweight positions in the Upstream MLPs and Shipping subsectors, however, detracted from the Fund’s performance.
The stocks that made the strongest positive contributions to the Fund’s performance during the period
were Large Cap Diversified MLPs: KMR (acquired by KMI) and Energy Transfer Partners, LP
(NYSE: ETP). Each of these positions remained in the Fund’s portfolio at the end of the reporting
period.
Detractors from the Fund’s performance included holdings in Linn Co, LLC (NYSE: LNCO) and
Navios Maritime Partners, LP (NYSE: NMM). The decline in crude oil prices and global economic
growth concerns had a very negative impact on the Upstream MLP and Shipping subsectors.
1
“Production Junction, What’s That Price Function?” Bentek Energy LLC. November 4, 2014.
2
As of the end of the reporting period, the Fund’s assets remained overweight in the Upstream MLP and
Shipping subsectors, as companies in these subsectors continued to display higher yields relative to
other MLP subsectors. The Upstream MLP subsector has historically exhibited greater unit price volatility than other MLP subsectors given production and commodity price exposure, and the stocks in this
subsector have been negatively impacted by the sharp and rapid decrease in the price of crude oil. The
Shipping subsector was negatively affected by falling commodity prices and the global fears of an
economic slowdown. Additionally, the Fund had exposure to several Large Capitalization Diversified
MLPs. These MLPs typically have businesses in several midstream subsectors providing diversification and expansive asset foot prints offering a variety of growth avenues. Also, their size and trading
liquidity may help provide stability when markets become volatile. Conversely, the Fund remained
underweight in the Coal MLP subsector due to concerns of deteriorating fundamentals.
The Fund’s investment strategy focuses on holding core positions in higher yielding MLPs with stable
business models and long-term growth prospects. We also work diligently to optimize the use of leverage for additional income and total return potential. This involves leveraging investments in MLPs and
energy debt instruments when the probabilities of positive total return are deemed to be skewed favorably. As the prices of the Fund’s investments increase or decline, there is a risk that the impact to the
Fund’s NAV and total return will be negatively impacted by leverage, but this strategy is designed to
have a positive impact over the longer term.
Closing
In the midst of the current market turmoil, we continue to monitor relevant credit spreads, which have
historically been an early warning signal for trouble ahead. While these spreads have widened, they
remain below longer-term averages and below recent peaks experienced during 2011 and 2008-2009.
We believe interest rates have taken a back seat to the focus on crude and related NGL dynamics.
Nonetheless, while there have been bouts of heightened market anxiety surrounding monetary policy
and the timing/trajectory of interest rate “lift-off,” interest rates continue to remain low and currently
provide a favorable backdrop for midstream MLPs. We believe the market generally expects the
Federal Reserve to begin increasing the federal funds rate as early as June 2015, and we shall see if we
get a “rate tantrum” as we approach that point in time.
While we remain confident in the long-term need for infrastructure and positive return potential for
MLPs, the rapid decline in crude oil prices has created significant near-term headwinds and uncertainty
for the space. This is an ongoing and rapidly changing development and the industry is currently
assessing and working through the implications of a lower crude price environment. A prolonged
period of low crude oil prices is likely to reduce drilling activity which would result in a lower production growth trajectory. Although this could result in fewer future organic growth opportunities for
MLPs, we do not believe this will have an impact on current projects under development, most all of
which are supported by long term commitments. Nonetheless, we have stress tested our models to better understand the cash flow impact for midstream companies from the recent oil price fluctuations.
We believe the midstream energy sector continues to provide a compelling long term risk-adjusted
total return potential through a combination of current yield with growth. In the near term we expect
continued equity volatility until commodity prices stabilize and we gain a better understanding of
expected E&P spending plans. Importantly, we do not invest in the asset class as a whole; we continue
to seek attractive investment opportunities based upon our fundamental and bottom-up research
process.
3
We at Swank Capital, LLC and Cushing® Asset Management, LP truly appreciate your support, and
we look forward to continuing to help you achieve your investment goals.
Sincerely,
Jerry V. Swank
Chairman and Chief Executive Officer
Daniel L. Spears
President
The information in this report is not a complete analysis of every aspect of any market, sector, industry, security or the Fund itself.
Statements of fact are from sources considered reliable, but the Fund makes no representation or warranty as to their completeness
or accuracy. Discussions of specific investments are for illustration only and are not intended as recommendations of individual
investments. Please refer to the Schedule of Investments for a complete list of Fund holdings.
Past performance does not guarantee future results. Investment return, net asset value and common share market price will fluctuate
so that you may have a gain or loss when you sell shares. Since the Fund is a closed-end management investment company, shares of
the Fund may trade at a discount or premium from net asset value. This characteristic is separate and distinct from the risk that net
asset value could decrease as a result of investment activities and may be a greater risk to investors expecting to sell their shares after
a short time. The Fund cannot predict whether shares will trade at, above or below net asset value. The Fund should not be viewed as
a vehicle for trading purposes. It is designed primarily for risk-tolerant long-term investors.
An investment in the Fund involves risks. The Fund is nondiversified, meaning it may concentrate its assets in fewer individual holdings than a diversified fund. Therefore, the Fund is more exposed to individual stock volatility than a diversified fund. The Fund will
invest in Master Limited Partnerships (MLPs), which concentrate investments in the natural resource sector and are subject to the
risks of energy prices and demand and the volatility of commodity investments. Damage to facilities and infrastructure of MLPs may
significantly affect the value of an investment and may incur environmental costs and liabilities due to the nature of their business.
MLPs are subject to significant regulation and may be adversely affected by changes in the regulatory environment. Investments in
smaller companies involve additional risks such as limited liquidity and greater volatility. Investments in foreign securities involve
political, economic and currency risks, greater volatility and differences in accounting methods. MLPs are subject to certain risks
inherent in the structure of MLPs, including complex tax structure risks, the limited ability for election or removal of management,
limited voting rights, potential dependence on parent companies or sponsors for revenues to satisfy obligations, and potential conflicts
of interest between partners, members and affiliates. There is a risk to the future viability of the ongoing operation of MLPs that
return investor’s capital in the form of distributions.
The Fund is organized as a “C” corporation and is subject to U.S. federal income tax on its taxable income at the corporate tax rate
(currently as high as 35%) as well as state and local income taxes. The potential tax benefits of investing in MLPs depend on them
being treated as partnerships for federal income tax purposes. If the MLP is deemed to be a corporation then its income would be
subject to federal taxation at the entity level, reducing the amount of cash available for distribution to the Fund which could result in
a reduction of the Fund’s value.
The Fund incurs operating expenses, including advisory fees, as well as leverage costs. Investment returns for the Fund are shown net
of fees and expenses.
The Fund accrues deferred income taxes for future tax liabilities associated with the portion of MLP distributions considered to be a
tax-deferred return of capital and for any net operating gains as well as capital appreciation of its investments. This deferred tax
liability is reflected in the daily NAV and as a result the Fund’s after-tax performance could differ significantly from the underlying
assets even if the pre-tax performance is closely tracked.
Fund holdings and sector allocations are subject to change at any time and are not recommendations to buy or sell any security.
Please refer to the Schedule of Investments for a complete list of Fund holdings.
The S&P 500 Index is an unmanaged index of common stocks that is frequently used as a general measure of stock market performance. The index does not include fees or expenses. It is not possible to invest directly in an index.
4
The Cushing® MLP Total Return Fund
Allocation of Portfolio Assets(1) (Unaudited)
November 30, 2014
(Expressed as a Percentage of Total Investments)
Coal (2)
2.9%
Exploration &
Production (6)
2.3%
Refining &
Marketing (6)
1.1%
Variable Distribution (2)
3.3%
Short-Term Investments
0.2%
Options
0.0%
Other (2)
5.8%
Upstream (2)
23.4%
Propane (2)
6.6%
Crude Oil &
Refined Products (2) (5)
7.1%
Large Cap
Diversified (2)
9.9%
(1)
(2)
(3)
(4)
(5)
(6)
General Partnerships (2) (3)
Shipping (2) (3)
9.9%
12.3%
Natural Gas Gatherers &
Processors (2) (4)
15.2%
Fund holdings and sector allocations are subject to change and there is no assurance that the Fund will continue to hold any particular
security.
Master Limited Partnerships and Related Companies
Common Stock
Royalty Trusts
Preferred Stock
Senior Notes
5
The Cushing® MLP Total Return Fund
Key Financial Data (Supplemental Unaudited Information)
The Information presented below regarding Distributable Cash Flow is supplemental non-GAAP financial
information, which we believe is meaningful to understanding our operating performance. Supplemental nonGAAP measures should be read in conjunction with our full financial statements.
Fiscal Year
Ended
11/30/14
Fiscal Year
Ended
11/30/13
Fiscal Year
Ended
11/30/12
Fiscal Year
Ended
11/30/11
Fiscal Year
Ended
11/30/10
$ 26,986,074
488,952
198,333
$ 27,806,587
669,582
798,964
$ 25,284,505
659,085
5,061
$ 32,455,881
1,128,473
18,038
$ 21,050,065
1,320,531
0
Total income from investments . . . . . . . . . . . . . . . . .
Advisory fee and operating expenses
Advisory fees, less reimbursement by Advisor . . . . . . .
Operating expenses(a) . . . . . . . . . . . . . . . . . . . . . . . . . . .
Interest and dividends . . . . . . . . . . . . . . . . . . . . . . . . . .
Other . . . . . . . . . . . . . . . . . . . . . . . . . . . . . . . . . . . . . . .
$ 27,673,359
$ 29,275,133
$ 25,948,651
$ 33,602,392
$ 22,370,596
$
$
$
$
$
Total advisory fees and operating expenses . . . . . . . .
Distributable Cash Flow (DCF)(b) . . . . . . . . . . . . . . . . . . .
Distributions paid on common stock . . . . . . . . . . . . . . . . .
Distributions paid on common stock per share . . . . . . . . .
Distribution Coverage Ratio
Before advisory fee and operating expenses . . . . . . . . .
After advisory fee and operating expenses . . . . . . . . . .
OTHER FUND DATA (end of period)
Total Assets, end of period . . . . . . . . . . . . . . . . . . . . . . . .
Unrealized appreciation (depreciation), net of income
taxes . . . . . . . . . . . . . . . . . . . . . . . . . . . . . . . . . . . . . . . .
Short-term borrowings . . . . . . . . . . . . . . . . . . . . . . . . . . . .
Short-term borrowings as a percent of total assets . . . . . .
Net Assets, end of period . . . . . . . . . . . . . . . . . . . . . . . . . .
Net Asset Value per common share . . . . . . . . . . . . . . . . . .
Market Value per share . . . . . . . . . . . . . . . . . . . . . . . . . . .
Market Capitalization . . . . . . . . . . . . . . . . . . . . . . . . . . . . .
Shares Outstanding . . . . . . . . . . . . . . . . . . . . . . . . . . . . . .
$ 6,818,892
$ 20,854,467
$ 30,182,347
$
0.90
$ 5,110,590
$ 24,164,543
$ 30,006,331
$
0.90
$ 9,735,117
$ 16,213,534
$ 29,822,349
$
0.90
$ 8,745,738
$ 24,856,654
$ 20,674,008
$
0.68
$ 4,138,620
$ 18,231,976
$ 18,332,242
$
0.90
0.9x
0.7x
1.0x
0.8x
0.9x
0.5x
1.6x
1.2x
1.2x
1.0x
326,002,305
329,717,559
257,548,780
370,416,553
293,125,989
(8,126,321)
95,547,072
29%
199,847,099
$
5.94
$
8.10
$272,396,066
33,629,144
17,896,838
72,950,000
22%
233,619,616
$
6.98
$
8.09
$270,839,382
33,478,292
979,250
36,300,000
14%
220,020,922
$
6.62
$
7.68
$255,417,600
33,257,500
9,253,059
72,800,000
20%
255,747,023
$
7.74
$
9.43
$311,708,103
33,054,942
67,183,214
69,800,000
24%
208,002,375
$
8.03
$
9.42
$244,113,742
25,914,410
FINANCIAL DATA
Total income from investments
Distributions and dividends received, net of foreign
taxes withheld . . . . . . . . . . . . . . . . . . . . . . . . . . . . . .
Interest . . . . . . . . . . . . . . . . . . . . . . . . . . . . . . . . . . . . . .
Other . . . . . . . . . . . . . . . . . . . . . . . . . . . . . . . . . . . . . . .
(a)
(b)
4,314,026
1,127,724
1,264,615
112,527
3,862,641
686,943
552,890
8,116
4,723,818
3,312,486
1,698,813
0
4,822,578
2,671,727
1,094,343
157,090
2,467,110
948,767
465,469
257,274
Excludes expenses related to capital raising
“Net Investment Income, before Income Taxes” on the Statement of Operations is adjusted as follows to reconcile to Distributable Cash
Flow: increased by the return of capital on MLP distributions.
6
The Cushing® MLP Total Return Fund
Schedule of Investments
November 30, 2014
COMMON STOCK — 8.8%(1)
Shares
General Partnerships — 6.1%(1)
United States — 6.1%(1)
Kinder Morgan, Inc.(2) . . . . . . . . . . . . . . . . . . . . . . . . . . . . . . . . . . . . . . . . . . . . . . . . . . . . . . . . . . .
Targa Resources Corp.(2) . . . . . . . . . . . . . . . . . . . . . . . . . . . . . . . . . . . . . . . . . . . . . . . . . . . . . . . . .
179,943
41,700
Shipping — 2.7%(1)
Bermuda — 1.5%(1)
Golar LNG Ltd. . . . . . . . . . . . . . . . . . . . . . . . . . . . . . . . . . . . . . . . . . . . . . . . . . . . . . . . . . . . . . . . .
Republic of the Marshall Islands — 1.2%(1)
Teekay Corp. . . . . . . . . . . . . . . . . . . . . . . . . . . . . . . . . . . . . . . . . . . . . . . . . . . . . . . . . . . . . . . . . . . .
Fair Value
$
7,440,629
4,759,638
12,200,267
70,401
2,923,050
48,307
2,401,824
5,324,874
$ 17,525,141
Total Common Stock (Cost $17,625,454) . . . . . . . . . . . . . . . . . . . . . . . . . . . . . . . . . . . . . . . . . . . .
MASTER LIMITED PARTNERSHIPS AND
RELATED COMPANIES — 116.9%(1)
Coal — 3.9%(1)
United States — 3.9%(1)
Natural Resource Partners, L.P.(2) . . . . . . . . . . . . . . . . . . . . . . . . . . . . . . . . . . . . . . . . . . . . . . . . . . .
Crude Oil & Refined Products — 6.2%(1)
United States — 6.2%(1)
Blueknight Energy Partners, L.P.(2) . . . . . . . . . . . . . . . . . . . . . . . . . . . . . . . . . . . . . . . . . . . . . . . . .
Buckeye Partners, L.P.(2)(3) . . . . . . . . . . . . . . . . . . . . . . . . . . . . . . . . . . . . . . . . . . . . . . . . . . . . . . . .
NuStar Energy, L.P.(2) . . . . . . . . . . . . . . . . . . . . . . . . . . . . . . . . . . . . . . . . . . . . . . . . . . . . . . . . . . . .
Sprague Resources, L.P.(2) . . . . . . . . . . . . . . . . . . . . . . . . . . . . . . . . . . . . . . . . . . . . . . . . . . . . . . . .
242,433
42,400
114,800
47,350
1,740,669
3,259,288
6,428,800
1,063,955
12,492,712
General Partnerships — 7.2%(1)
United States — 7.2%(1)
Atlas Energy, L.P.(2)(3) . . . . . . . . . . . . . . . . . . . . . . . . . . . . . . . . . . . . . . . . . . . . . . . . . . . . . . . . . . . .
Energy Transfer Equity, L.P.(2) . . . . . . . . . . . . . . . . . . . . . . . . . . . . . . . . . . . . . . . . . . . . . . . . . . . . .
NuStar GP Holdings, LLC(2) . . . . . . . . . . . . . . . . . . . . . . . . . . . . . . . . . . . . . . . . . . . . . . . . . . . . . . .
151,100
69,450
141,350
5,361,028
4,124,636
4,856,786
14,342,450
Large Cap Diversified — 13.3%(1)
United States — 13.3%(1)
Enbridge Energy Management LLC(2)(4)(5) . . . . . . . . . . . . . . . . . . . . . . . . . . . . . . . . . . . . . . . . . . . .
Energy Transfer Partners, L.P.(2)(3) . . . . . . . . . . . . . . . . . . . . . . . . . . . . . . . . . . . . . . . . . . . . . . . . . .
Williams Partners, L.P.(2) . . . . . . . . . . . . . . . . . . . . . . . . . . . . . . . . . . . . . . . . . . . . . . . . . . . . . . . . .
125,373
219,688
147,871
4,563,569
14,317,067
7,650,846
26,531,482
Natural Gas Gatherers & Processors — 19.8%(1)
United States — 19.8%(1)
Access Midstream Partners, L.P.(2) . . . . . . . . . . . . . . . . . . . . . . . . . . . . . . . . . . . . . . . . . . . . . . . . . .
American Midstream Partners, L.P.(2) . . . . . . . . . . . . . . . . . . . . . . . . . . . . . . . . . . . . . . . . . . . . . . .
Atlas Pipeline Partners, L.P.(2) . . . . . . . . . . . . . . . . . . . . . . . . . . . . . . . . . . . . . . . . . . . . . . . . . . . . .
EnLink Midstream Partners, L.P.(2) . . . . . . . . . . . . . . . . . . . . . . . . . . . . . . . . . . . . . . . . . . . . . . . . .
MarkWest Energy Partners, L.P.(2)(3) . . . . . . . . . . . . . . . . . . . . . . . . . . . . . . . . . . . . . . . . . . . . . . . .
Regency Energy Partners, L.P.(2)(3) . . . . . . . . . . . . . . . . . . . . . . . . . . . . . . . . . . . . . . . . . . . . . . . . . .
Southcross Energy Partners, L.P.(2) . . . . . . . . . . . . . . . . . . . . . . . . . . . . . . . . . . . . . . . . . . . . . . . . .
84,750
14,502
404,740
78,300
36,600
351,426
332,235
5,312,130
323,685
13,291,661
2,183,787
2,600,796
10,012,127
5,794,178
39,518,364
Other — 7.7%(1)
United States — 7.7%(1)
Compressco Partners, L.P.(2) . . . . . . . . . . . . . . . . . . . . . . . . . . . . . . . . . . . . . . . . . . . . . . . . . . . . . . .
Exterran Partners, L.P.(2) . . . . . . . . . . . . . . . . . . . . . . . . . . . . . . . . . . . . . . . . . . . . . . . . . . . . . . . . . .
OCI Partners, L.P.(2) . . . . . . . . . . . . . . . . . . . . . . . . . . . . . . . . . . . . . . . . . . . . . . . . . . . . . . . . . . . . .
308,135
264,614
155,948
6,295,198
6,541,258
2,651,116
15,487,572
See Accompanying Notes to the Financial Statements.
7
649,350
$
7,753,239
The Cushing® MLP Total Return Fund
Schedule of Investments
November 30, 2014 — (Continued)
MASTER LIMITED PARTNERSHIPS AND
RELATED COMPANIES — (Continued)
Shares
Propane — 8.9%(1)
United States — 8.9%(1)
Amerigas Partners, L.P.(2) . . . . . . . . . . . . . . . . . . . . . . . . . . . . . . . . . . . . . . . . . . . . . . . . . . . . . . . . .
Ferrellgas Partners, L.P.(2) . . . . . . . . . . . . . . . . . . . . . . . . . . . . . . . . . . . . . . . . . . . . . . . . . . . . . . . .
Suburban Propane Partners, L.P.(2) . . . . . . . . . . . . . . . . . . . . . . . . . . . . . . . . . . . . . . . . . . . . . . . . . .
169,300
183,400
108,650
Shipping — 13.9%(1)
Republic of the Marshall Islands — 13.9%(1)
Capital Product Partners, L.P.(2) . . . . . . . . . . . . . . . . . . . . . . . . . . . . . . . . . . . . . . . . . . . . . . . . . . . .
Navios Maritime Partners, L.P.(2) . . . . . . . . . . . . . . . . . . . . . . . . . . . . . . . . . . . . . . . . . . . . . . . . . . .
1,974,911
953,450
15,443,804
12,356,712
27,800,516
Upstream — 31.5%(1)
United States — 31.5%(1)
Atlas Resource Partners, L.P.(2) . . . . . . . . . . . . . . . . . . . . . . . . . . . . . . . . . . . . . . . . . . . . . . . . . . . .
BreitBurn Energy Partners, L.P.(2) . . . . . . . . . . . . . . . . . . . . . . . . . . . . . . . . . . . . . . . . . . . . . . . . . .
EV Energy Partners, L.P.(2) . . . . . . . . . . . . . . . . . . . . . . . . . . . . . . . . . . . . . . . . . . . . . . . . . . . . . . . .
Legacy Reserves, L.P.(2) . . . . . . . . . . . . . . . . . . . . . . . . . . . . . . . . . . . . . . . . . . . . . . . . . . . . . . . . . .
LinnCo, LLC(2) . . . . . . . . . . . . . . . . . . . . . . . . . . . . . . . . . . . . . . . . . . . . . . . . . . . . . . . . . . . . . . . . .
LRR Energy, L.P.(2) . . . . . . . . . . . . . . . . . . . . . . . . . . . . . . . . . . . . . . . . . . . . . . . . . . . . . . . . . . . . .
Memorial Production Partners, L.P.(2) . . . . . . . . . . . . . . . . . . . . . . . . . . . . . . . . . . . . . . . . . . . . . . .
Vanguard Natural Resources, LLC(2) . . . . . . . . . . . . . . . . . . . . . . . . . . . . . . . . . . . . . . . . . . . . . . . .
665,490
826,382
274,200
490,927
405,958
458,950
552,175
251,900
10,122,103
10,916,501
7,768,086
8,753,228
6,661,771
5,232,030
7,597,928
5,849,118
62,900,765
Variable Distribution — 4.5%(1)
United States — 4.5%(1)
Alon USA Partners, L.P. . . . . . . . . . . . . . . . . . . . . . . . . . . . . . . . . . . . . . . . . . . . . . . . . . . . . . . . . . .
CrossAmerica Partners, L.P.(2) . . . . . . . . . . . . . . . . . . . . . . . . . . . . . . . . . . . . . . . . . . . . . . . . . . . . .
115,650
213,800
1,971,832
7,057,538
9,029,370
$233,656,871
161,750
$ 1,386,198
$ 1,386,198
757,519
$ 6,666,167
$ 6,666,167
Total Master Limited Partnerships and Related Companies (Cost $256,773,426) . . . . . . . . . . . . .
Fair Value
$
7,819,967
5,091,184
4,889,250
17,800,401
ROYALTY TRUSTS — 0.7%(1)
Natural Gas Gatherers & Processors — 0.7%(1)
United States — 0.7%(1)
SandRidge Permian Trust(2) . . . . . . . . . . . . . . . . . . . . . . . . . . . . . . . . . . . . . . . . . . . . . . . . . . . . . . .
Total Royalty Trusts (Cost $2,286,323) . . . . . . . . . . . . . . . . . . . . . . . . . . . . . . . . . . . . . . . . . . . . . .
PREFERRED STOCK — 3.3%(1)
Crude Oil & Refined Products — 3.3%(1)
United States — 3.3%(1)
Blueknight Energy Partners, L.P. . . . . . . . . . . . . . . . . . . . . . . . . . . . . . . . . . . . . . . . . . . . . . . . . . . .
Total Preferred Stock (Cost $4,897,441) . . . . . . . . . . . . . . . . . . . . . . . . . . . . . . . . . . . . . . . . . . . . .
FIXED INCOME — 4.6%(1)
Exploration & Production — 3.1%(1)
United States — 3.1%(1)
Midcontinent Express Pipeline LLC, 6.700%, due 09/15/2019(2)(6) . . . . . . . . . . . . . . . . . . . . . . . . .
Oasis Petroleum, Inc., 6.875%, due 03/15/2022 . . . . . . . . . . . . . . . . . . . . . . . . . . . . . . . . . . . . . . . .
Rockies Express Pipeline, LLC, 5.625%, due 04/15/2020(6) . . . . . . . . . . . . . . . . . . . . . . . . . . . . . .
Rosetta Resources, Inc., 5.625%, due 05/01/2021(2) . . . . . . . . . . . . . . . . . . . . . . . . . . . . . . . . . . . .
Sanchez Energy Corp., 6.125%, due 01/15/2023(2)(6) . . . . . . . . . . . . . . . . . . . . . . . . . . . . . . . . . . . .
Refining & Marketing — 1.5%(1)
United States — 1.5%(1)
Western Refining, Inc., 6.250%, due 04/01/2021 . . . . . . . . . . . . . . . . . . . . . . . . . . . . . . . . . . . . . . .
Total Fixed Income (Cost $9,266,384) . . . . . . . . . . . . . . . . . . . . . . . . . . . . . . . . . . . . . . . . . . . . . . .
See Accompanying Notes to the Financial Statements.
8
2,500,000
500,000
1,500,000
1,000,000
500,000
$
2,800,000
472,500
1,560,000
960,000
451,250
6,243,750
3,000,000
2,938,140
$ 9,181,890
The Cushing® MLP Total Return Fund
Schedule of Investments
November 30, 2014 — (Continued)
SHORT-TERM INVESTMENTS —
INVESTMENT COMPANIES — 0.3%(1)
Shares
United States — 0.3%(1)
AIM Short-Term Treasury Portfolio Fund — Institutional Class, 0.01%(7) . . . . . . . . . . . . . . . . . . .
Fidelity Government Portfolio Fund — Institutional Class, 0.01%(7) . . . . . . . . . . . . . . . . . . . . . . .
Fidelity Money Market Portfolio — Institutional Class, 0.05%(7) . . . . . . . . . . . . . . . . . . . . . . . . . .
First American Government Obligations Fund — Class Z, 0.01%(7) . . . . . . . . . . . . . . . . . . . . . . . .
Invesco STIC Prime Portfolio, 0.04%(7) . . . . . . . . . . . . . . . . . . . . . . . . . . . . . . . . . . . . . . . . . . . . . .
Total Short-Term Investments (Cost $527,104) . . . . . . . . . . . . . . . . . . . . . . . . . . . . . . . . . . . . . . . .
105,421
105,421
105,421
105,421
105,420
OPTIONS — 0.0%(1)
Fair Value
$
$
105,421
105,421
105,421
105,421
105,420
527,104
Contracts
United States — 0.0%(1)
Boardwalk Pipeline Partners, L.P., Call Option
Expiration: December 2014, Exercise Price: $20.00 . . . . . . . . . . . . . . . . . . . . . . . . . . . . . . . . . .
Total Options (Cost $412,001) . . . . . . . . . . . . . . . . . . . . . . . . . . . . . . . . . . . . . . . . . . . . . . . . . . . . .
TOTAL INVESTMENTS — 134.6%(1) (Cost $291,788,133) . . . . . . . . . . . . . . . . . . . . . . . . . . . . .
Liabilities in Excess of Other Assets — (34.6)%(1) . . . . . . . . . . . . . . . . . . . . . . . . . . . . . . . . . . . . .
NET ASSETS APPLICABLE TO COMMON STOCKHOLDERS — 100.0%(1) . . . . . . . . . . . . .
SCHEDULE OF SECURITES SOLD SHORT — (13.2)%(1)
2,738
$
13,690
$
13,690
$268,957,061
(69,109,962)
$199,847,099
Shares
Exchange Traded Funds — (13.2)%(1)
United States — (13.2)%(1)
Energy Select Sector SPDR . . . . . . . . . . . . . . . . . . . . . . . . . . . . . . . . . . . . . . . . . . . . . . . . . . . . . . .
JPMorgan Alerian MLP Index ETN . . . . . . . . . . . . . . . . . . . . . . . . . . . . . . . . . . . . . . . . . . . . . . . . .
Market Vectors ETF Trust Oil Services . . . . . . . . . . . . . . . . . . . . . . . . . . . . . . . . . . . . . . . . . . . . . .
SPDR S&P Oil & Gas Exploration & Production ETF . . . . . . . . . . . . . . . . . . . . . . . . . . . . . . . . . .
TOTAL SECURITIES SOLD SHORT (PROCEEDS $26,539,335) . . . . . . . . . . . . . . . . . . . . . . .
SCHEDULE OF WRITTEN CALL OPTIONS — (0.1)%(1)
(80,450) $ (6,421,519)
(172,100)
(8,384,712)
(140,750)
(5,368,205)
(121,100)
(6,185,788)
$ (26,360,224)
Contracts
United States — (0.1)%(1)
Atlas Energy, L.P., Call Option
Expiration: December 2014, Exercise Price: $40.00 . . . . . . . . . . . . . . . . . . . . . . . . . . . . . . . . . .
Buckeye Partners, L.P., Call Option
Expiration: December 2014, Exercise Price: $85.00 . . . . . . . . . . . . . . . . . . . . . . . . . . . . . . . . . .
Energy Transfer Partners, L.P., Call Option
Expiration: December 2014, Exercise Price: $70.00 . . . . . . . . . . . . . . . . . . . . . . . . . . . . . . . . . .
Markwest Energy Partners, L.P., Call Option
Expiration: December 2014, Exercise Price: $75.00 . . . . . . . . . . . . . . . . . . . . . . . . . . . . . . . . . .
Regency Energy Partners, L.P., Call Option
Expiration: December 2014, Exercise Price: $30.00 . . . . . . . . . . . . . . . . . . . . . . . . . . . . . . . . . .
Total Written Options (Proceeds $96,975) . . . . . . . . . . . . . . . . . . . . . . . . . . . . . . . . . . . . . . . . . . . .
(300) $
(12,000)
(400)
(8,000)
(660)
(20,460)
(120)
(4,800)
(1,000)
$
(60,000)
(105,260)
(1)
Calculated as a percentage of net assets applicable to common stockholders.
(2)
All or a portion of these securities are held as collateral pursuant to the loan agreements.
All or a portion of these securities represent cover for outstanding call options written.
No distribution or dividend was made during the period ended November 30, 2014. As such, it is classified as a non-income producing
security as of November 30, 2014.
(3)
(4)
(5)
(6)
(7)
Security distributions are paid-in-kind.
Restricted security under Rule 144A under the Securities Act of 1933, as amended. At November 30, 2014, these securities amounted to
approximately $4,811,250, or 2.4% of net assets applicable to common stockholders.
Rate reported is the current yield as of November 30, 2014.
See Accompanying Notes to the Financial Statements.
9
The Cushing® MLP Total Return Fund
Statement of Assets & Liabilities
November 30, 2014
Assets
Investments, at fair value (cost $291,376,132) . . . . . . . . . . . . . . . . . . . . . . . . . . . . . . . . . . . . . . . $268,943,371
Options, at fair value (cost $412,001) . . . . . . . . . . . . . . . . . . . . . . . . . . . . . . . . . . . . . . . . . . . . . .
13,690
Cash . . . . . . . . . . . . . . . . . . . . . . . . . . . . . . . . . . . . . . . . . . . . . . . . . . . . . . . . . . . . . . . . . . . . . . . .
22,235,221
Receivable for investments sold . . . . . . . . . . . . . . . . . . . . . . . . . . . . . . . . . . . . . . . . . . . . . . . . . .
28,257,552
Deferred tax asset . . . . . . . . . . . . . . . . . . . . . . . . . . . . . . . . . . . . . . . . . . . . . . . . . . . . . . . . . . . . .
6,336,123
Interest receivable . . . . . . . . . . . . . . . . . . . . . . . . . . . . . . . . . . . . . . . . . . . . . . . . . . . . . . . . . . . . .
102,500
Prepaid expenses and other assets . . . . . . . . . . . . . . . . . . . . . . . . . . . . . . . . . . . . . . . . . . . . . . . . .
113,848
Total assets . . . . . . . . . . . . . . . . . . . . . . . . . . . . . . . . . . . . . . . . . . . . . . . . . . . . . . . . . . . . . .
326,002,305
Liabilities
Securities sold short, at fair value (proceeds $26,539,335) . . . . . . . . . . . . . . . . . . . . . . . . . . . . .
Written options, at fair value (proceeds $96,975) . . . . . . . . . . . . . . . . . . . . . . . . . . . . . . . . . . . . .
Short-term borrowings . . . . . . . . . . . . . . . . . . . . . . . . . . . . . . . . . . . . . . . . . . . . . . . . . . . . . . . . .
Payable for investments purchased . . . . . . . . . . . . . . . . . . . . . . . . . . . . . . . . . . . . . . . . . . . . . . . .
Distributions and dividends payable . . . . . . . . . . . . . . . . . . . . . . . . . . . . . . . . . . . . . . . . . . . . . . .
Payable to Adviser . . . . . . . . . . . . . . . . . . . . . . . . . . . . . . . . . . . . . . . . . . . . . . . . . . . . . . . . . . . .
Payable to Trustees . . . . . . . . . . . . . . . . . . . . . . . . . . . . . . . . . . . . . . . . . . . . . . . . . . . . . . . . . . . .
Accrued expenses and other liabilities . . . . . . . . . . . . . . . . . . . . . . . . . . . . . . . . . . . . . . . . . . . . .
26,360,224
105,260
95,547,072
3,537,169
102,916
333,737
9,000
159,828
Total liabilities . . . . . . . . . . . . . . . . . . . . . . . . . . . . . . . . . . . . . . . . . . . . . . . . . . . . . . . . . . .
126,155,206
Net assets applicable to common stockholders . . . . . . . . . . . . . . . . . . . . . . . . . . . . . . . . . . . . . . . . .
$199,847,099
Net Assets Applicable to Common Stockholders Consisting of Capital stock, $0.001 par value;
33,629,144 shares issued and outstanding (unlimited shares authorized) . . . . . . . . . . . . . . . . . . $
33,629
Additional paid-in capital . . . . . . . . . . . . . . . . . . . . . . . . . . . . . . . . . . . . . . . . . . . . . . . . . . . . . . .
283,275,163
Undistributed net investment loss, net of income taxes . . . . . . . . . . . . . . . . . . . . . . . . . . . . . . . .
(80,822,916)
Accumulated realized gain, net of income taxes . . . . . . . . . . . . . . . . . . . . . . . . . . . . . . . . . . . . . .
5,487,544
Net unrealized depreciation on investments, net of income taxes . . . . . . . . . . . . . . . . . . . . . . . .
(8,126,321)
Net assets applicable to common stockholders . . . . . . . . . . . . . . . . . . . . . . . . . . . . . . . . . . . . . . . . .
$199,847,099
Net Asset Value per common share outstanding (net assets applicable to common shares divided
by common shares outstanding) . . . . . . . . . . . . . . . . . . . . . . . . . . . . . . . . . . . . . . . . . . . . . . . . . .
$
See Accompanying Notes to the Financial Statements.
10
5.94
The Cushing® MLP Total Return Fund
Statement of Operations
Fiscal Year Ended November 30, 2014
Investment Income
Distributions and dividends received, net of foreign taxes withheld of $12,266 . . . . . . . . . . . . . $ 26,986,074
Less: return of capital on distributions . . . . . . . . . . . . . . . . . . . . . . . . . . . . . . . . . . . . . . . . . . . . .
(21,018,570)
Distribution and dividend income . . . . . . . . . . . . . . . . . . . . . . . . . . . . . . . . . . . . . . . . . . . . . . . . .
Interest income . . . . . . . . . . . . . . . . . . . . . . . . . . . . . . . . . . . . . . . . . . . . . . . . . . . . . . . . . . . . . . . .
Other income . . . . . . . . . . . . . . . . . . . . . . . . . . . . . . . . . . . . . . . . . . . . . . . . . . . . . . . . . . . . . . . . .
5,967,504
488,952
198,333
Total Investment Income . . . . . . . . . . . . . . . . . . . . . . . . . . . . . . . . . . . . . . . . . . . . . . . . . . . .
6,654,789
Expenses
Advisory fees . . . . . . . . . . . . . . . . . . . . . . . . . . . . . . . . . . . . . . . . . . . . . . . . . . . . . . . . . . . . . . . . .
Administration and accounting fees . . . . . . . . . . . . . . . . . . . . . . . . . . . . . . . . . . . . . . . . . . . . . . .
Franchise tax expense . . . . . . . . . . . . . . . . . . . . . . . . . . . . . . . . . . . . . . . . . . . . . . . . . . . . . . . . . .
Professional fees . . . . . . . . . . . . . . . . . . . . . . . . . . . . . . . . . . . . . . . . . . . . . . . . . . . . . . . . . . . . . .
Trustees’ fees . . . . . . . . . . . . . . . . . . . . . . . . . . . . . . . . . . . . . . . . . . . . . . . . . . . . . . . . . . . . . . . . .
Insurance expense . . . . . . . . . . . . . . . . . . . . . . . . . . . . . . . . . . . . . . . . . . . . . . . . . . . . . . . . . . . . .
Reports to stockholders . . . . . . . . . . . . . . . . . . . . . . . . . . . . . . . . . . . . . . . . . . . . . . . . . . . . . . . . .
Registration fees . . . . . . . . . . . . . . . . . . . . . . . . . . . . . . . . . . . . . . . . . . . . . . . . . . . . . . . . . . . . . . .
Transfer agent fees . . . . . . . . . . . . . . . . . . . . . . . . . . . . . . . . . . . . . . . . . . . . . . . . . . . . . . . . . . . . .
Custodian fees and expenses . . . . . . . . . . . . . . . . . . . . . . . . . . . . . . . . . . . . . . . . . . . . . . . . . . . . .
Other expenses . . . . . . . . . . . . . . . . . . . . . . . . . . . . . . . . . . . . . . . . . . . . . . . . . . . . . . . . . . . . . . . .
4,314,026
317,406
280,991
132,249
109,071
95,161
89,443
35,811
35,333
32,259
112,527
Total Expenses before Interest and Dividend Expense . . . . . . . . . . . . . . . . . . . . . . . . . . . . .
Interest expense . . . . . . . . . . . . . . . . . . . . . . . . . . . . . . . . . . . . . . . . . . . . . . . . . . . . . . . . . . . . . . .
Dividend expense . . . . . . . . . . . . . . . . . . . . . . . . . . . . . . . . . . . . . . . . . . . . . . . . . . . . . . . . . . . . . .
5,554,277
952,218
312,397
Total Expenses . . . . . . . . . . . . . . . . . . . . . . . . . . . . . . . . . . . . . . . . . . . . . . . . . . . . . . . . . . . .
6,818,892
Net Investment Loss, before income taxes . . . . . . . . . . . . . . . . . . . . . . . . . . . . . . . . . . . . . . . . . .
Current tax expense . . . . . . . . . . . . . . . . . . . . . . . . . . . . . . . . . . . . . . . . . . . . . . . . . . . . . . . . . . . .
Deferred tax expense . . . . . . . . . . . . . . . . . . . . . . . . . . . . . . . . . . . . . . . . . . . . . . . . . . . . . . . . . . .
(164,103)
(7,484,092)
(87,172)
Net Investment Loss . . . . . . . . . . . . . . . . . . . . . . . . . . . . . . . . . . . . . . . . . . . . . . . . . . . . . . .
(7,735,367)
Realized and Unrealized Gain (Loss) on Investments
Net realized gain on investments, before income taxes . . . . . . . . . . . . . . . . . . . . . . . . . . . . . . . . .
Net realized gain on securities sold short, before income taxes . . . . . . . . . . . . . . . . . . . . . . . . . .
Net realized gain on options, before income taxes . . . . . . . . . . . . . . . . . . . . . . . . . . . . . . . . . . . .
Deferred tax expense . . . . . . . . . . . . . . . . . . . . . . . . . . . . . . . . . . . . . . . . . . . . . . . . . . . . . . . . . . .
34,513,951
900,065
1,627,118
(8,078,168)
Net realized gain on investments . . . . . . . . . . . . . . . . . . . . . . . . . . . . . . . . . . . . . . . . . . . . . .
28,962,966
Net change in unrealized depreciation of investments, before income taxes . . . . . . . . . . . . . . . .
Net change in unrealized depreciation of options, before income taxes . . . . . . . . . . . . . . . . . . . .
Deferred tax benefit . . . . . . . . . . . . . . . . . . . . . . . . . . . . . . . . . . . . . . . . . . . . . . . . . . . . . . . . . . . .
(40,150,488)
(406,596)
14,533,925
Net change in unrealized depreciation of investments . . . . . . . . . . . . . . . . . . . . . . . . . . . . .
(26,023,159)
Net Realized and Unrealized Gain on Investments . . . . . . . . . . . . . . . . . . . . . . . . . . . . . . . . . . . . . .
Decrease in Net Assets Applicable to Common Stockholders Resulting from Operations . . . . . . .
See Accompanying Notes to the Financial Statements.
11
2,939,807
$ (4,795,560)
The Cushing® MLP Total Return Fund
Statements of Changes in Net Assets
Operations
Net investment loss . . . . . . . . . . . . . . . . . . . . . . . . . . . . . . . . . . . . . . . . . .
Net realized gain on investments, securities sold short, and options . . . . .
Net change in unrealized appreciation (depreciation) of investments and
options . . . . . . . . . . . . . . . . . . . . . . . . . . . . . . . . . . . . . . . . . . . . . . . . . .
Fiscal
Year Ended
November 30, 2014
Fiscal
Year Ended
November 30, 2013
$ (7,735,367)
28,962,966
$ (5,861,332)
30,928,388
(26,023,159)
16,917,588
Net increase (decrease) in net assets applicable to common stockholders
resulting from operations . . . . . . . . . . . . . . . . . . . . . . . . . . . . . . . . . . . .
(4,795,560)
41,984,644
Dividends and Distributions to Common Stockholders
Net investment income . . . . . . . . . . . . . . . . . . . . . . . . . . . . . . . . . . . . . . .
Return of capital . . . . . . . . . . . . . . . . . . . . . . . . . . . . . . . . . . . . . . . . . . . . .
(30,182,347)
—
(26,405,571)
(3,600,760)
Total dividends and distributions to common stockholders . . . . . . .
(30,182,347)
(30,006,331)
Capital Share Transactions
Issuance of 150,852 and 220,792 common shares from reinvestment of
distributions to stockholders, respectively . . . . . . . . . . . . . . . . . . . . . . .
1,205,390
1,620,381
Net increase in net assets applicable to common stockholders from
capital share transactions . . . . . . . . . . . . . . . . . . . . . . . . . . . . . . . . . . . .
1,205,390
1,620,381
Total increase (decrease) in net assets applicable to common
stockholders . . . . . . . . . . . . . . . . . . . . . . . . . . . . . . . . . . . . . . . . . .
Net Assets
Beginning of year . . . . . . . . . . . . . . . . . . . . . . . . . . . . . . . . . . . . . . . . . . . .
(33,772,517)
13,598,694
233,619,616
220,020,922
End of year . . . . . . . . . . . . . . . . . . . . . . . . . . . . . . . . . . . . . . . . . . . . . . . . .
$199,847,099
$233,619,616
Undistributed net investment loss at the end of the fiscal year, net of
income taxes . . . . . . . . . . . . . . . . . . . . . . . . . . . . . . . . . . . . . . . . . . . . . .
$ (80,822,916)
$ (42,905,202)
See Accompanying Notes to the Financial Statements.
12
The Cushing® MLP Total Return Fund
Statement of Cash Flows
Fiscal Year Ended November 30, 2014
Operating Activities
Decrease in Net Assets Applicable to Common Stockholders Resulting from Operations . . . . $ (4,795,560)
Adjustments to reconcile decrease in the net assets applicable to common stockholders to net
cash provided by operating activities
Net change in unrealized depreciation of investments and options . . . . . . . . . . . . . . . . . . . . .
40,557,084
Purchases of investments . . . . . . . . . . . . . . . . . . . . . . . . . . . . . . . . . . . . . . . . . . . . . . . . . . . . . (459,282,576)
Proceeds from sales of investments . . . . . . . . . . . . . . . . . . . . . . . . . . . . . . . . . . . . . . . . . . . . .
428,799,143
Proceeds from investments sold short . . . . . . . . . . . . . . . . . . . . . . . . . . . . . . . . . . . . . . . . . . .
103,831,947
Purchases to cover investments sold short . . . . . . . . . . . . . . . . . . . . . . . . . . . . . . . . . . . . . . . .
(90,603,229)
Proceeds from option transactions, net . . . . . . . . . . . . . . . . . . . . . . . . . . . . . . . . . . . . . . . . . .
44,259,666
Return of capital on distributions . . . . . . . . . . . . . . . . . . . . . . . . . . . . . . . . . . . . . . . . . . . . . . .
21,018,570
Net realized gains on sales of investments, securities sold short, and options . . . . . . . . . . . .
(37,041,134)
Net purchases of short-term investments . . . . . . . . . . . . . . . . . . . . . . . . . . . . . . . . . . . . . . . . .
(392,999)
Net accretion/amortization of senior notes’ premiums/discounts . . . . . . . . . . . . . . . . . . . . . .
2,032
Changes in operating assets and liabilities
Receivable for investments sold . . . . . . . . . . . . . . . . . . . . . . . . . . . . . . . . . . . . . . . . . . . . .
(28,257,552)
Deferred tax asset . . . . . . . . . . . . . . . . . . . . . . . . . . . . . . . . . . . . . . . . . . . . . . . . . . . . . . . . .
(6,336,123)
Interest receivable . . . . . . . . . . . . . . . . . . . . . . . . . . . . . . . . . . . . . . . . . . . . . . . . . . . . . . . .
(2,229)
Prepaid expenses and other assets . . . . . . . . . . . . . . . . . . . . . . . . . . . . . . . . . . . . . . . . . . . .
(55,245)
Payable to Adviser . . . . . . . . . . . . . . . . . . . . . . . . . . . . . . . . . . . . . . . . . . . . . . . . . . . . . . . .
18,179
Payable for investments purchased . . . . . . . . . . . . . . . . . . . . . . . . . . . . . . . . . . . . . . . . . . .
(5,018,022)
Dividends payable related to securities sold short . . . . . . . . . . . . . . . . . . . . . . . . . . . . . . . .
102,916
Accrued interest expense . . . . . . . . . . . . . . . . . . . . . . . . . . . . . . . . . . . . . . . . . . . . . . . . . . .
(314)
Accrued expenses and other liabilities . . . . . . . . . . . . . . . . . . . . . . . . . . . . . . . . . . . . . . . . .
(3,432)
Net cash provided by operating activities . . . . . . . . . . . . . . . . . . . . . . . . . . . . . . . . . . . . . . . .
6,801,122
Financing Activities
Proceeds from borrowing facility . . . . . . . . . . . . . . . . . . . . . . . . . . . . . . . . . . . . . . . . . . . . . . . .
Repayment of borrowing facility . . . . . . . . . . . . . . . . . . . . . . . . . . . . . . . . . . . . . . . . . . . . . . . . .
Dividends paid to common stockholders . . . . . . . . . . . . . . . . . . . . . . . . . . . . . . . . . . . . . . . . . . .
376,238,686
(353,641,614)
(28,976,957)
Net cash used in financing activities . . . . . . . . . . . . . . . . . . . . . . . . . . . . . . . . . . . . . . . . . . . . . .
(6,379,885)
Increase in Cash and Cash Equivalents . . . . . . . . . . . . . . . . . . . . . . . . . . . . . . . . . . . . . . . . . . . . . .
Cash and Cash Equivalents:
Beginning of year . . . . . . . . . . . . . . . . . . . . . . . . . . . . . . . . . . . . . . . . . . . . . . . . . . . . . . . . . . . . .
421,237
21,813,984
End of year . . . . . . . . . . . . . . . . . . . . . . . . . . . . . . . . . . . . . . . . . . . . . . . . . . . . . . . . . . . . . . . . . .
$ 22,235,221
Supplemental Disclosure of Cash Flow and Non-cash Information
Interest Paid . . . . . . . . . . . . . . . . . . . . . . . . . . . . . . . . . . . . . . . . . . . . . . . . . . . . . . . . . . . . . . . . . $
Taxes Paid . . . . . . . . . . . . . . . . . . . . . . . . . . . . . . . . . . . . . . . . . . . . . . . . . . . . . . . . . . . . . . . . . . $
Additional paid-in capital from Dividend Reinvestment . . . . . . . . . . . . . . . . . . . . . . . . . . . . . . . $
Non-cash cost adjustment from corporate actions . . . . . . . . . . . . . . . . . . . . . . . . . . . . . . . . . . . . $
See Accompanying Notes to the Financial Statements.
13
952,532
7,782,083
1,205,390
60,886
The Cushing® MLP Total Return Fund
Financial Highlights
Per Common Share Data(1)
Net Asset Value, beginning of
year . . . . . . . . . . . . . . . . . . . . . . . .
Public offering price . . . . . . . . . . .
Offering costs on issuance of
common shares . . . . . . . . . . . . .
Income from Investment
Operations:
Net investment income (loss) . . . . . .
Net realized and unrealized gain
(loss) on investments . . . . . . . . . .
Fiscal
Year Ended
November 30,
2014
Fiscal
Year Ended
November 30,
2013
Fiscal
Year Ended
November 30,
2012
Fiscal
Year Ended
November 30,
2011
Fiscal
Year Ended
November 30,
2010
$ 6.98
—
$ 6.62
—
$ 7.74
—
$ 8.03
—
$ 5.74
—
—
—
—
—
(0.05)
(1.12)
(0.96)
(0.34)
0.68
1.07
0.98
2.22
0.12
(0.29)
2.17
Total increase (decrease) from
investment operations . . . . . . . .
(0.14)
1.26
(0.22)
0.39
3.24
Less Distributions to Common
Stockholders:
Net investment income . . . . . . . . . . .
Return of capital . . . . . . . . . . . . . . . .
(0.90)
—
(0.79)
(0.11)
(0.19)
(0.71)
(0.01)
(0.67)
—
(0.90)
Total distributions to common
stockholders . . . . . . . . . . . . . . .
(0.90)
(0.90)
(0.90)
(0.68)
(0.90)
Net Asset Value, end of year . . . . . .
$ 5.94
$ 6.98
$ 6.62
$ 7.74
$ 8.03
Per common share fair value, end of
year . . . . . . . . . . . . . . . . . . . . . . . .
$ 8.10
$ 8.09
$ 7.68
$ 9.43
$ 9.42
Total Investment Return Based on
Fair Value . . . . . . . . . . . . . . . . . . .
11.89%
18.86%
(9.75)%
See Accompanying Notes to the Financial Statements.
14
7.48%
42.26%
The Cushing® MLP Total Return Fund
Financial Highlights — (Continued)
Supplemental Data and Ratios
Net assets applicable to common
stockholders, end of
year (000’s) . . . . . . . . . . . . . . . . .
Ratio of expenses (including
current and deferred income tax
benefit/expense) to average net
assets after waiver(2)(3) . . . . . . . . .
Ratio of net investment income
(loss) to average net assets before
waiver(2)(4) . . . . . . . . . . . . . . . . . . .
Ratio of net investment income
(loss) to average net assets after
waiver(2)(4) . . . . . . . . . . . . . . . . . . .
Ratio of net investment income
(loss) to average net assets after
current and deferred income tax
benefit/expense, before
waiver(2) . . . . . . . . . . . . . . . . . . . .
Ratio of net investment income
(loss) to average net assets after
current and deferred income tax
benefit/expense, after waiver(2) . .
Portfolio turnover rate . . . . . . . . . . .
(1)
(2)
Fiscal
Year Ended
November 30,
2014
Fiscal
Year Ended
November 30,
2013
Fiscal
Year Ended
November 30,
2012
Fiscal
Year Ended
November 30,
2011
Fiscal
Year Ended
November 30,
2010
$199,847
$233,620
$220,021
$255,747
$208,002
3.41%
4.64%
4.30%
3.39%
3.05%
(0.07)%
(0.05)%
(1.91)%
0.10%
1.66%
(0.07)%
(0.05)%
(1.91)%
0.10%
1.69%
(0.55)%
(2.50)%
(2.18)%
0.10%
1.66%
(0.55)%
137.17%
(2.50)%
297.81%
(2.18)%
230.13%
0.10%
240.55%
1.69%
300.70%
Information presented relates to a share of common stock outstanding for the entire year.
For the fiscal year ended November 30, 2014, the Fund accrued $1,115,507 in net current and deferred tax expense.
For the fiscal year ended November 30, 2013, the Fund accrued $5,743,456 in net current tax expense.
For the fiscal year ended November 30, 2012, the Fund accrued $648,495 in net current tax expense.
For the fiscal year ended November 30, 2011, the Fund accrued $0 in net current and deferred tax expense.
For the fiscal year ended November 30, 2010, the Fund accrued $0 in net current and deferred tax expense.
(3)
The ratio of expenses (including current and deferred income tax benefit/expense) to average net assets before waiver was 3.41%, 4.64%,
4.30%, 3.39%, and 3.08% for the fiscal years ended November 30, 2014, 2013, 2012, 2011, and 2010, respectively.
(4)
The ratio of expenses (excluding current and deferred income tax expense) to average net assets before waiver was 2.93%, 2.18%, 4.03%,
3.39%, and 3.08% for the fiscal years ended November 30, 2014, 2013, 2012, 2011, and 2010, respectively.
The ratio of expenses (excluding current and deferred income tax expense) to average net assets after waiver was 2.93%, 2.18%, 4.03%,
3.39%, and 3.05% for the fiscal years ended November 30, 2014, 2013, 2012, 2011, and 2010, respectively.
This ratio excludes current and deferred income tax benefit/expense on net investment income.
(5)
See Accompanying Notes to the Financial Statements.
15
The Cushing® MLP Total Return Fund
Notes to Financial Statements
November 30, 2014
1.
Organization
The Cushing® MLP Total Return Fund (the “Fund”) was formed as a Delaware statutory trust on
May 23, 2007, and is a non-diversified, closed-end investment company under the Investment Company Act of 1940, as amended (the “1940 Act”). The Fund is managed by Cushing® Asset Management, LP (the “Adviser”). The Fund’s investment objective is to seek to produce current income and
capital appreciation. The Fund commenced operations on August 27, 2007. The Fund’s shares are
listed on the New York Stock Exchange under the symbol “SRV.”
2.
Significant Accounting Policies
A. Use of Estimates
The preparation of financial statements in conformity with U.S. generally accepted accounting principles requires management to make estimates and assumptions that affect the reported amount of assets
and liabilities, recognition of distribution income and disclosure of contingent assets and liabilities at
the date of the financial statements. Actual results could differ from those estimates.
B. Investment Valuation
The Fund uses the following valuation methods to determine fair value as either fair value for investments for which market quotations are available, or if not available, the fair value, as determined in
good faith pursuant to such policies and procedures as may be approved by the Fund’s Board of Trustees (“Board of Trustees”) from time to time. The valuation of the portfolio securities of the Fund currently includes the following processes:
(i) The fair value of each security listed or traded on any recognized securities exchange or automated quotation system will be the last reported sale price at the relevant valuation date on the
composite tape or on the principal exchange on which such security is traded. If no sale is
reported on that date, the Adviser utilizes, when available, pricing quotations from principal
market makers. Such quotations may be obtained from third-party pricing services or directly
from investment brokers and dealers in the secondary market. Generally, the Fund’s loan and
bond positions are not traded on exchanges and consequently are valued based on market prices
received from third-party services or broker-dealer sources.
(ii) Listed options on debt securities are valued at the average of the bid price and the ask price.
Unlisted options on debt or equity securities are valued based upon their composite bid prices if
held long, or their composite ask prices if held short. Futures are valued at the last sale price on
the commodities exchange on which they trade.
(iii) The Fund’s non-marketable investments will generally be valued in such manner as the
Adviser determines in good faith to reflect their fair values under procedures established by, and
under the general supervision and responsibility of, the Board of Trustees. The pricing of all
assets that are fair valued in this manner will be subsequently reported to and ratified by the Board
of Trustees.
The Fund may engage in short sale transactions. For financial statement purposes, an amount equal to
the settlement amount, if any, is included in the Statement of Assets and Liabilities as a liability. The
amount of the liability is subsequently marked-to-market to reflect the fair value of the short positions.
Subsequent fluctuations in market prices of securities sold short may require purchasing the securities
16
at prices which may differ from the fair value reflected on the Statement of Assets and Liabilities.
When the Fund sells a security short, it must borrow the security sold short and deliver it to the brokerdealer through which it made the short sale. A gain, limited to the price at which the Fund sold the
security short, or a loss, unlimited in size, will be recognized under the termination of a short sale. The
Fund is also subject to the risk that it may be unable to reacquire a security to terminate a short position
except at a price substantially in excess of the last quoted price. The Fund is liable for any dividends
paid on securities sold short and such amounts are reflected as dividend expense in the Statement of
Operations. The Fund’s obligation to replace the borrowed security is secured by collateral deposited
with the broker-dealer. The Fund also is required to segregate similar collateral to the extent, if any,
necessary so that the value of both collateral amounts in the aggregate is at all times equal to at least
100% of the fair value of the securities sold short. The fair value of securities sold short was
$26,360,224 at November 30, 2014.
C. Security Transactions, Investment Income and Expenses
Security transactions are accounted for on the date securities are purchased or sold (trade date). Realized gains and losses are reported on a specific identified cost basis. Interest income is recognized on
the accrual basis, including amortization of premiums and accretion of discounts. Distributions are
recorded on the ex-dividend date. Distributions received from the Fund’s investments in master limited
partnerships (“MLPs”) generally are comprised of ordinary income, capital gains and return of capital
from the MLPs. The Fund records investment income on the ex-date of the distributions. For financial
statement purposes, the Fund uses return of capital and income estimates to allocate the dividend
income received. Such estimates are based on historical information available from each MLP and
other industry sources. These estimates may subsequently be revised based on information received
from the MLPs after their tax reporting periods are concluded, as the actual character of these distributions is not known until after the fiscal year end of the Fund.
The Fund estimates the allocation of investment income and return of capital for the distributions
received from MLPs within the Statement of Operations. For the fiscal year ended November 30, 2014,
the Fund has estimated approximately 90% of the distributions received from MLPs to be return of
capital.
Expenses are recorded on an accrual basis.
D. Distributions to Stockholders
Distributions to common stockholders are recorded on the ex-dividend date. The character of distributions to common stockholders made during the year may differ from their ultimate characterization for federal income tax purposes. For the fiscal year ended November 30, 2014, the Fund’s
distributions were expected to be comprised of 100% ordinary income. The tax character of distributions paid for the fiscal year ended November 30, 2014 will be determined in early 2015.
E. Federal Income Taxation
The Fund, taxed as a corporation, is obligated to pay federal and state income tax on its taxable
income. Currently, the maximum marginal regular federal income tax rate for a corporation is 35%.
The Fund may be subject to a 20% federal alternative minimum tax on its federal alternative minimum
taxable income to the extent that its alternative minimum tax exceeds its regular federal income tax.
The Fund invests its assets primarily in MLPs, which generally are treated as partnerships for federal
income tax purposes. As a limited partner in MLPs, the Fund reports its allocable share of each MLP’s
taxable income in computing its own taxable income.
The Fund’s tax expense or benefit is included in the Statement of Operations based on the component
of income or gains (losses) to which such expense or benefit relates. Deferred income taxes reflect the
17
net tax effects of temporary differences between the carrying amounts of assets and liabilities for financial reporting purposes and the amounts used for income tax purposes. A valuation allowance is recognized if, based on the weight of available evidence, it is more likely than not that some portion or all of
the deferred income tax asset will not be realized.
The Fund recognizes in the financial statements the impact of a tax position, if that position is morelikely-than-not to be sustained on examination by the taxing authorities, based on the technical merits
of the position. Tax benefits resulting from such a position are measured as the amount that has a
greater than fifty percent likelihood on a cumulative basis to be sustained on examination.
F. Cash and Cash Equivalents
The Fund considers all highly liquid investments purchased with initial maturity equal to or less than
three months to be cash equivalents.
G. Cash Flow Information
The Fund makes distributions from investments, which include the amount received as cash distributions from MLPs, common stock dividends and interest payments. These activities are reported in
the Statement of Changes in Net Assets, and additional information on cash receipts and payments is
presented in the Statement of Cash Flows.
H. Indemnifications
Under the Fund’s organizational documents, its officers and trustees are indemnified against certain
liabilities arising out of the performance of their duties to the Fund. In addition, in the normal course of
business, the Fund may enter into contracts that provide general indemnification to other parties. The
Fund’s maximum exposure under such indemnification arrangements is unknown, as this would
involve future claims that may be made against the Fund that have not yet occurred, and may not
occur. However, the Fund has not had prior claims or losses pursuant to these contracts and expects the
risk of loss to be remote.
I. Derivative Financial Instruments
The Fund provides disclosure regarding derivatives and hedging activity to allow investors to understand how and why the Fund uses derivatives, how derivatives are accounted for, and how derivative
instruments affect the Fund’s results of operations and financial position.
The Fund occasionally purchases and sells (“writes”) put and call equity options as a source of potential protection against a broad market decline. A purchaser of a put option has the right, but not the
obligation, to sell the underlying instrument at an agreed upon price (“strike price”) to the option seller.
A purchaser of a call option has the right, but not the obligation, to purchase the underlying instrument
at the strike price from the option seller. Options are settled for cash.
Purchased Options — Premiums paid by the Fund for purchased options are included in the Statement
of Assets and Liabilities as an investment. The option is adjusted daily to reflect the fair value of the
option and any change in fair value is recorded as unrealized appreciation or depreciation of investments. If the option is allowed to expire, the Fund will lose the entire premium paid and record a realized loss for the premium amount. Premiums paid for purchased options which are exercised or closed
are added to the amounts paid or offset against the proceeds on the underlying investment transaction
to determine the realized gain/loss or cost basis of the security.
Written Options — Premiums received by the Fund for written options are included in the Statement of
Assets and Liabilities. The amount of the liability is adjusted daily to reflect the fair value of the written option and any change in fair value is recorded as unrealized appreciation or depreciation of
investments. Premiums received from written options that expire are treated as realized gains. The
18
Fund records a realized gain or loss on written options based on whether the cost of the closing transaction exceeds the premium received. If a call option is exercised by the option buyer, the premium
received by the Fund is added to the proceeds from the sale of the underlying security to the option
buyer and compared to the cost of the closing transaction to determine whether there has been a realized gain or loss. If a put option is exercised by an option buyer, the premium received by the option
seller reduces the cost basis of the purchased security.
Written uncovered call options subject the Fund to unlimited risk of loss. Written covered call options
limit the upside potential of a security above the strike price. Put options written subject the Fund to
risk of loss if the value of the security declines below the exercise price minus the put premium.
The Fund is not subject to credit risk on written options as the counterparty has already performed its
obligation by paying the premium at the inception of the contract.
The Fund has adopted the disclosure provisions of Financial Accounting Standards Board (“FASB”)
Accounting Standard Codification 815, Derivatives and Hedging (“ASC 815”). ASC 815 requires
enhanced disclosures about the Fund’s use of and accounting for derivative instruments and the effect
of derivative instruments on the Fund’s results of operations and financial position. Tabular disclosure
regarding derivative fair value and gain/loss by contract type (e.g., interest rate contracts, foreign
exchange contracts, credit contracts, etc.) is required and derivatives accounted for as hedging instruments under ASC 815 must be disclosed separately from those that do not qualify for hedge accounting. Even though the Fund may use derivatives in an attempt to achieve an economic hedge, the Fund’s
derivatives are not accounted for as hedging instruments under ASC 815 because investment companies account for their derivatives at fair value and record any changes in fair value in current period
earnings.
Transactions in purchased options during the fiscal year ended November 30, 2014, are as follows:
Contracts
Premiums
Outstanding at November 30, 2013 . . . . . . . . . . . . . . . . . . . . . . . . . . .
— $
—
Options purchased . . . . . . . . . . . . . . . . . . . . . . . . . . . . . . . . . . . . . . . . 66,100
6,205,601
Options covered . . . . . . . . . . . . . . . . . . . . . . . . . . . . . . . . . . . . . . . . . . (30,862) (3,710,991)
Options expired . . . . . . . . . . . . . . . . . . . . . . . . . . . . . . . . . . . . . . . . . . (32,500) (2,082,609)
Options exercised . . . . . . . . . . . . . . . . . . . . . . . . . . . . . . . . . . . . . . . . .
—
—
Outstanding at November 30, 2014 . . . . . . . . . . . . . . . . . . . . . . . . . . .
2,738 $
412,001
The average monthly fair value of purchased options during the fiscal year ended November 30, 2014
was $709,404.
Transactions in written options contracts for the fiscal year ended November 30, 2014, are as follows:
Contracts
Premiums
Outstanding at November 30, 2013 . . . . . . . . . . . . . . . . . . . . . . . . . . .
— $
—
Options written . . . . . . . . . . . . . . . . . . . . . . . . . . . . . . . . . . . . . . . . . . . 29,610 1,465,858
Options covered . . . . . . . . . . . . . . . . . . . . . . . . . . . . . . . . . . . . . . . . . .
—
—
Options expired . . . . . . . . . . . . . . . . . . . . . . . . . . . . . . . . . . . . . . . . . . . (18,513) (883,654)
Options exercised . . . . . . . . . . . . . . . . . . . . . . . . . . . . . . . . . . . . . . . . . (8,617) (485,229)
Outstanding at November 30, 2014 . . . . . . . . . . . . . . . . . . . . . . . . . . .
2,480 $
96,975
The average monthly fair value of written options during the fiscal year ended November 30, 2014 was
$109,434.
19
The effect of derivative instruments on the Statement of Operations for the fiscal year ended
November 30, 2014:
Amount of Realized Gain or (Loss) on Derivatives Recognized in Income
Purchased
Derivatives not accounted for as hedging instruments under ASC 815
Options
Equity Contracts . . . . . . . . . . . . . . . . . . . . . . . . . . . . . . . . . . . . . . . . . . . . . . .
Written
Options
Total
$ 743,464 $883,654 $1,627,118
Amount of Unrealized Appreciation (Depreciation) on Derivatives Recognized in Income
Purchased
Written
Derivatives not accounted for as hedging instruments under ASC 815
Options
Options
Total
Equity Contracts . . . . . . . . . . . . . . . . . . . . . . . . . . . . . . . . . . . . . . . . . . . . . . . $(398,311) $ (8,285) $ (406,596)
3.
Concentrations of Risk
The Fund’s investment objective is to seek to produce current income and capitalization. The Fund
seeks to achieve its investment objective by investing, under normal market conditions, at least 80% of
its net assets, plus any borrowings for investment purposes, in MLP investments; up to 50% of its
Managed Assets in securities of MLPs and other natural resource companies that are not publicly
traded, or that are otherwise restricted securities; up to 20% of its Managed Assets in securities of
companies that are not MLPs, including other natural resource companies, and U.S. and
non-U.S. issuers that may not constitute other natural resource companies; and up to 20% of its Managed Assets in debt securities of MLPs, other natural resource companies and other issuers.
“Managed Assets” means the total assets of the Fund, minus all accrued expenses incurred in the normal
course of operations other than liabilities or obligations attributable to investment leverage, including,
without limitation, investment leverage obtained through (i) indebtedness of any type (including, without
limitation, borrowing through a credit facility or the issuance of debt securities), (ii) the issuance of
shares of preferred stock or other similar preference securities and/or (iii) the reinvestment of collateral
received for securities loaned in accordance with the Fund’s investment objective and policies.
4.
Agreements and Related Party Transactions
The Fund has entered into an Investment Management Agreement with the Adviser (the “Agreement”).
Under the terms of the Agreement, the Fund will pay the Advisor a fee, payable at the end of each
calendar month, at an annual rate equal to 1.25% of the average weekly value of the Fund’s managed
assets during such month for the services and facilities provided by the Adviser to the Fund. The
Adviser earned $4,314,026 in advisory fees for the fiscal year ended November 30, 2014.
The Fund has engaged U.S. Bancorp Fund Services, LLC to serve as the Fund’s administrator. The Fund
pays the administrator a monthly fee computed at an annual rate of 0.08% of the first $100,000,000 of the
Fund’s managed assets, 0.05% on the next $200,000,000 of managed assets and 0.04% on the balance of
the Fund’s managed assets, with a minimum annual fee of $40,000.
U.S. Bancorp Fund Services, LLC serves as the Fund’s transfer agent, dividend paying agent, and
agent for the automatic dividend reinvestment plan.
U.S. Bank, N.A. serves as the Fund’s custodian. The Fund pays the custodian a monthly fee computed
at an annual rate of 0.004% of the Fund’s average daily market value, with a minimum annual fee of
$4,800.
20
5.
Income Taxes
Deferred income taxes reflect the net tax effect of temporary differences between the carrying amount
of assets and liabilities for financial reporting and tax purposes. Components of the Fund’s deferred tax
assets and liabilities as of November 30, 2014, are as follows:
Deferred tax assets:
Net operating loss carryforward . . . . . . . . . . . . . . . . . . . . . . . . . . . . . . . . . . $
358,582
Capital loss carryforward . . . . . . . . . . . . . . . . . . . . . . . . . . . . . . . . . . . . . . . .
17,035,128
Unrealized depreciation on investment securities . . . . . . . . . . . . . . . . . . . . .
2,506,093
Total deferred tax assets before valuation allowance . . . . . . . . . . . . . . . .
19,899,803
Less: Valuation Allowance . . . . . . . . . . . . . . . . . . . . . . . . . . . . . . . . . . . . . . . . (13,563,680)
Total deferred tax assets . . . . . . . . . . . . . . . . . . . . . . . . . . . . . . . . . . . . . .
6,336,123
Net deferred tax asset . . . . . . . . . . . . . . . . . . . . . . . . . . . . . . . . . . . . . . . . . . . . . $ 6,336,123
The capital loss carryforwards are available to offset future taxable income. The Fund has the following capital loss amounts:
Fiscal Year Ended Capital Loss
November 30, 2010 . . . . . . . . . . . . . . . . . . . . . . . . . . . . . . . . . . . . . . . . . . .
November 30, 2012 . . . . . . . . . . . . . . . . . . . . . . . . . . . . . . . . . . . . . . . . . . .
Amount
Expiration
$ 5,173,355
8,179,856
November 30, 2015
November 30, 2017
Total Fiscal Year Ended Capital Loss . . . . . . . . . . . . . . . . . . . . . . . . . . . $13,353,211
For corporations, capital losses can only be used to offset capital gains and cannot be used to offset
ordinary income. Capital losses may be carried forward for 5 years and, accordingly, would begin to
expire as of November 30, 2014. For the year ended November 30, 2014, capital loss carry forwards in
the amount of $35,361,961 expired.
Total income tax benefit (current and deferred) differs from the amount computed by applying the
federal statutory income tax rate of 35% to net investment income and realized and unrealized gains
(losses) on investments before taxes for the fiscal year ended November 30, 2014, as follows:
Income tax benefit at the Federal statutory rate of 35% . . . . . . . . . . . . . . . . . . . . $(1,345,717)
State income tax benefit, net of federal benefit . . . . . . . . . . . . . . . . . . . . . . . . . . .
(95,189)
Income tax benefit on permanent items . . . . . . . . . . . . . . . . . . . . . . . . . . . . . . . . .
(73,194)
Return to provision . . . . . . . . . . . . . . . . . . . . . . . . . . . . . . . . . . . . . . . . . . . . . . . .
(389,791)
Tax expense due to change in effective state rates . . . . . . . . . . . . . . . . . . . . . . . .
517,622
Valuation allowance changes affecting the provision for income taxes . . . . . . . . 2,501,776
Total Tax Expense to be accrued . . . . . . . . . . . . . . . . . . . . . . . . . . . . . . . . . . . . . $ 1,115,507
At November 30, 2014, the tax cost basis of investments was $247,645,506 and gross unrealized appreciation and depreciation of investments for federal income tax purposes were as follows:
Gross unrealized appreciation . . . . . . . . . . . . . . . . . . . . . . . . . . . . . . . . . . . . . $ 159,910,678
Gross unrealized depreciation . . . . . . . . . . . . . . . . . . . . . . . . . . . . . . . . . . . . . (165,064,607)
Net unrealized depreciation . . . . . . . . . . . . . . . . . . . . . . . . . . . . . . . . . . . . . . . $
21
(5,153,929)
The Fund recognizes the tax benefits of uncertain tax positions only where the position is “more likely
than not” to be sustained assuming examination by tax authorities. Management has analyzed the
Fund’s tax positions, and has concluded that no liability for unrecognized tax benefits should be
recorded related to uncertain tax positions taken on U.S. tax returns and state tax returns filed since
inception of the Fund. No income tax returns are currently under examination. All tax years beginning
after November 30, 2011 remain subject to examination by the tax authorities in the United States. Due
to the nature of the Fund’s investments, the Fund may be required to file income tax returns in several
states. The Fund is not aware of any tax positions for which it is reasonably expected that the total
amounts of unrecognized tax benefits will change materially in the next 12 months.
6.
Fair Value Measurements
Various inputs that are used in determining the fair value of the Fund’s investments are summarized in
the three broad levels listed below:
• Level 1 — quoted prices in active markets for identical securities
• Level 2 — other significant observable inputs (including quoted prices for similar securities, interest rates, prepayment speeds, credit risk, etc.)
• Level 3 — significant unobservable inputs (including the Fund’s own assumptions in determining
the fair value of investments)
The inputs or methodology used for valuing securities are not necessarily an indication of the risk
associated with investing in those securities.
These inputs are summarized in the three levels listed below.
Description
Assets
Equity Securities
Common Stock(a) . . . . . . . . . . . . . . . . . . . . . . . . . . . . . . .
Master Limited Partnerships and Related
Companies(a) . . . . . . . . . . . . . . . . . . . . . . . . . . . . . . . .
Royalty Trusts(a) . . . . . . . . . . . . . . . . . . . . . . . . . . . . . . .
Preferred Stock(a) . . . . . . . . . . . . . . . . . . . . . . . . . . . . . . .
Total Equity Securities . . . . . . . . . . . . . . . . . . . . . . . . . . . .
Fair Value Measurements at Reporting Date Using
Quoted Prices in Significant Other Significant
Active Markets for
Observable
Unobservable
Fair Value at
Identical Assets
Inputs
Inputs
November 30, 2014
(Level 1)
(Level 2)
(Level 3)
$ 17,525,141
$ 17,525,141
$
—
$
—
233,656,871
1,386,198
6,666,167
233,656,871
1,386,198
—
—
—
6,666,167
—
—
—
259,234,377
252,568,210
6,666,167
—
Notes
Senior Notes(a) . . . . . . . . . . . . . . . . . . . . . . . . . . . . . . . . .
9,181,890
—
9,181,890
—
Total Notes . . . . . . . . . . . . . . . . . . . . . . . . . . . . . . . . . . . . .
9,181,890
—
9,181,890
—
Other
Short-Term Investments(a) . . . . . . . . . . . . . . . . . . . . . . . .
Options . . . . . . . . . . . . . . . . . . . . . . . . . . . . . . . . . . . . . .
527,104
13,690
527,104
13,690
—
—
—
—
Total Other . . . . . . . . . . . . . . . . . . . . . . . . . . . . . . . . . . . . .
540,794
540,794
—
Total Assets . . . . . . . . . . . . . . . . . . . . . . . . . . . . . . . . . . . . .
$268,957,061
$253,109,004
$15,848,057
$
—
—
Liabilities
Securities sold short(a) . . . . . . . . . . . . . . . . . . . . . . . . . . .
Options . . . . . . . . . . . . . . . . . . . . . . . . . . . . . . . . . . . . . .
$ 26,360,224
105,260
$ 26,360,224
105,260
$
—
—
$
—
—
Total Liabilities . . . . . . . . . . . . . . . . . . . . . . . . . . . . . . . . . .
$ 26,465,484
$ 26,465,484
$
—
$
—
(a) All other industry classifications are identified in the Schedule of Investments. The Fund did not hold Level 3 investments at any time
during the fiscal year ended November 30, 2014.
22
Transfers into and out of each level are measured at fair value at the end of the fiscal year. There were
no transfers between any levels during the fiscal year ended November 30, 2014.
7. Investment Transactions
For the fiscal year ended November 30, 2014, the Fund purchased (at cost) and sold securities
(proceeds) in the amount of $459,282,576 and $428,799,143 (excluding short-term securities),
respectively and made purchases to cover investments sold short and received proceeds from investments sold short in the amount of $90,603,229 and $103,831,947, respectively. The Fund purchased
(at cost) and sold covered options (proceeds) in the amount of $6,205,601 and $48,999,603,
respectively. The Fund sold written options (proceeds) in the amount of $1,465,664.
8. Common Stock
The Fund has unlimited shares of capital stock authorized and 33,629,144 shares outstanding at
November 30, 2014. Transactions in common stock for the fiscal years ended November 30, 2013 and
2014 were as follows:
Shares at November 30, 2012 . . . . . . . . . . . . . . . . . . . . . . . . . . . . . . . . . . . . . . . . 33,257,500
Shares issued through reinvestment of distributions . . . . . . . . . . . . . . . . . . . . . . . .
220,792
Shares at November 30, 2013 . . . . . . . . . . . . . . . . . . . . . . . . . . . . . . . . . . . . . . . . 33,478,292
Shares issued through reinvestment of distributions . . . . . . . . . . . . . . . . . . . . . . . .
150,852
Shares at November 30, 2014 . . . . . . . . . . . . . . . . . . . . . . . . . . . . . . . . . . . . . . . . 33,629,144
9.
Borrowing Facilities
During the fiscal year ended November 30, 2014, the Fund maintained margin account arrangements
with Credit Suisse and Bank of America – Merrill Lynch. For Credit Suisse, the interest rate charged on
margin borrowing is tied to the cost of funds for Credit Suisse (which approximates LIBOR plus 1.20%).
For Bank of America – Merrill Lynch, the interest rate charged on margin borrowing is tied to the cost of
funds for Bank of America – Merrill Lynch (which approximates LIBOR plus 0.65%). In August 2014,
the Fund terminated its margin account arrangement with Bank of America – Merrill Lynch. Proceeds
from the margin account arrangement are used to execute the Fund’s investment objective.
The average principal balance and interest rate for the period during which the credit facilities were utilized during the period ended November 30, 2014 was approximately $99,153,000 and 0.90%,
respectively. At November 30, 2014, the principal balance outstanding was $95,547,072.
10.
Subsequent Events
On December 23, 2014, the Fund paid a distribution in the amount of $0.225 per common share, for a
total of $7,566,557. Of this total, the dividend reinvestment amounted to $262,680.
23
The Cushing® MLP Total Return Fund
Report of Independent Registered Public Accounting Firm
The Board of Trustees and Shareholders of
The Cushing MLP Total Return Fund:
We have audited the accompanying statement of assets and liabilities of The Cushing MLP Total
Return Fund (the Fund), including the schedule of investments, as of November 30, 2014, the related
statements of operations and cash flows for the year then ended, the statements of changes in net assets
for each of the two years in the period then ended, and the financial highlights for each of the four
years in the period then ended. These financial statements and financial highlights are the responsibility of the Fund’s management. Our responsibility is to express an opinion on these financial statements and financial highlights based on our audits. The financial highlights presented for the year
ended November 30, 2010 were audited by other auditors whose report dated January 27, 2011,
expressed an unqualified opinion on those financial highlights.
We conducted our audits in accordance with the standards of the Public Company Accounting Oversight Board (United States). Those standards require that we plan and perform the audit to obtain reasonable assurance about whether the financial statements and financial highlights are free of material
misstatement. We were not engaged to perform an audit of the Fund’s internal control over financial
reporting. Our audits included consideration of internal control over financial reporting as a basis for
designing audit procedures that are appropriate in the circumstances, but not for the purpose of
expressing an opinion on the effectiveness of the Fund’s internal control over financial reporting.
Accordingly, we express no such opinion. An audit also includes examining, on a test basis, evidence
supporting the amounts and disclosures in the financial statements and financial highlights, assessing
the accounting principles used and significant estimates made by management, and evaluating the
overall financial statement presentation. Our procedures included confirmation of securities owned as
of November 30, 2014, by correspondence with the custodian and brokers or by other appropriate
auditing procedures where replies from brokers were not received. We believe that our audits provide a
reasonable basis for our opinion.
In our opinion, the financial statements and financial highlights referred to above present fairly, in all
material respects, the financial position of The Cushing MLP Total Return Fund at November 30,
2014, the results of its operations and its cash flows for the year then ended, the changes in its net
assets for each of the two years in the period then ended, and the financial highlights for the each of the
four years in the period then ended, in conformity with U.S. generally accepted accounting principles.
Dallas, Texas
January 29, 2015
24
The Cushing® MLP Total Return Fund
Trustees and Executive Officers (Unaudited)
November 30, 2014
Set forth below is information with respect to each of the Trustees and executive officers of the Trust,
including their principal occupations during the past five years. The business address of the Fund, its
Trustees and executive officers is 8117 Preston Road, Suite 440, Dallas, Texas 75225.
Board of Trustees
Name and
Year of Birth
Term of
Office and
Length of
Time
Position(s) Held
with the Trust Served(1)
Number of
Portfolios
in Fund
Complex(2)
Overseen Other Directorships Held by Trustee During the
by Trustee
Past Five Years
Principal
Occupations
During Past
Five Years
Independent Trustees
Brian R. Bruce Trustee and
Trustee Chief Executive Officer,
(1955)
Chairman of the since 2007 Hillcrest Asset
Audit Committee
Management, LLC (2008
to present) (registered
investment adviser).
Previously, Director of
Southern Methodist
University’s Encap
Investment and LCM
Group Alternative Asset
Management Center
(2006 to 2011). Chief
Investment Officer of
Panagora Asset
Management, Inc. (1999
to 2007) (investment
management company).
Edward
N. McMillan
(1947)
Trustee and Lead Trustee Retired. Private Investor
Independent
since 2007 with over 35 years of
Trustee
experience in asset
management, investment
banking and general
business matters.
Ronald P. Trout Trustee and
(1939)
Chairman of the
Nominating and
Corporate
Governance
Committee
Trustee Retired. Previously,
since 2007 founding partner and
Senior Vice President of
Hourglass Capital
Management, Inc. (1989
to 2002) (investment
management company).
Interested Trustees
Jerry V. Swank Trustee,
Trustee
(1951)(3)
Chairman of the since 2007
Board and Chief
Executive Officer
Managing Partner
of the Adviser and
founder of Swank
Capital, LLC
(2000 to present).
4
CM Advisers Family of Funds (2 series) (2003 to
present) and Dreman Contrarian Funds (2 series)
(2007 to present).
4
None
4
Dorchestor Minerals, L.P. (2008 to present)
(acquisition, ownership and administration of natural
gas and crude oil royalty, net profits and leasehold
interests in the U.S.)
4
E-T Energy Ltd. (2008 to 2014) (developing,
operating, producing and selling recoverable
bitumen); Central Energy Partners, LP (2010-2013)
(storage and transportation of refined petroleum
products and petrochemicals).
(1)
After a Trustee’s initial term, each Trustee is expected to serve a three-year term concurrent with the class of Trustees for which he serves.
Messrs. McMillan and Swank are expected to stand for re-election in 2015, Mr. Trout in 2016, and Mr. Bruce in 2017.
(2)
The “Fund Complex” includes each registered investment company for which the Adviser serves as investment adviser. As of
November 30, 2014, there were four funds in the Fund Complex.
Mr. Swank is an “interested person” of the Fund, as defined under the 1940 Act, by virtue of his position as Managing Partner of the
Adviser.
(3)
25
Executive Officers
The following provides information regarding the executive officers of the Fund who are not Trustees.
Officers serve at the pleasure of the Board of Trustees and until his or her successor is appointed and
qualified or until his or her earlier resignation or removal.
Name and
Year of Birth
Position(s) Held
with the Trust
Term of
Office and
Length of
Time
Served(1)
Principal
Occupations
During Past
Five Years
Daniel L. Spears
(1972)
President
Officer
Partner and portfolio manager of the Adviser (2006 – present); Previously,
since 2010 Investment banker at Banc of America Securities, LLC (1998 to 2006).
John H. Alban
(1963)
Chief Financial Officer
and Treasurer
Officer
Chief Operating Officer (“COO”) and Chief Financial Officer (“CFO”) of
since 2010 the Adviser (2010 – present); Previously, CAO of NGP Energy Capital
Management (2007 – 2009); COO of Spinnerhawk Capital Management,
L.P. (2005 – 2007).
Barry Y. Greenberg
(1963)
Chief Compliance
Officer and Secretary
Officer
General Counsel and Chief Compliance Officer (“CCO”) of the Adviser;
since 2010 Partner at Akin Gump Strauss Hauer & Feld LLP (2005 – 2010); Vice
President, Legal, Compliance & Administration at American Beacon
Advisors (1995 – 2005); Attorney and Branch Chief at the U.S. Securities
and Exchange Commission (1988 – 1995).
Judd B. Cryer
(1973)
Vice President
Officer
Managing Director and Senior Research Analyst of the Adviser (2005 –
since 2012 present). Previously, a consulting engineer at Utility Engineering Corp.
(1999 – 2003) and a project manager with Koch John Zink Company
(1996 – 1998).
26
The Cushing® MLP Total Return Fund
Additional Information (Unaudited)
November 30, 2014
Investment Policies and Parameters
Previously, the Fund had stated an intention to generally invest in 20-30 issuers. The Board of Trustees
has approved eliminating that policy. While the Fund initially expects to invest in a greater number of
issuers, the Fund may in the future invest in fewer issuers. The Fund is a non-diversified, closed-end
management investment company under the 1940 Act. Accordingly, the Fund may invest a greater
portion of its assets in a more limited number of issuers than a diversified fund. An investment in the
Fund may present greater risk to an investor than an investment in a diversified portfolio because
changes in the financial condition or market assessment of a single issuer may cause greater fluctuations in the value of the Fund’s shares.
The Commodity Futures Trading Commission (“CFTC”) amended Rule 4.5, which permits investment
advisers to registered investment companies to claim an exclusion from the definition of commodity
pool operator with respect to a fund provided certain requirements are met. In order to permit the
Investment Adviser to continue to claim this exclusion with respect to the Fund under the amended
rule, the Fund limits its transactions in futures, options of futures and swaps (excluding transactions
entered into for “bona fide hedging purposes,” as defined under CFTC regulations) such that either: (i)
the aggregate initial margin and premiums required to establish its futures, options on futures and
swaps do not exceed 5% of the liquidation value of the Fund’s portfolio, after taking into account
unrealized profits and losses on such positions; or (ii) the aggregate net notional value of its futures,
options on futures and swaps does not exceed 100% of the liquidation value of the Fund’s portfolio,
after taking into account unrealized profits and losses on such positions. The Fund and the Adviser do
not believe that complying with the amended rule will limit the Fund’s ability to use futures, options
and swaps to the extent that it has used them in the past.
Trustee and Executive Officer Compensation
The Fund does not currently compensate any of its trustees who are interested persons nor any of its
officers. For the fiscal year ended November 30, 2014, the aggregate compensation paid by the Fund to
the independent trustees was $109,071. The Fund did not pay any special compensation to any of its
trustees or officers. The Fund continuously monitors standard industry practices and this policy is subject to change.
Cautionary Note Regarding Forward-Looking Statements
This report contains “forward-looking statements” as defined under the U.S. federal securities laws.
Generally, the words “believe,” “expect,” “intend,” “estimate,” “anticipate,” “project,” “will” and similar expressions identify forward-looking statements, which generally are not historical in nature.
Forward-looking statements are subject to certain risks and uncertainties that could cause actual results
to materially differ from the Fund’s historical experience and its present expectations or projections
indicated in any forward-looking statements. These risks include, but are not limited to, changes in
economic and political conditions; regulatory and legal changes; MLP industry risk; leverage risk;
valuation risk; interest rate risk; tax risk; and other risks discussed in the Fund’s filings with the SEC.
You should not place undue reliance on forward-looking statements, which speak only as of the date
they are made. The Fund undertakes no obligation to update or revise any forward-looking statements
made herein. There is no assurance that the Fund’s investment objectives will be attained.
27
Proxy Voting Policies
A description of the policies and procedures that the Fund uses to determine how to vote proxies relating to portfolio securities owned by the Fund and information regarding how the Fund voted proxies
relating to the portfolio of securities during the 12-month period ended June 30 are available to stockholders without charge, upon request by calling the Fund toll-free at (800)236-4424 and on the Fund’s
website at www.cushingcef.com. Information regarding how the Fund voted proxies relating to the
portfolio of securities during the 12-month period ended June 30 are also available to stockholders
without charge on the SEC’s website at www.sec.gov.
Form N-Q
The Fund files its complete schedule of portfolio holdings for the first and third quarters of each fiscal
year with the SEC on Form N-Q. The Fund’s Form N-Q and statement of additional information are
available without charge by visiting the SEC’s website at www.sec.gov. In addition, you may review
and copy the Fund’s Form N-Q at the SEC’s Public Reference Room in Washington D.C. You may
obtain information on the operation of the Public Reference Room by calling (800) SEC-0330.
Portfolio Turnover
The portfolio turnover rate for the fiscal year ended November 30, 2014 was 137.17%. Portfolio turnover may vary greatly from period to period. The Fund does not consider portfolio turnover rate a
limiting factor in the Adviser’s execution of investment decisions, and the Fund may utilize investment
and trading strategies that may involve high portfolio turnover. A higher portfolio turnover rate results
in correspondingly greater brokerage commissions and other transactional expenses that are borne by
the Fund.
Certifications
The Fund’s Chief Executive Officer has submitted to the New York Stock Exchange the annual CEO
certification as required by Section 303A.12(a) of the NYSE Listed Fund Manual.
The Fund has filed with the SEC the certification of its Chief Executive Officer and Chief Financial
Officer required by Section 302 of the Sarbanes-Oxley Act.
Dividend Reinvestment Plan
How the Plan Works
Unless the registered owner of common shares elects to receive cash by contacting the Plan Agent, all
dividends declared for your common shares of the Fund will be automatically reinvested by U.S.
Bancorp Fund Services, LLC (the “Plan Agent”), agent for stockholders in administering the Fund’s
Dividend Reinvestment Plan (the “Plan”), in additional common shares of the Fund. The Plan Agent
will open an account for each common stockholder under the Plan in the same name in which such
common stockholder’s common shares are registered. Whenever the Fund declares a dividend or other
distribution (for purposes of this section, together, a “dividend”) payable in cash, non-participants in
the Plan will receive cash and participants in the Plan will receive the equivalent in common shares.
The common shares will be acquired by the Plan Agent for the participants’ accounts, depending upon
the circumstances described below, either (i) through receipt of additional unissued but authorized
common shares from the Fund (“newly-issued common shares”) or (ii) by purchase of outstanding
common shares on the open market (“open-market purchases”) on the New York Stock Exchange or
elsewhere.
28
If, on the payment date for any dividend, the market price per common share plus per share fees (which
include any brokerage commissions the Plan Agent is required to pay) is greater than the net asset
value per common share, the Plan Agent will invest the dividend amount in newly-issued common
shares, including fractions, on behalf of the participants. The number of newly-issued common shares
to be credited to each participant’s account will be determined by dividing the dollar amount of the
dividend by the net asset value per common share on the payment date; provided that, if the net asset
value per common share is less than 95% of the market price per common share on the payment date,
the dollar amount of the dividend will be divided by 95% of the market price per common share on the
payment date. If, on the payment date for any dividend, the net asset value per common share is greater
than the market value per common share plus per share fees, the Plan Agent will invest the dividend
amount in common shares acquired on behalf of the participants in open-market purchases.
Participation in the Plan
If a registered owner of common shares elects not to participate in the Plan, you will receive all dividends in cash paid by check mailed directly to you (or, if the shares are held in street or other nominee
name, then to such nominee) by the Plan Agent, as dividend disbursing agent. You may elect not to
participate in the Plan and to receive all dividends in cash by sending written or telephonic instructions
to the Plan Agent, as dividend paying agent, or by contacting the Plan Agent via their website at the
address set out below. Participation in the Plan is completely voluntary and may be terminated or
resumed at any time without penalty by contacting the Plan Agent before the dividend record date;
otherwise such termination or resumption will be effective with respect to any subsequently declared
dividend or other distribution.
Plan Fees
There will be no per share fees with respect to common shares issued directly by the Fund. However,
each participant will pay a pro rata share of brokerage commissions incurred in connection with openmarket purchases. There is no direct service charge to participants in the Plan; however, the Fund
reserves the right to amend the Plan to include a service charge payable by the participants.
Tax Implications
The automatic reinvestment of dividends will not relieve participants of any federal, state or local
income tax that may be payable (or required to be withheld) on such dividends. Accordingly, any taxable dividend received by a participant that is reinvested in additional common shares will be subject to
federal (and possibly state and local) income tax even though such participant will not receive a corresponding amount of cash with which to pay such taxes.
Contact Information
For more information about the plan you may contact the Plan Agent in writing at PO Box 708,
Milwaukee, WI 53201-0701, or by calling the Plan Agent at 1-800-662-7232.
Privacy Policy
In order to conduct its business, the Fund collects and maintains certain nonpublic personal
information about its stockholders of record with respect to their transactions in shares of the Fund’s
securities. This information includes the stockholder’s address, tax identification or Social Security
number, share balances, and dividend elections. We do not collect or maintain personal information
about stockholders whose share balances of our securities are held in “street name” by a financial
institution such as a bank or broker.
29
We do not disclose any nonpublic personal information about you, the Fund’s other stockholders or the
Fund’s former stockholders to third parties unless necessary to process a transaction, service an
account, or as otherwise permitted by law.
To protect your personal information internally, we restrict access to nonpublic personal information
about the Fund’s stockholders to those employees who need to know that information to provide services to our stockholders. We also maintain certain other safeguards to protect your nonpublic personal
information.
Other Information For Stockholders
Notice is hereby given in accordance with Section 23(c) of the Investment Company Act of 1940, as
amended, that the Fund from time to time may purchase its common shares of beneficial interest in the
open market.
This report is sent to stockholders of The Cushing® MLP Total Return Fund for their information. It is
not a prospectus, circular or representation intended for use in the purchase or sale of shares of the
Fund or of any securities mentioned in this report.
The Fund does not make available copies of its Statement of Additional Information because the
Fund’s shares are not continuously offered, which means that the Statement of Additional Information
has not been updated after completion of the Fund’s initial public offering and the information contained in such Statement of Additional Information may have become outdated.
The Fund makes available performance and certain other on its website at www.cushingcef.com. Investors and others are advised to periodically check the website for updated performance information and
the release of other material information about the Fund. This reference to Fund’s website is intended
to allow investors public access to information regarding the Fund and does not, and is not intended to,
incorporate the Fund’s website in this report.
30
The Cushing® MLP Total Return Fund
TRUSTEES
ADMINISTRATOR
Brian R. Bruce
Ronald P. Trout
Edward N. McMillan
Jerry V. Swank
U.S. Bancorp Fund Services, LLC
615 East Michigan Street, 3rd Floor
Milwaukee, WI 53202
CUSTODIAN
EXECUTIVE OFFICERS
Jerry V. Swank
Chief Executive Officer
Daniel L. Spears
President
John H. Alban
Chief Financial Officer and Treasurer
Barry Y. Greenberg
Chief Compliance Officer and Secretary
Judd B. Cryer
Vice President
INVESTMENT ADVISER
Cushing® Asset Management, LP
8117 Preston Road, Suite 440
Dallas, TX 75225
U.S. Bank, N.A.
1555 N. River Center Drive, Suite 302
Milwaukee, WI 53212
TRANSFER AGENT
U.S. Bancorp Fund Services, LLC
615 East Michigan Street, 3rd Floor
Milwaukee, WI 53202
LEGAL COUNSEL
Skadden, Arps, Slate, Meagher & Flom LLP
Four Times Square
New York, NY 10036
INDEPENDENT REGISTERED
PUBLIC ACCOUNTING FIRM
Ernst & Young LLP
2323 Victory Avenue, Suite 2000
Dallas, TX 75219
NOT FDIC INSURED | NOT BANK GUARANTEED | MAY LOSE VALUE
THE CUSHING® MLP TOTAL RETURN FUND
Investment Adviser
Cushing® Asset Management, LP
8117 Preston Road
Suite 440
Dallas, TX 75225
(214) 692-6334
(888) 777-2346
www.cushingcef.com
www.swankcapital.com
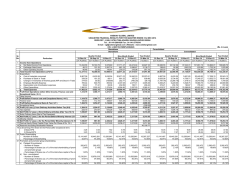
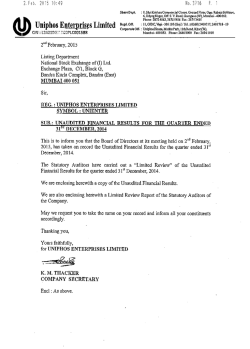

© Copyright 2026