
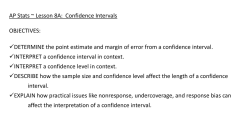
Confidence Intervals for 1 Sample Means
Confidence Intervals for Means 5. Cattle. Livestock are given a special feed supplement to see if it will promote weight gain. The researchers report that the 77 cows studied gained an average of 56 pounds, and that a 95% confidence interval for the mean weight gain this supplement produces has a margin of error of ±11 pounds. Some students wrote the following conclusions. Did anyone interpret the interval correctly? Explain any misinterpretations. a) 95% of the cows studied gained between 45 and 67 pounds. b) We're 95% sure that a cow fed this supplement will gain between 45 and 67 pounds. c) We're 95% sure that the average weight gain among the cows in this study was between 45 and 67 pounds. d) The average weight gain of cows fed this supplement will be between 45 and 67 pounds 95% of the time. e) If this supplement is tested on another sample of cows, there is a 95% chance that their average weight gain will be between 45 and 67 pounds. 6. Teachers. Software analysis of the salaries of a random sample of 288 Nevada teachers produced the confidence interval shown below. Which conclusion is correct? What's wrong with the others? t-interval for : 90% Confidence, 38944 < (TchPay) < 42893 a) If we took many random samples of Nevada teachers, about 9 out of 10 of them would produce this confidence interval. b) If we took many random samples of Nevada teachers, about 9 out of 10 of them would produce a confidence interval that contained the mean salary of all Nevada teachers. c) About 9 out of 10 Nevada teachers earn between $38,944 and $42,893. d) About 9 out of 10 of the teachers surveyed earn between $38,944 and $42,893. e) We are 90% confident that the average teacher salary in the United States is between $38,944 and $42,893. 7. Pulse rates. A medical researcher measured the pulse rates (beats per minute) of a sample of randomly selected adults and found the following Student's t-based Confidence Interval: With 95% Confidence, 70.887604 < (Pulse) < 74.497011 a) Explain carefully what the software output means. b) What's the margin of error for this interval? c) If the researcher had calculated a 99% confidence interval, would the margin of error be larger or smaller? Explain. 8. Crawling. Data collected by child development scientists produced this confidence interval for the average age (in weeks) at which babies begin to crawl. t-interval for : 95% Confidence): 29.202 < (age) < 31.844 a) Explain carefully what the software output means. b) What is the margin of error for this interval? c) If the researcher had calculated a 90% confidence interval, would the margin of error be larger or smaller? Explain. 9. Normal temperature. The researcher described in Exercise 7 also measured the body temperatures of that randomly selected group of adults. The data he collected are summarized below. We wish to estimate the average (or "normal") temperature among the adult population. Summary of Temp. Count 52 Mean 98.2846 Median 98.2000 MidRange 98.6000 StdDev 0.682379 Range 2.80000 IntQRange 1.05000 a) Are the necessary conditions for a t-interval satisfied? Explain. b) Find a 98% confidence interval for mean body temperature. c) Explain the meaning of that interval. d) Explain what "98% confidence" means in this context. e) 98.6 degrees is commonly assumed to be "normal." Do these data suggest otherwise? Explain. 10. Parking. Hoping to lure more shoppers downtown, a city builds a new public parking garage in the central business district. The city plans to pay for the structure through parking fees. During a two-month period (44 weekdays), daily fees collected averaged $126 with a standard deviation of $15. a) What assumptions must you make in order to use these statistics for inference? b) Write a 90% confidence interval for the mean daily income this parking garage will generate. c) Explain in context what this confidence interval means. d) Explain what "90% confidence" means in this context. e) The consultant who advised the city on this project predicted that parking revenues would average $130 per day. Based on your confidence interval, do you think the consultant could have been correct? Why? 11. Normal temperatures, part II. Consider again the statistics about human body temperature in Exercise 9. a) Would a 90% confidence interval be wider or narrower than the 98% confidence interval you calculated before? Explain. (You should not need to compute the new interval.) b) What are the advantages and disadvantages of the 98% confidence interval? c) If we conduct further research, this time using a sample of 500 adults, how would you expect the 98% confidence interval to change? Explain. d) How large a sample would you need to estimate the mean body temperature to within 0.1 degrees with 98% confidence? 12. Parking II. Suppose that for budget planning purposes the city in Exercise 10 needs a better estimate of the mean daily income from parking fees. a) Someone suggests that the city use its data to create a 95% confidence interval instead of the 90% interval first created. How would this interval be better for the city? (You need not actually create the new interval.) b) How would the 95% interval be worse for the planners? c) How could they achieve an interval estimate that would better serve their planning needs? d) How many days' worth of data must they collect to have 95% confidence of estimating the true mean to within $3? 13. Hot dogs. A nutrition laboratory tests 40 "reduced sodium" hot dogs, finding that the mean sodium content is 310 mg with a standard deviation of 36 mg. a) Find a 95% confidence interval for the mean sodium content of this brand of hot dog. b) What assumptions have you made in this inference? Are the appropriate conditions satisfied? c) Explain clearly what your interval means. 14. Speed of light. In 1882 Michelson measured the speed of light (usually denoted "c" as in the famous statement e = mc2). His values are in km/sec and have 299,000 subtracted from them. He reported the results of 23 trials with a mean of 756.22 and a standard deviation of 107.12. a) Find a 95% confidence interval for the true speed of light from these statistics. b) State in words what this interval means. Keep in mind that the speed of light is a physical constant that, as far as we know, has a value that is true throughout the universe. c) What assumptions must you make in order to use your method? 15. Second dog. The nutrition lab in Exercise 13 tests the hot dogs again, this time using a sample of 60 "reduced sodium" frankfurters. The new sample produces a mean of 318 mg of sodium, and the standard deviation is 32 mg. a) Should this larger sample of hot dogs produce a more accurate estimate of the mean sodium content? Explain. b) What is the standard error of the mean sodium content? c) Find and interpret a 95% confidence interval. d) Food labeling regulations require that any food identified as "reduced sodium" must have at least 30% less sodium than its regular counterpart. If regular franks average 465 mg of sodium, should this brand be labeled "reduced"? Explain, using your confidence interval. 16. Better light. After his first attempt to determine the speed of light (described in Exercise 14), Michelson conducted an "improved" experiment. In 1897 he reported results of 100 trials with a mean of 852.4 and a standard deviation of 79.0. a) What is the standard error of the mean for these data? b) Without computing it, how would you expect a 95% confidence interval for the second experiment to differ from the confidence interval for the first? Note at least three specific reasons why they might differ, and indicate the ways in which these differences would change the interval. c) According to Stigler (who reports these values), the true speed of light is 299,710.5 km/sec, corresponding to a value of 710.5 for Michelson's 1897 measurements. What does this indicate about Michelson's two experiments? Explain, using your confidence interval. 23. Ruffles. Students investigating the packaging of potato chips purchased 6 bags of Lay's Ruffles marked with a net weight of 28.3 grams. They carefully weighed the contents of each bag, recording the following weights (in grams): 29.3, 28.2, 29.1, 28.7, 28.9, and 28.5. a) Do these data satisfy the assumptions for inference? Explain. b) Find the mean and standard deviation of the observed weights. c) Create a 95% confidence interval for the mean weight of such bags of chips. d) Explain in context what your interval means. e) Comment on the company's stated net weight of 28.3 grams. 24. Doritos. The students also checked 6 bags of Doritos marked with a net weight of 28.3 grams. They carefully weighed the contents of each bag, recording the following weights (in grams): 29.2, 28.5, 28.7, 28.9, 29.1, and 29.5. a) Do these data satisfy the assumptions for inference? Explain. b) Find the mean and standard deviation of the observed weights. c) Create a 95% confidence interval for the mean weight of such bags of chips. d) Explain in context what your interval means. e) Comment on the company's stated net weight of 28.3 grams. Confidence Intervals for Means Answers 5. a) The confidence interval is for the population mean, not the individual cows in the study. b) The confidence interval is not for individual cows. c) We know the average gain in this study was 56 pounds! d) The average weight gain of all cows does not vary. It's what we're trying to estimate. e) No. There is not a 95% chance for another sample to have an average weight gain between 45 and 67 pounds. There is a 95% chance that another sample will have its average weight gain within two standard errors of the true mean. 6. a) Nine out of 10 intervals will contain the true mean salary; different samples will produce different intervals. b) This is correct. c) The interval is for the population mean, not individual teachers. d) The interval is for the mean, not individual teachers. e) The interval addresses only Nevada teachers, not the entire country. 7. a) Based on this sample, we can say, with 95% confidence, that the mean pulse rate of adults is between 70.9 and 74.5 beats per minute. b) 1.8 beats per minute c) Larger 8. a) Based on this sample, we can say, with 95% confidence, that the mean age at which babies begin to crawl is between 29.2 and 31.8 weeks b) 1.3 c) Smaller 9. a) Yes. Randomly selected group; less than 10% of the population; the histogram is not unimodal and symmetric, but it is not highly skewed and there are no outliers, so with a sample size of 52, the CLT says y is approximately normal. b) (98.06, 98.51) degrees F c) We are 98% confident that the population average body temperature for an adult is between 98.05°F and 98.51°F. d) 98% of all such random samples will produce intervals containing the true mean temperature. e) These data suggest that the true normal temperature is somewhat less than 98.6°F. 10. a) The data are a representative sample of less than 10% of all days; n = 44 is a large sample. b) ($122.20, $129.80) c) We are 90% confident the population mean daily income for the parking garage is between $122.20 and $129.80. d) 90% of all such samples will produce intervals that contain the true mean daily fee. e) No. The interval is below $130. 11. a) Narrower. We need fewer values to be less confident. b) Advantage: more chance of including the true value. Disadvantage: wider interval. c) Narrower; due to the larger sample, the SE will be smaller. d) About 252 12. a) More chance the interval contains the true mean. b) The interval would be wider. c) More data would result in a narrower interval at same confidence level. d) About 99 13. a) (298.5, 321.5) b) Normal population, random sample, less than 10% of all hot dogs. These seem reasonable here—but we would need to check the nearly Normal condition. c) With 95% confidence, the population mean sodium content in these "reduced sodium" hot dogs is between 298.5 mg and 321.5 mg. 14. a) (709.90, 802.54) b) With 95% confidence, based on these data, the speed of light is between 299,709.9 and 299,802.5 km/sec. c) Normal model for the distribution, independent measurements, less than 10% of all possible measurements. These seem reasonable here, but it would be nice to see if the nearly Normal condition held for the data. 15. a) Yes. Larger sample, smaller SE. b) 4.1 mg sodium c) With 95% confidence, the population mean sodium content of all hot dogs is between 309.7 mg and 326.3 mg. d) 0.7(465) = 325.5. Since the confidence interval extends above this, it is possible these should not be labeled as "reduced sodium." 16. a) 7.9 km/sec b) Should be narrower. Different mean will change the center of the interval. Larger sample size and smaller standard deviation will reduce the SE. Since the f-critical value is also smaller, the margin of error will be smaller. c) New interval: (836.72, 868.08) km/sec. This experiment is worse than the first, which included 710.5. This interval is considerably above that value. There may have been a bias in this experiment's measurements. 23. a) Probably a representative sample, less than 10% of all Ruffles bags; the nearly Normal condition seems reasonable from a Normal probability plot. The histogram is nearly uniform, with no outliers or skewness. b) y = 28.78, s = 0.40 c) (28.36, 29.21) grams d) We are 95% confident the population average weight of the content of Ruffles bags is between 28.36 and 29.21 grams. e) The company is erring on the safe side, as it appears that, on average, it is putting in slightly more chips than stated. 24. a) Probably a representative sample, less than 10% of all Doritos bags; the nearly Normal condition seems reasonable from a Normal probability plot. The data are fairly symmetric with no apparent outliers. b) y = 28.98, s = 0.36 c) (28.61, 29.36) grams d) With 95% confidence, the population average weight of the content of Doritos bags is between 28.61 and 29.36 grams. e) The company is erring on the safe side, as it appears that, on average, it is putting in slightly more chips than stated.

© Copyright 2026