
RESTORATION OF VIKING MAWD DATASET. R. G. Nuno, D. A.
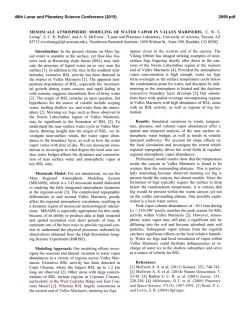
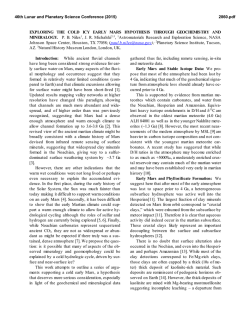
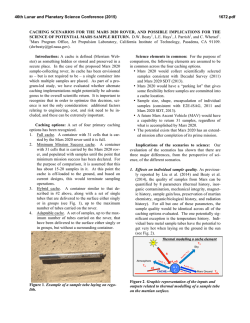
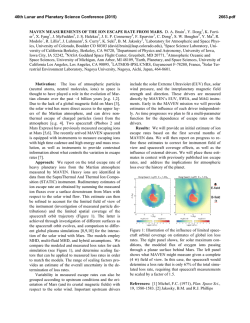
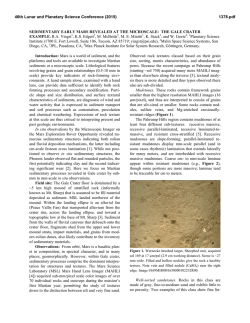
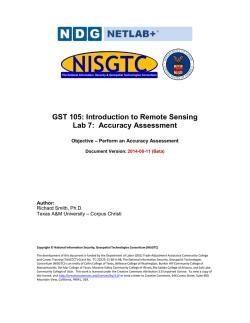
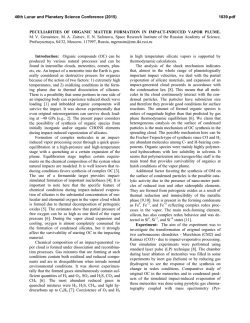
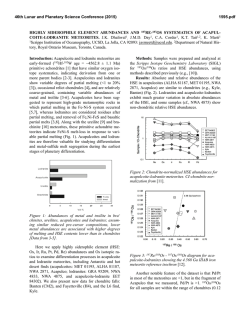
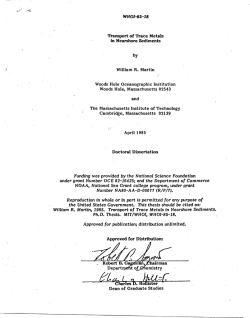
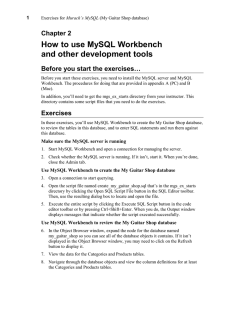
46th Lunar and Planetary Science Conference (2015)
2639.pdf
RESTORATION OF VIKING MAWD DATASET. R. G. Nuno, D. A. Paige, M. Sullivan, Department of Earth,
Planetary, and Space Sciences, University of California Los Angeles, Los Angeles, CA 90095 ([email protected])
Introduction: High-resolution HIRISE images of
transient albedo dark features, called Recurring Slope
Lineae (RSL), have been interpreted to be evidence for
current hydrological activity [1]. If there are surface
sources of water, then localized plumes of atmospheric
water may be observable from orbit.
The Viking Mars Atmospheric Water Detector
(MAWD) column water vapor data are uniquely valuable for this purpose because they cover the full range
of Martian local times, and include data sampled at
high spatial resolution [2]. We searched the raster-averaged Viking Orbiter 1 and 2 MAWD column water
vapor dataset for regions of localized elevated column
water vapor abundances and found mid-latitude regions with transient water observations [3] (Fig 1). Our
objective is to determine if the elevated column water
abundances observed in the raster-averaged MAWD
dataset were due to a single elevated raster measurement (implying a localized source) or to all 15 raster
measurements having elevated column water vapor
abundances (implying a more regional source).
Figure 1. Points of interest, differentiated by green
and pink makers for north and south hemispheres respectively, over Mars albedo map. Points with elevated
H2O column abundances are seen predominately in
albedo dark regions.
Viking Orbiters MAWD: The raster averaged
Viking Orbiter 1 and 2 MAWD column water vapor
data available in the Planetary Data System (PDS),
were calculated from radiance measurements using
seasonally and topographically varying surface pressures which, at the time, had high uncertainties [4].
Due to recent interest in transient hydrological activity
on Mars [2], we acquired and decoded the available
portion of the non-raster averaged Viking Orbiter 1
MAWD data, which are sampled at 15 times higher
spatial resolution than the data currently available from
PDS, to determine the occurrence of localized water
vapor on Mars.
Figure 2. a) Projection of a MAWD field of view
(FOV) onto the surface of Mars, from an altitude of
1500 km, b) Theoretical water vapor spectra; spectral
positions of the 5 detector channels are indicated by
the number 1-5 [4].
Spectral Fitting:
Least Squares Fit. We derived a rudimentary proxy
to column water vapor abundance by performing a
least squares fit to the mean of the radiances of 15
raster observations with little spatial and temporal
variation. Calculated mean radiance values of 15 individual raster radiance measurements, per channel, of a
single instantaneous FOV (IFOV) observation. This
particular IFOV observation was chosen because it
showed elevated column water vapor abundances in
the raster-averaged MAWD dataset, and the measurements were taken over approximately the same area
and time. The mean values, and a constant offset, were
used as basis functions to derive a scalar for the functions that was used as a proxy for column water vapor
abundance for each raster observation.
Discussion: We are acquiring the Viking Orbiter 2
MAWD dataset to recalculate column water vapor
abundances using current topographical data, as well
as dust and pressure measurements from the Mars
Global Circulation Model.
References: [1] McEwen, A. S., et al. (2011). Seasonal flows on warm Martian slopes. Science (New
York, N.Y.), 333(6043), 740–3. [2] Farmer, C. B., &
Laporte, D. D. (1972). The Detection and Mapping of
Water Vapor in the Martian Atmosphere. Icarus. [3]
Nuno, R. G., et al. (2013). Searching for Localized
Water Vapor Sources on Mars Utilizing Viking MAWD
Data. 44th Lunar and Planetary Science Conference.
[4] Farmer, C. B., et al. (1977). Mars: Water vapor
observations from the Viking orbiters. Journal of Geophysical Research, 82(28), 4225–4248.


© Copyright 2026