
PDF hosted at the Radboud Repository of the Radboud University
PDF hosted at the Radboud Repository of the Radboud University
Nijmegen
The following full text is a publisher's version.
For additional information about this publication click this link.
http://hdl.handle.net/2066/19446
Please be advised that this information was generated on 2015-02-06 and may be subject to
change.
Local spatial structure in pondweed populations:
the role of propagule size
Helen H. Hangelbroek
Local spatial structure in pondweed populations:
the role of propagule size
een wetenschappelijke proeve op het gebied van
de Natuurwetenschappen, Wiskunde en Informatica
Proefschrift
ter verkrijging van de graad van doctor
aan de Katholieke Universiteit Nijmegen
op gezag van de Rector Magnificus prof. dr. C.W.P.M. Blom,
volgens besluit van het College van Decanen
in het openbaar te verdedigen op
woensdag 26 mei 2004
des namiddags om 3.30 uur precies
door
Helen Harriët Hangelbroek
geboren op 8 mei 1970
te Voorburg
Promotor:
Prof. Dr. J.M. van Groenendael
Co-promotores:
Dr. L. Santamaría (Nederlands Insituut voor Ecologie /
Instituto Mediterráneo de Estudios Avanzados)
Dr. N.J. Ouborg
Manuscriptcommissie:
Prof. Dr. H. de Kroon
Prof. Dr. J.L. Olsen (Rijks Universiteit Groningen)
Prof. Dr. W. van Vierssen (Wageningen Universiteit)
ISBN: 90-9018073-7
© 2004 H.H. Hangelbroek
Parts of this material are allowed to be reproduced or utilised as long as their source is
mentioned
Voor mijn ouders
Table of Contents
Chapter 1
General introduction
9
Chapter 2
Clonal diversity and structure within a population of
the pondweed Potamogeton pectinatus foraged by
Bewick’s swans
27
Chapter 3
Population responses to propagule predation:
the role of clonal propagule size
51
Chapter 4
Local adaptation of the pondweed Potamogeton pectinatus
to contrasting substrate types mediated by changes in
propagule provisioning
83
Chapter 5
Regulation of propagule size in the aquatic pseudo-annual
Potamogeton pectinatus: are genetic and maternal
non-genetic effects additive?
109
Chapter 6
Water-depth zonation in a pondweed hybrid complex:
the role of abiotic factors and propagule predation
127
Chapter 7
Summarising discussion
157
Nederlandse samenvatting
175
Dankwoord
181
Curriculum vitae
183
Chapter 1
General introduction
Understanding and predicting the distribution and abundance of living organisms
through knowledge of the processes shaping them is of central importance to ecology
(Krebs 1972). Spatial variation in the abundance of a given taxon and its genetic
constitution, often referred to as “local spatial structure”, varies within and between plant
species (i.e. at population and community level). Local spatial structure is affected by
factors acting on genes or genotypes (i.e. on the genetic constitution of each given
taxon). Such factors may be random factors, internal (genetic) factors, ecological factors
or a combination thereof. Random factors are independent of the phenotype of the
plants and thus act by chance (e.g. genetic drift, founder effects or restricted gene flow
due to physical barriers). Internal (genetic) factors comprise of effects of specific gene
combinations that affect a plant’s phenotype and its fitness (e.g. inbreeding and
outbreeding depression or genetic incompatibility in hybrids). Ecological factors may be
predictable or unpredictable factors (e.g. random catastrophic climatic events).
Predictable ecological factors include both abiotic factors (e.g. resource availability,
climatic conditions and toxicity) and biotic factors (e.g. competition, herbivory and
symbiotic relationships) (see Linhart & Grant 1996 and references therein). Differences
in performance under various ecological conditions generally underlie the spatial
structure of populations or communities along ecological gradients or across
environmental mosaics. In this regard specific life history traits of species such as mode
of reproduction, dispersal mechanism, and growth form, may be important determinants
of population (Hamrick & Godt 1989, 1996) and community structure.
In this thesis I focused on the study of factors that determine local spatial structure of an
aquatic clonal plant (Potamogeton pectinatus) at the population and community level.
Particular attention is paid to the adaptive value of propagule size at various ecological
conditions and the role of propagule predation pressure thereupon by Bewick’s swans.
Chapter 1
Clonal plants
Clonal plants distinguish themselves from non-clonal plants by their ability to reproduce
asexually as well as sexually. Asexually produced plants (ramets) are, in the absence of
somatic mutations, genetically identical to the mother plant and to each other, i.e. they
belong to the same genotype or “genet”. New genets are formed only by sexual
reproduction. Asexual reproduction, often referred to as clonal reproduction, may take
place in several different manners (Klimeš et al. 1997). First of all, vegetative growth
along rhizomes or stolons may result in the production of independent units of the genet
following rhizome or stolon fragmentation (e.g. Potentilla anserina, Stuefer & Huber
1999). Second, plants may produce specialised vegetative organs such as bulbils,
subterranean bulbs, hibernacles or tubers, which become independent of the mother
plant following its total or partial senescence (e.g. Circaea lutetiana, Verburg & During
1998). Third, asexual seed production may take place (agamospermy) (e.g. Taraxacum
officinale, van Baarlen et al. 1999). Furthermore, asexual reproduction may take place in
a less specialised form, through fragmentation of virtually any plant part (e.g. Elodea
canadensis, Barrat-Segretain et al. 1998).
Clonal plant species have a number of advantageous characteristics compared to nonclonal plants. For instance, clonal plant species are capable to expand extensively, as
demonstrated by many largely clonal invasive plants. This probably results from a
combination of low physiological costs of asexual reproduction (except for
agamospermy) compared to sexual reproduction (e.g. no flower display and production,
no nectar production) and that asexual reproduction does not recombine potentially coadapted parental genes, i.e. it does not break up successful genotypes. Further, genets
(clones) are not sessile: they are mobile by means of rhizomatous or stoloniforous
growth (foraging) and through dispersal of fragments or asexual propagules
(agamospermous seeds or specialised vegetative organs of reproduction). This enables
genets to colonise new, potentially more favourable habitats and escape unfavourable
ones. Production of independent ramets can also be regarded as a strategy to spread
ramet mortality risk thereby increasing genet persistence (Eriksson & Jerling 1990).
Lastly, from a genetic point of view, clonal plants reproducing asexually transfer all their
genes to their offspring while sexually reproducing plants only transfer half their genes,
thus representing a twofold benefit for asexual reproduction. As mentioned earlier clonal
plants may also reproduce sexually. Benefits of sexual reproduction would be that a) it
provides an evolutionary solution to rid the genome from accumulating deleterious
mutations by purging the genome of accumulated deleterious mutations b) it leads to the
10
General introduction
continuous generation of new genotypes and c) by enabling recombination to take place
it has the potential to link beneficial characters together, thereby enhancing the potential
for adaptation. While both forms of reproduction seem to have specific advantages and
disadvantages, clonal plant species take advantage of both modes of reproduction. The
specific balance between sexual and asexual reproduction varies both within (e.g. Prati &
Schmid 2000; Ceplitis 2001) and between clonal species (van Groenendael et al. 1997)
and may be affected by ecological conditions (Prati & Schmid 2000; Van Kleunen &
Fischer 2003) (but see Verburg & During 1998; Ceplitis 2001). The balance between
asexual and sexual reproduction, on its turn, is likely to affect population genetic
structure. Although within-population genotypic variation decreases for asexuallyreproducing plants, clonal plant populations do seem to have similar levels of genetic
variation as compared to non-clonal plants when analysed at the genet level (Hamrick &
Godt 1989).
Natural selection and local adaptation
Populations of a species often show marked differences in phenotypes, forming various
spatial patterns. These differences need not be genetic differences but may solely be the
result of plastic responses to local environmental conditions. For example, resource poor
conditions result in smaller plants and shorter life cycles than under resource rich
conditions, and variation in light intensity may result in differences in leaf colour due to
changes in chlorophyll content and the activation of anthocyanins. However, if the
differences are genetic there are two possible sets of processes that might be responsible
for the structure: restricted gene flow followed by either genetic drift or natural selection
(Slatkin 1985). Restricted gene flow in plants occurs when dispersal of pollen, seeds,
asexual propagules or plant fragments is limited by factors such as large geographic
distances, physical barriers or limited numbers of pollinators. Genetic drift is the
phenomenon of changes of gene frequencies within a (small) population due to chance
processes alone. Natural selection is the driving force towards adaptation and, like
genetic drift, results in changes of gene frequencies, though contrary to drift, in response
to selective forces. For natural selection to take place on a particular character or suit of
characters, three prerequisites must be met: 1) the character must have a heritable basis,
2) the character must show variation within the population, and 3) variation of the
character must result in differences in fitness (Endler 1986). If these points hold and the
selective force is stable, evolutionary change may result in adaptation. Natural selection
may lead to population differentiation due to local adaptation, the formation of
11
Chapter 1
subspecies and eventually even to speciation. In addition, local adaptation may also
occur within populations maintaining distinct genotypes (Galen et al. 1991; Sork et al.
1993; Prati & Schmid 2000); however, for it to occur selection pressure must be strong
enough to compensate for the high gene flow that typically takes place within
populations. Much research in evolutionary ecological biology has been orientated on
whether natural selection has led to adaptations to specific ecological conditions. Often
only the last two prerequisites for natural selection are analysed and the heritable basis of
the character potentially under selection is then assumed. It may then falsely be
concluded that adaptive evolutionary change has occurred, because variation of the
character in the population may just as well be due to environmental effects (see above)
or maternal (non-genetic) effects. Maternal (non-genetic) effects include environmental
effects of the maternal plant that are passed on to the offspring (Roach & Wulff 1987).
For instance, the effects of the resource conditions in which the mother plant grows or
the size of the mother propagule or plant itself on the phenotype of offspring. The
genetic basis of a character can be quantified by estimating narrow or broad sense
heritability (Falconer & Mackay 1996). Falconer & Mackay (1996) however do point out
that heritability is also a property of the population, the environmental conditions which
the individuals have experienced and the manner in which the phenotype has been
measured. Moreover, they also mention the existence of possible correlations and/or
interactions between maternal non-genetic effects and genetic effects, which may be
unnoticed since they are generally unintendedly attributed to the genetic or
environmental components respectively. Analysing how maternal (non-genetic) effects
correlate and interact with the heritable basis of a character is of great importance, since
the heritable basis of a character reveals whether a character may be susceptible to
natural selection while the impact of environmental effects (including maternal nongenetic effects) will affect the pace of selection (Roach & Wulff 1987). Therefore, when
potential adaptive evolutionary change of a particular character, which is likely to be
affected by maternal non-genetic effects, is of interest not only all three prerequisites of
natural selection must be analysed but also the influence of maternal non-genetic effects.
This is what we have done in this thesis for the character propagule size.
A particular character (value) on which natural selection may act, potentially
resulting in local adaptation, has often been regarded to be static (or fixed), resulting in
increased fitness at local conditions and reduced fitness at foreign conditions.
Phenotypic plasticity, on the other hand, has been considered to provide an alternative to
local adaptation, allowing genotypes to grow in both ‘home’ and ‘away’ environments.
However, local adaptation may also involve contrasting reaction norms of plastic
12
General introduction
characters, which differ in their response to variation in environmental conditions
thereby enhancing fitness in their local environment.
It is also important to note that adaptation does not necessarily result from
selection pressure by one single ecological factor but more likely from a suit of factors.
Moreover, these factors may work simultaneously on the same trait, either enforcing the
direction of selection or potentially acting as opposing forces. The specific contribution
of particular factors and how they interact can be analysed with controlled experiments
involving factorial designs (e.g. Pilon & Santamaría 2002; Lower et al. 2003). If, however,
the interest of a study is to discern whether adaptation to local conditions occurs in a
more general sense, reciprocal transplant experiments are particularly informative (e.g.
Nagy & Rice 1997; Joshi et al. 2001).
Natural selection on clonal plants
When natural selection and adaptation of clonal plants to their surroundings is studied,
attention should be paid to the contribution of asexual reproduction (Pan & Price 2001).
Evolutionary change is based on changes of gene frequencies. These gene frequencies are
generally calculated from the ‘individuals’ in a population. However, with clonal plants
the definition of individual is less clear than with non-clonal species. Clonal species
comprise of genetically distinct individuals (genets) and physiologically (potentially)
independent individuals that may bare the same genotype (ramets). Depending on which
level is being analysed one speaks of a genet or a ramet perspective or level. Since the
genet is generally regarded as the unit on which selection acts (but see Tuomi &
Vuorisalo 1989), gene frequencies are most often based on genets and fitness is measured
as sexual reproductive output i.e. production of new genotypes. However, the potential
sexual reproductive output of a genet will increase with increased asexual production
since asexual reproduction leads to 1) enhanced photosynthetic area, 2) enhanced
resource capture capacity, and 3) increased number of meristems able to produce
(sexual) reproductive organs. Variation between clones in asexual reproductive success
may therefore lead to evolutionary change. Ramet selection (or ‘sorting’) may thus also
influence the gene frequencies in the population, as a sole result of genotypic selection
(rather than selection on individual genes). All in all, genotypic selection plays an
important role in evolutionary change in clonal plant populations (Van Kleunen &
Fischer 2003) and asexual reproduction should therefore also be considered (Pan & Price
2001).
13
Chapter 1
Propagule size: evolutionary and ecological implications
Lifetime reproductive output combined with the survival of offspring until reproductive
age are generally used as best measure for fitness. Since this is usually difficult to
measure, in particular with clonal species, other surrogate measures of fitness are
frequently used, such as number of propagules (whether sexual or asexual) or number of
ramets produced during a growth season. However, the future success of these
propagules depends on events and processes, such as winter survival, seedling
recruitment, growth or predator avoidance, which are in turn affected by propagule size
(Nelson & Johnson 1983; Van Groenendael & Habekotté 1988; Castro 1999; Eriksson
1999; Chacon & Bustamante 2001; Paz & Martinez-Ramos 2003). Moreover, these two
determinants of fitness (propagule number and size) are often inversely related at both
intra- and inter-specific level (Eriksson 1999; Jakobsson & Eriksson 2000; Stuefer et al.
2002). The trade-off between propagule size and number constrains selective forces from
maximising both traits, and a number of models have predicted optimal evolutionary
solutions ranging from a single optimal size to polymorphism to continuous variation in
propagule size (Geritz 1995; Rees & Westoby 1997; see also Rodríguez-Gironés et al.
2003).
Propagules are often subjected to high levels of herbivory or predation, which can be
attributed to their high nutritional value (Fenner & Kitajima 1999). Many animal species
depend on propagules as their main or only food source, such as, crossbills, rodents and
the larvae of many bruchid beetles. Propagule predation has major impacts on plant
fitness, since it involves a decrease in effective fecundity. Selection for defence
mechanisms is therefore expected to be high (Janzen 1969). Indeed, several kinds of
defence mechanisms against propagule predation are known to have evolved within
different plant species. These mechanisms may be chemical (toxic seed coat or
endosperm, Siemens et al. 1992; Guimaraes et al. 2003), physical (e.g. hairs, seed strength
or spines, Tutin et al. 1996; Rodgerson 1998; Coffey et al. 1999), behavioural, i.e., those
that involve selective propagule placement in spatial refuges (e.g. deep burial of desert
lilly bulbs and pondweed tubers, Saltz & Ward 2000; Santamaría & Rodríguez-Gironés
2002) and strategic (e.g. predation satiation through synchronic propagule production,
Donaldson 1993). Propagule size has manifold effects on predation risk as well. By
changing the size it affects predation costs of the predator through changing nutritional
reward per propagule and searching and handling time of the propagules by the
predators (Hulme & Benkman 2002). Inadvertently, these size changes may affect other
mechanisms of predation escape also related to size, namely propagule dispersal
14
General introduction
potential and achievable burial depth (Janzen 1970; Morse & Schmitt 1985; Banovetz &
Scheiner 1994; Saltz & Ward 2000). Most of all these just mentioned defence
mechanisms are costly in terms of reduced reproductive output in the absence of
predators. Therefore, allocation to defence and/or frequency of defended genotypes may
be expected to vary among populations or species subjected to varying propagule
predation pressures, resulting in specific population or community structures.
The size of a produced propagule is most likely not only regulated by genetic
components but by environmental conditions as well. Environmental conditions include
the local environment that the maternal plant experiences and the phenotype of the
maternal plant itself, since propagules are attached to the mother plant while developing.
The genetic component affecting propagule provisioning arises from the maternal
genotype (i.e. maternal traits that determine the amount of resources provisioned to each
propagule) and from the genotype of the propagule itself (i.e. traits that may determine
the amount of resources demanded by the individual propagule) (Antonovics & Schmitt
1986). Hence, in cases where producing many propagules of a small size is optimal for
the maternal genotype, parent-offspring conflicts may arise because achieving larger
sizes is generally optimal for individual propagules. Asexual propagules are an exception
to this, since maternal and offspring genotypes are identical. There may be a discrepancy
between optimal provisioning and optimal individual propagule size but this is within a
genotype and selection shall act on these characters simultaneously. For this reason and
because genetically identical propagules are readily available, asexual propagules are ideal
study objects to analyse the interaction between genetic and (maternal) environmental
effects on propagule size regulation and subsequently the potential of propagule size to
respond to natural selection.
This thesis
The aim
The aim of this thesis was to unravel which factors determine local spatial population
structure in a clonal plant species and whether these same factors affect local spatial
community structure of closely related species and their hybrid. More specifically, we
were interested in the interaction of genetic and environmental factors mediated by the
specific character, propagule size, and the role of natural selection and local adaptation in
structuring pondweed populations and communities.
15
Chapter 1
The study system
The pondweed Potamogeton pectinatus L. (fennel pondweed) was selected as model
species because it occurs in habitats where a number of ecological factors vary, such as
substrate type, water depth and propagule predation pressure by Bewick’s swans. These
factors may all potentially act as selective forces on propagule size. Moreover, the
propagules are asexually produced which facilitates distinguishing experimentally
between environmental and genetic effects. To analyse the local structure at the
community level P. pectinatus, P. filiformis Persoon (slender leaved pondweed) and their
hybrid P. x suecicus K. Right were used as model species. First of all because they all
produce asexual propagules and second because the studied hybrid complex is subjected
to variation in the same potential selective forces.
P. pectinatus is a clonal aquatic macrophyte with a pseudo-annual life cycle (Fig. 1).
During the summer side shoots are produced along the rhizome and sexual seeds are
formed in inflorescences produced in the axils of (side) shoots. In temperate regions,
extensive asexual reproduction takes place towards the end of the summer through the
production of subterranean propagules (tubers) at side axes along the rhizome. In
autumn, vegetative plant material dies off leaving the tubers separated from one another
in the substrate to hibernate through the winter. In spring the tubers sprout and seeds
may germinate, restarting the pseudo-annual life cycle. Hence, individual plants (ramets)
are annual but the clones (genets) may become much older. Some populations may also
produce aboveground asexual propagules in the shoot axils (turions); however,
reproduction via tubers is clearly the most common mode of perennation (Van Wijk
1989). Sexual reproduction through seeds is assumed to contribute only little to local
yearly recruitment (Van Wijk 1989). Instead, seeds are more likely to play a role in
population re-establishment after perturbations or in colonisation of new wetlands
following endozoochorous, long distance dispersal by waterfowl (Charalambidou &
Santamaria 2002). In warmer climates (e.g. Mediterranean, semiarid, Yeo 1965;
Santamaría et al. 2003), P. pectinatus may also exhibit a perennial life cycle: shoots and
rhizomes do not senesce in autumn but survive throughout the winter, and none or a few
tubers are produced (Santamaría et al. 2003). P. pectinatus has a cosmopolitan
distribution ranging from the tropics to the subarctic (Casper & Krausch 1980; Wiegleb
& Kaplan 1998). Towards the north its distribution overlaps with that of two closely
related species, P. vaginatus and P. filiformis, which all belong to the subgenus Colegeton.
These species are known to hybridise. P. pectinatus hybridises with P. vaginatus,
resulting in the hybrid P. x botnicus and with P. filiformis, resulting in P. x suecicus
(Preston 1995). The hybrids are believed to be sterile nevertheless they can form
16
General introduction
persistent populations due to clonal growth and asexual reproduction of tubers. P.
filiformis and P. vaginatus both have circumboreal distributions (Casper & Krausch
1980; Hultén & Fries 1986; Wiegleb & Kaplan 1998) but they occupy contrasting
habitats: P. filiformis occurs in shallow areas while P. vaginatus occurs in deep water
(Casper & Krausch 1980; Elven & Johanson 1984; King et al. 2001).
Figure 1 Pseudo-annual life cycle of Potamogeton pectinatus, here starting in winter. Dashed
circles represent the subset of ramet(s) depicted in the immediate picture to the right, or in the case
of the last picture those depicted in the first picture, which describes the situation in the following
season.
P. pectinatus is subjected to herbivory and propagule predation by several species of
waterfowl. During summer, coots (Fulicia atra), ducks (Anas spp.), and mute swans
(Cygnus olor) forage upon its shoots and seeds (Sondergaard et al. 1996). Losses to these
herbivores are generally moderate (Santamaría 2002). However, during autumn or early
spring, large numbers of migratory Bewick’s swans (Cygnus columbianus bewickii) forage
extensively upon the starch-rich tubers (Beekman et al. 1991; Nolet & Drent 1998; Nolet
et al. 2001), depleting tuber stocks by 40-50 % (Nolet et al. 2001; Santamaría &
Rodríguez-Gironés 2002). P. filiformis and P. x suecicus are also likely to be subjected to
tuber predation yet it may affect them differently. Bewick’s swans breed in the Pechora
Delta, northern Russia and overwinter in western Europe. Before they start their autumn
migration from the north, they leave their breeding grounds in the tundra and move in
large flocks to the dense beds of Potamogeton where they forage on the tubers. At the
stopover sites during migration and upon arrival at the wintering grounds they also
forage upon tubers. Bewick’s swans predate on tubers by trampling the substrate loose
with their feet and subsequently sieving them out with their bill (Fig. 2). This behaviour
results in large pits in the substrate (diameter of 1 metre) throughout Potamogeton fields.
17
Chapter 1
Figure 2 Schematic representation of tuber predation by Bewick’s swans. The dashed line indicates
a hypothetical depth threshold, underneath which tuber predation does not occur. Note that tuber
and swan sizes are not proportional.
The pondweed community studied in this thesis consisting of P. pectinatus, P. filiformis
and their hybrid, P. x suesicus was located in the Pechora Delta. Not much was known
about the specific study area beforehand, besides that variation occurred in water depth
and substrate, and that pondweeds were present which were subjected to foraging
Bewick’s swans. The population of P. pectinatus studied in this thesis at the ‘population’
level was situated in Lake Lauwersmeer, the Netherlands and occupied two shores
varying in substrate type. In this study area detailed information was available on abiotic
and biotic conditions in the field (Nolet et al. 2001; Santamaría & Rodríguez-Gironés
2002). Moreover, Santamaría and Rodríguez-Gironés (2002) revealed a spatial pattern in
this population: clones originating from the sandy shore produced larger tubers than
clones originating from the clay-rich shore when grown under common-garden
conditions. Tuber number, on the other hand, showed an opposite response, revealing a
trade-off between size and number. Besides variation in substrate type, both water-depth
and tuber predation by Bewick’s swans also varied within the lake (Nolet et al. 2001).
Moreover, Bewick’s swans depleted tuber bank biomass more in shallow water and sandy
areas than in deep water and clay-rich areas (Nolet et al. 2001). This was the result of
18
General introduction
a.
Deep
Shallow
Sandy
Clay-rich
b.
Figure 3 Schematic representation of the effect of tuber size on sprout survival (a) in different
substrate types, and (b) at different tuber burial depths (based on Santamaría & Rodríguez-Gironés
2002).
higher energetic costs related to foraging in substrate with higher silt content (i.e. clayrich). Considering the severity of tuber predation and the manner in which it takes place,
deep burial of tubers could be a strategy of avoidance of predation by escape in areas
with high predation pressure (Saltz & Ward 2000). Santamaría and Rodríguez-Gironés
(2002) indeed suggested this since they found that tuber mortality due to predation by
Bewick’s swans decreased from 100% to 55 % with increasing burial depth in Lake
Lauwersmeer. However, they also revealed that tuber emergence was negatively affected
by burial depth. In addition, tuber size and clay content of the substrate both affected
tuber emergence positively. Thus tubers need to be larger to successfully sprout from
deeper burial depths or from sandier substrate (Fig. 3). These results suggest that local
adaptation may be responsible for the spatial structure in this population of P. pectinatus:
large tuber size accompanied by deep burial may be an adaptation to high predation
pressure, while small tuber sizes in greater numbers may be adaptive to low predation
pressure in shallow clay-rich areas where emergence survival is high. However, the
19
Chapter 1
relationships so far only present a fragmented picture of how habitat quality (substrate
and water-depth) and predation risks (selective foraging) by Bewick’s swans could
interact to produce the indicated pattern of fennel pondweed tubers across a habitat
gradient in the Lauwersmeer. A second possible explanation remained open: restricted
gene flow between the two subpopulations respectively occupying the sandy and clayrich sites may have resulted in founder effects or genetic drift leading to non-adaptive
genetic differentiation. Moreover, whether tuber size has a genetic basis was not yet
known and therefore a third explanation of the tuber size pattern in the population could
also still be applicable, namely it could solely be the result of differences in maternal
environment.
Outline of the thesis
To resolve which factors determined the spatial tuber-size pattern found in the P.
pectinatus population of Lake Lauwersmeer, first the presence of genotypic diversity,
genetic variation and gene flow between individuals occurring on the different substrate
types needed to be analysed. If gene flow was high population genetic differentiation due
to random factors (i.e. founder effects or genetic drift) could be ruled out. Then if clonal
diversity occurred, the possibility of natural selection structuring the population though
variation in propagule predation and/or substrate type could be analysed. Therefore the
prerequisites for natural selection needed to be addressed: (1) does tuber size have a
heritable component, (2) is there variation of the heritable trait within the population,
and (3) are there fitness consequences related to this variation. The latter had been
partially resolved since burial of large tubers at a deep depth seemed to enhance fitness in
areas with high predation (Santamaría & Rodríguez-Gironés 2002). The remaining part
was how tuber provisioning and consequently plant fitness were affected by substrate
type followed by comparing whether predation pressure (which is correlated to substrate
type) and substrate type have opposing or similar directions of size selection. Besides the
three prerequisites more knowledge was required of the interaction between genetic and
maternal non-genetic effects on tubers size provisioning to gain insight in its potential
effect on the pace of selection of differential adaptive tuber sizes. In the mean time, the
effect of substrate had also been analysed in the light of whether the pattern found in the
field was entirely the result of environmental effects (i.e. no genetic basis for the pattern).
After the above had been studied and knowledge of the tuber size regulation had been
gained the study of the pondweed community structure could be addressed. Different
tuber size strategies or other adaptations to different ecological conditions among taxa
may play a role in structuring the hybrid complex. Alternatively, genetic incompatibility
might have resulted in reduced fitness of the hybrid, thereby affecting its abundance.
20
General introduction
The specific topics addressed in the next chapters are as follows: in Chapter 2, we
analysed clonal diversity and genetic structure in a population of P. pectinatus. The role
of clonal growth and restricted gene flow as determinants of population structure was
also analysed. Furthermore, we aimed at quantifying the effect of spatial variation in the
ecological factors, namely water depth, substrate type and tuber predation by Bewick’s
Swans on both clonal and genetic diversity. In Chapter 3, we tested whether tuber size,
the character of potential importance for local adaptation to abiotic conditions and
propagule predation, had a heritable component and whether the latter involved
correlated changes in tuber burial depth. With a population model, the performance of
plants with contrasting propagule provisioning strategies was investigated under varying
combinations of swan predation pressure and substrate type. In Chapter 4, we analysed
whether local adaptation to contrasting substrate types had taken place within the study
population. Particular attention was paid to the role of genetically determined tuber size.
Chapter 5 addresses the proximate regulation of tuber size and its evolutionary
implications. Both genetic and maternal non-genetic effects were analysed, as well as
their interaction. In the final study, Chapter 6, the scope was broadened to a higher
taxonomic level, and the distribution of a hybrid complex (P. pectinatus, P. filiformis and
P. x suecicus) was studied in northern Russia, where the taxa co-occur. We described a
zonation of the taxa across a water-depth gradient and analysed whether it was related to
abiotic factors (substrate and irradiance) or to biotic factors (tuber predation by Bewick’s
swans). Finally, in Chapter 7 the results presented in this thesis are summarised and
discussed.
References
Antonovics, J. & Schmitt, J. (1986) Paternal and maternal effects on propagule size in
Anthoxanthum odoratum. Oecologia 69: 277-282.
Banovetz, S.J. & Scheiner, S.M. (1994) The effects of seed mass on the seed ecology of Coreopsis
lanceolata. American Midland Naturalist 131: 65-74.
Barrat-Segretain, M.H., Bornette, G., & Hering-Vilas-Boas, A. (1998) Comparative abilities of
vegetative regeneration among aquatic plants growing in disturbed habitats. Aquatic
Botany 60: 201-211.
Beekman, J.H., van Eerden, M.R., & Dirksen, S. (1991) Bewick's Swans Cygnus columbianus
bewickii utilising the changing resource of Potamogeton pectinatus during autumn in the
Netherlands. Wildfowl Supplement 1: 238-248.
Casper, S.J. & Krausch, H.D. (1980) Pteridophyta und Anthophyta. Fischer, Stuttgart.
21
Chapter 1
Castro, J. (1999) Seed mass versus seedling performance in Scots pine: a maternally dependent
trait. New Phytologist 144: 153-161.
Ceplitis, A. (2001) Genetic and environmental factors affecting reproductive variation in Allium
vineale. Journal of Evolutionary Biology 14: 721-730.
Chacon, P. & Bustamante, R.O. (2001) The effects of seed size and pericarp on seedling
recruitment and biomass in Cryptocarya alba (Lauraceae) under two contrasting moisture
regimes. Plant Ecology 152: 137-144.
Charalambidou, I. & Santamaria, L. (2002) Waterbirds as endozoochorous dispersers of aquatic
organisms: a review of experimental evidence. Acta Oecologica-International Journal of
Ecology 23: 165-176.
Coffey, K., Benkman, C.W., & Milligan, B.G. (1999) The adaptive significance of spines on pine
cones. Ecology 80: 1221-1229.
Donaldson, J.S. (1993) Mast-seeding in the cycad genus Encephalartos: a test of the predator
satiation hypothesis. Oecologia 94: 262-271.
Elven, R. & Johanson, V. (1984) Sliretjønnaks - Potamogenton vaginatus - ny for Norge. Blyttia 42:
39-43.
Endler, J.A. (1986) Natural selection in the wild. Princeton University Press, Princeton.
Eriksson, O. (1999) Seed size variation and its effect on germination and seedling performance in
the clonal herb Convallaria majalis. Acta Oecologica 20: 61-66.
Eriksson, O. & Jerling, L. (1990) Hierarchical selection and risk spreading in clonal plants. In:
Clonal growth in plants: regulation and function (eds J. van Groenendael & H. de Kroon),
pp. 79-94. SPB Academic Publishers, The Hague.
Falconer, D.S. & Mackay, T.F.C. (1996) Introduction to quantitative genetics. Fourth edn.
Longman, Essex, UK.
Fenner, M. & Kitajima, K. (1999) Seed and seedling ecology. In: Handbook of functional plant
ecology (eds F.I. Pugnaire & F. Valladares), pp. 589-621. Marcel Dekker, Inc., New York.
Galen, C., Shore, J.S., & Deyoe, H. (1991) Ecotypic divergence in Alpine Polemonium viscosum:
genetic structure, quantitative variation, and local adaptation. Evolution 45: 1218-1228.
Geritz, S.A.H. (1995) Evolutionarily stable seed plymorphism and small-scale spatial variation in
seedling density. American Naturalist 146: 685-707.
Guimaraes, P.R., Jose, J., Galetti, M., & Trigo, J.R. (2003) Quinolizidine alkaloids in Ormosia
arborea seeds inhibit predation but not hoarding by agoutis (Dasyprocta leporina). Journal
of Chemical Ecology 29: 1065-1072.
Hamrick, J.L. & Godt, M.J.W. (1989) Allozyme diversity in plant species. In: Plant population
genetics breeding and genetic variation in plants (eds A.H.D. Brown, M.T. Clegg, A.L.
Kahler & B.S. Weir), pp. 43-63. Sinauer, Sunderland.
Hamrick, J.L. & Godt, M.J.W. (1996) Effects of life history traits on genetic diversity in plant
species. Philosophical Transactions of the Royal Society of London Series B-Biological
Sciences 351: 1291-1298.
22
General introduction
Hulme, P.E. & Benkman, C.W. (2002) Granivory. In: Plant - animal interactions: an evolutionary
approach (eds C.M. Herrera & O. Pellmyr), pp. 132-154. Blackwell Science Ltd, Cornwall.
Hultén, E. & Fries, M. (1986) Atlas of north European plants north of the Tropic of Cancer. Koeltz
Scientific Books, Königstein.
Jakobsson, A. & Eriksson, O. (2000) A comparative study of seed number, seed size, seedling size
and recruitment in grassland plants. Oikos 88: 494-502.
Janzen, D.H. (1969) Seed-eaters versus seed size, number, toxicity and dispersal. Evolution 23: 123.
Janzen, D.H. (1970) Herbivores and the number of tree species in tropical forests. American
Naturalist 104: 501-528.
Joshi, J., Schmid, B., Caldeira, M.C., Dimitrakopoulos, P.G., Good, J., Harris, R., Hector, A., HussDanell, K., Jumpponen, A., Minns, A., Mulder, C.P.H., Pereira, J.S., Prinz, A., SchererLorenzen, M., Siamantziouras, A.-S.D., Terry, A.C., Troumbis, A.Y., & Lawton, J.H. (2001)
Local adaptation enhances performance of common plant species. Ecology Letters 4: 536544.
King, R.A., Gornall, R.J., Preston, C.D., & Croft, J.M. (2001) Molecular confirmation of
Potamogeton x bottnicus (P. pectinatus x P. vaginatus, Potamogetonaceae) in Britain.
Botanical Journal of the Linnean Society 135: 67-70.
Klimeš, L., Klimešová, J., Hendriks, R., & van Groenendael, J. (1997) Clonal plant architecture: a
comparative analysis of form and function. In: The ecology and evolution of clonal plants
(eds H. de Kroon & J. van Groenendael), pp. 1-29. Backhuys Publishers, Leiden, the
Netherlands.
Krebs, C.J. (1972) Ecology: The experimental analysis of distribution and abundance. Harper and
Row, New York.
Linhart, Y.B. & Grant, M.C. (1996) Evolutionary significance of local genetic differentiation in
plants. Annual Review of Ecology and Systematics 27: 237-277.
Lower, S.S., Kirshenbaum, S., & Orians, C.M. (2003) Preference and performance of a willowfeeding leaf beetle: soil nutrient and flooding effects on host quality. Oecologia 136: 402411.
Morse, D.H. & Schmitt (1985) Propagule size, dispersal ability, and seedling performance in
Asclepias syriaca. Oecologia 67: 372-379.
Nagy, E.S. & Rice, K.J. (1997) Local adaptation in two subspecies of an annual plant: Implications
for migration and gene flow. Evolution 51: 1079-1089.
Nelson, D.M. & Johnson, C.D. (1983) Stabilizing selection on seed size in Astragalus
(Leguminosae) due to differential predation and differential germination. Journal of
Kansas Entomological Society 56: 169-174.
Nolet, B.A. & Drent, R.H. (1998) Bewick's Swans refuelling on pondweed tubers in the Dvina Bay
(White Sea) during their spring migration: first come, first served. Journal of Avian Biology
29: 574-581.
23
Chapter 1
Nolet, B.A., Langevoord, O., Bevan, R.M., Engelaar, K.R., Klaassen, M., Mulder, R.J.W., & Van
Dijk, S. (2001) Spatial variation in tuber depletion by swans explained by differences in net
intake rates. Ecology 82: 1655-1667.
Pan, J.J. & Price, J.S. (2001) Fitness and evolution in clonal plants: the impact of clonal growth.
Evolutionary Ecology 15: 583-600.
Paz, H. & Martinez-Ramos, M. (2003) Seed mass and seedling performance within eight species of
Psychotria (Rubiaceae). Ecology 84: 439-450.
Pilon, J. & Santamaría, L. (2002) Clonal variation in morphological and physiological responses to
irradiance and photoperiod for the aquatic angiosperm Potamogeton pectinatus. Journal of
Ecology 90: 859-870.
Prati, D. & Schmid, B. (2000) Genetic differentiation of life-history traits within populations of the
clonal plant Ranunculus reptans. Oikos 90: 442-456.
Preston, C.D. (1995) Pondweeds of Great Britain and Ireland. Botanical Society of the British Isles,
London.
Rees, M. & Westoby, M. (1997) Game-theoretical evolution of seed mass in multi-species
ecological models. Oikos 78: 116-126.
Roach, D.A. & Wulff, R.D. (1987) Maternal effects in plants. Annual Review of Ecology and
Systematics 18: 209-235.
Rodgerson, L. (1998) Mechanical defense in seeds adapted for ant dispersal. Ecology 79: 1669-1677.
Rodríguez-Gironés, M.A., Sandsten, H., & Santamaría, L. (2003) Asymmetric competition and the
evolution of propagule size. Journal of Ecology 91: 554-562.
Saltz, D. & Ward, D. (2000) Responding to a three-pronged attack: desert lilies subject to herbivory
by dorcas gazelles. Plant Ecology 148: 127-138.
Santamaría, L. (2002) Selective waterfowl herbivory affects species dominance in a submerged
plant community. Archiv Fur Hydrobiologie 153: 353-365.
Santamaría, L. & Rodríguez-Gironés, M.A. (2002) Hiding from swans: optimal burial depth of sago
pondweed tubers foraged by Bewick's swans. Journal of Ecology 90: 303-315.
Santamaría, L., Figuerola, J., Pilon, J.J., Mjelde, M., Green, A.J., De Boer, T., King, R.A., & Gornall,
R.J. (2003) Plant performance across latitude: the role of plasticity and local adaptation in
an aquatic plant. Ecology 84: 2454-2461.
Siemens, D.H., Johnson, C.D., & Ribardo, K.J. (1992) Alternative seed defense-mechanisms in
congeneric plants. Ecology 73: 2152-2166.
Slatkin, M. (1985) Geneflow in natural populations. Annual Review of Ecology and Systematics 16:
393-430.
Sondergaard, M., Bruun, L., Lauridsen, T., Jeppesen, E., & Madsen, T.V. (1996) The impact of
grazing waterfowl on submerged macrophytes: In situ experiments in a shallow eutrophic
lake. Aquatic Botany 53: 73-84.
Sork, V.L., Stowe, K.A., & Hochwender, C. (1993) Evidence for local adaptation in closely adjacent
subpopulations of northern red oak (Quercus rubra L) expressed as resistance to leaf
herbivores. American Naturalist 142: 928-936.
24
General introduction
Stuefer, J.F. & Huber, H. (1999) The role of stolon internodes for ramet survival after clone
fragmentation in Potentilla anserine. Ecology Letters 2: 135-139.
Stuefer, J.F., van Hulzen, H., & During, H.J. (2002) A genotypic trade-off between the number and
size of clonal offspring in the stoloniferous herb Potentilla reptans. Journal of Evolutionary
Biology 15: 880-884.
Tuomi, J. & Vuorisalo, T. (1989) Hierarchical selection in modular organisms. Trends in Ecology &
Evolution 4: 209-213.
Tutin, C.E.G., Parnell, R.J., & White, F. (1996) Protecting seeds from primates: Examples from
Diospyros spp in the Lope reserve, Gabon. Journal of Tropical Ecology 12: 371-384.
Van Baarlen, P., Verduijn, M., & van Dijk, P.J. (1999) What can we learn from natural apomicts?
Trends in Plant Science 4: 43-44.
Van Groenendael, J., Klimeš, L., Klimešová, J., & Hendriks, R.J.J. (1997) Comparative ecology of
clonal plants. In: Plant life histories: ecology, phylogeny, and evolution (eds J. Silvertown, M.
Franco & J.L. Harper), pp. 191-209. University Press, Cambridge.
Van Groenendael, J.M. & Habekotté, B. (1988) Cyperus esculentus L. biology, population
dynamics, and possibilities to control this neophyte. Zeitschrift für PflanzenKrankheiten,
PflanzenPathologie und PflanzenSchutz Sonderheft XI: 61-69.
Van Kleunen, M. & Fischer, M. (2003) Effects of four generations of density-dependent selection
on life history traits and their plasticity in a clonally propagated plant. Journal of
Evolutionary Biology 16: 474-484.
Van Wijk, R.J. (1989) Ecological studies on Potamogeton pectinatus L .3. Reproductive strategies
and germination ecology. Aquatic Botany 33: 271-299.
Verburg, R.W. & During, H.J. (1998) Vegetative propagation and sexual reproduction in the
woodland understorey pseudo-annual Circaea lutetiana L. Plant Ecology 134: 211-224.
Wiegleb, G. & Kaplan, Z. (1998) An account of the species of Potamogeton L. (Potamogetonaceae).
Folia Geobotanica 33: 241-316.
Yeo, R.R. (1965) Life history of sago pondweed. Weeds 13: 314-321.
25
Chapter 2
Clonal diversity and structure within a population of the
pondweed Potamogeton pectinatus foraged by Bewick’s swans1
Abstract
Clonal diversity within plant populations is affected by factors that influence genet
(clone) survival and seed recruitment, such as resource availability, disturbance, seed
dispersal mechanism, propagule predation and the age of the population. Here we
studied a population of Potamogeton pectinatus, a pseudo-annual aquatic macrophyte.
Within populations reproduction appears to be mainly asexually through subterranean
propagules (tubers), while recruitment via seeds is believed to be relatively unimportant.
RAPD markers were used to analyse clonal diversity and genetic variation within the
population. Ninety-seven genets were identified among 128 samples taken from eight
plots. The proportion of distinguishable genets (0.76) and Simpson's diversity index
(0.99) exhibited high levels of clonal diversity compared to other clonal plants.
According to an analysis of molecular variance (AMOVA) most genetic variation
occurred between individuals within plots (93-97%) rather than between plots (8-3%).
These results imply that sexual reproduction plays an unexpectedly important role
within the population. Nevertheless, autocorrelation statistics revealed a spatial genetic
structure resulting from clonal growth. In contrast to genetic variation, clonal diversity
was affected by several ecological factors. Water depth and silt content had direct
negative effects on clonal diversity. Tuber predation by Bewick’s swans had an
unexpected indirect negative effect on clonal diversity through reducing the tuber-bank
biomass in spring, which on its turn was positively correlated to clonal diversity. The
disturbance by swans therefore did not enhance seed recruitment and thus clonal
diversity, on the contrary heavily foraged areas are probably more prone to stochastic
loss of genets leading to reduced clonal diversity.
1
H.H. Hangelbroek, N.J. Ouborg, L. Santamaría & K. Schwenk (2002) Molecular Ecology 11: 2137-
2150
Chapter 2
Introduction
In plants genetic diversity and its spatial distribution are influenced by a variety of life
history traits, such as life form, breeding system and seed dispersal mechanism (Hamrick
& Godt 1989, 1996). The mode of reproduction (sexual vs. asexual) is expected to have
an important effect, since sexual reproduction is accompanied by genetic recombination
and asexual reproduction is not. Genetic recombination leads to a continuous emergence
of new genotypes (clones) and therefore may buffer the loss of clonal diversity and
genetic variation from the population, caused by natural selection and genetic drift. Such
a buffering is absent from predominately asexual clonal organisms and should, in theory
at least, result in low clonal diversity and genetic variation. However, several reviews
show that clonal plant populations often have high clonal diversity (Ellstrand & Roose
1987; Widén et al. 1994) and similar levels of genetic variation as populations of
nonclonal plant species (Hamrick & Godt 1989). The mode of reproduction however is
not a discrete character but is a life-history trait that varies across the plant kingdom
from exclusively sexual to almost exclusively asexual, while many plant species exhibit a
mix of both. The balance between them may influence the level of diversity in clonal
plant populations as well as the spatial distribution pattern of genets within a population.
Eriksson (1989; 1993) and Eriksson & Fröborg (1996) argued that distinct patterns of
clonal distribution may be connected to seedling recruitment patterns. In populations
where seedling recruitment only occurs during establishment of the population (initial
seedling recruitment: ISR), populations are expected to consist of a few large genets.
When seedling recruitment continues to take place after establishment of a population
(repeated seedling recruitment: RSR), a pattern of many small genets is expected.
Through computer simulation models Soane & Watkinson (1979) and Watkinson &
Powell (1993) have shown that even low levels of repeated seedling recruitment may
have major effects on the amount of clonal diversity within populations. This suggests
that low rates of repeated seedling recruitment are enough to cause large alterations on
patterns set by ISR and increasing the frequency of the RSR may cause comparatively less
change.
The population genetic structure (i.e. at the level of alleles) may also be influenced
by mode of reproduction. Clonal growth often leads to clusters of ramets (= potentially
independent units of a genet or clone) resulting in high genetic similarity at short
distances while genetic distances between ramets located further apart are expected to be
larger, because they are likely to originate from different genets. This pattern of
correlated genetic- and geographical distances is not expected with sexually reproducing
species unless there is limited gene flow through pollen or seeds (isolation by distance).
28
Clonal diversity in Potamogeton pectinatus
Besides life-history traits, other factors that influence local genetic variation,
clonal diversity and their spatial structure, include the number of founding individuals,
age of the population and several local ecological factors. For example habitat
heterogeneity is often regarded to maintain diversity through diversifying selection
(Solbrig & Simpson 1974; Burdon 1980) in contrast to habitat homogeneity, which
would lead subsequently to a decrease in diversity through directional or stabilising
selection. Resource availability may also affect diversity by influencing the competitive
environment experienced by the plants (Nicotra & Rodenhouse 1995). Furthermore,
disturbance caused by a variety of factors (e.g. herbivory, mechanical perturbation due to
wind or wave action, fire or droughts) may lead to population bottlenecks, which
intensify effects of genetic drift (Glenn et al. 1999). On the other hand, disturbances may
increase clonal diversity by creating gaps in dense vegetation where seedlings may have
an enhanced chance to establish, a process analogous to opening up of the canopy in
forests (Gray & Spies 1996).
Potamogeton pectinatus (fennel pondweed) is a clonal submerged aquatic
macrophyte. Asexual reproduction is thought to be responsible for short-term
recruitment within populations, while sexual reproduction would be more important for
long distance dispersal and long-term survival (Van Wijk 1989). Predation pressure
upon the asexual propagules is known to be common and to vary within populations of
this clonal plant (Nolet et al. 2001). This may influence clonal diversity and genetic
variation. In this study we will use RAPD markers to analyse clonal diversity and genetic
variation within a population of Potamogeton pectinatus. We will address the following
topics: first, do the level and the pattern of within-population clonal diversity resemble
the initial seedling recruitment (ISR) or the repeated seedling recruitment (RSR) mode?
Second, does this population of P. pectinatus have a spatial genetic structure? If this is the
case, is this the result of clonal reproduction or alternatively of limited gene flow? Third,
do ecological factors, in particular variation in propagule predation pressure by Bewick’s
swans, have an influence on the spatial pattern of clonal diversity and genetic variation
within this population?
Material and methods
Species
P. pectinatus is a submerged aquatic macrophyte, which forms dense beds of vegetation.
Extensive asexual reproduction takes place through subterraneous propagules formed at
side axes of the rhizomes (Van Wijk 1989). P. pectinatus has a pseudo-annual life form,
29
Chapter 2
which means that every year at the end of autumn the plants die off leaving the asexual
propagules (tubers) separated from one another in the sediment to hibernate. In spring
new plants arise from these tubers. A genet may thus become old but consists of annual
ramets. Seeds are produced during summer and a significant proportion may geminate
in spring (Teltscherová & Hejný 1973), yet successful establishment within a population
has hardly been observed and is probably scarce (Van Wijk 1988, 1989). This may be
because tubers have a much higher amount of stored energy than seeds and consequently
may grow faster and out-compete seedlings for light (Spencer 1987). The produced seeds
may be the result of outcrossing or selfing, since P. pectinatus is self-compatible
(Hollingsworth et al. 1996, pers. obs.). However, nothing is known about the degree of
selfing vs. outcrossing or whether selfed seeds are actually viable. P. pectinatus is an
important food source for many waterfowl. Different parts of the plant are grazed upon
by different species e.g. shoots and seeds by mute swans, coots and ducks, and tubers by
Bewick’s swans (Cygnus columbianus bewickii). Populations of P. pectinatus that are
located along the migratory route of Bewick’s swans are often subjected to high levels of
tuber predation. In the course of foraging for tubers the swans dig large pits (diameter
1m) in the sediment.
Study area
The study area is located in Lake Lauwersmeer, which used to be an estuary but which in
1969 was separated from the sea and turned gradually into a fresh water lake. Along with
the change in salinity came a shift in vegetation from marine to freshwater species. P.
pectinatus requires fresh to brackish water and therefore was able to establish itself soon
after the separation. In 1972 the lake had already been colonized (Joenje 1978).
Nowadays P. pectinatus forms dense beds of monospecific vegetation along the shallower
parts of the lake. Every autumn, hundreds of Bewick’s swans visit Lake Lauwersmeer and
feed heavily upon the tubers. In 1973 the first Bewick’s swans were reported foraging on
P. pectinatus tubers in Lake Lauwersmeer (Prop & van Eerden 1981) and by 1980 the
beds of P. pectinatus were intensively foraged upon (Beekman et al. 1991). At the site
studied here peaks of, respectively, 580, 974 and 944 simultaneously foraging swans were
observed on an area of approximately 0.1 km2 in the two years preceding this study and
the study year itself (Nolet et al. 2001). The foraging pressure and the resulting tuber
mortality in the population on this site varied in relation to local abiotic conditions
(Nolet et al. 2001). In particular, shallow water and sandy sediment facilitate foraging in
contrast to deep water and clay rich sediment.
30
Clonal diversity in Potamogeton pectinatus
Sampling design
The selected population consists of two beds of P. pectinatus separated by a gully too
deep for plants to grow (Fig.1). In November 1997 eight plots were chosen, four in each
bed separated approximately 200 metres from one another. At each plot a subsample of
16 sampling points was selected from a regular grid of points placed every three metres.
This distance was selected to minimise the chance of collecting tubers originating from
the same ramet as rhizomes may become several metres long. Approximately 30-cm-
Lauwersmeer
Babbelaar
N1
N2
N3
S3
N4
S2
S4
S1
P. pectinatus bed
land
0
100m
Figure 1 Location of the studied population of Potamogeton pectinatus in the Babbelaar, a branch
of Lake Lauwersmeer (the Netherlands). Babbelaar: dark grey: land; light grey: dense beds of P.
pectinatus; white: deep-water gully; black dots: sampling plots holding 16 random samples. N1-N4:
northern bed, S1-S4: southern bed.
deep sediment cores (diameter 10 cm) were taken from the sampling points and sieved to
collect the tubers. From these tubers one tuber per core was randomly chosen for this
study. After the collection, the 128 selected tubers were stratified at 4 ºC, sprouted at 20
ºC and the resulting plants were grown in a climate chamber at 20 ºC (16L : 8D). To
31
Chapter 2
reduce the chance of contamination with foreign DNA during DNA extraction
conditions were made as unfavourable as possible for periphyton to grow on the plants.
Therefore the sediment mixture the plants were growing in (sand : clay = 3 : 1) was
covered with washed aquarium sand to reduce nutrients leaking into the water and the
water was kept in circulation. After a few weeks of growth three to six young leaves were
collected and cleaned thoroughly whereupon DNA was extracted directly or following
leaf-sample storage at -80 ºC.
Laboratory procedures
DNA extraction. DNA was extracted according to the instructions of Gentra Systems
Puregene DNA isolation kit with an additional PCI (phenol:chloroform:isoamyl alcohol,
25:24:1) cleaning step when using frozen leaves. DNA quality and quantity was checked
visually on a 1.2% agarose 0.5x TBE gel. The quantity was estimated by comparing the
intensity of the bands with bands of known DNA concentration of the High DNA
MassTM Ladder (Gibco-BRL, Gaithersburg, MD, USA).
RAPD analysis (Williams et al. 1990). Amplification reactions were carried out in a total
volume of 12.5 µL containing 1x amplification buffer (Gibco-BRL), 2 mM MgCl2, 400
µg/mL bovine serum albumin, 200 µM dNTPs, 4 pmol primer, 0.3 U Taq polymerase
(Gibco-BRL), 1-5 ng DNA, and were overlayed with 15 µL mineral oil. Eighty primers
had been screened (Operon primers sets B, C, D, G) from which 7 primers were chosen
(Table 1). Marker bands were selected based on 100% reproducibility between
independent PCRs (polymerase chain reaction) and independent DNA extractions.
These independent DNA extractions were extractions carried out on different occasions
from different leaves of the same plant and from leaves of plants grown from different
tubers of the same genet (i.e. different ramets of the same genet). Furthermore it was
checked that the marker bands could be amplified from DNA extractions from both
fresh and frozen leaves. In addition only strong and polymorphic bands (> 6%) between
500 and 1600 bp were used. PCRs were performed in a Hybaid OmniGene thermal cycler
programmed for one cycle of 2.5 min at 85 ºC followed by 40 cycles of 20 s at 92 ºC, 15 s
at 38 ºC, 1 min at 72 ºC. Amplification products were separated electrophoretically on a
1.4% agarose 0.5x TBE gel, stained with ethidium bromide and photographed under UV
light. The sizes of bands were estimated by comparing them with size standards of the
100 base pair ladder (Amersham Biosiences, Little Chalfont, UK). To consider possible
effects of differences in ramping between melting and annealing temperatures (Pérez et
al. 1998) each PCR was done in twofold, differing only in the block of the thermal cycler
used. A marker was scored as present or absent when both PCRs showed identical
32
Clonal diversity in Potamogeton pectinatus
results. The data file containing the scores of the 22 markers for the 128 samples is given
in the Appendix I.
Table 1 Characteristics of 7 primers selected for random amplified polymorphic DNA analysis of
Potamogeton pectinatus. The number of markers selected for the analysis is provided in the last
column (selection criteria see Material and Methods)
Operon
primer code
B05
B08
B20
C07
C09
C19
G06
Total
Total no. of
bands
10
16
9
11
16
15
15
87
Polymorphic
bands
5
9
7
10
13
9
12
65
% bands
polymorphic
50
56
78
91
81
60
80
75
No. of marker
bands
1
5
3
1
3
3
6
22
Data analysis
Clonal diversity. Based on the scored RAPD bands, putative genets were identified and
clonal diversity was measured in two ways. First, the proportion of distinguishable genets
(Ellstrand & Roose 1987) was measured: PD = G / N, where G is the number of genets
and N is the total number of ramets sampled. Second, Simpson's index of diversity
corrected for finite sample size (Pielou 1969) was measured:
D = 1− ∑
ni (ni − 1)
,
N (N − 1)
where ni is the number of ramets with RAPD phenotype i and N is the total number of
ramets sampled. D ranges from 0 where the population is composed of one genet, to 1
where every ramet is a different genet.
Genetic structure. A nested analysis of molecular variance (AMOVA, Excoffier et al.
1992) was performed to partition the total genetic variance among three levels: among
beds, among plots within beds and among individuals within plots (Excoffier 1992-1993,
WINAMOVA version 1.55). The number of permutations for significance testing was set
to 1000 for the null hypothesis of no population structure (random distribution of
33
Chapter 2
individuals). Pairwise genetic distances between individuals were calculated for the
AMOVA using the Euclidean metric of Excoffier et al. (1992),
⎛ n ⎞
E = n⎜1 − 11 ⎟,
n ⎠
⎝
where n is the number of markers and n11 is the number of markers shared by two
individuals. The distance matrix was calculated using the RAPDistance analysis package
of Armstrong et al. (version 1.04, 1995). The AMOVA was performed at the ramet-level,
thus including all samples, as well as at the genet-level where all genets were represented
once. The genet-level was analysed because F-statistics and related techniques were
developed with the assumption of sexual reproduction and a randomly mating
population (McLellan et al. 1997). Ramet-level analysis would thus lead to
pseudoreplication. However, analysis at the genet-level still incorporates the indirect
effects of clonal growth on population structure through a differential amount of seed
production associated to differential clonal growth rates (McLellan et al. 1997).
Analysing genetic variation at both levels may therefore give insight as to whether clonal
growth has an effect on population structure and whether they give the range of possible
genetic variation found (McClintock & Waterway 1993; McLellan et al. 1997; Ivey &
Richards 2001). At the ramet-level all samples were included while at the genet-level one
copy (ramet) of a genet represented the genet. This copy was taken from the plot where it
was most abundant, or when more than one plot had equally high numbers of copies it
was taken at random from one of these plots.
To analyse whether there was a spatial genetic structure within the population as a
result of clonal growth or because of isolation by distance through limited gene flow of
seeds or pollen, spatial autocorrelation statistics were applied at the level of ramets and at
the level of genets (Reusch et al. 1999). Autocorrelation Indices for DNA Analysis, II
(Bertorelle & Barbujani 1995, analogous to Moran's I) were calculated for six
geographical distance classes.
n −1
II =
n
S
(
n∑ ∑ w ij ∑ ( pik − pk ) p jk − pk
i =1 j >i
k =1
n
S
W ∑ ∑ ( pik − pk )
)
,
2
i =1 k =1
where n is the total number of individuals (genets or ramets), W is the number of
pairwise comparisons in the distance class of interest, S represents the number of
markers, pik and pjk are the haplotypes (here 0 or 1) of marker k for the ith and jth
34
Clonal diversity in Potamogeton pectinatus
individual, and the weight wij is 1 if the individuals are from the distance class of interest
and otherwise 0. A random distribution of individuals would be reflected by
autocorrelation indices of 0. The autocorrelation index will have a positive value if the
individuals are more similar than expected from a random distribution and a negative
value if they are less similar than expected. The six geographical distance classes were
created in such a manner as to distribute the number of individuals as equally as possible
across distance classes. The number of permutations for significance testing was set to
1000 under the null hypothesis of no spatial structure (random distribution of
individuals). The analysis was performed using the software package AIDA (Bertorelle &
Barbujani 1996).
Ecological factors influencing diversity. A path analysis was conducted (Sokal & Rohlf
1995), using partial correlation coefficients obtained from a hierarchical set of multiple
regressions (Santamaría & Rodríguez-Gironés 2002), to evaluate which ecological factors
may influence clonal diversity and genetic variation (Statistica 5.5, 1999). Several abiotic
and biotic factors had been measured for each plot during a simultaneous study that
focussed on spatial variation in tuber depletion by Bewick’s swans (Nolet et al. 2001). Of
particular interest were tuber depletion by Bewick’s swans (percentage decrease of the
initial tuber-bank biomass during swan foraging) and tuber-bank biomass in spring,
which was used as a surrogate of population density at the start of the growth season (mg
dw m-2). Furthermore, water-column depth (cm), sediment type (granulometric
composition), and tuber-bank biomass at the beginning of autumn (i.e. previous to swan
foraging; mg dw m-2) were used. The choice of these variables was based upon our
current knowledge of the system, as those variables most probably influence clonal
diversity and subsequently genetic variation either directly or indirectly through their
effect on tuber-bank density in spring. Sediment granulometric composition was
measured as the first axis scores of a principal component analysis using six
granulometric classes (from < 16 µm to 250-< 500 µm), which were highly correlated
with sediment silt fraction (grain size < 63 µm) (Nolet et al. 2001). As a measure for
clonal diversity within a plot, the proportion of distinguishable genets was taken (PD, see
above). As a measure for genetic variation within a plot, the mean square of the genetic
distances between genets (genet-level within a plot) was calculated (molecular variance,
Fisher & Matthies 1998). The Euclidean metric of Excoffier et al. (1992) was used as
genetic distance measure (as above).
Due to the low number of data points (= sampling plots, n = 8), the model has a
relatively low power and a high probability of type II error. In order to increase the
power of the analysis, we decided to increase the significance-level limit (i.e. the
35
Chapter 2
probability of type I error) (Underwood 1997) and will therefore report those
correlations as ‘significant’ where P < 0.05 and as ‘marginally significant’ where P < 0.1.
Results
Clonal diversity
The clonal diversity detected in this population was unusually high. From 128 ramets
sampled 97 different putative genets (i.e. RAPD phenotypes) were found. The proportion
of distinguishable genets (PD) within the whole population was 0.76 and Simpson's
index of diversity (D) was 0.99. The majority of the ramets sampled had a unique RAPD
profile (81), the rest shared RAPD profiles ranging from two to nine copies of a profile
(Fig. 2, Table 2). Most ramets of a particular genet tended to be in each other’s vicinity.
N1
N2
N4
N3
p
l
n
a
p
a
a
o
c
c
a
a
n
g
f
j.
m
e
g
m
f
f
e
o
a a
b
j.
c
i.
k
b
b
k
h
a
l
e
a
g
d
S1
d
h
d
c
S2
S3
i.
b
S4
20m
Figure 2 Spatial distribution of Potamogeton pectinatus genets in a population of Lake
Lauwersmeer (the Netherlands), identified using 22 polymorphic RAPD markers. Connected
circles with corresponding letters represent ramets from the same genet (RAPD phenotypes). Grey
circles without letters represent unique genets. Distances within plots are on proportional scale, for
the exact position of the plots in the population see Fig. 1.
36
Clonal diversity in Potamogeton pectinatus
However, several genets were found in plots separated by hundreds of metres, as for
instance genet d, which occurred in plot S1 and S4 approximately 600 metres apart (Fig.
2). The deep-water gully between the two beds of P. pectinatus did not seem to be a
barrier for genet dispersal, as some ramets of the same genet appeared in both beds at
either side of the gully (genet a, c, l and m, Fig. 2).
Table 2 Number of copies of RAPD phenotypes within a population of Potamogeton pectinatus,
revealed by 22 RAPD markers
Number of RAPD
phenotypes
81
9
4
2
1
Number of
copies (ramets)
1
2
3
4
9
Genetic structure
According to the AMOVA, most of the variance was found between individuals within
plots (93.28 - 97.38%), a small but significant amount between plots (8.15 - 3.43%) and
none between beds (Table 3). The amount of variance and the significance of the
Table 3 Analysis of molecular variance (AMOVA) for a population of Potamogeton pectinatus
based on RAPD data, considered at the ramet level and genet level
d.f.
Variance
component
% of total
variance
Source of variation
Ramet level
Among beds
Among plots within beds
Within plots
P
1
6
120
-0.06
0.32
3.64
-1.43
8.15
93.28
0.726
< 0.001
< 0.001
Genet level
Among beds
Among plots within beds
Among beds
1
6
89
-0.03
0.14
3.87
-0.81
3.43
97.38
0.581
0.016
0.023
37
Chapter 2
variance components between plots decreased as the level of organisation analysed
changed from ramet-level to genet-level, implying a loss in genetic structure. Spatial
autocorrelation statistics showed that at the ramet-level individuals within the smallest
distance class were more similar and that the individuals within the largest distance class
were less similar than would be expected from a random distribution of individuals (Fig.
3). No significant departure from a random distribution was found at the genet-level (P
> 0.05, Fig. 3).
0.09
ramet level
genet level
0.06
**
II
0.03
*
0.00
-0.03
-0.06
-0.09
**
0- 5
0
51-
140
14 1
0
-23
231
- 34
0
341
- 47
0
>4
71
distance class (m)
Figure 3 Correlograms of autocorrelation indices for DNA analysis (AIDA, II) of Potamogeton
pectinatus considered at ramet-level and genet-level. *, P < 0.05; **, P < 0.005.
Ecological factors influencing diversity
Clonal diversity (PD) within a plot varied between plots from 0.63 to 1.00 and genetic
variation (MSD) varied from 3.06 to 4.50. Within-plot genetic variation was not
correlated significantly with clonal diversity (F = 0.0192, P = 0.89, R2 = 0.003), hence they
were considered to provide two independent estimates of population structure. The path
analysis revealed that ecological factors influence clonal diversity (Fig. 4), yet they did
not have a significant effect on genetic variation. Eighty-seven per cent of the variation in
clonal diversity between plots was explained by sediment type, water-column depth, and
tuber-bank biomass in spring. Tuber depletion due to swan predation had no direct
38
Clonal diversity in Potamogeton pectinatus
-0.97**
Silt
content
$
0.73
Tuber-bank
biomass
autumn
39%
Tuber-bank
biomass
spring
37%
Water depth
-0.80*
Predation
pressure
0.93*
Clonal
diversity
87%
-0.71$
56%
-0.91*
Figure 4 Results of a path analysis for the effect of ecological factors on clonal diversity. All tested
relationships are indicated by arrows. Sediment granulometry is described by the first axis of a
PCA, based on 6 granulometric classes (range <16 µm - 500 µm), that was highly correlated with
sediment silt fraction. Water depth is measured in cm, tuber-bank biomass in g dw m-2. Predation
pressure is measured as the percentage tuber-bank depletion in the period between swan arrival
and departure at the population. Clonal diversity refers to the proportion of distinguishable genets
in each sampling plot (PD = no. of genets / no. of ramets). Light grey arrows indicate
nonsignificant effects and black arrows indicate significant effects. Solid arrows indicate positive
correlations and dashed arrows negative correlations. Numbers at the arrows = partial correlation
coefficients and their significance level, $, P < 0.1; *, P < 0.05; **, P < 0.01. Numbers within boxes =
percentage of explained variation (R2adjusted).
effect on clonal diversity but it had an indirect effect through its marginally significant
negative effect on tuber-bank biomass in spring, which on its turn was positively
correlated with clonal diversity. Negative correlations of sediment silt content and water
depth indicated that clonal diversity is higher in sandy and in shallow sites, compared to
more clay rich and deeper sites. Tuber-bank biomass in autumn was not correlated
significantly with tuber-bank biomass in spring (i.e. at the beginning of the next growth
season). The one variable that influenced spring tuber-bank biomass in our path-analysis
model was tuber depletion due to swan predation.
39
Chapter 2
Discussion
RAPD variation
Previous studies using isozymes found little clonal diversity and genetic variation within
populations of P. pectinatus (Van Wijk et al. 1988; Hettiarachchi & Triest 1991;
Hollingsworth et al. 1996). A study using RAPD markers, on the other hand, showed
high levels of clonal diversity and genetic variation among populations and also high
clonal diversity within populations, despite the few samples taken within populations
(Mader et al. 1998). The high levels of within-population genetic variation found here
confirm the general idea that RAPD markers may exhibit higher resolution than isozyme
and allozyme markers (Heun et al. 1994; Fernando & Cass 1996; Ayres & Ryan 1999;
Esselman et al. 1999; Sun et al. 1999; Diaz et al. 2000). Alternatively, the difference
between the results of van Wijk et al. (1988), Hettiarachchi & Triest (1991),
Hollingsworth et al. (1996) and ours may also be the result of exceptional features of the
Babbelaar population (but see Mader et al. 1998). One of these could be the high tuber
predation exerted every autumn by foraging Bewick’s swans (Nolet et al. 2001). The
results of our path analyses however, suggest that this effect is more likely to result in
decreased, rather than increased clonal diversity (Fig. 4, see below) and that it has no
effect on genetic variation. It has been argued that RAPD-markers are specifically
sensitive to technical artefacts, based on e.g. competition between RAPD primer sites
(Halldén et al. 1996; see also Penner et al. 1993), which might lead to overestimation of
genetic and clonal diversity. Most of these problems, however, can be minimized by
carrying out replicate runs and discarding all nonreproducible bands (Hu & Quiros
1991; Weeden et al. 1992), as we have done here. The selection of markers in this study
was conservative: only 22 of the 65 polymorphic bands were chosen. Furthermore, the
number of markers used was not high, which again makes this study somewhat
conservative because the more markers used the higher the probability of artefacts
(Halldén et al. 1996). In addition, it was checked how many genets differed by a single
marker. This was only 0.47% of the genets, i.e. 22 of the 4656 comparisons between
genets; so although we cannot fully rule out the possibility of overestimation of variation,
the observed variation is much higher than expected based on the isozyme studies, an
outcome that seems unlikely to result from methodological biases alone.
Clonal diversity and genetic variation
The level of clonal diversity found within the studied population of P. pectinatus was
considerably higher (Simpson’s diversity index, D = 0.99; proportion distinguishable
genets, PD = 0.76) than those reported within populations of other clonal plant species.
40
Clonal diversity in Potamogeton pectinatus
Reviews by Ellstrand & Roose (1987) and Widén et al. (1994) showed mean diversity
values of multiclonal populations of D = 0.62 (range 0.1 - 1.0) and D = 0.75 (0.13 - 1.0)
and mean PD values (of single population studies) of 0.26 (range 0.01 - 0.68) and 0.32
(0.02 - 0.75), positioning the value for Simpson’s diversity index found here at the high
end of the range while the proportion distinguishable genets exceeded their range. Most
of the studies reviewed by Ellstrand & Roose (1987) and Widén et al. (1994), however,
were allozyme studies, which may account partially for their lower D and PD values.
Studies on clonal diversity within populations of clonal plants using RAPDs, nonetheless,
also show lower diversity values (mean D = 0.74, range 0.35 - 1.00 and mean PD = 0.44,
range 0.00 - 0.94; Table 4) than found here. Of these studies, the study of three Viola
riviniana populations by Auge et al. (2001, Table 4) showed a comparable high
Simpson’s diversity index (mean D = 0.99) and an even higher proportion of
distinguishable genets (PD = 0.93). The authors suggest that this is the result of the high
annual ramet mortality and concurrently the high seedling recruitment they observed in
the field.
Because P. pectinatus is a pseudo-annual, this population has potentially had 25
generations of ramets after establishment of the population in the early seventies. After
this number of generations and considering its extensive clonal growth rate, natural
selection and genetic drift are most likely to have had an effect on the amount of
diversity of the founder population and on its spatial pattern, yet clonal diversity is high
and genets are small. According to Soane & Watkinson (1979) occasional establishment
of seedlings within populations is a powerful mechanism of generating clonal diversity.
Watkinson & Powell (1993) showed through a computer simulation of Ranunculus
repens that in a short period of, e.g. 20 years, low levels of seed recruitment may already
increase clonal diversity. Therefore it seems probable that in this population repeated
seedling recruitment (RSR) occurs, in particular when considering that most genetic
variation was found between individuals within plots (93 - 97%) and only little between
plots (8 - 3%), indicating that successful seed recruitment may not only be sporadic but
may even be frequent in this population. Nevertheless, the high level of diversity may
also be partially maintained through clonal persistence of genets from the founding
population.
Population structure
Even though most of the genetic variation was found between individuals within plots
rather than between plots, the amount of diversification between plots was significant
indicating a small scale spatial population differentiation. The decrease in variation from
41
Chapter 2
Table 4 Studies of clonal diversity within populations (pops) of clonal plants using Random
Amplified Polymorphic DNA (RAPD). D = Simpson's unbiased diversity index (see text); PD =
proportion distinguishable genets (G/N); - cannot be calculated from published data.
number of
D
pops samples average range
PD
average range
Woody plants
Poikilacanthus macranthus1
Vaccinium stamineum2
Vaccinium vitis-idaea3
4
1
2
57-82
99
59-70
0.87
0.84
0.72-0.95
0.83-0.85
0.29
0.68
0.23
0.19-0.42
0.68
0.18-0.27
Herbaceous plants
Calamagrostis porteri4
Carex curvula5
Circaea lutetiana6
Oryza rufipogon7
Rubus saxatilis8
Saxifraga cernua9
Saxifraga cernua10
Viola riviniana11
Yushania niitakayamensis12
4
1
6
5
2
2
7
3
1
10-19
114
25-199
18-35
20-24
46-47
7-12
17-34
51
0.65
0.96
0.85
0.52
0.00
0.99
0.96
0.92-0.99
0.80-0.89
0.35-0.68
0.00
0.99-1.00
0.96
0.36
0.13
0.68
0.73
0.42
0.16
0.10
0.93
0.61
0.10-0.79
0.13
0.30-0.88
0.51-0.94
0.33-0.50
0.13-0.19
0.08-0.14
0.91-0.94
0.61
0.74
0.00-1.00
0.44
0.08-0.94
0.99
0.99
0.76
0.76
Average
Potamogeton pectinatus13
1
128
0.65
1
Bush & Mulcahy (1999); 2Kreher et al.(2000); 3Persson & Gustavsson (2001); 4Esselman et
al.(1999); 5Steinger et al. (1996); 6Verburg et al. 2000)(2000); 7Xie et al.(2001); 8Eriksson & Bremer
(1993); 9Gabrielsen & Brochmann (1998); 10Bauert et al.(1998); 11Auge et al.(2001); 12Hsiao &
Rieseberg (1994); 13this study.
ramet-level to genet-level estimates implies that clonal growth may be responsible for the
observed variation between plots. Indeed, the autocorrelation statistics were only
significant at the ramet-level, indicating that the relationship found between
geographical distance and genetic distance was due to clonal growth and not to limited
gene flow of seeds or pollen. Clonal reproduction resulted in small clusters of ramets
within plots, although several ramets of the same genet were found at neighbouring plots
and some even at distant plots. This could be the result of rhizomatous growth, making it
possible for a genet to cover a long distance throughout time or more probably by
42
Clonal diversity in Potamogeton pectinatus
dispersal of clonal fragments and tubers. The latter could be facilitated by the foraging
behaviour of Bewick’s swans, which dig up tubers that may subsequently ‘escape’
foraging and float away to settle down elsewhere in the population. This also explains the
occurrence of ramets of a single genet at both sides of the deep-water gully that cannot be
crossed by rhizomatous growth. At any rate, the colonization of distant plots by clonal
fragments or tubers is probably related to the low genetic structure found in this clonal
population.
Influence of ecological factors on clonal and genetic structure
In spite of the low number of plots analysed (thus the low number of points in the
analysis, n = 8), several ecological factors were found to influence clonal diversity. Tuber
depletion due to swan predation had an indirect negative effect on clonal diversity
mediated by tuber-bank biomass in spring. This was in contrast to our expectations,
since a patchy reduction of tuber-bank biomass was expected to lead to decreased
competition between plants sprouted from tubers and seedlings, thus enhancing seedling
establishment. However, tuber-bank biomass in spring was positively correlated with
clonal diversity. Recurrent bottlenecks as a consequence of high tuber depletion by swans
probably leads to increased genet mortality and eventually to lower clonal diversity.
Water depth and sediment type both had a direct effect on clonal diversity. A
hypothetical mechanism for these direct effects of abiotic variables includes reduction in
clonal diversity through clonal exclusion at areas with good growth conditions (high clay
content, deeper more stable environment). The contrasting effects of water depth on
clonal diversity, depending on whether it acts directly or indirectly through predation
pressure, illustrates that an ecological factor may act in multiple independent ways. The
lack of significant correlations between tuber-bank biomass in autumn and in spring can
be explained by the equalizing effect of swan predation and emphasises the importance
of swan predation in regulating population density at the beginning of each growth
season.
Contrary to clonal diversity, genetic variation was not affected by the ecological
factors tested. Moreover, clonal diversity and genetic variation were not even correlated,
revealing that they are independent and thus may be affected by different ecological
factors. This is in agreement with Stenström et al. (2001), who found that clonal diversity
and genetic variation of four clonal sedges were independent and affected by different
environmental factors. These results support the idea that clonal diversity does not
necessarily influence genetic variation and clonal plant species can have comparably high
levels of genetic variation (at the genet level), as have nonclonal plant species (Hamrick
& Godt 1989; Stenström et al. 2001).
43
Chapter 2
Acknowledgements
We are grateful to Bart Nolet who shared information on the Babbelaar with us. We would also
like to thank Oscar Langevoord for designing the graphic representations. Furthermore, we wish to
thank Thijs de Boer, Ten Dekkers and Koos Swart for assistance in the field, Harry Korthals for
assistance in the laboratory and Jan van Groenendael, Bart Nolet and two anonymous referees for
their valuable comments on the manuscript. This is publication 3000 of the Netherlands Institute
of Ecology (NIOO-KNAW) and 308 of the Centre for Wetland Ecology.
References
Armstrong, J.S., Gibbs, A.J., Peakall, R., & Weiller, G. (1995) The RAPDistance Package, Version
1.04. http://life.anu.edu.au/molecular/software/rapid.htm.
Auge, H., Neuffer, B., Erlinghagen, F., Grupe, R., & Brandl, R. (2001) Demographic and random
amplified polymorphic DNA analyses reveal high levels of genetic diversity in a clonal
violet. Molecular Ecology 10: 1811-1819.
Ayres, D.R. & Ryan, F.J. (1999) Genetic diversity and structure of the narrow endemic Wyethia
reticulata and its congener W. bolanderi (Asteraceae) using RAPD and allozyme
techniques. American Journal of Botany 86: 344-353.
Bauert, M.R., Kalin, M., Baltisberger, M., & Edwards, P.J. (1998) No genetic variation detected
within isolated relict populations of Saxifraga cernua in the Alps using RAPD markers.
Molecular Ecology 7: 1519-1527.
Beekman, J.H., van Eerden, M.R., & Dirksen, S. (1991) Bewick's Swans Cygnus columbianus
bewickii utilising the changing resource of Potamogeton pectinatus during autumn in the
Netherlands. Wildfowl Supplement 1: 238-248.
Bertorelle, G. & Barbujani, G. (1995) Analysis of DNA diversity by spatial autocorrelation. Genetics
140: 811-819.
Bertorelle, G. & Barbujani, G. (1996) Autocorrelation Indices for DNA Analysis University of
Padova, Italy. http://web.unife.it/progetti/genetica/Giorgio/giorgio_soft.html.
Burdon, J.J. (1980) Intra-specific diversity in a natural population of Trifolium repens. Journal of
Ecology 68: 717-735.
Bush, S.P. & Mulcahy, D.L. (1999) The effects of regeneration by fragmentation upon clonal
diversity in the tropical forest shrub Poikilacanthus macranthus: random amplified
polymorphic DNA (RAPD) results. Molecular Ecology 8: 865-870.
Diaz, O., Sun, G.L., Salomon, B., & von Bothmer, R. (2000) Levels and distribution of allozyme and
RAPD variation in populations of Elymus fibrosus (Schrenk) Tzvel. (Poaceae). Genetic
Resources and Crop Evolution 47: 11-24.
Ellstrand, N.C. & Roose, M.L. (1987) Patterns of genotypic diversity in clonal plant species.
American Journal of Botany 74: 123-131.
44
Clonal diversity in Potamogeton pectinatus
Eriksson, O. (1989) Seedling dynamics and life histories in clonal plants. Oikos 55: 231-238.
Eriksson, O. (1993) Dynamics of genets in clonal plants. Trends in Ecology & Evolution 8: 313-316.
Eriksson, O. & Bremer, B. (1993) Genet dynamics of the clonal plant Rubus saxatilis. Journal of
Ecology 81: 533-542.
Eriksson, O. & Fröborg, H. (1996) "Windows of opportunity" for recruitment in long lived clonal
plants: experimental studies of seedling establishment in Vaccinium shrubs. Canadian
Journal of Botany 74: 1369-1374.
Esselman, E.J., Jianqiang, L., Crawford, D.J., Windus, J.L., & Wolfe, A.D. (1999) Clonal diversity in
the rare Calamagrostis porteri spp. insperata (Poaceae): comparative results for allozymes
and random amplified polymorphic DNA (RAPD) and intersimple sequence repeat
(ISSR) markers. Molecular Ecology 8: 443-451.
Excoffier, L. (1992-1993) WINAMOVA, Version 1.55. Genetics and Biometry Laboratory,
University of Geneva, Geneva.
Excoffier, L., Smouse, P.E., & Quattro, J.M. (1992) Analysis of molecular variance inferred from
metric distances among DNA haplotypes. Application to human mitochondrial DNA
restriction data. Genetics 131: 479-491.
Fernando, D.D. & Cass, D.D. (1996) Genotypic differentiation in Butomus umbellatus
(Butomaceae) using isozymes and random amplified polymorphic DNAs. Canadian
Journal of Botany 74: 647-652.
Fisher, M. & Matthies, D. (1998) RAPD variation in relation to population size and plant
performance in the rare Gentianella germanica. American Journal of Botany 84: 811-819.
Gabrielsen, T.M. & Brochmann, C. (1998) Sex after all: high levels of diversity detected in the arctic
clonal plant Saxifraga cernua using RAPD markers. Molecular Ecology 7: 1701-1708.
Glenn, T.C., Stephan, W., & Braun, M.J. (1999) Effects of a population bottleneck on Whooping
Crane mitochondrial DNA variation. Conservation Biology 13: 1097-1107.
Gray, A.N. & Spies, T.A. (1996) Gap size, within-gap position and canopy structure effects on
conifer seedling establishment. Journal of Ecology 84: 635-645.
Halldén, C., Hansen, M., Nilsson, N.O., Hjerdin, A., & Sall, T. (1996) Competition as a source of
errors in RAPD analysis. Theoretical and Applied Genetics 93: 1185-1192.
Hamrick, J.L. & Godt, M.J.W. (1989) Allozyme diversity in plant species. In: Plant population
genetics breeding and genetic variation in plants (eds A.H.D. Brown, M.T. Clegg, A.L.
Kahler & B.S. Weir), pp. 43-63. Sinauer, Sunderland.
Hamrick, J.L. & Godt, M.J.W. (1996) Effects of life history traits on genetic diversity in plant
species. Phil. Trans. R. Soc. Lond. B 351: 1291-1298.
Hettiarachchi, P. & Triest, L. (1991) Isozyme polymorphism in the genus Potamogeton
(Potamogetonaceae). Opera Botanica Belgica 4: 87-114.
Heun, M., Murphy, J.P., & Philips, T.D. (1994) A comparison of RAPD and isozyme analysis for
determining the genetic relationships among Avena sterilis L. accessions. Theoretical and
Applied Genetics 87: 689-696.
45
Chapter 2
Hollingsworth, P.M., Preston, C.D., & Gornall, R.J. (1996) Genetic variability in two hydrophilous
species of Potamogeton, P. pectinatus and P. filiformis (Potamogetonaceae). Plant
Systematics and Evolution 202: 233-254.
Hsiao, J.-Y. & Rieseberg, L.H. (1994) Population genetic structure of Yushania niitakayamensis
(Bambusoideae, Poaceae) in Taiwan. Molecular Ecology 3: 201-208.
Hu, J. & Quiros, C.F. (1991) Identification of brocolli and cauliflower cultivars with RAPD
markers. Plant Cell Reports 10: 505-511.
Ivey, C.T. & Richards, J.H. (2001) Genetic diversity of everglades sawgrass, Cladium jamaicense
(Cyperaceae). International Journal of Plant Sciences 162: 817-825.
Joenje, W. (1978) Plant colonisation and succession on embarked sandflats. PhD thesis, University
of Groningen.
Kreher, S.A., Foré, S.A., & Collins, B.S. (2000) Genetic variation within and among patches of the
clonal species Vaccinium stamineum L. Molecular Ecology 9: 1247-1252.
Mader, E., van Viersen, W., & Schwenk (1998) Clonal diversity in the submerged macrophyte
Potamogeton pectinatus L. inferred from nuclear and cytoplasmic variation. Aquatic
Botany 62: 147-160.
McClintock, K.A. & Waterway, M.J. (1993) Patterns of allozyme variation and clonal diversity in
Carex lasiocarpa and C. pellita (Cyperaceae). American Journal of Botany 80: 1251-1263.
McLellan, A.J., Prati, D., Kaltz, O., & Schmid, B. (1997) Structure and analysis of phenotypic and
genetic variation in clonal plants. In: The ecology and evolution of clonal plants (eds H. de
Kroon & J. van Groenendael), pp. 185-210. Backhuys Publishers, Leiden, the
Netherlands.
Nicotra, A.B. & Rodenhouse, N.L. (1995) Intraspecific competition in Chenopodium album varies
with resource availability. American Midland Naturalist 134: 90-98.
Nolet, B.A., Langevoord, O., Bevan, R.M., Engelaar, K.R., Klaassen, M., Mulder, R.J.W., & Van
Dijk, S. (2001) Spatial variation in tuber depletion by swans explained by differences in
net intake rates. Ecology 82: 1655-1667.
Penner, G.A., Bush, A., Wise, R., & et al. (1993) Reproducibility of random amplified polymorphic
DNA (RAPD) analysis among laboratories. PCR Methods and Applications 2: 341-345.
Pérez, T., Albornoz, J., & Domínguez, A. (1998) An evaluation of RAPD fragment reproducibility
and nature. Molecular Ecology 7: 1347-1358.
Persson, H.A. & Gustavsson, B.A. (2001) The extent of clonality and genetic diversity in
lingonberry (Vaccinium vitis-idaea L.) revealed by RAPDs and leaf-shape analysis.
Molecular Ecology 10: 1385-1397.
Pielou, E.C. (1969) An introduction to mathematical ecology. Wiley-Interscience, New York.
Prop, J. & van Eerden, M.R. (1981) The occurrence of migratory birds in the Lauwerszee area from
the embankment in 1969 through 1978 (in Dutch). Limosa 54: 1-16.
Reusch, T.B.H., Hukriede, W., Stam, W.T., & Olsen, J.L. (1999) Differentiating between clonal
growth and limited gene flow using spatial autocorrelation of microsatellites. Heredity
83: 120-126.
46
Clonal diversity in Potamogeton pectinatus
Santamaría, L. & Rodríguez-Gironés, M.A. (2002) Hiding from swans: optimal burial depth of sago
pondweed tubers foraged by Bewick's swans. Journal of Ecology 90: 303-315.
Soane, I.D. & Watkinson, A.R. (1979) Clonal variation in populations of Ranunculus repens. New
Phytologist 82: 557-573.
Sokal, R.R. & Rohlf, F.J. (1995) Biometry. 3 edn. WH Freeman and company, New York.
Solbrig, O.T. & Simpson, B.B. (1974) Components of regulation of a population of dandelions in
Michigan. Journal of Ecology 62: 473-486.
Spencer, D.F. (1987) Tuber size and planting depth influence growth of Potamogeton pectinatus L.
American Midland Naturalist 118: 77-84.
Statistica, Version 5.5, 1999 Edition. Statsoft, Inc., Tulsa, Oklahoma. http://www.statsoft.com.
Steinger, T., Körner, C., & Schmid, B. (1996) Long-term persistence in a changing climate: DNA
analysis suggests very old ages of clones of alpine Carex curvula. Oecologia 105: 94-99.
Stenström, A., Jonsson, B.O., Jónsdóttir, I.S., Fagerström, T., & Augner, M. (2001) Genetic
variation and clonal diversity in four clonal sedges (Carex) along the Arctic coast of
Eurasia. Molecular Ecology 10: 497-513.
Sun, G.L., Diaz, O., Salomon, B., & Bothmer, R. (1999) Genetic diversity in Elymus caninus as
revealed by isozyme, RAPD and microsatelite markers. Genome 42: 1-12.
Teltscherová, L. & Hejný, S. (1973) The germination of some Potamogeton species from the SouthBohemian Fishponds. Folia Geobotanica et Phytotaxonomica 8: 231-139.
Underwood, A.J. (1997) Experiments in ecology: their logical design and interpretation using
analysis of variance. Cambridge University Press, Cambridge.
Van Wijk, R.J. (1988) Ecological studies on Potamogeton pectinatus L .1. General characteristics,
biomass production and life cycles under field conditions. Aquatic Botany 31: 211-258.
Van Wijk, R.J. (1989) Ecological studies on Potamogeton pectinatus L .3. Reproductive strategies
and germination ecology. Aquatic Botany 33: 271-299.
Van Wijk, R.J., Van Goor, E.M.J., & Verkley, J.A.C. (1988) Ecological studies on Potamogeton
pectinatus L .2. Autecological characteristics, with emphasis on salt tolerance,
intraspecific variation and isoenzyme patterns. Aquatic Botany 32: 239-260.
Verburg, R., Maas, J., & During, H.J. (2000) Clonal diversity in differently-aged populations of the
pseudo-annual clonal plant Circaea lutetiana L. Plant Biology 2: 646-652.
Watkinson, A.R. & Powell, J.C. (1993) Seedling recruitment and the maintenance of clonal
diversity in plant populations - a computer simulation of Ranunculus repens. Journal of
Ecology 81: 707-717.
Weeden, N.F., Timmerman, G.M., Hemmat, M., Kneen, B.E., & Lodhi, M.A. (1992) Inheritance
and reliability of RAPD markers. In: Applications of RAPD Technology to Plant Breeding
(eds S.V. Tingey, J.A. Rafalski & J.G.K. Williams), pp. 12-17. Crop Science Society of
America, Madison.
Widén, B., Cronenberg, N., & Widén, M. (1994) Genotypic diversity, molecular markers and
spatial distribution of genets in clonal plants, a literature survey. Folia Geobotanica et
Phytotaxonomica 29: 245-263.
47
Chapter 2
Williams, J.G.K., Kubelik, K.J., Livak, J.A., Rafalski, J.A., & Tingey, S.V. (1990) DNA
polymorphisms amplified by arbitrary primers are useful as genetic markers. Nucleic
Acids Research 18: 6531-6535.
Xie, Z.W., Lu, Y.Q., Ge, S., Hong, D.Y., & Li, F.Z. (2001) Clonality in wild rice (Oryza rufipogon,
Poaceae) and its implications for conservation management. American Journal of Botany
88: 1058-1064.
48
Clonal diversity in Potamogeton pectinatus
Appendix Results of a RAPD analysis of 128 samples taken within a population of Potamogeton
pectinatus. The sample numbers refer to their position within the population (see Figure legends
Fig.1 & Fig. 2). The letter and first number refer to the plot number; the second and third number
refer respectively to the row and the column number of the plot, as seen in Fig. 2. The primer
numbers refer to the Operon primer kits, the letters to the different selected markers. Zero denotes
that a marker is absent, one that a marker is present.
primer
band
b05
a
a
b
b08
c
d
e
a
b20
b
c
c07
a
a
c09
b
c
a
c19
b
c
a
b
c
g06
d
e
f
N113
N116
N121
N122
N125
N126
N131
N136
N142
N151
N152
N154
N155
N162
N164
N166
N213
N215
N222
N223
N225
N226
N233
N235
N242
N253
N254
N261
N262
N264
N265
N266
N312
N315
N322
N326
N332
N333
N334
N335
N346
N351
N353
N355
N362
N363
N364
N365
N412
N415
N416
N421
N423
N426
N431
N434
N441
N442
N444
N445
N451
N456
N461
N464
S111
S114
S115
S122
S123
S125
S133
S134
1
0
0
0
0
0
1
0
0
1
1
1
0
0
0
0
0
1
1
0
1
1
1
0
0
1
1
0
0
1
1
0
0
0
0
0
1
1
0
1
0
1
0
0
1
1
1
1
0
1
1
1
1
1
1
1
0
1
1
1
0
1
0
1
1
1
0
1
0
0
1
0
0
0
1
1
0
0
0
0
0
0
0
0
1
0
1
0
1
1
0
0
0
0
0
0
0
0
0
1
0
0
0
1
0
0
0
0
0
0
0
0
0
0
0
0
0
0
0
0
0
0
0
0
0
0
0
0
0
0
0
0
1
0
0
0
0
0
0
0
0
0
0
0
1
1
0
0
0
0
1
0
0
0
0
1
0
0
0
0
0
0
1
1
0
1
0
1
1
0
0
0
1
1
0
0
0
0
0
0
0
0
0
1
1
0
1
1
0
1
0
0
0
1
1
1
1
1
1
1
0
1
1
1
0
1
1
0
1
1
0
1
0
1
0
0
0
0
1
1
0
0
0
0
0
0
0
0
1
0
1
0
0
0
0
0
0
0
0
0
0
0
0
1
0
0
0
1
0
0
0
0
0
0
0
0
0
0
0
0
0
0
0
0
0
0
0
0
0
0
0
0
0
0
0
0
0
0
0
0
0
0
0
0
0
0
0
0
1
1
0
0
0
0
1
0
0
0
0
1
0
0
0
1
0
0
1
1
0
1
0
1
1
0
0
0
1
1
0
0
0
0
0
0
0
0
0
1
1
0
1
0
0
1
0
0
0
1
1
1
1
1
1
1
0
1
1
1
0
1
1
0
1
1
0
1
1
1
0
0
0
0
0
0
0
0
0
0
0
0
0
0
0
0
0
0
0
0
0
0
0
0
0
0
0
0
0
0
0
0
0
0
1
0
1
0
0
1
0
0
0
0
0
0
0
0
0
0
1
0
0
0
0
0
0
0
1
0
0
0
0
0
0
0
0
0
0
0
0
0
0
0
1
1
1
1
0
0
1
0
0
0
0
1
1
1
0
0
0
0
1
1
0
1
1
1
1
0
0
1
1
0
1
1
0
1
0
1
0
0
1
0
0
1
1
0
1
0
0
1
0
1
1
1
1
1
1
1
0
1
0
1
1
1
1
1
0
0
1
0
0
1
0
0
1
1
1
1
0
0
1
1
0
1
1
1
1
1
1
1
0
0
1
1
1
1
1
1
1
0
0
1
1
1
1
1
1
1
1
1
0
0
1
1
0
1
1
1
1
1
1
1
1
1
1
1
1
1
1
1
1
1
1
1
1
1
1
1
0
0
1
0
0
1
1
0
1
1
1
1
1
1
1
1
1
0
0
1
1
1
0
0
0
0
1
0
0
0
1
1
1
1
1
1
1
1
1
1
0
1
0
0
1
1
0
0
1
1
1
0
1
0
0
1
0
1
1
1
1
1
1
1
0
1
0
1
0
0
0
0
1
1
1
1
1
1
0
1
1
1
1
1
1
1
1
1
0
1
1
1
1
1
0
1
1
1
1
0
1
1
1
0
1
1
1
1
1
1
0
1
0
1
0
0
1
1
0
1
0
1
1
1
1
0
1
1
0
1
1
1
1
1
1
1
1
1
1
1
1
0
1
1
1
1
1
1
1
1
1
0
0
0
0
0
0
0
0
0
0
0
0
1
0
1
0
0
0
0
0
0
0
0
0
0
0
0
0
0
0
0
0
0
0
1
0
0
0
0
1
0
0
0
0
1
0
0
0
0
0
0
0
0
0
0
0
0
0
0
0
0
0
0
1
1
0
0
0
0
0
0
0
0
1
1
1
1
1
1
1
1
0
1
1
0
1
1
0
0
0
0
0
0
1
1
1
1
0
1
1
1
1
1
1
1
1
0
1
1
1
1
1
1
1
1
0
1
1
1
0
1
1
1
1
1
1
1
1
1
1
1
0
1
0
1
0
1
1
1
1
1
1
1
1
1
0
0
0
0
0
0
1
0
0
1
1
0
0
0
1
0
0
0
0
1
1
1
0
0
0
1
1
0
1
0
0
0
0
0
0
0
1
1
0
1
0
0
0
0
0
1
1
1
1
1
1
1
1
1
1
1
1
1
0
1
0
1
0
0
0
0
0
0
0
1
0
0
1
0
0
1
1
0
0
0
0
1
0
1
0
1
0
0
0
0
1
0
0
0
1
0
0
0
1
0
1
1
0
0
0
0
0
0
1
1
0
0
1
1
1
0
1
1
1
1
0
1
1
1
1
1
1
1
0
1
1
1
1
1
0
1
1
1
0
1
1
1
1
1
0
0
0
1
0
1
0
0
0
0
0
1
1
1
1
0
0
0
0
0
0
0
0
0
1
0
0
1
0
1
0
1
1
0
1
0
1
1
0
0
0
0
0
0
0
1
0
0
0
0
1
0
0
0
0
0
0
0
0
0
0
0
1
0
0
0
0
0
0
0
0
0
0
0
0
0
0
0
0
0
0
0
0
0
0
0
0
0
0
0
0
0
0
0
0
0
0
0
0
0
0
0
0
0
1
0
1
0
1
1
0
0
0
0
0
0
0
0
0
0
1
0
0
0
0
0
0
0
1
0
0
0
0
0
0
0
0
0
0
0
0
0
0
0
0
0
1
1
1
1
1
0
0
1
1
0
1
1
0
1
0
0
1
0
1
1
1
0
1
1
1
1
1
1
0
1
0
0
0
0
1
1
0
1
1
0
0
0
1
0
1
0
0
1
1
1
1
0
0
1
0
1
0
1
0
0
1
0
0
0
0
0
0
1
1
1
0
0
0
0
0
0
0
1
0
0
0
0
0
0
0
0
0
0
0
0
0
0
0
0
0
0
0
0
0
0
0
0
0
0
0
0
0
0
0
0
0
0
0
0
0
0
0
0
1
0
0
0
0
1
1
0
1
0
0
0
0
0
0
0
0
0
0
0
0
0
0
0
0
0
1
1
1
1
1
0
0
1
1
0
1
1
0
1
0
0
1
0
1
1
1
0
1
1
1
1
1
1
0
1
0
0
0
0
1
1
0
1
1
1
0
0
1
0
1
0
0
1
1
1
1
0
0
1
0
1
0
1
0
0
1
0
0
0
0
0
0
1
1
1
0
0
0
0
0
0
0
1
0
0
0
1
0
0
0
0
0
0
0
0
0
0
0
0
0
0
0
0
0
0
0
0
0
0
0
0
0
0
0
0
0
0
0
0
0
1
0
1
1
0
0
0
0
1
1
0
1
0
1
0
0
0
0
1
0
0
0
0
0
0
0
0
1
1
1
1
1
1
0
1
1
1
1
1
1
1
1
1
1
1
0
1
1
1
1
1
1
1
1
1
1
1
1
1
1
1
1
1
1
1
1
1
1
0
1
1
1
0
1
1
0
0
0
0
0
0
0
0
1
0
1
0
1
1
1
1
1
1
1
1
1
1
1
1
0
0
0
0
0
0
1
0
0
0
0
1
0
0
0
0
0
0
1
0
0
0
0
0
0
0
0
0
0
0
0
0
0
0
0
0
0
0
0
0
0
1
1
1
0
0
0
1
1
1
1
1
1
1
1
1
0
1
1
1
0
0
0
1
0
0
0
0
0
0
0
0
49
Chapter 2
Appendix continued
primer
band
b05
a
a
b
b08
c
d
e
a
b20
b
c
c07
a
a
c09
b
c
a
c19
b
c
a
b
c
d
e
f
S144
S146
S151
S153
S156
S162
S163
S166
S213
S215
S222
S226
S231
S232
S234
S236
S244
S246
S251
S261
S262
S263
S264
S266
S313
S316
S321
S323
S324
S333
S335
S336
S346
S352
S353
S355
S356
S361
S362
S365
S411
S413
S414
S415
S416
S423
S431
S435
S441
S443
S444
S445
S452
S454
S462
S466
0
1
1
0
1
1
1
1
0
0
0
0
1
1
1
1
1
1
1
0
0
1
1
1
0
1
0
0
1
1
0
0
1
1
0
0
1
0
0
1
0
0
1
1
1
1
0
0
1
0
1
1
1
1
1
0
0
0
0
0
0
0
0
0
0
0
0
0
0
0
0
0
0
0
0
0
1
0
0
0
0
0
0
0
0
0
0
0
0
0
0
0
1
0
0
0
0
0
0
0
0
0
0
0
1
0
0
0
0
0
0
0
0
1
0
1
1
0
1
1
0
1
0
1
0
0
0
0
1
1
0
0
0
1
1
1
1
1
0
0
0
0
0
0
0
1
0
1
0
0
0
1
0
1
1
1
1
1
1
1
0
1
0
1
1
1
0
1
0
0
0
0
0
0
0
0
0
0
0
0
1
0
0
0
0
0
0
0
1
0
0
0
0
0
0
0
0
0
0
0
0
0
0
0
0
0
0
0
0
0
0
0
0
0
0
0
0
0
0
0
0
0
0
0
0
1
0
1
1
0
1
1
0
1
0
1
0
0
0
0
1
1
0
0
0
1
1
1
1
1
0
0
0
0
0
0
0
1
1
1
0
0
0
1
0
1
1
1
1
1
1
1
0
1
0
1
1
1
0
1
0
0
0
0
0
0
0
0
0
0
0
0
0
0
0
0
0
0
0
0
0
0
0
0
0
0
1
1
0
0
1
0
0
0
0
0
0
1
1
0
0
0
0
0
0
0
0
0
0
0
0
0
0
0
0
0
0
1
0
1
0
0
0
0
1
1
1
1
0
1
0
0
0
1
1
1
0
0
0
0
0
1
1
0
0
1
1
1
1
0
1
0
1
1
0
1
0
1
1
1
0
1
1
1
1
0
1
1
0
0
0
1
0
1
1
1
1
1
1
1
1
1
1
1
0
1
0
1
0
1
1
1
1
0
0
0
1
1
1
1
1
1
1
1
1
1
1
0
1
1
1
1
1
1
1
1
0
1
1
1
1
0
1
1
0
1
1
1
1
1
0
1
1
0
0
0
1
1
1
1
1
1
1
0
1
1
1
1
0
1
1
1
0
1
0
0
0
1
1
1
0
0
1
1
1
1
0
1
0
1
1
1
1
1
1
1
1
1
1
1
1
0
0
1
0
1
1
1
1
1
1
1
1
0
1
0
1
0
1
1
1
1
1
1
1
1
1
1
1
0
1
1
1
1
1
1
1
1
1
0
1
1
1
1
1
1
1
1
1
1
0
0
1
1
1
1
1
1
1
0
0
1
0
0
1
0
0
0
0
1
0
1
0
0
1
0
0
0
1
0
0
1
0
0
0
1
0
0
0
0
0
0
0
0
0
1
0
0
0
0
0
0
0
0
0
0
1
1
0
0
0
0
0
0
0
1
1
1
1
1
1
1
1
1
1
1
1
1
1
1
1
1
1
0
0
1
1
1
1
1
1
1
1
1
1
1
1
1
1
1
1
1
1
1
1
1
1
1
1
1
1
1
1
1
1
1
0
1
1
1
1
1
0
0
0
0
0
0
1
1
1
0
1
0
0
1
0
1
0
1
0
1
0
0
0
0
1
0
1
1
1
0
1
1
0
1
0
0
0
0
1
1
0
1
1
1
1
1
0
0
0
0
1
1
1
1
1
0
1
0
1
0
1
1
1
1
0
0
0
0
1
0
1
1
0
0
0
1
1
0
1
0
0
0
1
1
0
1
0
1
1
1
0
0
1
0
0
1
0
0
1
1
1
1
0
0
1
1
1
1
1
1
0
0
0
0
0
0
0
0
0
0
0
1
0
1
0
1
0
0
0
1
0
0
0
0
0
0
0
1
0
0
0
1
0
0
0
1
0
0
0
0
0
0
0
0
0
0
0
0
1
1
0
1
0
0
0
0
0
1
0
0
0
0
0
0
0
0
0
0
0
0
0
0
0
0
0
0
0
0
0
0
1
0
0
0
1
1
1
0
1
0
1
0
1
0
0
1
0
0
0
0
0
0
0
0
0
0
0
0
0
0
0
0
1
0
1
1
1
0
1
1
0
0
0
0
0
0
1
1
1
0
0
1
1
0
1
1
1
1
0
0
0
0
0
0
0
1
0
0
0
1
0
1
0
0
0
1
1
1
0
0
0
0
0
1
1
1
0
0
0
0
0
0
0
0
0
0
0
0
0
0
0
0
0
0
0
0
1
0
0
1
0
0
0
0
0
0
0
0
0
0
1
0
0
0
0
0
0
0
1
1
1
0
0
0
0
1
0
0
0
0
0
0
0
0
0
0
1
1
1
0
1
1
0
0
1
0
1
0
1
1
1
0
0
1
1
0
1
1
1
1
0
0
0
0
0
0
0
1
0
0
0
1
0
1
0
0
0
1
1
1
0
0
0
0
0
1
1
1
0
0
0
0
0
0
0
0
0
0
0
0
0
0
0
1
0
0
0
0
1
0
0
1
0
0
0
0
0
0
1
1
0
1
1
0
1
0
1
0
0
0
1
1
1
0
0
0
0
1
0
0
0
0
0
0
1
0
0
0
1
0
1
1
0
1
1
1
0
1
0
0
1
1
1
1
0
1
1
1
1
0
0
0
1
1
1
1
1
1
1
1
1
1
1
1
1
1
1
0
1
1
0
0
1
0
1
1
1
1
1
0
1
1
1
1
0
1
0
0
1
0
0
0
0
0
0
0
0
0
0
0
1
0
0
0
0
1
1
1
0
0
1
1
0
1
0
0
1
0
1
0
0
0
0
1
0
0
1
1
1
1
0
0
0
0
0
1
1
0
0
0
50
g06
Chapter 3
Population responses to propagule predation: the role of clonal
propagule size1
Abstract
Propagule size plays an important role in the success of individual plants, since size may
affect qualities such as growth, survival, and dispersal. Optimal propagule size is likely to
differ among sites with contrasting ecological characteristics, yet for natural selection to
act on propagule size it should show variation and have a heritable component. Fennel
pondweed produces asexual propagules (tubers) that are foraged upon by Bewick’s
swans. Deep burial of tubers represents an escape mechanism against tuber predation,
but only large tubers can successfully sprout from deep burial sites. In areas with little
predation, small tubers may be favoured since higher numbers may be produced. In this
study we cultivated 15 clonal lines obtained from the field for three consecutive
generations at common-garden conditions. We show that (1) tuber size has a heritable
component (broad-sense heritability H2 = 1.01); (2) there is a size-number trade-off
although it levels off at small tuber sizes; and (3) genotypes that produce larger tubers
position relatively more tubers at deeper burial depths than small-tuber genotypes do.
With a population model we show that the placement of tubers at deep burial depths
increases survival of large-tuber genotypes at high predation pressure, but results in a
loss of competitive advantage at low predation pressure or in sandy sites. The model
results indicate that spatial differences in sediment type and swan predation pressure
result in disruptive selection on tuber size, but population response will be slow (50-300
generations). Moreover, maternal effects may also slow down such response, enhancing
the persistence of tuber polymorphism.
1
H.H. Hangelbroek, L. Santamaría & M.A. Rodríguez-Gironés
Chapter 3
Introduction
Propagules and their future as sprout or seedling are the contribution of a plant to the
next generation and therefore are important determinants of reproductive success of
individual plants. Much research has therefore been devoted to the analysis of optimal
offspring size within species, particularly in relation to size-number trade-offs (Smith &
Fretwell 1974; Lloyd 1987; Venable 1992). With the same amount of resources more
small propagules can be produced. However, the fitness of the individual propagules may
be a function of size. For instance, larger propagules often have higher germination or
emergence success (Schaal 1980; Weis 1982; Stanton 1984; Morse & Schmitt 1985; Winn
1988; Mogie et al. 1990; Prinzie & Chmielewski 1994; Mojonnier 1998; Santamaría &
Rodríguez-Gironés 2002) and greater seedling or sprout size (i.e. biomass or height)
(Weis 1982; Stanton 1984; Morse & Schmitt 1985; Weller 1985; Wulff 1986a; Mogie et al.
1990; Vaughton & Ramsey 1998; Verburg & During 1998; Eriksson 1999; Chacon &
Bustamante 2001). Other factors not directly related to enhanced germination and
growth may also affect optimal propagule size, e.g. increased competitive advantage
(Black 1958; Wulff 1986b), ability to emerge from deeper planting depths (Black 1956;
Weller 1985; Wulff 1986a; Banovetz & Scheiner 1994; Santamaría & Rodríguez-Gironés
2002) and winter survival (Van Groenendael & Habekotté 1988) of larger propagules,
and decreased predation (Nelson & Johnson 1983; Moegenburg 1996) and enhanced
dispersal (Morse & Schmitt 1985; Ganeshaiah & Uma Shaanker 1991) of smaller
propagules. All in all, many factors seem to influence optimal propagule size within
species and local differences in optimal size may thus occur among sites with contrasting
ecological characteristics.
However, for optimal propagule sizes adapted to local conditions to evolve
propagule size must show individual variation and this variation must have a heritable
component, otherwise natural selection cannot take place. Unfortunately most studies
that found marked differences in fitness related to propagule size did not analyse
whether propagule size had a genetic component (see above, with the exception of Schaal
1980; Mojonnier 1998). Non-genetic carry-over effects that relate to the specific
environmental conditions experienced by the mother plant, such as resource availability,
may also affect the distribution of propagules sizes found in a given population (Rossiter
1996). For example, large propagules may produce relatively large plants, which in turn
may produce large propagules, and vice versa for small propagules. Phenotypic selection
may then result in comparable size distributions as those that can be expected from
natural selection acting on a genetic component of size. It is thus essential to uncover
52
Population responses to propagule predation
whether the trait under investigation has a genetic component before we can talk about
potential evolutionary change.
When propagule size is genetically determined this may be regulated by a
heritable trait of the mother, namely propagule provisioning (i.e. the number of
resources invested in the production of propagules and its partitioning into a given
number of them), or by the genotype of the developing propagule itself (Antonovics &
Schmitt 1986). In the case of asexual reproduction, the genotypes of the produced
propagules are identical to the mother and to one another. Heritable differences in
propagule size are thus the result of the maternal genotype and not of differences among
‘daughter’ propagule genotypes. In such case, a particular distribution of propagule sizes
observed within a natural population will often be the result of natural selection on
maternal propagule provisioning.
In the pseudo-annual pondweed Potamogeton pectinatus L. (fennel pondweed)
the size of asexual propagules (tubers) varies considerably. In many populations in north
and northwest Europe, Bewick’s swans (Cygnus columbianus bewickii) predate heavily on
these tubers (up to 48 % tuber biomass may be removed from a population (Nolet et al.
2001)). A detailed study in one of such fennel pondweed populations (Lake
Lauwersmeer, the Netherlands) showed that swan-predation pressure varies depending
on water depth and sediment type (Nolet et al. 2001) and that the size of produced tubers
varies accordingly (Santamaría & Rodríguez-Gironés 2002). Bewick’s swans forage by
trampling the sediment loose with their feet and then sieving out the tubers with their
bill. Since deeply-buried tubers are less accessible to the swans, deep burial of tubers may
represent an escape mechanism against tuber predation (Santamaría & RodríguezGironés 2002). Yet for tubers to successfully sprout from larger burial depths they must
be large; hence, a positive correlation between burial depth and tuber size has been
reported in the field (Beekman et al. 1991; Santamaría & Rodríguez-Gironés 2002). All
this was taken to suggest that selection for large, deeply buried tubers may take place in
the areas of Lake Lauwersmeer where tuber predation by swans occurs. In areas where
there is no or little predation, small tubers may be favoured because there is no need for
deep burial and producing small tubers is likely to result in the production of a higher
number of tubers (Santamaría & Rodríguez-Gironés 2002; Stuefer et al. 2002). Since
sediment type is correlated with swan predation pressure (Nolet et al. 2001) and it affects
the sprouting survival of tubers over burial depth (Santamaría & Rodríguez-Gironés
2002), local specialization in propagule provisioning has been hypothesised to take place
between sandy and clay-rich areas of Lake Lauwersmeer.
Al in all, in the pondweed population of Lake Lauwersmeer different selection
pressures may be at work upon tuber size in areas with contrasting sediment types and
53
Chapter 3
predation pressures. To further elucidate the role of propagule size and burial depth as
traits related to predator escape, we addressed two questions: (1) Does tuber size vary
among genotypes, and does this variation have a heritable component? (2) If so, do
clones producing large tubers show a higher proportion of deeply-buried large tubers
than clones producing small tubers, or do they produce large tubers at all burial depths?
Furthermore, we combined these results with results of previous studies (Santamaría &
Rodríguez-Gironés 2002; Rodríguez-Gironés et al. 2003) into a population model that
investigates the clonal dynamics of a population of plants with contrasting propagule
provisioning strategies under varying combinations of swan-predation pressure and
sediment type.
Material and Methods
Species and study system
Potamogeton pectinatus is a clonal aquatic macrophyte with a wide geographic
distribution ranging from the subarctic to the subtropics (Casper & Krausch 1980;
Wiegleb & Kaplan 1998). Reproduction is mainly through the production of asexual
subterranean propagules (tubers), which are formed along the rhizome. Sexual
reproduction also takes place, but is thought to contribute primarily to dispersal and
population re-establishment after disturbances rather than to short-term survival within
populations (Van Wijk 1989). P. pectinatus has a pseudo-annual life cycle: every autumn
the plants senesce, leaving the disconnected tubers in the sediment to hibernate. In
spring new plants arise from the tubers. The different plant parts are subjected to
herbivory by several species of waterfowl: in north and northwest Europe, shoots and
seeds are consumed by ducks, coots and mute swans, and tubers primarily by Bewick’s
swans.
Our study focused on a population of P. pectinatus situated in the Babbelaar, a
former branch of the Lauwerszee estuary that turned into the freshwater lake, Lake
Lauwersmeer (the Netherlands) after closure in 1969. The population occupies two
opposite shores of contrasting sediment type separated by a deep-water gully. In autumn
its tubers are foraged by migratory Bewick’s swans. Swan-predation pressure varies in
relation to water depth and sediment type (Nolet et al. 2001), with highest predation
rates in shallow and sandy areas and lowest predation rates in deep and clay-rich areas
(Nolet et al. 2001).
54
Population responses to propagule predation
Experimental design
We estimated broad-sense heritability from the repeatability of measured traits across
clonal generations, after experimentally removing the environmental component of
variation (sensu Dohm 2002). For this purpose, the regression coefficient was estimated
between consecutive measurements of the trait ‘tuber dry weight’ taken in the last two
clonal generations, out of three generations of growth under standardised conditions and
from tubers of a comparable standardised size range (Fig. 1). In April 1997, 90 tubers
were collected among five sites within the study population in the Babbelaar. The sites
were 500 to 1000 metres apart and were selected to vary in sediment composition and
predation pressure by Bewick’s swans (see Santamaría & Rodríguez-Gironés 2002 for
detailed site description) in order to acquire clones with a natural range of variation in
tuber characteristics. The collected tubers were kept at 4 °C to continue their hibernation
period until May 1997, when they were weighed individually (fresh weight, accuracy 1
mg) and set to grow outdoors in common-garden conditions. Individual tubers were
placed in separate pots (18 cm height, 21 cm upper diameter, 5.5 L volume) containing a
mixture of river sand and commercial potting clay (3:1 dry-weight ratio). The pots were
subsequently placed in 1 m3 tanks (110 cm length x 90 cm width x 65 cm height) filled
with tap water. Each tank contained 20 pots. At the end of the growth season (October
1997), newly-produced tubers were harvested and their individual mass (fresh weight,
accuracy 1 mg) measured. These tubers were again kept at 4 °C to hibernate until May
1998, when the experiment was continued with a selection of 15 out of the 90 original
clonal lines. The selected lines corresponded to three clones from each of the five field
sites (Fig. 1). From each site, we selected clones that had produced small (average
between 17 - 35 mg fresh weight, equivalent to 6 - 12 mg dry weight), medium-sized (47
- 57 mg fw, 16 - 19 mg dw) and large tubers (66 - 84 mg fw, 23 - 29 mg dw) at the
common-garden conditions of the previous year. In contrast to the former year, where
the size of the tubers planted (hereafter referred to as ‘initial tuber size’) varied
considerably between clones, plants of the different clones were now grown from tubers
with comparable sizes. The initial tuber sizes were standardised across a size range of 15
to 90 mg fw (equivalent to 5 to 30 mg dw) for each clone, to minimise the potential
influence of differential environmentally-induced carry-over effects (non-genetic
maternal effects mediated by differences in initial tuber size) between clones. Each tuber
(eight per clone) was planted under the above-described conditions, except for the
sediment mixture, which now had a 2 : 1 dry-weight ratio between sand and clay. The
pots and thus the replicates of the clones were randomly divided over 12 tanks. Plants
were allowed to grow until October 1998 and newly-produced tubers were harvested,
measured (individual fw, accuracy 1 mg) and stored to hibernate at 4 °C until using them
55
Chapter 3
9 x 2 tubers
sampled
per site
Produced
tuber size
Standardized
tuber size range
planted
Produced
tuber size
Standardized
tuber size range
planted
Tuber traits
measured
small
small
8x
shallow
10x
8x
deep
medium
medium
8x
shallow
10x
8x
deep
large
8x
shallow
large
f
8x
10x
deep
tuber size
f
tuber size
18 x
winter
Field
spring - summer - autumn winter
Year one
spring - summer - autumn
Year two
winter
spring - summer - autumn
Year three
Figure 1 Sampling and experimental design. Potamogeton pectinatus tubers were sampled from
five sites within the Babbelaar, the Netherlands. For simplicity only one of the five sites is depicted
here; the procedure was identical for all sampling sites. Eighteen tubers were sampled from nine
sampling points, one small and one large one. The sampling points were one to eight metres apart.
The 18 tubers were propagated in a common-garden set-up and the size of the produced tubers
was measured (year one). Insets: frequency distribution of the tuber sizes produced by a clonal
plant. For the continuation of the experiment, three of the 18 clones were selected based on the
average tuber size they had produced in year one: one small tuber producing clone, one medium
and one large one. From each of these three clones 8 tubers with a comparable size range (dashed
lines inset) were used to grow plants in the next year (year two). Because these plants were grown
at common-garden conditions and the initial tuber sizes between clones were now comparable, the
differences between clones in produced tuber size (year 2) thus represent genetic differences,
which we call the genotypic-tuber-size of a clone. In the third year, the three clones were grown at
common-garden conditions again, but now ten tubers per clone with comparable size ranges were
used. The total number of plants grown in the third year of the experiment was: 5 sites x 3 clones x
10 clonal replicates = 150 plants.
for a third year of growth, from May to October 1999. In this last year of growth, we used
10 tubers per clone and we were able to reduce the range of initial tuber sizes to 40 - 60
mg fw (equivalent to 14 - 21 mg dw). Furthermore the sediment mixture was comparable
to the previous year (i.e. 2 : 1 = sand : clay, in dw) and the pots were randomly divided
over eight tanks. Newly produced tubers were harvested and weighed individually, but
56
Population responses to propagule predation
the sediment in the pot was divided in a top and a deep layer (of respectively 8 and 8.5
cm) prior to harvesting the tubers. For the three consecutive harvests of the experiment,
tuber dry weight was calculated using fresh- to dry-weight (after 48 h at 70 °C)
regressions obtained from a subsample (randomly chosen and including tubers from all
clonal lines) of all harvested tubers (each year separately; b = 0.34, 0.35, 0.42; R2 = 0.95,
0.95, 0.95; and n = 60, 210, 75 for year 1, 2 and 3 respectively). Hereafter, the tubers
originally collected from the field are referred to as ‘tubers from the field’ and the tubers
they produced as ‘year 1 tubers’. Tubers produced in the second and third year of growth
will be referred to as ‘year 2 tubers’ and ‘year 3 tubers’.
The 15 clones were tested on whether they indeed had different genotypes with
the usage of Amplified fragment length polymorphism (AFLP). The AFLP method was
carried out according to Vos et al. (1995). All clones were distinguished from each other
with the primer combination: EcoRI+ACC / MseI+CTT.
Data analysis
Data analysis consisted of geometric mean regression (GMR) (Ricker 1984) between the
average dry weight of year 2 and year 3 tubers produced by each of the 15 clones (i.e. n =
15). The average tuber dry weight per plant was calculated after log (x+1) transformation
of individual tuber sizes, since within-plant tuber-size distribution was strongly rightskewed. The slope of the regression was interpreted as a measure of trans-generational
trait repeatability and, under the assumption of negligible environmental effects, as a
measure of broad-sense heritability (Dohm 2002). A GMR was used instead of an
ordinary regression since both variables show mutual natural variation, and GMR
regression takes account of variability in both axes while ordinary regression is
exclusively based upon least-square minimisation in the Y-axis (Ricker 1984).
To analyse the respective influences of genotypic and environmental ‘carry over’
effects over the average tuber size produced by the successive asexual generations a path
analysis was carried out (Sokal & Rohlf 1995), based on partial correlation coefficients
obtained from a hierarchical set of multiple regressions (see Huber et al. 1996). In this
experiment, non-genetic maternal effects result from the influence of the maternal
environment (e.g. varying sediment types in the field collection sites) or from the effect
of variation in the initial size of tubers collected in the field at the start of the experiment.
To distinguish between the two, an independent variable was added to the path analysis:
the sediment composition of the field collection sites (as the percentage of clay particles,
see Nolet et al. 2001; Santamaría & Rodríguez-Gironés 2002). However, since this
variable had no significant effects on tuber size in any of the three years analysed, only a
second analysis carried out without this factor will be reported.
57
Chapter 3
Because the size of tubers from which the plants were grown was standardised in
year 2 and year 3, plants genetically determined to produce large tubers may show a
decreased tuber production as compared to those determined to produce small tubers
since their growth metabolism and allocation patterns may be adjusted to grow from
larger tubers. This possibility was evaluated by carrying out an additional path analysis,
analysing the effect of initial tuber size of tubers collected in the field and the average
(genetically determined) sizes of the produced tubers on total tuber production in year 2
and year 3.
It was also analysed whether the genotypic variation found reflected a trade-off
between tuber number and size, by means of linear regression between the average values
per clone of tuber size and tuber number, measured in year 3. Significance of a quadratic
term was also tested by means of multiple regression for tuber number on the
independent variables size and size2. To assess whether the observed non-linearity was
related to decreased tuber production in genotypes with small tuber sizes, we also
performed a multiple regression relating total tuber production per plant to tuber size
and its square (size2). In all regressions, average tuber size per clone was based on the
geometric mean per plant (instead of the average per plant), since individual tuber size
had to be log-transformed to correct for right-skewedness.
To analyse whether clones differed in the distribution of tubers characteristics (as
total tuber production, tuber number and tuber size) over burial depth, ANCOVAs were
carried out. The dependent variables were calculated as the ratio between the values (of
tuber production, number and size) measured at the shallow and deep sediment layers in
year 3. The ANCOVA aimed specifically at quantifying the component of clonal
variation that was correlated with genotypic-tuber-size (i.e. genetically determined tuber
size); hence, ‘clone’ was entered as a random categorical variable and ‘genotypic-tubersize’ (estimated from the average per clone in year 2) as a continuous variable. To
account for the effect of variation in initial tuber size at the start of the growth season
(i.e. within the standardised size range used in year 3), the initial tuber size of individual
plants was introduced as a second continuous variable. Finally, a second set of
ANCOVAs was performed introducing total tuber production instead of initial tuber
size as a covariable, to investigate the effect of variation in plant productivity that was
independent of initial tuber size. To correct for potential tank effects, tank was also
added as a random categorical factor in the above-described ANCOVAs, but since it
never had an effect it was left out of the analyses. In all ANCOVAs, all continuous
variables were log10 transformed to assure homoscedasticity and normality of residuals.
58
Population responses to propagule predation
Population model
In order to explore whether tuber predation by Bewick’s swans is likely to result in
selection pressure favouring certain tuber-size genotypes, a population model was
constructed and fitted to the empirical results described in Santamaría & RodríguezGironés (2002), Rodríguez-Gironés et al. (2003) and in this paper. The model simulates,
the clonal dynamics of a population composed of seven different genotypes that differ in
their allocation of resources to the production of small-shallow versus large-deep tubers.
The modelled genotypes respectively allocate 15, 20, 25, 30, 35, 40 and 45 % of resources
to shallow-small tubers, and all remaining resources to deep-large tubers. Hereafter, they
will be referred to by their percentages of allocation to small-shallow tubers (e.g. ‘15% S’
refers to the genotype that allocates 15% of resources to small-shallow tubers and 85% to
large-deep tubers). All genotypes produce exclusively two types of tubers: small-shallow
tubers of 45 mg fw, placed at 40 mm burial depth; and large-deep tubers of 95 mg fw
placed at 200 mm burial depth. Owing to their different allocation of resources to
shallow and deep tubers, however, the different genotypes have varying average tuber
sizes. For example, a genotype investing 15% of resources in 45 mg tubers and 85% of
resources in 95 mg tubers will produce 27% and 73% individual tubers of respectively
small and large size, hence average tuber size per plant will be 81.4 mg fw. On the other
hand, a genotype investing 45% of resources in 45 mg tubers and 55% of resources in 95
mg tubers will produce 63% and 37% individual tubers of small and large size, hence
average tuber size will be 63.3 mg fw. The burial depth values correspond to the average
burial depth of tubers in the field, measured at two sediment layers of < 100 and ≥ 100
mm depth (in the experiment, tuber burial depths in the lower layer of the pots were
considered unreliable, since the rhizomes coiled at the bottom of the pot). Similarly,
tuber sizes corresponded to the average tuber size values at < 100 and ≥ 100 mm burial
depths (i.e. 45 and 95 mg fw). The ratio between tuber size in the shallow and deep layers
was comparable in the field and in the experiment (45 / 95 ≈ 0.5).
The model divides the plant’s life-cycle in three subsequent phases (Fig. 2;
appendix): (1) tuber sprouting in spring; (2) plant growth during summer and tuber
production in autumn, including the effect of intra-specific competition on individual
plant yield; (3) tuber mortality during winter and the effect of tuber predation by
Bewick’s swans upon it. Mortality associated to tuber sprouting in spring increases with
burial depth and decreases with tuber size and clay content (Santamaría & RodríguezGironés 2002). Per capita growth and tuber production decreases with population
density, due to intra-specific competition that also results in increased resource capture
for plants growing from larger tubers (Rodríguez-Gironés et al. 2003). Winter mortality
59
Chapter 3
due to swan predation decreases with burial depth (Santamaría & Rodríguez-Gironés
2002).
ri (r(nspring),si, ni) x G
Nautumn
w (WS, f(ß, d))
Nspring
g (d, s)
Nwinter
Figure 2 The model life-cycle of Potamogeton pectinatus. In spring, the population consists
entirely of ramets (independent, individual plants of clonal origin), which survived tuber sprouting
in the beginning of spring. Tuber sprouting is described by the function g (d, s) and is affected by
burial depth (d) and tuber size (s). The function r (r(n spring), si, ni) describes how per capita
production is related to ramet density (nspring) and how resource capture of each individual plant
depends on the size of the tuber from which it grows (si) and on competition between the number
of small tubers (ni) and the number of large tubers (ni) per litre in the population. Depending on
the genotype (G) the plants allocate different amounts of resources to small and large tubers. After
tuber production, the ramets die and Nautumn and Nwinter are the total number of tubers in the
population before and after winter. The function w (WS, f(ß, d)) describes tuber survival to overwintering mortality (WS) and to swan predation (f(ß, d)) which depends on burial depth (d) and
predation pressure (ß). For equations of the model see appendix. The effect of variation in
sediment type was simulated by changing the parameters in equations 1 to 3 and 7 and 8
accordingly, while keeping all other parameters constant.
The model was run at different combinations of clay content and predation
pressure, to test whether (a) selection pressure for genotypes producing different
proportions of large and small tubers varied with these two factors, and (b) there are
particular combinations of them that resulted in stable polymorphism (i.e. the
coexistence of different genotypes in the population). Each simulation was run for at
least 400 generations, and simulations continued until a single genotype became
60
Population responses to propagule predation
dominant or until no change in the number of individuals of all genotypes occurred for
the last 200 generations.
First the results will be presented of simulations based on the above-mentioned
tuber sizes (s1 = 45 and s2 = 95 mg fw) and burial depths (d1 = 40 and d2 = 200 mm).
Subsequently, we present the results of a sensitivity analysis in which these parameters
were varied. In the case of tuber size, the size of small and large tubers was varied
simultaneously in order to maintain a fixed proportionality (s2 / s1 = 2.11). Hence,
changes in size affected the terms describing sprouting survival, tuber production and
biomass allocation to shallow and deep sediment layers, while the size-mediated
competition term remained invariant. This approach is consistent with variation in tuber
sizes observed as a consequence of environmentally induced carry-over effects (since
initial tuber size influenced average tuber size per plant, but had no influence on the
variation in tuber size over burial depth; see below).
Results
Heredity of tuber size
The average tuber size produced in year 2 and in year 3 by plants grown under
comparable conditions and from tubers of comparable size (initial tuber size) was
positively correlated (R2 = 0.34, P = 0.02) with a geometric mean regression (GMR) slope
of b = 1.01 (Fig. 3).
The path analysis revealed significant effects of both the genetic and
environmental components on tuber size. The correlation between average size of
produced tubers was lower between years 2 and 3 than it was between years 1 and 2,
although it was still high and significant (Fig. 4a). The size of the tubers originally
collected in the field (i.e. a combination genetic and environmental maternal-size effects)
was positively correlated with the size of newly-produced tubers in year 1, but in year 2
this correlation turned into a negative relationship and in year 3 it was no longer present
(Fig. 4a). Similarly, the size of the tubers originally collected in the field had a significant,
negative effect on tuber production in year 2 (Fig. 4b), but in year 3 this was no longer
the case (Fig. 4c). The average size of tubers produced in year 1 had a significant effect on
tuber production in year 2 (Fig. 4b), while tuber production in year 3 was not
significantly affected by tuber size in any of the previous years (Fig. 4c).
61
Chapter 3
produced tuber size (log dw)
Year 3
1.4
y = 0.11 + 1.01 x
1.3
1.2
1.1
1.0
0.9
1.0
1.1
1.2
produced tuber size (log dw)
Year 2
Figure 3 Relationship between the average size of tubers produced by 15 genotypes of Potamogeton
pectinatus in two consecutive clonal generations grown from tubers of comparable size and under
standardised common-garden conditions. The line was fitted by Geometric Mean Regression
(GMR).
Size-number trade-off
Tuber size (geometric mean) and number did not show a significant, negative linear
relationship (R2adj. = 0.00, F 1, 13 = 0.08, P = 0.79). Although tuber number decreased with
increasing tuber size at medium to large tuber sizes, it also decreased with decreasing
tuber size at small tuber sizes. This relationship was well described by an order-2
polynomial regression (R2adj. = 0.34, F 2, 12 = 4.57, P = 0.03; Fig. 5a). Tuber number thus
decreased above and below an optimal tuber size of 15 mg dry weight.
Total tuber production was also non-linearly related to tuber size (linear
regression: R2adj. = 0.24, F 1, 13 = 5.48, P = 0.036; polynomial regression: R2adj. = 0.56, F 2, 12
= 10.04, P = 0.003 (Fig. 5b). Tuber production decreased at tuber size values above and
below an optimum of 16 mg dry weight, though (for the range of genotypic-tuber-sizes
analysed) the decrease was much stronger for small than for large tubers.
62
Population responses to propagule predation
a.
initial tuber size standardised
size of tuber
from
FIELD
0.74**
tuber size
produced in
YEAR 1
0.79***
51%
tuber size
produced in
YEAR 2
tuber size
produced in
YEAR 3
26%
56%
-0.67**
b.
0.59*
ns
initial tuber size standardised
size of tuber
from
FIELD
0.74**
tuber size
produced in
YEAR 1
0.66*
51%
Total tuber
production in
YEAR 2
34%
-0.54*
c.
initial tuber size standardised
size of tuber
from
FIELD
0.74**
tuber size
produced in
YEAR 1
51%
0.56*
tuber size
produced in
YEAR 2
ns
ns
27%
Total tuber
production in
YEAR 3
< 0%
ns
Figure 4 (a) Results of a path analysis on the average size of tubers produced by three consecutive
clonal generations of Potamogeton pectinatus. (b) and (c) Results of a path analysis on the
influence of environmental carry-over effects mediated by tuber size on tuber production over two
(b) and three (c) clonal generations. The analyses are based on average values for 15 clonal lines
grown in common-garden conditions. Solid black arrows indicate positive correlations, dashed
arrows negative correlations and solid grey arrows non-significant tested correlations. Numbers
near the arrows indicate partial correlation coefficients, while numbers within boxes indicate the
percentage of variation explained by the multiple regression (R2adj.). *, P < 0.05; **, P < 0.01; ***, P <
0.001.
63
Chapter 3
80
y = -210.3 + 36.2x - 1.2x2
R2adj = 0.34
tuber number
70
(a)
60
50
40
30
20
8
10
12
14
16
18
20
22
total tuber production (mg dw)
tuber size (mg dw)
1600
y = - 4820.7 + 744.4x - 23.2x2
R2adj = 0.56
1400
(b)
1200
1000
800
600
400
200
8
10
12
14
16
18
20
22
tuber size (mg dw)
Figure 5 Relationship between tuber size and (a) tuber number and (b) total tuber production per
plant, for 15 clones of Potamogeton pectinatus cultivated for three asexual generations under
standardised conditions.
Depth distribution of tuber characteristics
Variation in tuber characteristics over burial depth in the sediment was not significantly
affected by initial tuber size (Table 1). Clones differed significantly in all variables
describing the distribution of tuber production, number and size over burial depth
(Table 1). Genotypic-tuber-size had a significant effect on the distribution of total tuber
production and tuber number over burial depth, but not on tuber size (Table 1; Fig. 6).
Clones that produced smaller tubers (e.g. low genotypic-tuber-size) placed a larger
proportion of their tubers (as biomass and number) in the upper sediment layer than did
clones that produced larger tubers (Fig. 6a, b). Individual tubers were larger in the deeper
64
number shallow / number deep production shallow / production deep
Population responses to propagule predation
0.8
(a)
0.6
0.4
more tuber biomass deep
0.2
2.0
(b)
more tubers shallow
1.5
1.0
0.5
more tubers deep
0.0
0.70
size shallow / size deep
more tuber biomass shallow
(c)
tuber size more equal over depth
0.60
0.50
0.40
tubers deep much larger
0.30
7
8
9
10
11
12
13
14
15
genotypic-tuber-size
(tuber size year 2, in mg dw)
Figure 6 Effect of variation in genetically determined tuber size (genotypic-tuber-size) on the
distribution of tuber characteristics over burial depth in the sediment. Genotypic-tuber-size was
estimated as the geometric mean size of tubers produced after two clonal generations of growth
under standardised conditions (i.e. in year 2). (a) depth ratio of total tuber production per plant
(b) depth ratio of number of tubers per plant and (c) depth ratio of geometric mean tuber size. The
depth ratio was obtained by dividing the variable’s value in the upper sediment layer by the value
in the deeper sediment layer. Solid and dashed lines represent significant and non-significant
linear regressions respectively. Data points are average values per clone (n = 15).
65
Chapter 3
sediment layer, but the sizes of ‘shallow’ and ‘deep’ tubers were kept proportionally equal
to each other across all genotypes (Fig. 6c). Introducing tuber production instead of
initial tuber size as a covariate did not modify these results (Table 1), except for the
existence of a significant, positive effect of tuber production on the distribution of tuber
size over burial depth (i.e. deep tubers become proportionally larger in plants with higher
tuber production).
Table 1 F-ratios of ANCOVAs analyzing the effect of genetically determined tuber size (genotypictuber-size: average size of tubers produced after two clonal generations of growth under
standardized conditions, see Fig 1.) on the distribution of tuber characteristics over burial depth.
Clone is a random categorical factor and genotypic-tuber-size is continuous. * P < 0.05, ** P < 0.01,
*** P < 0.001
Factor df, Error df:
Tuber characteristics
production shallow / production deep
number shallow / number deep
size shallow / size deep
Factor df, Error df:
Tuber characteristics
production shallow / production deep
number shallow / number deep
size shallow / size deep
Genotypictuber-size
1, 14
8.54*
8.52*
2.71
Genotypictuber-size
1, 14
8.26*
11.51**
4.33
Clone
14, 133
2.00*
3.96***
2.44**
Clone
14, 133
1.91*
2.98***
2.30**
Covariate:
Initial tuber
size
1, 133
0.09
0.06
0.32
Covariate:
Tuber
production
1, 133
0.24
0.4
7.78**
Population model
The simulations showed that, for virtually all combinations of predation pressure and
sediment type, a single genotype becomes dominant and all other genotypes become
extinct. There were two possible dominant genotypes, representing either the lowest or
the highest investment in small-shallow tubers (15 S and 45 S, thus the highest and
lowest investment in large-deep tubers). The small-shallow genotype 15 S was dominant
in sandy sediment and at low predation pressure (i.e. high ß), while the large-deep
genotype dominated in clay-rich sediment and at high predation pressure (Fig. 7a).
66
Population responses to propagule predation
a. Dominance at equilibrium
depth 40 & 200 mm, size S 45 & 95 mg fw
sediment type (% clay)
36
large, deep
tubers win
27
18
small, shallow
tubers win
all clones go
extinct
9
0.0001
0.001
0.1
0.01
1
predation pressure (b)
high
low
sediment type (% clay)
150
50
100
b. Time to equilibrium
36
200
250
27
300
200
150
100
18
50
9
0.0001
high
0.001
0.01
predation pressure (b)
0.1
1
low
Figure 7 Effect of sediment composition and predation pressure on (a) genotypic dominance, and
(b) time to equilibrium (shown as isoclines that indicate the number of generations taken until a
single genotype dominates the population and all others become extinct). In both graphs, the two
lines that mark the dominance regions of the ‘small-shallow’ (15 S = 15% small-shallow, 85% largedeep tubers) and the ‘large-deep’ (45 S = 45% small-shallow, 65% large-deep tubers) genotypes also
delimit the areas at which polymorphism was observed. Burial depth 40 and 200 mm, tuber size 45
and 95 mg fresh weight, for small-shallow and large-deep tubers respectively. Large ß corresponds
to low predation pressure and vice versa.
67
Chapter 3
Polymorphism was found in a narrow parameter region around the area where
dominant genotypes shift from large-deep to small-shallow tubers (from 15 S to 45 S). At
very high predation pressure all clones went extinct; populations dominated by largedeep genotypes were however able to tolerate higher predation pressures than those at
which small-shallow genotypes dominate (Fig. 7a, dotted line).
A dynamic analysis that explored the time taken to reach equilibrium (i.e.
dominance by a single genotype accompanied by extinction of all other genotypes)
showed that predation pressure has a strong influence in time to equilibrium,
particularly in clay-rich sediment (Fig. 7b). Equilibrium is quickly reached at high
predation pressure (i.e. under conditions resulting in high selection pressures), while it
may take more than 200 generations to be reached at low predation pressures and up to
300 generations when low predation pressure combines with intermediate sediment
types.
Varying the burial depth of the large-deep tubers (which was equivalent to
changing the increment in burial depth between shallow and deep tubers, since burial
depth of shallow tubers was not allowed to vary) had a strong impact on the parameter
region at which one or another genotype became dominant, but the general pattern of
variation remained unchanged (Fig. 8). At low burial depths, large-deep tubers always
dominate, since their competitive advantage is not offset by a decrease in sprouting
survival. The predation pressure that the population can withstand before getting extinct
increases, however, with increasing burial depth. At intermediate burial depths, either
small-shallow or large-deep tubers are dominant, depending on sediment type and
predation pressure (as described above). Within this region, increasing burial depth
results in an increasingly larger parameter region of dominance of small-shallow tubers.
The predation pressure that large-deep tubers can withstand is still larger at increasing
burial depth. At even higher burial depths, survival of large-deep tubers becomes very
low and small-shallow tubers always dominate the population. Populations dominated
by small-shallow tubers become extinct at low predation pressures (β ≤ 0.001; Fig. 8). In
summary, increasing the burial depth of large-deep tubers results in an increased
tolerance of the large-deep tuber genotype to tuber predation, but at the cost of
becoming invaded by the small-shallow tuber genotype at sandy sites and at low
predation pressures.
The effect of changes in propagule size (kept proportional for small and large
propagules, so that s1 / s2 did not vary) was explored under the two extreme sediment
types, sandy and clay-rich (9 and 36% clay, respectively). In both cases the pattern of
variation was comparable, though it took place at different values of tuber size (Y-axis in
Fig. 9). When tubers are small, small-shallow tubers dominate the population; as they
68
Population responses to propagule predation
Burial depth: 40 and 180 mm
large, deep
tubers win
27
18
small, shallow tubers win
all clones
go extinct
9
0.0001
low
predation pressure (b)
0.01
0.001
0.1
predation pressure (b)
high
high
36
sediment type (% clay)
sediment type (% clay)
36
1
Burial depth: 40 and 210 mm
large, deep
tubers win
27
18
small,
shallow
tubers win
all clones
go extinct
9
0.0001
0.01
0.001
155 mm
0.01
0.1
predation pressure (b)
high
low
218 mm
winner
depends on
sediment type
and predation
pressure
large, deep
tubers win
1
low
small,
shallow
tubers win
0.001
all clones go extinct
0.0001
40
60
80
100
120
140
160
180
200
220
240
260
average burial depth of deep tubers (mm)
Figure 8 Effect of the burial depth of the large-deep tubers on the results of the population model.
The lowest values (40 mm) correspond to the burial depth of the small-shallow tubers. Increasing
burial depth results in a shift in dominance, from large-deep tubers to small-shallow tubers (lower
panel), through an intermediate parameter region at which both genotypes may dominate
(exemplified in the two upper panels). The level of predation that the population can withstand
without becoming extinct (‘maximum predation level’) also increases with increasing burial depth,
until a threshold at which small-shallow tubers become dominant and maximum predation level
goes back to its minimum value. Large ß corresponds to low predation pressure and vice versa.
increase, large-deep tubers begin to dominate. The tuber size thresholds at which the
population becomes extinct and at which the large-deep tubers become dominant are
higher in sandy than in clay-rich sediment. Hence, for moderate departures from the
tuber sizes used in the model (indicated by an arrow on the Y-axis of Fig. 9), the shift in
dominance described above (from small-shallow tubers in sandy sediment to large-deep
tubers in clay-rich sediment) will remain unchanged. The ‘large-deep tubers’ genotype
69
Chapter 3
would dominate at all sediment types if tubers increase by at least 55% (from 45 to 70 mg
fw, for the small-shallow tubers). If tuber size decreases by at least 11% (from 45 to 40 mg
fw, for the small-shallow tubers), the genotype producing the highest proportion of
small-shallow tubers will dominate at all sediment types. In that case, the population will
get extinct at sandy sediments, and threshold clay-content values for extinction become
larger as tuber size decreases.
Discussion
Genotypic variation in tuber size and burial depth
The significant, positive relationship found between the size of newly-produced tubers
from plants grown for two and three generations at standardised (common-garden)
conditions and from tubers of comparable size implies that tuber size has a strong
genetic component. The value of the slope obtained by GMR regression on these newlyproduced tuber sizes indicates a high broad-sense heritability of 1.01 for this trait.
Within the range of standardised initial tuber sizes used we still found a significant
contribution of non-genetic maternal effects (mediated by initial tuber size) on the size
of newly-produced tubers, which lasted for two generations of growth under
standardised conditions and disappeared in the third generation (see for grandmaternal
effects Went 1959; Alexander & Wulff 1985; Miao et al. 1991; Wulff et al. 1999). The
negative correlation between field-tuber size and year-2 tuber size may result from a
negative effect of tuber size standardisation on clones producing large tubers, since these
may have optimised their growth physiology and/or allocation patterns to grow from
large tubers (for example, they might make a less economic use of tuber reserves). This
effect was confirmed by path analysis on tuber production: after correcting for genotypic
effects, plants that had large tubers when initially collected in the field showed reduced
tuber production following growth from standard tuber sizes in year 2. The simultaneous
disappearance of size-mediated maternal effects on both tuber size and tuber production
in year 3 also indicates that the correlation between field-tuber size and tuber production
observed in year 2 were exclusively due to long-lasting carry-over effects and, more
importantly, that our last clonal generation was totally free of environmentally-induced
carry-over effects mediated by tuber size.
Santamaría & Rodríguez-Gironés (2002) had already shown that in the field larger
tubers occur deeper in the sediment. However, it was not clear whether this reflected
variation within or among genotypes. Our results show clearly that there is genotypic
variation in the placement of tubers over burial depth, which translates into variation in
70
Population responses to propagule predation
Clay-rich sediment (36% clay)
169
large, deep tubers win
60
127
40
40
small, shallow tubers win
40
20
all clones go extinct
0
0.0001
high
80
size of large tuber (mg fw)
sediment type (% clay)
80
0
0.001
0.01
0.1
predation pressure (b)
1
low
Sandy sediment (9% clay)
169
60
127
small, shallow tubers win
40
40
all clones go extinct
20
0
0.0001
high
40
size of large tuber (mg fw)
sediment type (% clay)
large, deep tubers win
0
0.001
0.01
predation pressure (b)
0.1
1
low
Figure 9 Effect of tuber size (increased proportionally for the small-shallow, left Y-axis, and largedeep tubers, right Y-axis) on the results of the population model at clay–rich and sandy sediment
conditions. The arrow at the Y-axis indicates the tuber size value at which the standard model
simulations were performed. Large ß corresponds to low predation pressure and vice versa.
genotypic-tuber-size. Genotypes producing larger tubers did so through an increased
tuber production (both as biomass and number) in the deeper sediment layer. Tuber
size, on the other hand, increased from the upper to the lower sediment layers in a
71
Chapter 3
comparable fashion for all genotypes. Plants with a higher productivity produced
relatively larger tubers in the deeper layers, a fact that would increase the survival of
tubers placed in deep burial-depth refuges since sprouting mortality decreases with tuber
size (Santamaría & Rodríguez-Gironés 2002). The relation between plant productivity
and tuber size distribution over depth is not caused by variation in initial tuber size
(since the latter was not significant when entered as a covariate in the analysis), probably
because of the limited variation in initial size achieved through tuber size
standardisation. Instead, this relationship most likely reflects uncontrolled experimental
variation in environmental parameters, for example, due to shading by the container
walls or to variation among containers.
Genetic variation in tuber size (resulting from variation in tuber burial depth) did
not result in an opposite pattern of variation in tuber number, since there was not a sizenumber trade-off over the complete range of tuber sizes. A genetic trade-off between size
and number (Stuefer et al. 2002) was apparent at sizes above 15 mg dw, resulting in a
cost of approximately 8 tubers per plant for a size increase of 1 mg dw (as estimated from
a four-parameters model with two linear slopes and a Xopt breaking point, fitted by
minimizing the RSS). Below this threshold, however, tuber productivity decreased
sharply, resulting in decreases in both tuber size and number. Though the existence of
fixed costs for the construction of each individual tuber (i.e. independent of its size)
could result in a levelling-off of the size-number trade-off at small tuber sizes, it is not
consistent with the decrease in tuber production and the sharp decrease in tuber number
observed at small sizes. Instead, we propose that the decrease in tuber production for
genotypes with small tubers may be related to physiological effects, which relate to the
dual function of tubers as reproductive structures and storage organs. Owing to their
function as carbohydrate sinks, large tubers may stimulate carbon fixation through the
quick removal of photosynthates from the aboveground organs, which in turn results in
an increased storage and thus in higher tuber production (Sweet & Wareing 1966;
Herold 1980). Under this assumption, the quadratic relationship between tuber size and
productivity would indicate that tuber size and number have interchangeable effects on
carbon fixation and storage only for a limited range of tuber sizes. The effect of sourcesink relationships and physiological constrains as factors influencing propagule
production and its allocation into size and number is an area deserving further study.
Clonal dynamics under swan predation
P. pectinatus shows high variability in tuber size and burial depth in our field locality
(Lake Lauwersmeer, The Netherlands). This variability has been attributed to spatial
variation in sprouting mortality and swan predation pressure that results from changes
72
Population responses to propagule predation
in local sediment type (Santamaría & Rodríguez-Gironés 2002). In this study we have
also shown that tuber size has a heritable component, there is a trade-off between tuber
size and number although it levels off at small tuber sizes, and genotypes producing large
tubers position relatively more tubers (in biomass and number) at deeper burial depths
than small-tuber genotypes do. All this indicates that natural selection on tuber size may
take place in the population examined, since the trait is heritable, there is variation for
the trait within the population and the observed spatial variation corresponds well to
variation in (putative) selection pressure. The simulations of a population model that
incorporates also the effect of plant density on per capita productivity and of tuber size
on plant competition confirmed this possibility. Variation in sediment type and swan
predation pressure resulted in strong changes in selection pressure. In most cases, a
single genotype dominated and all others were strongly selected against, and disappeared
from the population. Small changes in sediment composition resulted in a complete
change in dominance. Sediment composition had a much stronger effect than predation
pressure on genotype dominance at equilibrium, while predation pressure strongly
reduced the time it takes to reach such equilibrium. As hypothesised, dominance of
genotypes producing larger tubers results in higher population resilience to high
predation pressure. It is interesting to note, however, that the placement of tubers at deep
burial depths increases the survival of large-tuber genotypes at high predation pressure,
but results in a loss of competitive advantage at low predation pressure and/or in sandy
sites. In other words, there is a trade off between predation avoidance and competitive
advantage, mediated by the cost of using burial-depth refuges.
An important result of the simulations is that tuber size polymorphism is
practically absent from the explored parameter space. The population was almost always
dominated by either the genotype producing the largest or the smallest genotypic-tubersize. This contrasts with the results of this and another experiment (Santamaría &
Rodríguez-Gironés 2002), which after collection of a relatively low number of genotypes
in the field reported multiple tuber-size genotypes characterised by intermediate (rather
than extreme) biomass allocations into small-shallow and large-deep tubers (Fig. 6a).
This paradox may be explained by at least three different factors, which are not mutually
exclusive, namely (1) time to equilibrium, (2) sensitivity to tuber size, and (3) constraints
in size-number allocation. First, time to equilibrium was larger than 50 generations for
most of the modelled parameter space, while the field population studied is less than 50
years old (the Lauwerszee estuary was closed in 1969). Thus, dominance by a single
genotype may not have been reached yet in the field. Second, model results were fairly
sensitive to variation in average tuber size (i.e. for both small-shallow and large-deep
tubers), which is likely to occur as a result of environmental carry-over effects. For
73
Chapter 3
example, stochastic inter-annual variation in climate and/or in water quality may result
in large changes in plant productivity (Beekman et al. 1991), an effect known to influence
both the number and size of the tubers (see above). For a given point of the parameter
space, changes in average tuber size influence whether selection pressure favours smallshallow or large-deep tubers; hence, the result of stochastic variation in tuber size will
most likely be fluctuating selection and the maintenance of polymorphism. On the other
hand, inter-annual variation in swan predation pressure is unlikely to have comparable
effects, since it influences the strength of selection (correlated with time to equilibrium)
rather than its direction (indicated by the dominant genotype). We must also keep in
mind that, although the model assumed that plants produced two types of tubers (small
and large tubers of a fixed size and placed at a certain depth), in real populations there is
a continuum of sizes and burial depth. The extrapolation of the model results, therefore,
must proceed with care. Third, we observed a constraint on size-number allocation, due
to decreased tuber production by genotypes with either very small or very large tubers.
Outside the range of genotypes studied here, tuber production is probably too low to
assure genotype survival. Hence, genotypes with extreme allocations were not observed
in the field. Within the observed range, the quadratic relationship between tuber
production and tuber size was not incorporated into the model, and will probably favour
the persistence of sub-optimal genotypes. A previous optimisation model (Santamaría &
Rodríguez-Gironés 2002) predicted optimal tuber size and burial depth to be maximal in
sandy sites at high predation pressure, but their optimal tuber size calculated under
predation is much larger than the size utilised here for the large-deep tubers and
observed in the field (150 and 240 mg fw for clay-rich and sandy sediment, respectively).
Such very large tubers are only found in the field in very low frequencies. An exploration
of the contribution of carry-over effects, and in particular whether it would increase the
fitness on large-tuber genotypes in sandy sites under high predation, was precluded due
to current lack of knowledge on the specific contribution of genotypic and carry-over
effects and their interaction to the regulation of propagule size.
In summary, our results show that variation in tuber size and burial depth
observed in the field for P. pectinatus has a heritable component. A population model
indicated that under the ranges of spatial variation in predation pressure and sediment
type observed in the field, selection pressure will favour locally a single genotype: either
small-shallow or large-deep genotypes. Since the trait is heritable, there is variation for
the trait within the population and the observed spatial variation correspond well to
predicted variation in selection pressure, natural selection on tuber size may be expected
to take place in the population examined. Polymorphism was not predicted by the
74
Population responses to propagule predation
model, yet it was observed in the field. As possible contributors to the persistence of
polymorphism, we propose: (1) the young age of the population, in relation to the time
frame set by model predictions; (2) the quadratic relationship between tuber size and
number, due to decreased tuber production at small sizes; (3) temporal stochasticity,
mediated by environmental effects on plant productivity and tuber size rather than by
inter-annual changes in swan predation pressure.
Acknowledgements
We would like to thank T. de Boer, T. Dekkers and K. Swart for their technical assistance and O.
Langevoord for help with the graphics. Furthermore we would like to thank J. van Groenendael
and M. Klaassen for critical comments.
References
Alexander, H.M. & Wulff, R.D. (1985) Experimental ecological genetics in Plantago X. The effects
of maternal temperature on seed and seedling characteristics in P. lanceolata. Journal of
Ecology 73: 271-282.
Antonovics, J. & Schmitt, J. (1986) Paternal and maternal effects on propagule size in
Anthoxanthum odoratum. Oecologia 69: 277-282.
Banovetz, S.J. & Scheiner, S.M. (1994) The effects of seed mass on the seed ecology of Coreopsis
lanceolata. American Midland Naturalist 131: 65-74.
Beekman, J.H., van Eerden, M.R., & Dirksen, S. (1991) Bewick's Swans Cygnus columbianus
bewickii utilising the changing resource of Potamogeton pectinatus during autumn in the
Netherlands. Wildfowl Supplement 1: 238-248.
Black, J.N. (1956) The influence of seed size and depth of sowing on preemergence and vegetative
growth of subterranean clover (Trifolium subterraneum L.). Australian Journal of
Agricultural Research 7: 98-109.
Black, J.N. (1958) Competition between plants of different initial seed sizes in swards of
subterranean clover (Trifolium subterraneum L.) with particular reference to leaf area and
the light microclimate. Australian Journal of Agricultural Research 9: 299-318.
Casper, S.J. & Krausch, H.D. (1980) Pteridophyta und Anthophyta. Fischer, Stuttgart.
Chacon, P. & Bustamante, R.O. (2001) The effects of seed size and pericarp on seedling
recruitment and biomass in Cryptocarya alba (Lauraceae) under two contrasting moisture
regimes. Plant Ecology 152: 137-144.
Dohm, M.R. (2002) Repeatability estimates do not always set an upper limit to heritability.
Functional Ecology 16: 273-280.
75
Chapter 3
Eriksson, O. (1999) Seed size variation and its effect on germination and seedling performance in
the clonal herb Convallaria majalis. Acta Oecologica 20: 61-66.
Ganeshaiah, K.N. & Uma Shaanker, R. (1991) Seed size optimization in a tree Butea monosperma:
a trade-off between seedling establishment and pod dispersal efficiency. Oikos 60: 3-6.
Geritz, S.A.H., van der Meijden, E., & Metz, J.A.J. (1999) Evolutionary dynamics of seed size and
seedling competitive ability. Theoretical Population Biology 55: 324-343.
Herold, A. (1980) Regulation of photosynthesis by sink activity-the missing link. New Phytologist
86: 131-144.
Huber, H., Stuefer, J.F., & Willems, J.H. (1996) Environmentally induced carry-over effects on seed
production, germination and seedling performance in Bunium bulbocastanum (Apiaceae).
Flora 191: 353-361.
Lloyd, D.G. (1987) Selection of offspring size at independence and other size-versus-number
strategies. American Naturalist 129: 800-817.
Miao, S.L., Bazzaz, F.A., & Primack, R.B. (1991) Persistence of maternal nutrient effects in
Plantago major: the 3rd generation. Ecology 72: 1634-1642.
Moegenburg, S.M. (1996) Sabal palmetto seed size: Causes of variation, choices of predators, and
consequences for seedlings. Oecologia 106: 539-543.
Mogie, M., Latham, J.R., & Warman, E.A. (1990) Genotype-independent aspects of seeds ecology
in Taraxacum. Oikos 59: 175- 82.
Mojonnier, L. (1998) Natural selection on two seed-size traits in the common morning glory
Ipomoea purpurea (Convolvulaceae): Patterns and evolutionary consequences. American
Naturalist 152: 188-203.
Morse, D.H. & Schmitt (1985) Propagule size, dispersal ability, and seedling performance in
Asclepias syriaca. Oecologia 67: 372-379.
Nelson, D.M. & Johnson, C.D. (1983) Stabilizing selection on seed size in Astragalus
(Leguminosae) due to differential predation and differential germination. Journal of
Kansas Entomological Society 56: 169-174.
Nolet, B.A., Langevoord, O., Bevan, R.M., Engelaar, K.R., Klaassen, M., Mulder, R.J.W., & Van
Dijk, S. (2001) Spatial variation in tuber depletion by swans explained by differences in net
intake rates. Ecology 82: 1655-1667.
Prinzie, T.P. & Chmielewski, J.G. (1994) Significance of achene characteristics and within-achene
resource allocation in the germination strategy of tetraploid Aster pilosus var. pilosus
(Asteraceae). American Journal of Botany 81: 259-264.
Ricker, W.E. (1984) Computation and uses of central trend lines. Canadian Journal of Zoology 62:
1897-1905.
Rodríguez-Gironés, M.A., Sandsten, H., & Santamaría, L. (2003) Asymmetric competition and the
evolution of propagule size. Journal of Ecology 91: 554-562.
Rossiter, M.C. (1996) Incidence and consequences of inherited environmental effects. Annual
Review of Ecology and Systematics 27: 451-476.
76
Population responses to propagule predation
Santamaría, L. & Rodríguez-Gironés, M.A. (2002) Hiding from swans: optimal burial depth of sago
pondweed tubers foraged by Bewick's swans. Journal of Ecology 90: 303-315.
Schaal, B.A. (1980) Reproductive capacity and seed size in Lupinus texensis. American Journal of
Botany 67: 703-709.
Smith, C.C. & Fretwell, S.D. (1974) The optimal balance between size and number of offspring.
American Naturalist 108: 499-506.
Sokal, R.R. & Rohlf, F.J. (1995) Biometry. 3 edn. WH Freeman and company, New York.
Stanton, M.L. (1984) Seed variation in wild radish: effect of seed size on components of adult
fitness. Ecology 65: 1105-1112.
Stuefer, J.F., van Hulzen, H., & During, H.J. (2002) A genotypic trade-off between the number and
size of clonal offspring in the stoloniferous herb Potentilla reptans. Journal of Evolutionary
Biology 15: 880-884.
Sweet, W.G. & Wareing, P.F. (1966) Role of plant growth in regulating photosynthesis. Nature 210:
77-79.
Van Groenendael, J.M. & Habekotté, B. (1988) Cyperus esculentus L. biology, population
dynamics, and possibilities to control this neophyte. Zeitschrift für PflanzenKrankheiten,
PflanzenPathologie und PflanzenSchutz Sonderheft XI: 61-69.
Van Wijk, R.J. (1989) Ecological studies on Potamogeton pectinatus L .3. Reproductive strategies
and germination ecology. Aquatic Botany 33: 271-299.
Vaughton, G. & Ramsey, M. (1998) Sources and consequences of seed mass variation in Banksia
marginata (Proteaceae). Journal of Ecology 86: 563-573.
Venable, D.L. (1992) Size-number trade-offs and the variation of seed size with plant resource
status. American Naturalist 140: 287-304.
Verburg, R. & During, H.J. (1998) Hibernacle size-number trade-off and size dependent success of
clonal offspring of a woodland pseudo-annual. In: The witch at the Forest floor:
reproductive allocation and clonal diversity in the pseudo-annual Circaea lutentiana L., pp.
37-51. PhD-thesis University Utrecht.
Vos, P., Hogers, R., Bleeker, M., Reijans, M., Vandelee, T., Hornes, M., Frijters, A., Pot, J., Peleman,
J., Kuiper, M., & Zabeau, M. (1995) AFLP: a new technique for DNA-fingerprinting.
Nucleic Acids Research 23: 4407-4414.
Weis, Y.M. (1982) The effects of propagule size on germination and seedling growth in Mirabilis
hirsuta. Canadian Journal of Botany 60: 1868-1874.
Weller, S.G. (1985) Establishment of Lithospermum caroliniensis in sand dunes: the role of nutlet
mass. Ecology 66: 1893-1901.
Went, F.W. (1959) Effects of environment of parent and grandparent generations on tuber
production by potatoes. American Journal of Botany 46: 277-282.
Wiegleb, G. & Kaplan, Z. (1998) An account of the species of Potamogeton L. (Potamogetonaceae).
Folia Geobotanica 33: 241-316.
Winn, A.A. (1988) Ecological and evolutionary consequences of seed size in Prunella vulgaris.
Ecology 69: 1537-1544.
77
Chapter 3
Wulff, R.A. (1986a) Seed size variation in Desmodium paniculatum II. Effects on seedling growth
and physiological performance. Journal of Ecology 74: 99-114.
Wulff, R.A. (1986b) Seed size variation in Desmodium paniculatum III. Effects of reproductive
yield and competitive ability. Journal of Ecology 74: 115-121.
Wulff, R.D., Causin, H.F., Benitez, O., & Bacalini, P.A. (1999) Intraspecific variability and maternal
effects in the response to nutrient addition in Chenopodium album. Canadian Journal of
Botany 77: 1150-1158.
78
Population responses to propagule predation
Appendix: Population model
The model divides the plant’s life-cycle in three subsequent phases: (1) tuber sprouting in
spring; (2) plant growth during summer and tuber production in autumn, including the
effect of intra-specific competition on individual plant yield; (3) tuber mortality during
winter and the effect of tuber predation by Bewick’s swans upon it.
Tuber sprouting in spring
The probability that a tuber of size s (in mg fw) buried at a depth d (in mm) sprouts
successfully in spring is modelled as in Santamaría & Rodríguez-Gironés (2002):
g(d, s) = c(s) – b(s) · d ,
[1]
c(s) = max [0, 1 – c · exp(-γs) ]
[2]
b(s) = b1 + b2 · s
[3]
where
The relationship between maximum spring survival c(s) (i.e. the probability of
successfully sprouting from the sediment surface) and tuber size is determined by c and
γ. Different values of b1 and b2 describe how the rate at which survival decreases with
burial depth varies with tuber size. Parameter values for c, γ, b1 and b2 were estimated
from experimental data, as described in Santamaría & Rodríguez-Gironés (2002).
Plant growth during summer and tuber production in autumn
Population productivity (as tuber production for the whole population, r(n), in g dw of
tubers) increased with population density nspring (number of plants L-1 sediment)
following a rectangular hyperbola, as
r(nspring) = rm · nspring /( nspring + hr) + m,
[4]
where rm represents the maximum population productivity, hr is a half-saturation
constant (i.e. the population density at which half of maximum productivity is reached),
and m is the curve’s intercept. Parameter values for rm, hr and m were estimated from
experimental data using least-squares fits (Rodríguez-Gironés et al. 2003), and up-scaled
to model a population that occupies an area of 100 m2 and exploits a sediment layer of
200 mm thickness (rm = 0.299, hr = 4.52, m = 0.212).
The effect of intra-specific competition on individual plant yield during the
growth season was modelled using a modification of Geritz et al. (1999) model, which
uses relative instead of absolute size differences. This modification was found to be a
better descriptor of size-dependent competition between P. pectinatus plants grown in a
79
Chapter 3
common–garden experiment (Rodríguez-Gironés et al. 2003). The general formulation
of the model describes the amount of resources ri captured by a plant growing from a
propagule of size si as
ri =
eα ⋅log (si )
α ⋅ log (s j ) ,
e
∑
[5]
j
where α (the ‘competitive asymmetry coefficient’) describes the competitive advantage of
the larger propagule (Rodríguez-Gironés et al. 2003). Since the model involves different
proportions of tubers of only two possible sizes (s1 and s2), a plant grown from a
propagule of size s1 obtains an amount of resources equal to
((
)
)
r1 r nspring , ni , si =
(
r nspring
)
α ⋅log( s2 s2 )
n1 + n2 ⋅ e
,
[6]
where r(nspring) is the value of population productivity described in equation [4], and n1
and n2 are respectively the number of tubers per litre of sizes s1 and s2 in the population.
The value of α was calculated from experimental data using least-squares fits ( alpha =
3.78, Rodríguez-Gironés et al. 2003).
For each genotype, resource capture equals the resource capture of all its ramets
(clonally-produced, individual plants). Since all ramets grown from a given genotype will
allocate a fixed proportion of their resources to small (s1) and large (s2) tubers, the
number of e.g. small tubers produced by a given genotype equals its total resource
capture (in g dw of tubers) times the resource allocation to small tubers, divided by tuber
size (also in g dw).
Tuber survival during winter
Tuber survival during winter is the product of two terms:
w(WS, f(ß, d).) = WS ∙ f(ß, d).
[7]
WS describes survival to over-wintering in the absence of predation (assumed to be
constant and independent of tuber size and burial depth, Santamaría & RodríguezGironés 2002). f(ß, d) describes escape from swan predation, which increases with burial
depth and is independent of tuber size. Since the probability that a tuber survives must
80
Population responses to propagule predation
be between 0 and 1, f(ß, d) is modelled by the function:
f(ß,d) = max [0, 1 – a · exp(-ßd) ],
[8]
where d represents burial depth (in mm) and ß represents predation pressure
(Santamaría & Rodríguez-Gironés 2002). Lower values of ß correspond to increasing
predation pressures. For sufficiently low values of ß (ß < 0.005), f(ß, d) is essentially
linear in the studied depth range (0 to 250 mm). Parameter values were estimated by
fitting the equations to field data, as described in Santamaría & Rodríguez-Gironés
(2002) (WS = 0.85, a = 1.042).
In the field, sediment composition showed large spatial variation. The parameter
values for tuber sprouting (equations 1 to 3) and winter survival (equation 7 and 8) were
estimated separately for the two extremes of sediment composition found in our field site
(see Santamaría & Rodríguez-Gironés 2002). Parameter values for intermediate sediment
types were estimated by linear interpolation, using the proportion of clay particles as an
independent variable that describes sediment composition. The effect of variation in
sediment type was simulated by changing the parameters in equations 1 to 3 and 7 and 8
accordingly, while keeping all other parameters constant. Increasing predation pressure
was simulated, by decreasing the value of ß (in equations 7 and 8) while keeping all other
parameters constant.
81
Chapter 4
Local adaptation of the pondweed Potamogeton pectinatus to
contrasting substrate types mediated by changes in propagule
provisioning1
Abstract
We studied local adaptation to substrate type within a population of the clonal aquatic
macrophyte Potamogeton pectinatus and the role that genotypic variation in propaguleprovisioning plays therein. P. pectinatus reproduces mainly by means of subterranean
asexual propagules (tubers), whose survival and sprouting success depends on the
interaction of factors such as the size of tubers, substrate type and predation risk by
Bewick’s swans. We studied a population of P. pectinatus in which genotypes producing
large tubers predominate at the sandy shore and those producing small tubers at the
clay-rich shore. Clonal lines originating from different shores were grown on a sandy
and a clay-rich substrate in a common-garden. Plants from all clonal lines were grown
from tubers of a comparable size range, but the various clones from within each shore
differed in the average size of tubers they are genetically determined to produce. The
performance of all clones was much lower on sandy substrate than on clay-rich substrate,
indicating that the former is a stressful (nutrient-poor) environment. The reaction
norms of morphological traits varied significantly among clones, revealing genetic
variation in phenotypic plasticity. However, these differences were not related to our
correlates of fitness (total tuber biomass, tuber size and tuber number). We found no
evidence of local adaptation independent of genotypic tuber size. Instead, tuber size
mediated local adaptation: clones producing larger tubers had a higher fitness in sandy
substrate, while clones producing smaller tubers had a higher fitness in clay-rich
substrate. Our results imply that diversifying selection for tuber size takes place between
the two substrate types and confirms the importance of tuber-size provisioning for local
adaptation to substrate heterogeneity.
1
H.H. Hangelbroek, L. Santamaría & T. de Boer (2003) Journal of Ecology 91: 1081-1092
Chapter 4
Introduction
Local adaptation of populations to specific environmental conditions is a well-known
phenomenon (e.g. Van Tienderen & Van der Toorn 1991; Jordan 1992; Nagy & Rice
1997; McKay et al. 2001). In such populations, genotypes are genetically specialized to
their local environment, where they show enhanced fitness. Fitness of these genotypes in
non-native environments is, however, suboptimal. Specialization may be expected to
occur when contrasting phenotypes show enhanced fitness in contrasting environments
and intermediate static phenotypes cannot evolve due to developmental constraints (Van
Tienderen 1991) or when intermediate phenotypes have lower fitness in both
environments.
In heterogeneous environments, local adaptation to particular environmental
conditions may also occur within populations, on a much smaller geographical scale. For
this to happen contrasting selection pressures must be strong (Van Tienderen 1997) and
gene flow must be low (Slatkin 1985), which is not common within populations.
Nevertheless, local adaptation has been reported at small geographical scales in response
to abiotic factors such as heavy metals (Bradshaw 1960; Jain & Bradshaw 1966), wind
(Jain & Bradshaw 1966) and elevation (Galen et al. 1991), or to biotic factors such as
interspecific competition (Prati & Schmid 2000) and herbivory (Sork et al. 1993). In
heterogeneous environments selection may also lead to generalist genotypes that have
high levels of phenotypic plasticity. Plastic genotypes may perform well in all the various
environments yet be accompanied by costs of plasticity (Bradshaw 1965). Phenotypic
plasticity does not necessarily preclude local adaptation; it is possible that local
adaptation involves contrasting plastic responses (i.e. changes in the reaction norms)
among genotypes from the populations or subpopulations growing in contrasting
environments. Yet one must also bear in mind that phenotypic plasticity is not
automatically adaptive. Non-adaptive plasticity may result from reduced growth under
low-resource conditions ('inevitable plasticity' Sultan 1995), from random variation in
traits that have no fitness effects ('neutral plasticity' Alpert & Simms 2002) or from
correlation with selected traits. Last of all, plastic responses may also involve major
reorganization of the relationships among traits, thus influencing the way in which
phenotypic integration is maintained across environments (Schlichting 1986, 1989). Of
particular importance are changes in the relative contribution of each trait to fitness
from one environment to another (e.g. Schlichting 1989; Pigliucci et al. 1995).
Many aspects of substrate type may affect the environment as experienced by
plants. These include organic content, redox potential, particle density and nutrient
availability. In particular, the effect of nutrient availability on clonal plants has received
84
Local adaptation to substrate type
increasing attention (De Kroon & Knops 1990; Schmid & Bazzaz 1992; De Kroon &
Hutchings 1995; Arredondo & Johnson 1999; Dong & Alaten 1999; Fransen et al. 1999).
Variation in response to substrate conditions in plants has been reported for, for
instance, biomass allocation, shoot biomass, leaf-area ratio and total rhizome length
(Lotz & Blom 1986; Idestam-Almquist & Kautsky 1995). If such traits increase fitness in
particular environments and the trait shows heritable variation, local adaptation may
eventually occur. We address whether the clonal pondweed Potamogeton pectinatus L.
shows within-population local adaptation to contrasting substrate types. A sandy and a
clay-rich shore within the same lake lay only 55 to 225 metres apart and neutral markers
showed no neutral genetic differentiation between plants originating from the two shores
(Φct < 0.001, P = 0.73, Hangelbroek et al. 2002). This indicated un-restricted gene flow
and the plants are therefore considered to be part of the same population.
Several studies on P. pectinatus have reported the existence of different ecotypes
(Van Wijk et al. 1988; Vermaat & Hootsmans 1994), while others revealed high levels of
phenotypic plasticity (Van Wijk 1988; Idestam-Almquist & Kautsky 1995; Pilon &
Santamaría 2002) and yet others uncovered neutral genetic differentiation between
populations (Mader et al. 1998; King et al. 2002) and high genetic variation within
populations (Hangelbroek et al. 2002). These findings are in agreement with the concept
that common plant species, such as P. pectinatus, possess both high phenotypic plasticity
and large genetic variation (Bradshaw 1984; Bazzaz 1986). We consider whether static
ecotypes, high phenotypic plasticity or a combination of both (i.e. ecotypes possessing
distinct plastic responses) occur within a single population.
A previous study by Santamaría & Rodríguez-Gironés (2002) revealed a potential
relationship between local adaptation and genotypic variation in propagule size.
Santamaría & Rodríguez-Gironés (2002) showed that P. pectinatus clones from the sandy
shore produced larger tubers (below-ground asexual propagules) than those from the
clay-rich shore, following growth under standardized conditions. In a follow-up
experiment by Hangelbroek, Santamaría & Rodríguez-Gironés (unpublished
manuscript) this difference in tuber size production was shown to have a large genetic
basis (i.e. a broad-sense heritability estimate of H2 = 1.01). Their experiment was based
on 15 clonal lines grown for three generations under standardized, common-garden
conditions. In the second and third year of cultivation, only tubers of a comparable size
range were planted for each clone (i.e. no differences in initial tuber sizes existed between
clones). In both years, the size of the tubers produced by the plants at the end of the
growth season differed significantly between clones, even though they were grown from
tubers of comparable sizes. The slope of the regression between the produced tuber size
of the second and third generation was interpreted as a measure of trans-generational
85
Chapter 4
trait repeatability and under the assumption of negligible environmental effects, as a
measure of broad-sense heritability (Dohm 2002).
Santamaría & Rodríguez-Gironés (2002) argued that this genotypic difference in
propagule provisioning may be the result of two separate factors. Firstly, higher foraging
pressure by Bewick’s swans on tubers in the sandy sites may lead to stronger selection for
deeply buried tubers that have a higher probability of escaping foraging. Secondly,
deeper burial depths and higher sprout mortality in sandy sites promote larger tuber
sizes, because sprout survival increases with size and decreases with depth (see also
Spencer 1987). However, the potential costs of propagule provisioning, or benefits of
local adaptation to substrate type during the growth phase were not addressed by
Santamaría & Rodríguez-Gironés (2002). In sandy and clay-rich areas, tuber
provisioning is likely to involve different energetic and functional costs as a result of
differential nutrient availability. Under nutrient limitation, plants are likely to experience
two contrasting effects. On the one hand, a decreased investment in photosynthetic
tissue and its enzymatic machinery (which are typically costly in terms of nutrients) will
result in a decreased supply of carbohydrates to newly growing tubers (i.e. an increased
cost of tuber biomass production, e.g. Saulnier & Reekie 1995). On the other hand, the
decreased demand of carbohydrates for growth (as the latter is nutrient-limited) will
result in an increased allocation to carbohydrate storage (i.e. a decreased cost of tuber
biomass production). The relative importance of the two effects will be modulated by the
number of tubers produced per plant, which may in turn be limited by plant size (i.e. by
the numbers of apical meristems in the rhizome). Different costs of propagule
provisioning in sandy vs. clay-rich substrate may interfere with the selection pressure
favouring large-tuber-producing clones in sandy substrate postulated by Santamaría &
Rodríguez-Gironés (2002), thus constraining or promoting the effects of diversifying
selection for tuber size between the two substrate types.
We used an experimental set-up aimed at dissecting the relative contribution of
propagule provisioning as opposed to other morphological, biomass and allocation traits,
to the response to substrate type of P. pectinatus genotypes from the sandy and clay-rich
subpopulations. The following questions were specifically addressed: (a) How do
vegetative and (asexual) reproductive traits respond to the different substrate types? Do
trait relationships (phenotypic integration) differ between substrate types, revealing
changes in the determinants of fitness? (b) Has local adaptation to substrate type taken
place within this population? If so, is it related to adaptive static differences or to
differences in plastic responses (i.e. reaction norms) of the traits analysed? (c) Is local
adaptation to substrate type mediated by genotypic variation in propagule provisioning?
86
Local adaptation to substrate type
If so, is it consistent with the patterns reported from the field population, i.e. do plants
making larger tubers perform better in the sandy sites?
Material and methods
Species and study system
Potamogeton pectinatus (Potamogetonaceae) is a clonal submerged angiosperm with a
wide geographical distribution, ranging from the subtropics to the subarctic (Casper &
Krausch 1980; Wiegleb & Kaplan 1998). In temperate regions it has a pseudo-annual life
cycle, i.e. plants senesce every autumn, surviving exclusively by means of asexual
propagules (tubers) formed at the apex of the underground rhizomes (Van Wijk 1988).
No dormant tuber bank is formed; all tubers that survive the winter start a new life cycle
in spring. Seed production also takes place but local recruitment is low; hence, seeds are
generally thought to contribute to population re-establishment following disturbances or
to long distance dispersal by waterfowl (Van Wijk 1989a). However, Hangelbroek et al.
(2002) detected high clonal diversity within the population studied here (number of
genets / number of ramets = 0.76), suggesting that seedling recruitment may be sufficient
to maintain high levels of genotypic diversity.
The studied population is situated in the Babbelaar, a former river branch of the
Lauwerszee estuary in the Netherlands that became part of Lake Lauwersmeer following
its closure in 1969 (Fig.1). A deep-water gully, approximately 55 to 225 m wide, separates
the population into two non-connected beds of P. pectinatus, which occupy shores of
contrasting substrate type (Nolet et al. 2001). The depth of the water gully prevents
plants from growing across the gully; however, water-mediated dispersal of seeds,
dislodged tubers or other plant fragments may take place. Every autumn, Bewick’s swans
forage on P. pectinatus upon arrival from their migratory flight from the tundra, before
turning to other available food sources (Beekman et al. 1991). Swans consume on average
39% of the tuber bank available in autumn, and show preferential consumption and
lower giving-up thresholds (thus resulting in increased tuber predation) in sandy than in
clay-rich substrate (Nolet et al. 2001).
Sampling and cultivation of clonal lines
We used a selection of clonal lines obtained as described in Santamaría & RodríguezGironés (2002): in April 1997 tubers were collected from the two subpopulations
occupying the two shores of the study population (Fig. 1). Within each subpopulation
sampling took place in either two or three sites approximately 200 m apart. Sites number
87
Chapter 4
Lauwersmeer
Babbelaar
5
4
3
2
1
P. pectinatus bed
land
sampling site
0
100m
Figure 1 Study area of a population of Potamogeton pectinatus in the Babbelaar, a branch of Lake
Lauwersmeer (the Netherlands). Dark grey: land; light grey: dense beds of P. pectinatus; white:
deep-water gully; white rectangles: sampling sites. Sites 1 and 2: clay-rich shore; sites 3, 4 and 5:
sandy shore.
one and two, located on the clay-rich shore, contained, respectively, 36 and 17% clay (i.e.
percentage of substrate particles < 63 µm, Santamaría & Rodríguez-Gironés 2002). Sites
three, four and five, located on the sandy shore, contained only 8 - 9% clay (Santamaría
& Rodríguez-Gironés 2002). At each site, 18 tubers were collected from nine random
sampling points chosen on a 24-point 1 m x 1 m grid (Fig. 2). At each sampling point,
the largest and smallest tuber present in a standard sample of substrate (12 cores of 7 cm
∅ and 30 cm length, making a total volume of 13.8 L) were selected for cultivation. The
tubers were kept at 4 °C to continue their hibernation period until the beginning of
spring in May 1997.
To obtain clonal replicates of the tubers and to minimise the influence of
potential carry-over effects from the different maternal environments, the tubers
collected from the field were then grown in outdoor, common-garden conditions for a
88
Local adaptation to substrate type
1m
One site with 9 random sampling points
where one small and one large tuber were sampled
9 x 2 tubers
sampled
per site
Common-garden
Harvest +
tuber size
measurement
Selection
of 3 clones
with different Standardized
genotypic- tuber size range
planted
tuber-sizes
small
8x
8x
sand
tuber
production
medium
8x
8x
hibernation
at 4 °C
clay
sand
large
f
tuber size
hibernation
at 4 °C
8x
clay
8x
sand
clay
18 x
winter
sampling
spring - summer - autumn
common environment prior to experiment
winter
spring - summer - autumn
experiment
Figure 2 Selection and cultivation of clones and experimental design at each of five sampling sites.
Upper diagram: sampling method within a site. One small and one large tuber were sampled from
each of nine random sampling points. Lower diagram: the 18 tubers were propagated in a
common-garden set-up and their tuber size production was recorded (insets). Insets: frequency
distribution of the tuber sizes produced by each clone. Three clones were selected based on
differences in average size of tubers produced under common-garden conditions (genotypic-tubersize, small, medium or large). From each of these three clones, 16 tubers with a comparable size
range (between dashed lines in inset) were selected, and half planted in a clay-rich substrate and
half in a sandy substrate. They were grown in common-garden conditions until harvested in
autumn.
complete season (May-October 1997). Each tuber was grown in a 5.5-L pot containing a
mixture of commercial potting clay and river sand (1 : 3 dry weight) placed in 1 m3 tanks
filled with tap water. The mixture ratio of clay and sand was chosen because it had
proven to be a successful mixture for clonal propagation of P. pectinatus clones
originating from diverse environments (Pilon & Santamaría 2002) and was intermediate
between the two substrate-types used later. The tubers produced were then harvested
and individually weighed (fresh weight, fw), before hibernation at 4 °C until May 1998.
In order to preserve the tuber stock for various experiments, tuber dry weights (dw) were
89
Chapter 4
estimated from fresh- to dry-weight regressions fitted on a subsample of the harvested
tubers (dw = 0.34 x fw, R2 = 0.95, n = 60).
To study the effect of genetically based differences in tuber size (hereafter referred
to as genotypic-tuber-size), clones that had produced different average tuber sizes under
common garden conditions were selected. Clones from both subpopulations were
assigned to one of three genotypic-tuber-size classes according to whether they had
produced small (average size 6-12 mg dw), medium (16-19 mg dw) or large tubers (23-29
mg dw). To be able to distinguish between potential effects related to the substrate of
origin of the clones and their genotypic-tuber-size, we selected clones for the three
different genotypic-tuber-sizes within each subpopulation (one clone per genotypictuber-size per sampling site, making a total of 3 x (2 + 3 sites) = 15 clones for the whole
experiment; Figs. 1 & 2). This means that the experimental design does not reflect the
actual frequencies of genotypic-tuber-size within each subpopulation, but a factorial
combination of origin and genotypic-tuber-size.
Amplified fragment length polymorphism (AFLP) analysis was carried out to test
whether lines did indeed represent 15 different clones, according to Vos et al. (1995). All
clones were distinguished from one another with the usage of the primer combination:
EcoRI + ACC / MseI + CTT.
Experimental design
The size of the planted tubers (initial tuber size, n = 16 per clone) was standardized to a
comparable size range for all clones (average ± se = 15 ± 10 mg dw), to minimise the
influence of (non-genetic) phenotypic maternal effects. The initial tuber sizes within
each clonal line were selected as evenly as possible across the range to have comparable
sizes and variation in sizes used between clones, despite their different genotypic-tubersizes (see insets Fig. 2) this was possible because of the relative abundance of small tubers
within all clonal lines (as tuber size distribution is right-skewed) and the large tuber
stocks available for the experiment. We had tested whether initial tuber size indeed
varied comparably between the different genotypic-tuber-size classes by conducting an
ANCOVA designed as for all other traits (as below) with initial tuber size as the
dependent variable. Initial tuber size did not vary significantly between genotypic-tubersize classes, subpopulations or treatments, or any of their two-way interactions, although
it was significantly affected by the random factor `clone´. Hence, to further account for
the potential effects of this remaining variation in initial tuber size (within the
standardized range reported above), we included it as a covariate in the statistical
analyses.
90
Local adaptation to substrate type
At the end of May, the selected tubers were pre-sprouted in trays filled with sand
and placed in an outdoor tank filled with local ground water. After a week, eight
sprouted tubers per clone per substrate treatment were randomly-selected and
transferred to 5.5-L pots containing a substrate mixture with either a high or a low clay
content (making a total of 2 substrate treatments x 15 clones x 8 replicates = 240 pots for
the complete experiment). The high-clay treatment was achieved by mixing commercial
potting clay and washed aquarium sand in a dry-weight ratio of clay : sand equals 1 : 2,
resulting in 36% clay particles as indicated by Malvern analysis, and the low clay by a 1 :
20 mixture (7% clay particles). Hereafter these treatments are referred to as ‘clay-rich’
and ‘sandy’. Laboratory analysis confirmed that the clay-rich mixture had a much higher
nutrient content (1.6-fold more P, 4.1-fold more N and 4.6- fold more K; Table 1).
Carbon was not included in the nutrient analysis since C-uptake is from the watercolumn by above-ground plant parts (Van Wijk 1989b). The substrate mixture in the
pots was covered with a 2-cm layer of washed sand to minimise leakage of nutrients into
the water-column and the resulting algal growth. The size of the pots was large enough to
prevent nutrient limitation in the clay-rich substrate (Rodríguez-Gironés et al. 2003) and
did not play a role in the sandy substrate treatment, as only a small fraction of the pot
surface was occupied by the plants (as a result of nutrient-limitation). The pots were
distributed over 12 tanks (0.9 x 1.1 m2, water depth 0.55 m) filled with local groundwater
and situated in an outdoor common-garden facility at Heteren (the Netherlands). Four
of these tanks were randomly assigned to each of the three genotypic-tuber-size classes.
Within each genotypic-tuber-size class, plants from the different clones (five clones per
tank, belonging to two subpopulations) were randomly assigned to the two different
substrate treatments and distributed over the corresponding four tanks (20 pots per
tank), i.e. following a split-block design with two fixed factors randomized within a
random factor. Both the 12 tanks and the various clone x treatment combinations within
tanks were randomly interspersed to avoid position effects. Water was added whenever
necessary, and algal growth was controlled by adding waterfleas (Daphnia) at the onset
of the experiment.
Plants were harvested at the end of the growth season (beginning of October) to
ensure that full potential asexual reproduction had taken place, but early enough to
recover all vegetative plant material (shoots, rhizomes and roots). A single plant emerges
from each tuber producing a single branching rhizome along which multiple shoots are
produced. After measuring several morphological traits (the number of nodes and total
length of both the rhizome and the longest shoot), plants were separated into aboveground, below-ground and tuber fractions for biomass determination (dry weight, after
48 h at 70 °C). In large rhizomes, morphological variables were estimated on a
91
Chapter 4
subsample, and total length recalculated using a regression of length vs. dry-weight.
Tubers were counted and their individual (fresh) weights measured. Tuber dry weights
were estimated from fresh- to dry-weight regressions based on a subsample of tubers and
carried out for each substrate treatment separately (sandy substrate: dw = 0.30 x fw, R2 =
0.94, n = 210; clay-rich substrate: dw = 0.35 x fw, R2 = 0.95, n = 210). Reproductive
allocation was estimated as the ratio between tuber and total biomass (in dw) and
rhizome thickness as rhizome mass per cm (mg dw cm-1).
As yearly recruitment depends almost exclusively on tuber production, total tuber
biomass (as dry weight per plant) was used as the main fitness surrogate. In addition, we
also considered both tuber number and tuber size, as both affect different components of
fitness (i.e. the number of asexual propagules vs. their potential for survival and growth)
but often are negatively correlated (i.e. there is a size-number trade-off, e.g. Santamaría
& Rodríguez-Gironés 2002).
Table 1 Nutrient concentration in the two substrate mixtures used
Dry weight ratio: clay : sand
Total N %a
Organic C %a
Soluble P ppmb
K ppmc
NO3 ppmc
NH4 ppmc
Na ppmd
Mg ppmd
Fe ppmd
Clay-rich treatment
1:2
0.34
4.93
8.56
7.82
4.22
1.09
32.48
102.94
1.13
Sandy treatment
1 : 20
0.08
1.00
5.28
1.69
3.60
0.82
13.72
26.71
1.19
a
: element analyzer, continuous flow interface, isotope ratio mass spectrometry (IRSM)
: optical emission spectroscopy (OES)
c
: segmented flow analyse optical emission spectroscopy (SFA-OES)
d
: inductive coupled plasma optical emission spectroscopy (ICP-OES)
b
Data analysis
All variables were analysed by means of mixed-models ANCOVAs using the General
Linear Models module of Statistica 5.5 (StatSoft 1999). The experimental unit was a
single pot (i.e. plant). Sites were pooled within subpopulations, resulting in six clones
from the clay–rich subpopulation and nine from the sandy subpopulation. The model
included genotypic-tuber-size, subpopulation and substrate treatment as fixed factors
92
Local adaptation to substrate type
and clone and tank as random factors. The random factor tank was nested within
genotypic-tuber-size; hence, the effect of the latter was estimated from on an error term
equivalent to the tank x genotypic-tuber-size interaction (i.e. 1 tank = 1 replicate).
Subpopulation and substrate treatment were nested within random factor tank, i.e. this
part of the design is equivalent to a split-block ANOVA (Steel & Torrie 1981). Random
factor clone was nested within the interaction between subpopulation and genotypictuber-size, and initial tuber size was included as a covariate. Note that for simplicity, Fratios for random factor tank are not shown in Table 2 as they do not result in
interpretable tests of hypotheses. All variables were transformed (square root, arcsin√ or
log 10 (x+1)) to assure homoscedasticity and normality of residuals. Individual tuber
weights were log 10 (x+1) transformed before averaging within each pot, as the original
data were strongly right skewed (see Table 2). The three-way interaction between
subpopulation, genotypic-tuber-size and substrate treatment was not significant for any
trait and was therefore left out of the analyses.
Phenotypic plasticity of those traits for which substrate x genotypic-tuber-size
interactions were significant were subsequently analysed using one-way ANOVAs. For
this purpose, the average phenotypic plasticity of each trait was calculated for each clone
according to Cheplick (1995):
(
)
⎡ X − X sand ⎤
PPc = ⎢ clay
⎥ × 100,
X clay
⎥⎦
⎣⎢
where X is the clone’s average in either the clay-rich or sandy treatment. PPc is thus
the percentage change from the clay-rich treatment to the sandy treatment. In the
ANOVAs, genotypic-tuber-size was entered a fixed factor.
Phenotypic integration (Schlichting 1986; Pigliucci & Marlow 2001; Relyea 2001)
between nine phenotypic traits was measured separately for the two substrate treatments.
Pearson correlations between pairs of traits were calculated, using the average values of
each clone (Statistica 5.5 1999). All traits were transformed (as above) to assure
normality of residuals and linearity of relationships. The relationships were visualized in
correlation networks, where changes in the pattern of the trait integration between
treatments indicate differential relationships between traits at different environments
(Schlichting 1986). In addition, the correlation networks were used to identify changes in
the relationships between fitness and non-fitness traits at different environments.
93
Chapter 4
Results
The substrate treatment had highly significant effects on all measured traits except the
internode lengths of shoots and rhizomes (Tables 2 and 3). All fitness-related traits (total
tuber biomass, tuber number and tuber size), as well as vegetative biomass, reproductive
allocation and shoot to root ratio, were significantly lower in the sandy treatment (Tables
2 and 3). Plants growing in sandy substrate had significantly shorter and thicker
rhizomes, and shorter shoots, than those growing in clay-rich substrate (Tables 2 and 3).
The two original subpopulations differed only in a few traits: total tuber biomass and
rhizome internode length were significantly larger for clones from the clay-rich than
from the sandy subpopulation (Table 2). The interaction of substrate and subpopulation
had no significant effects on any of the traits measured (Table 2).
Genotypic-tuber-size had a significant effect on produced tuber size (Table 2).
Significant increases in tuber size occurred from small through medium to large
genotypic-tuber-size classes (P < 0.05, Tukey post-hoc tests), confirming that tuber size
had a genetic component. The interaction between substrate and genotypic-tuber-size
was significant for all fitness-related traits (total tuber biomass, tuber number and tuber
size), vegetative biomass and rhizome length (Table 2, Fig. 3). Total tuber biomass was
comparable for all genotypic-tuber-size classes in the clay-rich treatment; however, in the
sandy treatment the clones from the small class had a significantly lower total tuber
biomass (P < 0.05, Tukey post-hoc tests, Fig. 3a). Tuber number showed the opposite
trend: it was comparable for all genotypic-tuber-size classes in the sandy treatment, while
it was lower for the large than for the small size class in the clay-rich treatment (P < 0.05,
Tukey post-hoc tests, Fig. 3b). Tuber size varied significantly among all three genotypictuber-size classes in the sandy treatment, while in the clay-rich treatment it was
comparable for the medium and large classes and smaller for the small class (P < 0.05,
Tukey post-hoc tests, Fig. 3c). Vegetative biomass was larger for the small and medium
than for the large genotypic-tuber-size class in clay-rich substrate, but in the sandy
substrate it decreased significantly from the largest to the smallest genotypic-tuber-size
class (P < 0.05, Tukey post-hoc tests, Fig. 3d). Rhizome length showed a comparable
pattern, although the small and medium genotypic-tuber-size also differed significantly
in the clay-rich treatment. In general, when interactions between substrate and
genotypic-tuber-size occurred, plasticity decreased with increasing genotypic-tuber-size
class (Fig. 3; one-way ANOVA and Tukey post-hoc tests on phenotypic plasticity, Table
4).
The random factor clone significantly affected tuber size, reproductive allocation
and rhizome thickness (Table 2). The interaction between clone and substrate was
94
Local adaptation to substrate type
significant for all morphological, biomass yield and allocation traits, but it was not
significant for fitness-related traits (total tuber biomass, tuber number and tuber size,
Table 2). Initial tuber size had significant effects on nearly all traits; only shoot to root
Table 2: F-ratios and significance levels of nested analyses of covariance (ANCOVA) on
morphological traits, biomass yield and allocation traits, and traits concerning asexual
reproduction of Potamogeton pectinatus grown on two contrasting substrate types. The results of
an ANCOVA on the size of the planted tubers (initial tuber size) is also presented. ST stands for
Substrate treatment; SP for Subpopulation; C for Clone; GTS for Genotypic-tuber-size which
stands for size classes of clones that are genetically determined to produce either small, medium or
large tubers. * P < 0.05, ** P < 0.01, *** P < 0.001
Df
Error df
ST
SP
GTS
1
1
2
11
4.22
Initial tuber size
C
ST
x
SP
ST
x
GTS
ST
x
C
1
2
11
9-10
9-16 10-11 11
11
3.86
3.86
9
5.31** 0.83
0.75
SP covariate:
x
Initial
GTS tuber size
2
191-193 9
0.81
1
191-192
0.17
Asexual reproduction
total tuber biomassa
1173***
7.30* 0.79
1.33
0.27 10.99*** 1.11
0.36 16.80***
1098***
3.01
0.31
2.69
0.04
0.54 5.95*
544***
0.01
4.79* 8.44*** 0.73 13.89** 1.22
vegetative biomassa
329***
1.45
0.17
0.98
0.72
4.39*
4.16*** 0.92 11.71***
shoot to root ratioa
320***
2.79
1.43
1.46
3.21
0.26
2.09*
asexual reproductive
139***
0.87
1.51
3.26
2.86
0.26
2.92** 0.84 0.42
338***
0.22
0.10
1.74
0.18
4.41*
2.59** 0.16 11.97***
tuber number
b
average tuber sizec
7.79** 1.22
1.69 14.30***
Biomass yield & allocation
0.75 2.77
allocationd
Morphology
rhizome lengtha
a
rhizome internode length
6.11* 1.00
0.81
1.93
2.17
4.20*** 1.60 2.12
rhizome thicknessa
46.95***<0.01 0.04
2.97
4.07
0.37
1.29
2.20* <0.01 4.04*
shoot lengtha
22.52*** 1.32
1.05
0.26
1.46
3.06*** 0.07 9.15**
0.66
shoot internode lengtha
0.86 1.73 1.80 1.08 <0.01 0.55
a
: log (x + 1)
b
: square-root
c
: individual tuber sizes log (x+1)-transformed before average per plant
d
: arcsin square-root
4.09*** 0.51 0.16
95
Chapter 4
ratio, asexual reproductive allocation, and rhizome and shoot internode lengths were not
affected (Table 2).
Genotypic-tuber-size
2.5
b
b
2.1
tuber number (sqrt)
9
a
a
a
2.9
b.
a
ab
b
7
5
c
c
c
c
1.7
1.2
tuber size (mean log (x+1))
a.
3
c.
a
a
1.0
b
c
d
0.8
e
0.6
clay-rich
sandy
substrate treatment
vegetative biomass (log (x+1))
total tuber biomass (log (x+1))
3.3
large
medium
small
2.9
d.
a
a
b
2.5
c
cd
d
2.1
1.7
clay-rich
sandy
substrate treatment
Figure 3 Effect of genotypic differences in propagule provisioning (genotypic-tuber-size) on the
response of Potamogeton pectinatus clones grown on clay-rich and sandy substrate from tubers of
comparable size. (a) total tuber biomass, mg dw; (b) tuber number; (c) average tuber size, mg dw;
(d) vegetative biomass, mg dw. Different letters represent significant differences (Tukey post-hoc
tests, P < 0.05). Based on the averages of five clones per genotypic-tuber-size class.
96
Local adaptation to substrate type
Phenotypic integration varied between substrate treatments (Fig. 4). Overall, the
number of significant relationships was larger for the sandy than for the clay-rich
treatment. Significant correlations of total tuber biomass with tuber number, vegetative
biomass and reproductive allocation, of vegetative biomass with tuber size, tuber number
and rhizome thickness, and of reproductive allocation with rhizome thickness and shoot
to root ratio, occurred in sandy but not in clay-rich substrate. Significant correlations of
tuber number with tuber size and reproductive allocation, and of vegetative biomass with
reproductive allocation were, however, found in clay-rich but not in sandy substrate.
Only two correlations, namely that of tuber size with total tuber biomass and with
reproductive allocation, were significant in both treatments. Internode lengths of
rhizomes and shoots were not correlated with any other traits in either treatment.
Table 3 Mean ± se values of morphological traits, biomass yield and allocation traits, and traits
concerning asexual reproduction of 15 clones of Potamogeton pectinatus grown on contrasting
substrate types. Means differ at P < 0.001 for all traits except rhizome and shoot internode lengths
where P > 0.05.
Clay-rich substrate
Asexual reproduction
total tuber biomass (mg dw)
tuber number
average tuber size (mg dw)a
Biomass yield & allocation
vegetative biomass (mg dw)
shoot to root ratio (in dw)
asexual reproductive
allocation (%, dw)
Morphology
rhizome length (cm)
rhizome internode length (cm)
rhizome thickness (mg dw / cm)
shoot length (cm)
shoot internode length (cm)
Sandy substrate
890.6 ± 110.4
61.4 ± 9.1
11.0 ± 2.1
121.7 ± 50.4
14.3 ± 2.9
6.4 ± 1.7
590.3 ± 120.5
2.5 ± 0.5
60.2 ± 4.8
131.9 ± 42.5
1.0 ± 0.2
46.5 ± 5.3
338.6
3.1
0.5
16.5
1.6
± 74.8
± 0.5
± 0.1
± 3.9
± 0.3
83.5
2.9
0.8
11.5
1.5
±
±
±
±
±
22.0
0.6
0.2
2.9
0.4
a
: geometric mean for each clone , averaged among clones
97
Chapter 4
Table 4 F-ratios of ANOVAs on the phenotypic plasticity values of 15 clones of Potamogeton
pectinatus grown on clay-rich and sandy substrate. Genotypic-tuber-size stands for size classes of
clones that are genetically determined to produce either small, medium or large tubers. * P < 0.05,
*** P < 0.001
Genotypic-tuber-size (GTS)
Df, Error df
2, 12
Phenotypic plasticity of:
total tuber biomass
tuber number
average tuber size
vegetative biomass
rhizome length
6.45*
4.88*
14.28***
4.63*
3.81
a. Clay-rich substrate
b. Sandy substrate
total
tuber biomass
total
tuber biomass
vegetative
biomass
tuber number
asexual
reproductive
allocation
tuber size
shoot to root
ratio
shoot
internode
length
rhizome
thickness
rhizome
internode
length
vegetative
biomass
tuber number
asexual
reproductive
allocation
tuber size
shoot to root
ratio
shoot
internode
length
rhizome
thickness
rhizome
internode
length
Figure 4 Phenotypic integration of morphological, physiological and fitness-related traits of 15
Potamogeton pectinatus clones grown on (a) clay-rich substrate and on (b) sandy substrate. Solid
lines represent significant positive correlations; dashed lines represent significant negative
correlations (Pearson correlation tests, P < 0.05). Based on the averages of 15 clones.
Discussion
Plastic responses to substrate type
Substrate composition had major effects on all clones, regardless of the subpopulation
they originated from or the genotypic-tuber-size class they belonged to. Biomass yield
and fitness-related traits (total tuber biomass, number and size) were much lower in
98
Local adaptation to substrate type
sandy than in clay-rich substrate, indicating that the sandy substrate can be considered as
stressful for all clones. Tuber number varied more between substrate treatments than did
tuber size, supporting the view that selection acts on propagule size rather than on
number, and thus that size is more stable than number (Smith & Fretwell 1974; Lloyd
1987; Vaughton & Ramsey 1998).
Substrate types reflect different nutrient levels, and, on this basis, responses were
comparable with those of terrestrial plants: above- and below-ground biomass, shoot
length and reproductive allocation were all larger in nutrient rich (clay) conditions (Lotz
& Blom 1986; Landhäusser et al. 1996; Mabry et al. 1997), probably resulting from
inevitable rather than adaptive plasticity (Sultan 1995). Rhizome internode length did
not differ between substrate types, similar to most reports for terrestrial rhizomatous
plants (Dong & de Kroon 1994; Dong et al. 1996). Of the only two traits with plastic
responses that could be interpreted as adaptive, increased allocation to roots in sandy
substrate can be taken to indicate an increased investment in nutrient as opposed to light
capture, with likely fitness benefits in the respective environments, whereas increased
rhizome thickness (in contrast to decreased stolon thickness in terrestrial stoloniforous
plants growing in nutrient-poor substrate, Price & Hutchings 1992) may reflect increased
storage when C is in excess due to N and P deficiency. Indeed, vegetative biomass and
rhizome thickness were positively correlated in the sandy but not in the clay-rich
substrate, which indicates that biomass accumulation under nutrient limitation primarily
involves carbohydrate storage in the rhizome. This also supports the view that rhizomes,
in contrast to stolons, are more likely to serve as storage organs than as foraging devises
(Dong & de Kroon 1994; Dong et al. 1996; Dong & Alaten 1999).
Phenotypic integration of traits was higher in sandy than in clay-rich substrate,
most likely as a result of greater size dependence of traits in nutrient-limiting conditions.
This agrees with the idea that stressful environments may promote enhanced phenotypic
integration (Schlichting 1986). Phenotypic integration also varied qualitatively among
treatments. Positive correlations between total tuber biomass (our surrogate of plant
fitness) and vegetative biomass, reproductive allocation and tuber number in sandy
substrate were absent in clay-rich substrate, where total tuber biomass correlated
exclusively with tuber size. Phenotypic integration networks thus indicate an increased
dependency of total tuber biomass on plant biomass and reproductive allocation in
sandy substrate. The relationship between total tuber biomass and tuber number in
sandy substrate may be attributed to meristem limitation, where reduced plant size
results in shorter rhizomes with few apical tips available for tuber formation (as
compared with larger plants with longer, well-branched rhizomes in clay-rich substrate).
99
Chapter 4
Local adaptation independent of propagule provisioning
We did not find any evidence of local adaptation through either static traits or plastic
responses. First of all, non-significant substrate x subpopulation interactions for
(asexual) fitness traits indicate a lack of home-versus-away differences that could be
interpreted as local adaptation. The higher total tuber biomass of clones from the clayrich subpopulation implies that it has a higher (asexual) fitness in both substrate types, a
difference that (given our experimental protocol) most likely arises from genotypic
differences between subpopulations. Although the grand-maternal nutrient environment
might still have an effect on the performance of the clones, e.g. as in Wulff et al. (1999),
the lack of subpopulation differences in total tuber biomass reported by Santamaría &
Rodríguez-Gironés (2002) in the first generation after collection suggests that such
effects are unlikely to account for the differences in total tuber biomass described here.
Secondly, we did not find any significant trait differences between subpopulations
that can be interpreted as static traits of adaptive value in their local environments. The
only significant difference, i.e. longer rhizome internodes in the clay-rich subpopulation,
is unlikely to be of adaptive value as: (i) it does not result in local-versus-away differences
in fitness traits (see above); (ii) network diagrams did not reveal any relationship
between internode length and fitness traits (neither positive in clay-rich substrate, nor
negative in sandy substrate); and (iii) previous studies reporting significant plastic
variation in rhizome internode length as a response to substrate type (e.g. Dong et al.
1997) indicate that internodes become longer in resource-poor environments to facilitate
foraging for nutrients (i.e. the opposite pattern to that found here).
Thirdly, the subpopulations did not respond differently in biomass yield and
allocation or morphology to the substrate treatments (i.e. we found no significant
substrate x subpopulation effects for these traits measured), indicating that they are not
locally adapted through differential phenotypic plasticity to local substrate type. Local
adaptation was not constrained by lack of genotypic variation onto which selection could
act: nearly all morphological, biomass yield and allocation responses to substrate varied
significantly among clones (significant clone x substrate interactions), indicating the
existence of genotypic variation in phenotypic plasticity to substrate type within both
subpopulations (similar to the responses of terrestrial plant species to a variety of
ecological factors, e.g. Cheplick 1995; Skálová et al. 1997; Prati & Schmid 2000).
However, these clonal differences were not accompanied by corresponding differences in
fitness (non-significant clone x substrate interaction). This may indicate that variation in
plasticity to substrate type is essentially neutral or that comparable fitness is achieved
through varying combinations of plasticity in different traits (e.g. Sultan & Bazzaz 1993).
100
Local adaptation to substrate type
Local adaptation through propagule provisioning
Our results indicate that, in the population under study, local adaptation to substrate
type is mediated by genetically based changes in propagule provisioning. The effects of
genotypic-tuber-size on fitness-related traits (total tuber biomass, tuber number and
tuber size) depended highly on substrate type and were consistent with the differences in
genotypic-tuber-size observed between subpopulations by Santamaría & RodríguezGironés (2002), i.e. we found an increased fitness of large genotypic-tuber-size clones in
sandy substrate, whereas small genotypic-tuber-size clones had an increased fitness in
clay-rich substrate. Indeed, genotypic-tuber-size affected size-number allocation but not
total tuber biomass in clay-rich substrate, while in sandy substrate clones that produce
larger tubers showed enhanced total tuber biomass without a detectable trade-off in
terms of tuber number. These results are in contradiction with the expectation of
increased costs of propagule provisioning in nutrient-poor conditions (Saulnier & Reekie
1995), which would result in decreased fitness of large genotypic-tuber-size clones in
sandy substrate. Instead, the positive correlation between genotypic-tuber-size and total
tuber biomass might be a consequence of the stimulating effect that a larger sink of C has
on photosynthesis (Sweet & Wareing 1966; Herold 1980). This possibility is fully
consistent with the meristem limitation in sandy substrate hypothesised above.
Our results are also consistent with the specialization hypothesis of Lortie &
Aarssen (1996), which proposed that clones specialized to stressful environments show
less plasticity in fitness traits than both generalists and genotypes specialized to nonstressful environments. In this case, sandy-substrate specialists with large genotypictuber-sizes were less plastic in biomass yield and fitness related traits, while clay-rich
substrate specialists with small genotypic-tuber-sizes were more plastic.
The higher fitness of clones with large genotypic-tuber-sizes in sandy substrate
may reinforce the selection pressure that favours large tubers in sandy sites, which results
from the higher sprouting survival and reduced predation risk of deeply buried, large
tubers (Santamaría & Rodríguez-Gironés 2002). In clay-rich substrate, on the other
hand, predation risk is low and sprouting survival high; hence, the production of small,
abundant tubers is optimal (Santamaría & Rodríguez-Gironés 2002) and selection
pressure should favour clones with small genotypic-tuber-size. Our results thus indicate
the presence of diversifying selection on tuber size, linked to substrate heterogeneity in
our field population.
Conclusions
This study revealed that local adaptation to substrate type within the studied population
of P. pectinatus was mediated by genetically determined differences in propagule
101
Chapter 4
provisioning. Our results show that clones producing larger tubers had a higher fitness in
sandy substrate, while clones producing smaller tubers had a higher fitness in clay-rich
substrate. This is consistent with the genotypic-tuber-size frequencies found in the field,
where clones that produce large tubers predominate in the sandy shore while clones that
produce small tubers predominate in the clay-rich shore. In contrast, local adaptation
independent of genotypic-tuber-size did not occur through either static traits or
differential plastic responses. Our results suggest that propagule provisioning is the only
trait that has contrasting fitness effects on plants growing in different substrate types,
reinforcing previous indications on the importance of tuber-size provisioning for
adaptation to substrate heterogeneity (Santamaría & Rodríguez-Gironés 2002).
Acknowledgements
We would like to thank T. Dekkers, K. Swart and H. de Jong for their technical assistance.
Furthermore, we would like to thank J. van Groenendael, N.J. Ouborg and three anonymous
reviewers for their critical comments. This is publication 3220 of The Netherlands Institute of
Ecology (NIOO-KNAW).
References
Alpert, P. & Simms, E.L. (2002) The relative advantages of plasticity and fixity in different
environments: when is it good for a plant to adjust? Evolutionary Ecology 16: 285-297.
Arredondo, J.T. & Johnson, D.A. (1999) Root architecture and biomass allocation of three range
grasses in response to nonuniform supply of nutrients and shoot defoliation. New
Phytologist 143: 373-385.
Bazzaz, F.A. (1986) Life history of colonizing plants: some demographic, genetic and physiological
features. In: Ecology of biological invasions of North America and Hawaii (eds H.A. Mooney
& J.A. Drake), pp. 96-110. Springer, Berlin.
Beekman, J.H., van Eerden, M.R., & Dirksen, S. (1991) Bewick's Swans Cygnus columbianus
bewickii utilising the changing resource of Potamogeton pectinatus during autumn in the
Netherlands. Wildfowl Supplement 1: 238-248.
Bradshaw, A.D. (1960) Population differentiation in Agrostis tenuis Sibth. Populations in varied
environments. New Phytologist 59: 92-103.
Bradshaw, A.D. (1965) Evolutionary significance of phenotypic plasticity in plants. Advances in
Genetics 13: 115-155.
102
Local adaptation to substrate type
Bradshaw, A.D. (1984) Ecological significance of genetic variation between populations. In:
Perspectives on plant population ecology (eds R. Dirzo & J. Sarukhán), pp. 213-228. Sinauer
Associates Inc, Sunderland.
Casper, S.J. & Krausch, H.D. (1980) Pteridophyta und Anthophyta. Fischer, Stuttgart.
Cheplick, G.P. (1995) Genotypic variation and plasticity of clonal growth in relation to nutrient
availability in Amphibromus scabrivalvis. Journal of Ecology 83: 459-468.
De Kroon, H. & Knops, J. (1990) Habitat exploration through morphological plasticity in two
chalk grassland perennials. Oikos 59: 39-49.
De Kroon, H. & Hutchings, M.J. (1995) Morphological plasticity in clonal plants: the foraging
concept reconsidered. Journal of Ecology 83: 143-152.
Dohm, M.R. (2002) Repeatability estimates do not always set an upper limit to heritability.
Functional Ecology 16: 273-280.
Dong, M. & de Kroon, H. (1994) Plasticity in morphology and biomass allocation in Cynodon
dactylon, a grass species forming stolons and rhizomes. Oikos 70: 99-106.
Dong, M. & Alaten, B. (1999) Clonal plasticity in response to rhizome severing and heterogeneous
resource supply in the rhizomatus grass Psammochloa villosa in an inner mongolian dune,
China. Plant Ecology 141: 53-58.
Dong, M., During, H.J., & Werger, M.J.A. (1996) Morphological responses to nutrient availability
in four clonal herbs. Vegetatio 123: 183-192.
Dong, M., During, H.J., & Werger, M.J.A. (1997) Clonal plasticity in response to nutrient
availability in the pseudoannual herb, Trientalis europaea L. Plant Ecology 131: 233-239.
Fransen, B., Blijjenberg, J., & De Kroon, H. (1999) Root morphological and physiological plasticity
of perennial grass species and the exploitation of spatial and temporal heterogeneous
nutrient patches. Plant and Soil 211: 179-189.
Galen, C., Shore, J.S., & Deyoe, H. (1991) Ecotypic divergence in Alpine Polemonium viscosum:
genetic structure, quantitative variation, and local adaptation. Evolution 45: 1218-1228.
Hangelbroek, H.H., Ouborg, N.J., Santamaría, L., & Schwenk, K. (2002) Clonal diversity and
structure within a population of the pondweed Potamogeton pectinatus foraged by Bewick's
swans. Molecular Ecology 11: 2137-2150.
Herold, A. (1980) Regulation of photosynthesis by sink activity-the missing link. New Phytologist
86: 131-144.
Idestam-Almquist, J. & Kautsky, L. (1995) Plastic responses in morphology of Potamogeton
pectinatus L. to sediment and above-sediment conditions at two sites in the northern Baltic
proper. Aquatic Botany 52: 205-216.
Jain, S.K. & Bradshaw, A.D. (1966) Evolution in closely adjacent plant populations I. The evidence
and its theoretical analysis. Heredity 21: 407-441.
Jordan, N. (1992) Path analysis of local adaptation in two ecotypes of the annual plant Diodia teres
Walt. (Rubiaceae). American Naturalist 140: 149-165.
103
Chapter 4
King, R.A., Gornall, R.J., Preston, C.D., & Croft, J.M. (2002) Population differentiation of
Potamogeton pectinatus in the Baltic Sea with reference to waterfowl dispersal. Molecular
Ecology 11: 1947-1956.
Landhäusser, S.M., Stadt, K.J., Lieffers, V.J., & McNabb, D.H. (1996) Rhizome growth of
Calamagrostis canadensis in response to soil nutrients and bulk densisty. Canadian Journal
of Plant Science 76: 545-550.
Lloyd, D.G. (1987) Selection of offspring size at independence and other size-versus-number
strategies. American Naturalist 129: 800-817.
Lortie, C.J. & Aarssen, L.W. (1996) The specialization hypothesis for phenotypic plasticity.
International Journal of Plant Sciences 157: 484-487.
Lotz, L.A.P. & Blom, C.W.P.M. (1986) Plasticity in life history traits of Plantago major L. ssp.
pleiosperma Pilger. Oecologia 69: 25-30.
Mabry, C.M., Jasienski, M., Coleman, J.S., & Bazzaz, F.A. (1997) Genotypic variation in Polygonum
pensylvanicum: nutrient effects in plant growth and aphid infestation. Canadian Journal of
Botany 75: 546-551.
Mader, E., van Viersen, W., & Schwenk (1998) Clonal diversity in the submerged macrophyte
Potamogeton pectinatus L. inferred from nuclear and cytoplasmic variation. Aquatic
Botany 62: 147-160.
McKay, J.K., Bishop, J.G., Lin, J.Z., Richards, J.H., Sala, A., & Mitchell-Olds, T. (2001) Local
adaptation across a climatic gradient despite small effective population size in the rare
sapphire rockcress. Proceedings of the Royal Society of London Series B-Biological Sciences
268: 1715-1721.
Nagy, E.S. & Rice, K.J. (1997) Local adaptation in two subspecies of an annual plant: Implications
for migration and gene flow. Evolution 51: 1079-1089.
Nolet, B.A., Langevoord, O., Bevan, R.M., Engelaar, K.R., Klaassen, M., Mulder, R.J.W., & Van
Dijk, S. (2001) Spatial variation in tuber depletion by swans explained by differences in net
intake rates. Ecology 82: 1655-1667.
Pigliucci, M. & Marlow, E.T. (2001) Differentiation for flowering time and phenotypic integration
in Arabidopsis thaliana in response to season length and vernalization. Oecologia 127: 501508.
Pigliucci, M., Whitton, J., & Schlichting, C.D. (1995) Reaction norms of Arabidopsis.1. Plasticity of
characters and correlations across water, nutrient and light gradients. Journal of
Evolutionary Biology 8: 421-438.
Pilon, J. & Santamaría, L. (2002) Clonal variation in the thermal response of the submerged aquatic
macrophyte Potamogeton pectinatus. Journal of Ecology 90: 141-152.
Prati, D. & Schmid, B. (2000) Genetic differentiation of life-history traits within populations of the
clonal plant Ranunculus reptans. Oikos 90: 442-456.
Price, E.A.C. & Hutchings, M.J. (1992) The causes and developmental effects of integration and
independence between different parts of Glechoma hederacea clones. Oikos 63: 376-386.
104
Local adaptation to substrate type
Relyea, R.A. (2001) Morphological and behavioural plasticity of larval anurans in response to
different predators. Ecology 82: 523-540.
Rodríguez-Gironés, M.A., Sandsten, H., & Santamaría, L. (2003) Asymmetric competition and the
evolution of propagule size. Journal of Ecology 91: 554-562.
Santamaría, L. & Rodríguez-Gironés, M.A. (2002) Hiding from swans: optimal burial depth of sago
pondweed tubers foraged by Bewick's swans. Journal of Ecology 90: 303-315.
Saulnier, T.P. & Reekie, E.G. (1995) Effect of reproduction on nitrogen allocation and carbon gain
in Oenothera biennis. Journal of Ecology 83: 23-29.
Schlichting, C.D. (1986) The evolution of phenotypic plasticity in plants. Annual Review of Ecology
and Systematics 17: 667-693.
Schlichting, C.D. (1989) Phenotypic integration and environmental change What are the
consequences of differential phenotypic plasticity of traits. Bioscience 39: (7) 460-464.
Schmid, B. & Bazzaz, F.A. (1992) Growth responses of rhizomatous plants to fertilizer application
and interference. Oikos 65: 13-24.
Skálová, H., Pecháèková, S., Suzuki, J., Herben, T., Hara, T., Hadincová, V., & Krahulec, F. (1997)
Within population genetic differentiation in traits effecting clonal growth: Festuca rubra in
a mountain grassland. Journal of Evolutionary Biology 10: 383-406.
Slatkin, M. (1985) Geneflow in natural populations. Annual Review of Ecology and Systematics 16:
393-430.
Smith, C.C. & Fretwell, S.D. (1974) The optimal balance between size and number of offspring.
American Naturalist 108: 499-506.
Sork, V.L., Stowe, K.A., & Hochwender, C. (1993) Evidence for local adaptation in closely adjacent
subpopulations of northern red oak (Quercus rubra L) expressed as resistance to leaf
herbivores. American Naturalist 142: 928-936.
Spencer, D.F. (1987) Tuber size and planting depth influence growth of Potamogeton pectinatus L.
American Midland Naturalist 118: 77-84.
StatSoft (1999) Statistica, version 5.5 Tulsa, Oklahoma.
Steel, R.G.D. & Torrie, J.H. (1981) Principles and procedures of statistics. A biometrical approach.
McGraw-Hill, Singapore.
Sultan, S.E. (1995) Phenotypic plasticity and plant adaptation. Acta Botanica Neerlandica 44: 363383.
Sultan, S.E. & Bazzaz, F.A. (1993) Phenotypic plasticity in Polygonum persicaria. III. The evolution
of ecological breadth for nutrient environment. Evolution 47: 1050-1071.
Sweet, W.G. & Wareing, P.F. (1966) Role of plant growth in regulating photosynthesis. Nature 210:
77-79.
Van Tienderen, P.H. (1991) Evolution of generalists and specialists in spatially heterogeneous
environments. Evolution 45: 1317-1331.
Van Tienderen, P.H. (1997) Generalists, specialists and the evolution of phenotypic plasticity in
sympatric populations of distinct species. Evolution 51: 1372-1380.
105
Chapter 4
Van Tienderen, P.H. & van der Toorn, J. (1991) Genetic differentiation between populations of
Plantago lanceolata. I. Local adaptation in three contrasting habitats. Journal of Ecology 79:
27-42.
Van Wijk, R.J. (1988) Ecological studies on Potamogeton pectinatus L .1. General characteristics,
biomass production and life cycles under field conditions. Aquatic Botany 31: 211-258.
Van Wijk, R.J. (1989a) Ecological studies on Potamogeton pectinatus L .3. Reproductive strategies
and germination ecology. Aquatic Botany 33: 271-299.
Van Wijk, R.J. (1989b) Ecological studies on Potamogeton pectinatus L .5. Nutritional ecology,
invitro uptake of nutrients and growth limitation. Aquatic Botany 35: 319-335.
Van Wijk, R.J., Van Goor, E.M.J., & Verkley, J.A.C. (1988) Ecological studies on Potamogeton
pectinatus L .2. Autecological characteristics, with emphasis on salt tolerance, intraspecific
variation and isoenzyme patterns. Aquatic Botany 32: 239-260.
Vaughton, G. & Ramsey, M. (1998) Sources and consequences of seed mass variation in Banksia
marginata (Proteaceae). Journal of Ecology 86: 563-573.
Vermaat, J.E. & Hootsmans, M. (1994) Intraspecific variation in Potamogeton pectinatus L.: a
controlled laboratory experiment. In: Lake Veluwe, a macrohyte dominated system under
eutrophication stress (eds W. Van Viersen, M. Hootsmans & J.E. Vermaat), pp. 26-39.
Kluwer Academic Publishers, Dordrecht.
Vos, P., Hogers, R., Bleeker, M., Reijans, M., Vandelee, T., Hornes, M., Frijters, A., Pot, J., Peleman,
J., Kuiper, M., & Zabeau, M. (1995) AFLP: a new technique for DNA-fingerprinting.
Nucleic Acids Research 23: 4407-4414.
Wiegleb, G. & Kaplan, Z. (1998) An account of the species of Potamogeton L. (Potamogetonaceae).
Folia Geobotanica 33: 241-316.
Wulff, R.D., Causin, H.F., Benitez, O., & Bacalini, P.A. (1999) Intraspecific variability and maternal
effects in the response to nutrient addition in Chenopodium album. Canadian Journal of
Botany 77: 1150-1158.
106
11.1, 0.004 329***
11.2, 0.011 320***
11.1, 0.007 139***
1, 1.23
1, 3.61
1, 1.03
1, 0.020
1, 0.044
1, 0.005
1, <0.001 9.2, 0.039
1, 2.73
0.22
6.11*
<0.01
1.32
1.73
9.4, 0.102
9.2, 0.023
9.6, 0.063
9.4, 0.026
0.87
2.79
1.45
0.01
3.01
9.5, 0.014
9.2, 0.023
9.6, 0.016
9.4, 0.004
9.5, 2.119
1, 6.383
11.3, 0.005 544***
3.86
F
10.2, 0.053 7.30*
9.1, 0.179
1, 0.390
1, 0.695
11.3, 0.041 1173***
11.1, 0.035 4.22
F
denom.
df, ms
Subpopulation (SP)
num.
df, ms
1, 917.76 11.3, 0.836 1098***
1, 48.24
1, 0.15
denom.
df, ms
Morphology
(8) rhizome length (cm)a
1, 20.92 11.1, 0.062 338***
1, 0.022
(9) rhizome internode lengtha
1, 0.05
11.1, 0.018 2.97
1, 0.088
(10) rhizome thickness (dw/cm)a 1, 0.29 11.2, 0.006 46.95*** 1, <0.001
(11) shoot lengtha
1, 1.40
11.1, 0.062 22.52***
1, 0.083
(12) shoot internode lengtha
1, 0.02
11.1, 0.025 0.86
1, 0.045
a
: log (x+1)
b
: square-root
c
: individual tuber sizes log(x+1)-transformed before averaging per plant
d
: arcsin square-root
Biomass yield and allocation
(5) vegetative biomass (mg dw)a
(6) shoot to root ratio (in dw)a
(7) asexual reproductive allocation
(%, dw)d
Asexual reproduction
(2) total tuber biomassa
(3) tuber numberb
(4) average tuber size (mg dw)c
(1) Initial tuber size
num.
df, ms
Substrate treatment (ST)
2, 0.062
2, 0.055
2, 0.001
2, 0.018
2, 0.018
2, 0.064
2, 0.071
2, 0.002
2, 0.298
2, 2.345
2, 0.026
2, 0.760
num.
df, ms
0.79
3.86
F
11.7, 0.034 1.80
10.9, 0.083 0.66
11.6, 0.029 0.04
10.4, 0.018 1.00
14.0, 0.180 0.10
16.0, 0.042 1.51
12.5, 0.050 1.43
12.6, 0.014 0.17
15.0, 0.062 4.79*
12.3, 7.685 0.31
9.6, 0.327
9.1, 0.197
denom.
df, ms
Genotypic-tuber-size (GTS)
9, 0.028
9, 0.067
9, 0.025
9, 0.015
9, 0.110
9, 0.025
9, 0.017
9, 0.004
9, 0.043
9, 2.259
9, 0.055
9, 0.183
num.
df, ms
10.9, 0.026
10.9, 0.064
10.8,0.006
10.9, 0.019
10.9, 0.063
10.9, 0.008
10.8, 0.011
10.9, 0.004
10.7, 0.005
10.7, 0.841
10.7, 0.041
10.2, 0.035
denom.
df, ms
Clone (C)
1.08
1.05
4.07*
0.81
1.74
3.26*
1.46
0.98
8.44***
2.69
1.33
5.31*
F
Appendix S1 Results of nested analyses of covariance (ANCOVA) on morphological traits, biomass yield and allocation traits, and traits
concerning asexual reproduction of Potamogeton pectinatus grown at two contrasting substrate types. The results of an ANCOVA on the size of
the planted tubers (initial tuber size) are also presented. Genotypic-tuber-size (GTS) stands for size classes of clones that are genetically
determined to produce either small, medium or large tubers. num. = numerator, denom. = denominator. * P < 0.05, ** P < 0.01, *** P < 0.001
Local adaptation to substrate type
107
108
(8)
(9)
(10)
(11)
(12)
11.0, 0.006 0.37
11.0, 0.063 0.26
1, 0.002
1, 0.016
1, <0.001 11.0, 0.025 <0.01
11.0, 0.019 1.93
1, 0.036
11.0, 0.008 2.86
1, 0.022
11.0, 0.062 0.18
11.0, 0.011 3.21
1, 0.011
11.0, 0.004 0.72
1, 0.036
11.0, 0.005 0.73
1, 0.004
1, 0.003
11.0, 0.838 0.04
1, 0.035
(5)
(6)
(7)
11.0, 0.041 0.27
1, 0.011
(2)
(3)
(4)
11.0, 0.035 0.83
F
1, 0.029
denom.
df, ms
(1)
num.
df, ms
ST x SP
Appendix S1 continued
2, 0.014
2, 0.093
2, 0.008
2, 0.041
2, 0.277
2, 0.002
2, 0.003
2, 0.017
2, 0.070
2, 6.545
2, 0.453
2, 0.026
num.
df, ms
10.9, 0.026
10.9, 0.064
10.9, 0.006
10.9, 0.019
10.9, 0.063
10.9, 0.008
10.9, 0.011
10.9, 0.004
10.8, 0.005
10.8, 0.840
10.8, 0.041
10.7, 0.035
denom.
df, ms
ST x GTS
0.55
1.46
1.29
2.17
4.41*
0.26
0.26
4.39*
13.89**
7.79**
10.99**
0.75
F
193.0, 0.432
denom.
df, ms
0.81
F
192.0, 0.0026 2.92**
11.0, 0.026 191.0, 0.0062 4.09***
11.0, 0.063 191.0, 0.0206 3.06***
11.0, 0.006 192.0, 0.0028 2.20*
11.0, 0.019 192.0, 0.0045 4.20***
11.0, 0.062 192.0, 0.0241 2.59**
11.0, .008
11.0, 0.011 192.0, 0.0054 2.09*
11.0, 0.004 192.0, 0.0009 4.16***
11.0, 0.005 192.0, 0.0041 1.22
11.0, 0.838 192.0, 0.6892 1.22
11.0, 0.041 192.0, 0.0372 1.11
11, 0.035
num.
df, ms
ST x C
9.1, 0.015
9.0, 0.109
9.0, 0.025
9.1, 0.017
9.1, 0.004
9.0, 0.042
9.1, 2.240
9.1, 0.055
9.1, 0.81
denom.
df, ms
2, 0.014
2, 0.005
9.1, 0.028
9.1, 0.067
2, <0.001 9.0, 0.025
2, 0.024
2, 0.018
2, 0.021
2, 0.013
2, 0.003
2, 0.071
2, 1.209
2, 0.020
2, 0.027
num.
df, ms
SP x GTS
0.51
0.07
<0.01
1.60
0.16
0.84
0.75
0.92
1.69
0.54
0.36
0.17
F
1, 0.001
1, 0.189
1, 0.011
1, 0.009
1, 0.289
1, 0.001
1, 0.015
1, 0.011
1, 0.059
1, 4.101
1, 0.626
num.
df, ms
F
191.0, 0.006 0.16
191.0, 0.021 9.15**
192.0, 0.003 4.04*
192.0, 0.004 2.12
192.0, 0.024 11.97***
192.0, 0.003 0.42
192.0, 0.005 2.77
192.0, 0.001 11.72***
192.0, 0.004 14.30***
192.0, 0.689 5.95*
192.0, 0.037 16.80***
denom.
df, ms
covariate: Initial tuber size
Chapter 4
Chapter 5
Regulation of propagule size in the aquatic pseudo-annual
Potamogeton pectinatus: are genetic and maternal non-genetic
effects additive?1
Abstract
Genetic and maternal non-genetic effects interact in shaping the phenotype of a
particular trait. The strength of the genetic component determines whether selection
pressure results in evolutionary changes in the population. The strength of the maternal
non-genetic component can affect the pace of selection. In this study we analysed genetic
and maternal propagule size effects on propagule size production in the pondweed
Potamogeton pectinatus. In particular, we analysed whether they interact significantly
(i.e. whether both effects are additive, synergistic or antagonistic) and how they may
influence the outcome of diversifying selection pressures in the field. Fifteen clones
differing in the genetically determined size of asexual propagules (tubers) were grown for
three asexual generations in a common-garden set-up. The first generation was grown
from tubers collected from the field, the second from maternal tubers of comparable size,
and the last from both small and large maternal tubers. Maternal tuber size had a large
effect on all clones that was independent of their genetically determined tuber size – that
is, genetic and maternal non-genetic effects were additive. Path analysis revealed that
maternal tuber size affected tuber size and number similarly through its effect on
biomass production (vegetative and total tuber production), while the genetic
component had a direct effect on tuber size, associated with a trade-off with tuber
number. Because the relationship between genetic and maternal non-genetic effects is
additive, the outcome of diversifying selection related to tuber predation pressure by
Bewick’s swans and sediment heterogeneity will not be affected. However, since the
maternal effect is large, variation around optimal sizes is likely to persist in the
population, which is consistent with what is found in the field.
1
H.H. Hangelbroek & L. Santamaría (2004) Evolutionary Ecology Research 6: 147-161
Chapter 5
Introduction
Propagule size varies considerably among plant species, with recorded sizes ranging from
2 x 10⁻⁶ g in the orchid Goodyera repens (Salisbury 1942) to 18000-27000g in the double
coconut palm Lodoicea maldivica (Corner 1966). It is not surprising that different plant
species, with often distinct ecological strategies, show a large assortment of propagule
sizes. Within species, on the other hand, propagule size is considered to be relatively
stable (Harper et al. 1970; Lloyd 1987), with variation within one order of magnitude
(Schaal 1980; Banovetz & Scheiner 1994; Eriksson 1999; Susko & Lovett-Doust 2000).
Within species, selection may favour different sizes of propagules depending on local
ecological conditions. Contrasting selection pressures on propagule size generally result
from differences in propagule and seedling survival, growth, dispersal, predator
avoidance, and competition (Black 1958; Schaal 1980; Wulff 1986; Van Groenendael &
Habekotté 1988; Ganeshaiah & Uma Shaanker 1991; Moegenburg 1996; Vera 1997;
Vaughton & Ramsey 1998; Eriksson 1999; Santamaría & Rodríguez-Gironés 2002). But
as for any other trait, natural selection not only requires phenotypic variation resulting
in differential fitness effects, but also that such variation has a heritable component.
Nonetheless, most studies on propagule size have focused on its potential benefits or
disadvantages in terms of propagule survival and future plant performance, rather than
on its heritability. The studies that have analysed the genetic basis of propagule size have
reported varying results. Some have indicated strongly that propagule size has a genetic
component and maternal environment has little effect on propagule size (Weiner et al.
1997); others have shown that heritability is low and that maternal non-genetic effects
play an important role (Schaal 1980; Montalvo & Shaw 1994); and yet others have shown
that both genetic as well as maternal non-genetic effects contribute to propagule size
variation (Schmitt et al. 1992; Platenkamp & Shaw 1993). Furthermore, several studies
have shown low additive genetic variance (based on nuclear genes) for propagule size
and high maternal variance (Mazer 1987; Wolfe 1995), which may be either the result of
maternal non-genetic or maternal genetic effects. In the later case, evolution of seed size
may also take place (Platenkamp & Shaw 1993; Montalvo & Shaw 1994).
When both maternal non-genetic effects and genetic effects determine the
phenotype of a certain trait, maternal non-genetic effects will increase the variation of
phenotypes of each given genotype and thus could decrease the pace of natural selection
(Roach & Wulff 1987). The decrease in response to selection, however, need not be
similar over the whole range of genotypes. Instead, it is likely to depend on the type of
interaction that exists between genetic and maternal non-genetic effects. A maternal
non-genetic effect may be comparable across genotypes (i.e. genetic and maternal non-
110
Maternal versus genetic effects on propagule size
genetic effects are additive; Fig.1b) or the maternal non-genetic effect may differ
depending on the genotype (significant ‘genotype x maternal environment’ interaction).
In the second case, the maternal non-genetic effect may either amplify the value of the
genetic trait (synergistic interaction; Fig. 1c) or it may counteract it (antagonistic
interaction; Fig. 1d), resulting in differential strengths of response to selection pressure
across genotypes. Gaining insight into the type of relationship between genetic and
maternal non-genetic effects is thus essential in understanding and predicting potential
responses to selection.
Maternal condition:
high resource
medium resource
low resource
all resource levels
b.
No maternal effect
Additive
c.
d.
Synergistic
Antagonistic
Phenotype
Phenotype
a.
Genotype
Genotype
Figure 1 Schematic representation of phenotype dependence on the type of interaction between
genotype and maternal non-genetic conditions. (a) No maternal effects. (b) Additive relationship.
(c) Synergistic interaction. (d) Antagonistic interaction. Maternal conditions may, for instance,
represent differences in nutrient concentration of the maternal environment or differences in the
propagule-size from which a mother-plant grows (maternal propagule size).
111
Chapter 5
In this study, we analysed the contribution of genetic and maternal non-genetic
effects and their interaction to the regulation of propagule size of the pondweed
Potamogeton pectinatus, and how this influences the outcome of diversifying selection on
propagule size. P. pectinatus is an aquatic macrophyte, which reproduces primarily by
means of subterranean asexual propagules (tubers, Van Wijk 1989). The size of these
produced tubers has a large genetic component (H2 = 1.01 broad sense heritability; H.H.
Hangelbroek, L. Santamaría and M.A. Rodríguez-Gironés, unpublished manuscript).
Maternal tuber size also influences produced tuber size (Rodríguez-Gironés et al. 2003),
but whether this effect varies across genotypes (i.e. interacts with the genetic component)
is unknown. The tubers of P. pectinatus are subjected to several selective forces, such as
size-selective predation by Bewick’s swans and size-selective sprouting mortality, which
are both related to burial depth in the sediment (larger tubers have larger burial depths,
Santamaría & Rodríguez-Gironés 2002). When spatial variation in sediment type occurs,
different strategies for optimal tuber size may exist, since sediment type (clay content) is
known to influence both predation pressure (Nolet et al. 2001) and sprouting mortality
(Santamaría & Rodríguez-Gironés 2002). In sandy sediment where predation pressure
and sprouting mortality are high, deeply buried large tubers are likely to be selected
because deeply buried tubers may escape predation and large tuber sizes show reduced
sprouting mortality. In clay-rich sediment, on the other hand, reduced predation
pressure and tuber mortality accompanied by a size-number trade-off will most likely
favour the production of many small tubers (Santamaría & Rodríguez-Gironés 2002).
However, maternal non-genetic effects may affect the phenotype of the genetically
determined tuber size, slowing down selection or, in the case of significant maternal x
genotypic interaction, affecting the outcome of selection. If, for instance, the interaction
were antagonistic (i.e. tubers from clones determined to produce small tubers being
more strongly affected by maternal-tuber-size than those being produced from clones
with a larger genetic determined tuber size), then natural selection of large genotypes
would occur more rapidly and small genotypes may eventually disappear from the
population.
Here we studied the effect of genotypic variation and experimentally manipulated
maternal non-genetic tuber size on produced tuber size. The main questions asked were:
Does maternal tuber size affect the size of produced tubers? If so, what kind of
interaction exists between the genetic component determining tuber size and the
maternal effect: no interaction (additive effects), synergistic interaction or antagonistic
interaction? What might the consequences of this particular interaction be on the
diversifying selection pressures observed in the field? Furthermore, to gain better insight
into the mechanistic processes regulating tuber size, we sought an answer to the
112
Maternal versus genetic effects on propagule size
following questions: Do genotypic variation and maternal tuber size affect other plant
traits (such as tuber production or shoot-to-root ratio), which may in turn affect tuber
size? Through which pathways (i.e. traits) do maternal tuber size and genetic effects
regulate tuber size?
Material and methods
Species and study system
Potamogeton pectinatus L. (fennel pondweed) is a submerged aquatic angiosperm that
has a cosmopolitan distribution ranging from the sub-arctic to the tropics (Casper &
Krausch 1980; Wiegleb & Kaplan 1998). It has a pseudo-annual life form: every year at
the end of the growth season the plants die off leaving below-ground asexual propagules
(tubers) separated from one another to survive the winter and sprout in spring. P.
pectinatus also reproduces sexually, but seeds are thought mainly to contribute to seedbank build-up, population re-establishment after disturbances and waterfowl-mediated
dispersal among water bodies (Van Wijk 1989; Santamaría 2002).
Plant material for this study was collected in the Babbelaar (Lake Lauwersmeer,
the Netherlands), where a population of P. pectinatus occupies a heterogeneous area in
terms of sediment type, water depth and foraging pressure by Bewick’s swans (Nolet et
al. 2001). Previous studies have revealed that these factors affect different determinants
of fitness in this species, including tuber production, winter survival of tubers and
sprouting survival (Nolet et al. 2001; Santamaría & Rodríguez-Gironés 2002;
Hangelbroek et al. 2003).
Plant cultivation
We used 15 clonal lines for the experiment selected from an initial sample of 90 clones
collected from the Babbelaar, using a criterion that maximised genotypic tuber-size
variation while maintaining the original number of five sampling sites (Santamaría &
Rodríguez-Gironés 2002): following one generation of growth under common-garden
conditions, we selected clones producing the largest, medium and smallest averagetuber-size within each sampling site (medium tuber size was the closest to the grandaverage over the five sampling sites). Clonal lines were then grown for a second asexual
generation under standardised common-garden conditions to minimise the influence of
carry-over effects of the maternal environment (sensu Rossiter 1996) other than those
mediated by tuber size on the experiment reported here. The second generation was
grown from maternal tubers of comparable size, so that differences in produced tuber
113
Chapter 5
size were mainly genetically based. Average tuber size produced by each clonal line in
this second clonal generation (n = 8 plants per clone) was used as measure of genetically
determined tuber size and will be referred to hereafter as ‘genotypic-tuber-size’ (Fig.2).
Amplified fragment length polymorphism (AFLP) analysis was performed according to
Vos et al. (1995), to test whether all clonal lines indeed represented different genets. All
clones were distinguished from one another using the primer combination: EcoRI +
ACC / MseI + CTT.
Tubers
sampled
from the field
Produced
tuber size
Standardised
range maternal
tuber size
Different
genotypic-tubersizes
Two
maternal tuber
sizes
10x
8x
8x
10x
10x
8x
8x
8x
8x
10x
10x
10x
10x
f
8x
tuber size
winter
sampling
spring - summer - autumn
8x
f
10x
tuber size
winter
spring - summer - autumn
common environment prior to experiment
winter
spring - summer - autumn
experiment
Figure 2 Experimental design. Fifteen clonal lines obtained from 15 tubers collected from the field
were grown for three asexual generations at common-garden conditions. In the first year,
maternal-tuber-size differed among clones. In the second year, maternal-tuber-size was
standardised for all clones. Clonal variation in (average) produced tuber size thus represents
genetic differences among clones. In the third year, the 15 clones were grown from either small or
large maternal tubers. Dashed lines represent the range of tubers sizes used as maternal tubers in
the next growing season. For simplicity, only four of the 15 clones are depicted.
Ninety tubers originally collected at five sampling sites in the field in April 1997
were stored in a refrigerator (at 4 °C and in the dark) to continue hibernation until May
1997, when they were weighed individually (fresh weight, accuracy 1 mg) and planted in
5.5-litre pots containing a mixture of river sand and commercial potting clay (3 : 1 dry
weight ratio). Pots were randomly interspersed among five outdoor tanks (18 pots per
114
Maternal versus genetic effects on propagule size
tank) filled with tap water in Heteren (the Netherlands). The plants were left to grow
until the end of the growing season (October 1997), when newly produced tubers were
harvested. These tubers were weighed individually and stored until May 1998 (as above).
In the second year, eight tubers of each clone were planted separately in 5.5-litre
pots with a sediment mixture of aquarium sand and commercial potting clay (2 : 1 dry
weight ratio) (Fig. 2). The size of these eight tubers was standardised to a comparable size
range for all clones (15-90 mg fresh weight ≈ 5-30 mg dry weight). Pots were randomly
interspersed with pots from another experiment containing resource-poor sediment and
divided among 12 outdoor tanks (20 pots per tank). They were left to grow until October
1998, when newly-produced tubers were harvested, individually weighed and stored (as
above). Throughout the experiment, tuber dry weights were calculated using linear
regressions of dry weight (dw) on fresh weight (fw), estimated from a randomly chosen
sub-sample of tubers from all clonal lines (year 1: dw = 0.34 x fw, R2 = 0.95, n = 60; year
2: dw = 0.35 x fw, R2 = 0.95, n = 210; dry weight was measured after 24 h of desiccation at
70 °C). The genotypic-tuber-size for each clonal line was calculated as the average across
all separate plants (ramets) of the geometric mean size of all tubers produced by each
plant (log transformation before averaging was necessary because the distribution of
tuber sizes produced by one plant is right-skewed).
Experimental design
To analyse the relationship between genetic and maternal non-genetic effects of tuber
size on newly produced tuber size and other plant traits, a third year of growth at
common-garden conditions was carried out with the 15 clones differing in genotypictuber-size, only now plants from all clonal lines were grown from tubers belonging to
two different, non-overlapping size categories (‘maternal-tuber-size’ classes) (Fig. 2).
From each clone, we selected 10 small (11-20 mg fw = 4-7 mg dw) and 10 large (80-126
mg fw = 28-44 mg dw) tubers. In May 1999, these tubers were planted in 5.5-litre pots
containing a sediment mixture of aquarium sand and commercial potting clay (3 : 1 dry
weight ratio) and randomly interspersed among 15 outdoor tanks (20 pots per tank). The
experimental set-up resulted in a total of 300 pots (15 clones x 2 maternal-tuber-size
classes x 10 replicates). In October 1999, plants were harvested and divided into aboveground (shoots + leaves) and below-ground (roots + rhizomes) vegetative fractions, and
tubers for biomass determination (fresh weight for the tubers, dry weight for the rest).
Individual tuber fresh weights were measured and recalculated to individual dry weights
using fresh- to dry-weight regressions estimated from a sub-sample of tubers (as above;
dw = 0.39 x fw, R2 = 0.96, n = 75). We then calculated total tuber production (sum of all
individual tuber weights), vegetative biomass (above-ground + below-ground fractions),
115
Chapter 5
shoot-to-root ratio (above-ground biomass/below-ground biomass) and allocation to
asexual reproduction (tuber production/vegetative biomass + tuber production).
Data analysis
Genotypic and maternal non-genetic effects on asexual reproductive traits (total tuber
production, tuber size and number), biomass yield and allocation were tested in three
steps. In all analyses, all variables were log (x + 1) transformed (except for tuber number,
which was square root transformed) to assure homoscedasticity and normality of
residuals.
First, we assessed whether the effect of maternal tuber size varied among clones
by means of mixed-model analyses of variance, with maternal-tuber-size as a fixed
categorical factor and clonal identity as a random categorical factor. A significant
interaction between maternal-tuber-size and clone was interpreted to reveal genotypic
variation in maternal effects (similar to the analysis of reaction norms in a plasticity
experiment). To account for the influence of environmental variation between tanks,
‘tank’ was included as a random categorical factor.
Second, we evaluated whether among-clone variation in the effect of maternaltuber-size was related to their genetically based differences in tuber size, by means of
mixed-model analyses of covariance, with genotypic-tuber-size as a continuous factor,
maternal-tuber-size as a fixed categorical factor and tank as a random categorical factor.
First, analyses of covariance including the interaction between maternal and genotypictuber-size revealed that this term was always non-significant; hence, we carried out a
second set of analyses of covariance without the interaction term. All analyses of variance
and analyses of covariance were performed using the General Linear Models module of
Statistica 6.0 (StatSoft 2001).
Third, we sought to reveal the direct and indirect paths through which maternaltuber-size and genotypic-tuber-size influence newly produced tuber size, by means of
path analyses based on partial correlation coefficients obtained from a hierarchical set of
multiple regressions (Huber et al. 1996; Hangelbroek et al. 2002; Santamaría &
Rodríguez-Gironés 2002).
Results
Maternal-tuber-size, clonal origin and their interaction had significant effects on all
traits, except for the effect of maternal-tuber-size on asexual reproductive allocation
(Table 1). Whenever maternal-tuber-size resulted in significant effects, increased
116
Maternal versus genetic effects on propagule size
vegetative biomass
(mg dw)
1100
700
300
reproductive allocation
tuber number
tuber production
(mg dw)
maternal-tuber-size led to an increase in the measured variable, except for shoot-to-root
ratio, which decreased (Fig. 3). The significant interaction term indicated that, although
the direction of the responses to maternal-tuber-size was generally similar across all
clones, the magnitude of the responses differed (Fig. 3).
80
60
shoot to root ratio
tuber size (mg dw)
40
16
12
8
small
large
maternal tuber size
1000
600
200
0.7
0.6
0.5
6
4
2
small
large
maternal tuber size
Figure 3 Reaction norms of 15 Potamogeton pectinatus clones grown from small (5.7 ± 0.1 mg dw;
mean ± se) and from large (34.1 ± 0.3 mg dw) maternal tubers (n = 5-10).
The first set of analyses of covariance including the interaction between
maternal and genotypic-tuber-size revealed that this term was always non-significant (P
> 0.05), indicating homogeneity of slopes between maternal-tuber-sizes (Fig. 4bc). The
117
Chapter 5
Table 1 F-ratios and significance levels of analyses of mixed model variance ANOVAs fitted by
Generalised Linear Modelling. Maternal tuber size (MTS) represents two size categories of tubers
from which plants were grown from. Clone is a random factor representing the clonal line the
plants belong to. Tank is a random factor. * P < 0.05, ** P < 0.01, *** P < 0.001.
Maternal tuber size Clone MTS x Clone
Factor df, Error df
Asexual reproduction
tuber productiona
tuber numberb
average tuber sizec
Biomass yield and allocation
vegetative biomassa
asexual reproductive allocationd
shoot to root ratioa
1, 14
14, 14
Tank
14, 232-237
14, 232-237
40.84***
27.07***
32.07***
2.78*
3.92**
7.57***
2.72***
1.90*
2.72***
1.95*
3.18***
1.91*
18.15***
0.03
2.71*
3.02*
2.58*
5.38***
3.37***
2.01*
1.92*
3.50***
5.98***
35.70***
a
: log(x+1)
: square-root
c
: individual tuber sizes log(x+1) transformed before averaging per plant
d
: arcsin square-root
b
Table 2 F-ratios and significance levels of analyses of covariance (ANCOVA) fitted using
Generalised Linear Modelling. Maternal tuber size is a fixed factor, which represents two size
categories of tubers from which plants were grown from. Genotypic tuber size (i.e. genetically
determined tuber size) is a continuous covariate, which is based on the average size of produced
tubers after two clonal generations under standardised conditions and grown from tubers of
comparable size. Tank is a random factor * P < 0.05, ** P < 0.01, *** P < 0.001
Maternal tuber size Genotypic-tuber-size
Factor df, Error df
Tank
1, 259-264
1, 259-264
Asexual reproduction
tuber productiona
tuber numberb
average tuber sizec
73.57***
34.93***
58.02***
1.84
14.11***
112.06***
1.01
2.19**
1.73*
Biomass yield and allocation
vegetative biomassa
asexual reproductive allocationd
shoot to root ratioa
45.30***
0.31
47.49***
0.33
6.83**
2.42
1.71
4.72*
5.68***
a
: log(x+1)
: square-root
c
: individual tuber sizes log(x+1) transformed before averaging per plant
d
: arcsin square-root
b
118
14, 259-264
Maternal versus genetic effects on propagule size
tuber production (mg dw)
large maternal tuber
small maternal tuber
(a)
1400
1000
600
200
(b)
tuber number
80
60
40
20
tuber size (mg dw)
(c)
15
12
9
6
7
8
9
10
11
12
13
14
15
genotypic tuber size (mg dw)
Figure 4 Variation in asexual reproductive traits of 15 Potamogeton pectinatus clones that show
genetic variation in tuber size. Plants were grown from either small or large maternal tubers. (a)
Tuber production per plant (mg dw). (b) Number of tubers per plant. (c) Average tuber size per
plant (mg dw). In (b) and (c), the lines depict the relationship between the variables (averaged per
clone) and the genotypic-tuber-size of the various clones. Solid lines represent plants grown from
small maternal tubers; dashed lines represent plants grown from large maternal tubers. Because
tuber production is not affected by genotypic-tuber-size, the two lines in (a) represent the average
tuber production of all clones grown from small (dashed-dotted) or large (dotted) maternal tubers.
119
Chapter 5
second set of analyses of covariance revealed that both maternal-tuber-size and
genotypic-tuber-size had significant effects on produced tuber size and tuber number
(Table 2, Fig. 4bc). Total tuber production, however, was only affected by maternaltuber-size (Table 2), being larger for plants grown from large maternal tubers (Fig. 4a).
Not surprisingly, plants grown from large tubers produced more and larger tubers than
plants grown from smaller tubers (Fig. 4bc). Clones genetically determined to produce
large tubers (i.e. those with large genotypic-tuber-sizes) produced larger and fewer tubers
than clones with smaller genotypic-tuber-sizes (Fig. 4bc). Vegetative biomass and shootto-root ratio were both significantly affected by maternal-tuber-size, but not by
genotypic-tuber-size (Table 2). Larger maternal tubers produced more vegetative
biomass and had a lower allocation to shoots (i.e. a lower shoot-to-root ratio). Asexual
reproductive allocation, on the other hand, increased significantly with increasing
genotypic-tuber-size but was not affected by maternal-tuber-size (Table 2).
The path analysis revealed that genotypic-tuber-size had a fairly strong direct
effect on tuber size (effect strength = 0.40) and a weak indirect effect, mediated by tuber
production (effect strength = 0.11; Fig. 5). In contrast, maternal-tuber-size had a strong
indirect effect on tuber size, mediated by vegetative biomass and/or tuber production
(effect strength = 0.47) but a non-significant direct effect (Fig. 5). While genotypic-tubersize had a direct effect on tuber size, genotypic- and maternal-tuber-size had only
indirect effects on tuber number (Fig. 5). Tuber production had a strong positive effect
on both tuber number and size, which were negatively correlated (Fig. 5).
Discussion
Maternal-tuber-size had a large effect on produced tuber size. The magnitude of the
effect, however, differed among clones. Genotypic-tuber-size did not account for the
significant among-clone differences in response to maternal-tuber-size (i.e. for the
variation in the slope of the clonal reaction norms): the relationship between genotypictuber-size and newly produced tuber size showed parallel responses (i.e. homogeneous
slopes) for both maternal-tuber-size classes. Therefore, we can conclude that (1) an
additive relationship exists between the genetic and maternal non-genetic components of
tuber size, and (2) there is considerable clonal variation in the response of newly
produced tuber size to maternal-tuber-size, which is independent of genotypic-tubersize. Our results show that maternal tuber size plays a major role in determining the
tuber sizes produced. The additive relationship between genetic and maternal non-
120
Maternal versus genetic effects on propagule size
Maternal
tuber size
0.39***
93***
0.28***
0.93***
Vegetative
biomass
15***
0.76***
Tuber
production
-0.84***
67***
0.82***
Genotypic
tuber size
0.13*
Tuber
number
0.40***
Tuber
size
88***
Figure 5 Results of a path analysis for the influence of genotypic and maternal-tuber-size on the
size and number of produced tubers. All possible pathways between the four hierarchical levels in
the model were tested, but only the significant relationships are depicted. Arrows indicate
significant partial correlation coefficients. Solid arrows indicate positive correlations and dashed
arrows negative correlations. Numbers at the arrows = partial correlation coefficients and their
significance level. *, P < 0.05; ***, P < 0.001. Numbers within boxes = percentage of explained
variation (adjusted R2).
genetic effects simplifies the prediction of population responses to diversifying selection
pressure observed in the field (i.e. in the population of origin of the clones), caused by
spatial variation in swan predation pressure and sediment composition. However, while
clones that produced large tubers were found to predominate in sandy, more heavily
foraged sediment and clones producing small tubers were more abundant in clay-rich,
less heavily foraged sediment (Santamaría & Rodríguez-Gironés 2002), tuber sizes
observed within the two sediment types showed a considerable range of variation. The
genetic component may thus explain the differences between the two sediment types,
while the maternal non-genetic effects may contribute to increase the variation observed
within each sediment type. It is important to note that maternal non-genetic effects on
tuber size result in an amplification of within-clone variation in tuber size across clonal
generations: a given plant growing from a single tuber will produce tubers of various
sizes, which will, in turn, produce plants with divergent tuber size ranges due to maternal
carry-over effects. The amplification of plastic responses across generations can reduce
considerably the effect of selection pressure.
Adaptive maternal effects are most likely to arise if local environmental
conditions persist across generations, or more generally if the environment experienced
by the mother plant is a reasonable predictor of the conditions experienced by its
offspring (Rossiter 1998; Galloway 2001). Since tubers, in contrast to seeds, remain
relatively close to the mother plant, their environment is probably similar to that of the
121
Chapter 5
mother plant. This may increase the strength of local selection pressure on beneficial
tuber sizes, because the selective forces involved will be stable across generations.
Besides produced tuber size, maternal-tuber-size also had large effects on tuber
number, total tuber production, vegetative biomass and the shoot-to-root ratio. Trait
responses to maternal-tuber-size varied in all cases among clones. Genetic differences in
responses to (environmental) maternal effects are not uncommon (Sultan & Bazzaz
1993; Cheplick 1995; Skálová et al. 1997). The link between this genotypic variation and
specific, quantifiable genetic traits, however, have rarely been studied. While genotypictuber-size did have significant effects on tuber size, tuber number and asexual
reproductive allocation (and a slight effect on tuber production), this effect did not vary
between maternal-tuber-sizes (non-significant genotypic-tuber-size x maternal-tubersize interaction). Surprisingly, those traits that were affected by the genotypic-tuber-size
no longer responded differently to maternal-tuber-size. Thus, as was seen for tuber size,
among-clone variation in the response to maternal-tuber-size by these traits was not
related to genotypic-tuber-size.
A clear distinction can be made between how maternal-tuber-size and genotypictuber-size affected produced tuber size. Genotypic-tuber-size predominantly showed a
direct effect on produced tuber size, whereas maternal-tuber-size affected produced
tuber size indirectly, by enhancing vegetative biomass and/or tuber production. Larger
maternal-tuber-size also resulted in increased numbers of tubers. Whereas increasing
genotypic-tuber-size resulted in decreased numbers of tubers, revealing a genetically
based trade-off between tuber size and number (Fig.4bc). Our results may shed light on
the current controversy that surrounds the identification of a hypothetical trade-off
between propagule size and number (e.g. Smith & Fretwell 1974; Maddox & Antonovics
1983; Lloyd 1987; Mehlman 1993; Obeso 1993; Wolfe 1995; Mendez 1997; Vaughton &
Ramsey 1998; Eriksson 1999; Tremayne & Richards 2000; Stuefer et al. 2002). Because
carry-over effects of the maternal environment (here the maternal tuber size ) and
genotypic effects have contrasting influences on the observed propagule size and number
relationship, careful separation of these effects is required for an adequate quantification
of such trade-offs (Venable 1992). An important question in this regard concerns the
regulation of the plant’s reaction norm as a response to maternal effects. Plastic variation
in produced tuber size may be interpreted as an adaptive, bet-hedging strategy, allowing
for increased tuber size in favourable microsites (where maternal resources are abundant
but competition is strong) but ensuring the production of at least some propagules
(owing to their smaller size) in unfavourable microsites. Alternatively, they may be
interpreted to reveal internal constraints in the production of propagules arising from,
for example, meristem limitation (acting through constraints on tuber number) or
122
Maternal versus genetic effects on propagule size
internal source-sink dynamics (affecting tuber size, Sweet & Wareing 1966; Herold
1980).
In conclusion, tuber size in P. pectinatus depends on both genetic and maternal
non-genetic effects. The genetic component has predominantly a direct effect on tuber
size, while the maternal non-genetic effect is mediated by vegetative biomass and total
tuber production. Genetic and maternal non-genetic effects are independent and show
an additive relationship. The most likely consequence of this relationship for diversifying
selection on tuber sizes in the field will be a reduction in the pace of selection, since more
phenotypic variation exists in selected genotypes, rather than a qualitative change in the
evolutionary outcome of selection itself.
Acknowledgements
We would like to thank T. de Boer, K. Swart, T. Dekkers and H. de Jong for their technical
assistance and M. Klaassen and R.H.G. Klaassen for their valuable discussions. Furthermore, we
would like to thank J. van Groenendael for critical comments on the manuscript. This is
publication 3220 of The Netherlands Institute of Ecology (NIOO-KNAW).
References
Banovetz, S.J. & Scheiner, S.M. (1994) The effects of seed mass on the seed ecology of Coreopsis
lanceolata. American Midland Naturalist 131: 65-74.
Black, J.N. (1958) Competition between plants of different initial seed sizes in swards of
subterranean clover (Trifolium subterraneum L.) with particular reference to leaf area and
the light microclimate. Australian Journal of Agricultural Research 9: 299-318.
Casper, S.J. & Krausch, H.D. (1980) Pteridophyta und Anthophyta. Fischer, Stuttgart.
Cheplick, G.P. (1995) Genotypic variation and plasticity of clonal growth in relation to nutrient
availability in Amphibromus scabrivalvis. Journal of Ecology 83: 459-468.
Corner, E.J.H. (1966) The natural history of palms. Weidenfeld & Nicolson, London.
Eriksson, O. (1999) Seed size variation and its effect on germination and seedling performance in
the clonal herb Convallaria majalis. Acta Oecologica 20: 61-66.
Galloway, L.F. (2001) Parental environmental effects on life history in the herbaceous plant
Campanula americana. Ecology 82: 2781-2789.
Ganeshaiah, K.N. & Uma Shaanker, R. (1991) Seed size optimization in a tree Butea monosperma:
a trade-off between seedling establishment and pod dispersal efficiency. Oikos 60: 3-6.
123
Chapter 5
Hangelbroek, H.H., Santamaría, L., & De Boer, T. (2003) Local adaptation of the pondweed
Potamogeton pectinatus to contrasting substrate types mediated by changes in propagule
provisioning. Journal of Ecology 91: 1081-1092.
Hangelbroek, H.H., Ouborg, N.J., Santamaría, L., & Schwenk, K. (2002) Clonal diversity and
structure within a population of the pondweed Potamogeton pectinatus foraged by Bewick's
swans. Molecular Ecology 11: 2137-2150.
Harper, J.L., Lovell, P.H., & Moore, K.G. (1970) The shapes and sizes of seeds. Annual Review of
Ecology and Systematics 1: 327-356.
Herold, A. (1980) Regulation of photosynthesis by sink activity-the missing link. New Phytologist
86: 131-144.
Huber, H., Stuefer, J.F., & Willems, J.H. (1996) Environmentally induced carry-over effects on seed
production, germination and seedling performance in Bunium bulbocastanum (Apiaceae).
Flora 191: 353-361.
Lloyd, D.G. (1987) Selection of offspring size at independence and other size-versus-number
strategies. American Naturalist 129: 800-817.
Maddox, G.D. & Antonovics, J. (1983) Experimental ecological genetics in Plantago:a structural
equation approach to fitness components in P. aristata and P. patagonica. Ecology 64:
1092-1099.
Mazer, S.J. (1987) The quantitative genetics of life history and fitness in Raphanus raphanistrum L.
(Brassicaceae): ecological and evolutionary consequences of seed mass variation. American
Naturalist 130: 891-914.
Mehlman, D.W. (1993) Seed size and seed packaging variation in Baptisia lanceolata (Fabaceae).
American Journal of Botany 80: 735-742.
Mendez, M. (1997) Sources of variation in seed mass in Arum italicum. International Journal of
Plant Sciences 158: 298-305.
Moegenburg, S.M. (1996) Sabal palmetto seed size: Causes of variation, choices of predators, and
consequences for seedlings. Oecologia 106: 539-543.
Montalvo, A.M. & Shaw, R.G. (1994) Quantitative genetics of sequential life-history and juvenile
traits in the partially selfing perennial, Aquilegia caerulea. Evolution 48: 828-841.
Nolet, B.A., Langevoord, O., Bevan, R.M., Engelaar, K.R., Klaassen, M., Mulder, R.J.W., & Van
Dijk, S. (2001) Spatial variation in tuber depletion by swans explained by differences in net
intake rates. Ecology 82: 1655-1667.
Obeso, J.R. (1993) Seed mass variation in the perennial herb Asphodelus albus: Sources of variation
and position effect. Oecologia 93: 571-575.
Platenkamp, G.A.J. & Shaw, R.G. (1993) Environmental and genetic maternal effects on seed
characters in Nemophila menziesii. Evolution 47: 540-555.
Roach, D.A. & Wulff, R.D. (1987) Maternal effects in plants. Annual Review of Ecology and
Systematics 18: 209-235.
Rodríguez-Gironés, M.A., Sandsten, H., & Santamaría, L. (2003) Asymmetric competition and the
evolution of propagule size. Journal of Ecology 91: 554-562.
124
Maternal versus genetic effects on propagule size
Rossiter, M. (1998) The role of environmental variation in parental effects expression. In: Maternal
effects as adaptations (eds T.A. Mousseau & C.W. Fox), pp. 112-134. Oxford University
Press, New York.
Rossiter, M.C. (1996) Incidence and consequences of inherited environmental effects. Annual
Review of Ecology and Systematics 27: 451-476.
Salisbury, E.J. (1942) The reproductive capacity of plants. Studies in quantitative biology. G. Bell &
Sons, London.
Santamaría, L. (2002) Selective waterfowl herbivory affects species dominance in a submerged
plant community. Archiv Fur Hydrobiologie 153: 353-365.
Santamaría, L. & Rodríguez-Gironés, M.A. (2002) Hiding from swans: optimal burial depth of sago
pondweed tubers foraged by Bewick's swans. Journal of Ecology 90: 303-315.
Schaal, B.A. (1980) Reproductive capacity and seed size in Lupinus texensis. American Journal of
Botany 67: 703-709.
Schmitt, J., Niles, J., & Wulff, R.D. (1992) Norms of reaction of seed traits to maternal
environments in Plantago lanceolata. American Naturalist 139: 451-466.
Skálová, H., Pecháèková, S., Suzuki, J., Herben, T., Hara, T., Hadincová, V., & Krahulec, F. (1997)
Within population genetic differentiation in traits effecting clonal growth: Festuca rubra in
a mountain grassland. Journal of Evolutionary Biology 10: 383-406.
Smith, C.C. & Fretwell, S.D. (1974) The optimal balance between size and number of offspring.
American Naturalist 108: 499-506.
StatSoft, I. (2001) STATISTICA, version 6 Tulsa, Oklahoma.
Stuefer, J.F., van Hulzen, H., & During, H.J. (2002) A genotypic trade-off between the number and
size of clonal offspring in the stoloniferous herb Potentilla reptans. Journal of Evolutionary
Biology 15: 880-884.
Sultan, S.E. & Bazzaz, F.A. (1993) Phenotypic plasticity in Polygonum persicaria. I. Diversity and
uniformity in genotypic norms of reaction to light. Evolution 47: 1009-1031.
Susko, D.J. & Lovett-Doust, L. (2000) Patterns of seed mass variation and their effects on seedling
traits in Alliaria petiolata (Brassicaceae). American Journal of Botany 87: 56-66.
Sweet, W.G. & Wareing, P.F. (1966) Role of plant growth in regulating photosynthesis. Nature 210:
77-79.
Tremayne, M.A. & Richards, A.J. (2000) Seed weight and seed number affect subsequent fitness in
outcrossing and selfing Primula species. New Phytologist 148: 127-142.
Van Groenendael, J.M. & Habekotté, B. (1988) Cyperus esculentus L. biology, population
dynamics, and possibilities to control this neophyte. Zeitschrift für PflanzenKrankheiten,
PflanzenPathologie und PflanzenSchutz Sonderheft XI: 61-69.
Van Wijk, R.J. (1989) Ecological studies on Potamogeton pectinatus L .3. Reproductive strategies
and germination ecology. Aquatic Botany 33: 271-299.
Vaughton, G. & Ramsey, M. (1998) Sources and consequences of seed mass variation in Banksia
marginata (Proteaceae). Journal of Ecology 86: 563-573.
125
Chapter 5
Venable, D.L. (1992) Size-number trade-offs and the variation of seed size with plant resource
status. American Naturalist 140: 287-304.
Vera, M.L. (1997) Effects of altitude and seed size on germination and seedling survival of
heathland plants in North Spain. Plant Ecology 133: 101-106.
Vos, P., Hogers, R., Bleeker, M., Reijans, M., Vandelee, T., Hornes, M., Frijters, A., Pot, J., Peleman,
J., Kuiper, M., & Zabeau, M. (1995) AFLP: a new technique for DNA-fingerprinting.
Nucleic Acids Research 23: 4407-4414.
Weiner, J., Martinez, S., MullerScharer, H., Stoll, P., & Schmid, B. (1997) How important are
environmental maternal effects in plants? A study with Centaurea maculosa. Journal of
Ecology 85: 133-142.
Wiegleb, G. & Kaplan, Z. (1998) An account of the species of Potamogeton L. (Potamogetonaceae).
Folia Geobotanica 33: 241-316.
Wolfe, L.M. (1995) The genetics and ecology of seed size variation in a biennial plant,
Hydrophyllum appendiculatum (Hydrophyllaceae). Oecologia 101: 343-352.
Wulff, R.A. (1986) Seed size variation in Desmodium paniculatum III. Effects of reproductive yield
and competitive ability. Journal of Ecology 74: 115-121.
126
Chapter 6
Water-depth zonation in a pondweed hybrid complex: the role
of abiotic factors and propagule predation1
Abstract
Opinions on hybrid zone maintenance are divided; some believe it is a balance between
constant low hybrid fitness compensated by gene flow, while others believe
environmental gradients accompanied by differing ecological selection pressures result
in performance differences between taxa including the hybrid. Here we analysed the
putative hybrid complex of Potamogeton pectinatus, P. filiformis and their hybrid P. x
suecicus in the northern range limits of both parental species where their distributions
overlap (northern Russia). Molecular techniques revealed frequencies of 41% P.
pectinatus, 40% hybrid and 19% P. filiformis (n = 128) within a large estuary. When the
hybrid complex was analysed at a local scale across water-depth gradients a clear
zonation of the hybrid complex appeared: P. pectinatus occurred in deeper water and the
hybrid in shallow water occasionally accompanied by P. filiformis. A factorial substrate
and irradiance experiment revealed similar performance of P. pectinatus and the hybrid.
However, it also demonstrated the existence of differences in allocation patterns to leaves
and roots at ‘home’ versus ‘away’ irradiance environments between both parental
species, while the hybrid combined (the potentially adaptive) responses of both parent
species, i.e. by allocating more to leaves at low irradiance-clay rich substrate (as P.
pectinatus) and more to roots at high irradiance-sandy substrate (as P. filiformis).
Predation of the subterranean propagules (tubers) by Bewick’s swans (Cygnus
columbianus bewickii) also seemed to affect the hybrid-complex distribution. Field
measurements revealed a negative relationship between water-depth and foraging
pressure of Bewick’s swans. In two other experiments it was revealed that (a) P.
pectinatus produces larger tubers than the hybrid and (b) larger tubers have a higher
predation risk by Bewick’s swans. These results suggest that in the shallow water where
predation pressure is high the hybrid may escape predation by its small tuber size while
1
H.H. Hangelbroek, T. de Boer, R.J. Gornall, R.A. King, M. Klaassen, B.A. Nolet & L. Santamaría
Chapter 6
P. pectinatus does not. Furthermore, we propose that tuber size may also explain the
presence of P. pectinatus and the absence of the hybrid in deeper water by competitive
advantage of larger tubers of P. pectinatus at low irradiance conditions. We conclude that
both abiotic and biotic factors simultaneously affect the pondweed hybrid complex
structure and maintenance.
Introduction
Hybridisation between closely related plant species with overlapping geographic ranges
is a common and well-known phenomenon. During the last decade, developments in
molecular techniques have enabled molecular confirmation of natural hybridisation e.g.
in Iris (Cruzan & Arnold 1993), Potamogeton (Hollingsworth et al. 1996), Spartina
(Ayres et al. 1999), Polygonum (Hollingsworth et al. 1999), Chaenomeles (Bartish et al.
2000), Salix (Hardig et al. 2000), Saxifraga (Steen et al. 2000), and Dubautia (Caraway et
al. 2001). However, opinions are divided on whether maintenance of hybrid zones is due
to ecological factors or ecologically neutral factors (i.e. purely genetic). The tension zone
model (Key 1968; Barton & Hewitt 1985) supports the latter view and considers hybrids
to have lower fitness than parent species due to genetic incompatibility or disruption of
co-adapted gene complexes. Consequently, maintenance of hybrid zones is thought to be
the result of a balance between selection against hybrids and continuous gene flow from
both parent species at both sides of the zone. Alternatively, ecological selection-gradient
models (Endler 1977; Moore 1977) are based on the existence of environmental clines
(ecotone) accompanied by differential ecological selection pressures along the cline
(Haldane 1948; Endler 1973; Slatkin 1973). Each parent species is assumed to be adapted
to, and thus perform best at one of the extremes of the cline, while the hybrids would
perform best in the intermediate environment. The bounded hybrid superiority model
(Moore 1977) predicts a higher fitness of the hybrids as compared to parent species at
intermediate environments or novel environments where the parents do not occur, while
the other ecological models relax this assumption i.e. performance of hybrids may be
comparable at intermediate environments and thus lead to a mixture of parents and
hybrids.
Lately, hybrid-zone maintenance models regarding exogenous selection
(ecological models) rather than endogenous selection (tension zone model) receive more
and more support (Wang et al. 1997; Fritsche & Kaltz 2000; Campbell & Waser 2001;
Schweitzer et al. 2002). Indeed, according to Arnold & Hodges (1995) the majority of
studies show that hybrids generally have equal fitness levels to both parent species, and
128
Ecological zonation in a hybrid complex
sometimes even higher fitness than at least one of the parent species. While this
generalisation is based mainly on studies concerning variation in abiotic conditions,
those focussing on biotic factors (such as herbivory) tend to show lower or occasionally
equal fitness of hybrids; i.e. higher herbivore resistance of hybrids is scarcely
encountered (but see Boecklen & Spellenberg 1990; Fritz et al. 1994; Strauss 1994;
Eisenbach 1996; Fritz 1999; Campbell et al. 2002).
Elucidating which factors (i.e. exogenous or endogenous and abiotic or biotic
therein) actually play a role in the maintenance of hybrid complexes may give insight in
the potential of hybrids to become new evolutionary lineages. Hybrids of clonal plants in
particular have high chances to establish thriving populations as soon as only a few
successful genotypes have been produced (Emms & Arnold 1997). For instance,
endogenous selection may first take place affecting establishment of hybrids, followed by
endogenous selection favouring genotypes which spread vigorously by means of asexual
reproduction and which occasionally reproduce sexually. Such a scenario may eventually
lead to new evolutionary lineages which are independent of the presence of both its
parental species. However, many hybrid taxa are sterile resulting in a so-called
evolutionary dead end regarding speciation. Nevertheless, when hybridisation occurs
between clonal species (leading to hybrids which reproduce asexually), short-term
maintenance of a hybrid zone in the presence of both parental species may still be
considered to be affected by either endogenous factors, other than those affecting sexual
reproduction, and/or exogenous factors. These different factors may particularly affect
the local structure of a hybrid complex by either resulting in a random mixture of
parental and hybrid taxa (endogenous or exogenous) or by resulting in a structure
related to local environmental conditions which affect (asexual) fitness of the taxa
differently (exogenous).
A good example is provided by pondweeds (Potamogeton spp.) a genus that
consists of mainly clonal species and in which hybrid taxa seem to successfully spread
and persist vegetatively (Preston 1995). In this study we explored the maintenance of a
local structure of a hybrid complex of fennel pondweed (Potamogeton pectinatus L.),
slender leaved pondweed (P. filiformis Persoon) and their hybrid P. x suecicus (K. Right).
P. pectinatus and P. filiformis reproduce both sexually and asexually, whereas the hybrid
is sterile (Hollingsworth et al. 1996). In all these taxa vegetative reproduction is by means
of subterranean propagules (tubers). P. x suecicus has proven to be capable of forming
persistent populations solely through asexual reproduction since relict populations occur
in Great Britain from which P. filiformis has probably been absent for thousands of years
(Hollingsworth et al. 1996). Our research area was located in the Pechora Delta, northern
Russia, situated at the northern range limits of both parent species (Fig. 1). In this area, a
129
Chapter 6
Barents Sea
Scandinavia
0
5
10km
Russia
Korovina Bay
Z
G
S
600m
Sampling areas:
Plot
500
Gas 14
Depth transect (G)
400
Deep w
ater gu
300
lly
200
100
Shore
0
0
100
200
300
P. pectinatus
400
500
600
700
800m
Hybrid
P. filiformis
20m
Figure 1 Upper two panels: Map of study area in the Pechora Delta, Russia. The symbols G, Z and
S stand for the islands Gas-14 and Zeloni, next to which sampling plots and/or transects along a
water-depth gradient were analysed (Fig. 2), and the river Sredni Shar, where a number of clones
were collected that were used for the tuber-characteristics experiment. Third panel: Position and
true size of the sampling plots at the large-scale area and of one of the local scale sampling
transects over a water-depth gradient near the island of Gas-14. The four northern and the four
southern plots are separated by a deep-water gully and are approximately 200 m apart. Lower
panel: Each plot holds 16 samples. The different symbols in the plots represent different taxa of
Potamogeton.
130
Ecological zonation in a hybrid complex
number of ecological factors may regulate the distribution of the taxa, including abiotic
factors that vary along a tidal water-depth gradient (e.g. irradiance and substrate type)
and correlated biotic factors (e.g. tuber predation by Bewick’s swans; Fig. 2).
Different taxa may be adapted to local ecological conditions by possessing specific
fixed traits or by adaptive plasticity. Potamogeton taxa are known for their high
phenotypic plasticity in morphological traits resulting from variation in abiotic
conditions (Kaplan 2002). Pilon & Santamaría (2002a) revealed acclimation in P.
pectinatus in response to variation in irradiance, while Hangelbroek et al. (2003) revealed
it in relation to variation in substrate type. Kautsky (1991) also revealed a highly plastic
response to substrate type in the allocation of resources to roots and rhizomes for P.
pectinatus, but for P. filiformis she found much less plasticity yet a consistently high
allocation to roots and rhizomes. Despite the high level of plasticity shown by species of
Potamogeton, ecological differentiation of the taxa, including hybrids, may still occur
potentially resulting in segregation of the taxa.
As for the biotic factors, Bewick’s swans (Cygnus columbianus bewickii) are
known to forage intensively on the tubers of P. pectinatus (Beekman et al. 1991; Nolet &
Drent 1998; Nolet et al. 2001; Nolet & Mooij 2002; Santamaría & Rodríguez-Gironés
2002). All three taxa produce tubers and are likely to be subjected to this tuber predation
yet it may affect them differently. Bewick’s swans forage on tubers by whirling up the
substrate with their feet after which they sieve out the tubers with their bill. Water-depth
greatly affects areas in which the swans can successfully forage (Nolet & Drent 1998;
Nolet et al. 2001). Especially in tidal areas, shallow parts are more accessible to foraging
swans than deeper parts, probably resulting in depth-related tuber-predation pressure.
When tubers are eaten they are completely digested. Hence, predation of tubers is likely
to have a large negative impact on clonal fitness. Foraging swans may have a differential
effect on the three taxa considered here since they are believed to differ in tuber size, a
factor known to influence tuber predation by Bewick’s swans (Van Eerden et al. 1997).
In this study we sampled at two different scales: first on a large scale in the
Korovina Bay to identify the presence of a hybrid zone in the Pechora Delta, and second
on a local scale across a water-depth gradient to reveal whether ecological factors affected
and maintained local hybrid-complex structure. The latter study was conducted at two
different locations within the Pechora Delta. After sampling and identification of the
taxa using genetic markers, a combination of experiments and field observations was
carried out to reveal which abiotic and biotic factors might play a role in local hybridcomplex structure. The main questions asked were the following. (1) Does a hybrid zone
occur in the Pechora Delta where the geographic distributions of P. pectinatus and P.
filiformis overlap? (2) If so, do genetic or ecological factors regulate local structure of the
131
Chapter 6
hybrid-complex? (3) In the case the latter applies, do abiotic and biotic factors have
comparable effects on the hybrid complex?
Material and Methods
Species and study site
Potamogeton pectinatus and P. filiformis both belong to subgenus Coleogeton (Preston
1995). P. x suecicus, the hybrid between P. pectinatus and P. filiformis, is very difficult to
distinguish morphologically from both parental taxa (Hollingsworth et al. 1996). P.
pectinatus has a cosmopolitan distribution, which ranges from the tropics to the subarctic (Casper & Krausch 1980; Wiegleb & Kaplan 1998). It often occurs in eutrophic or
brackish waters but may also occur in nutrient poor waters. Population persistence is
thought to be mainly the result of asexual reproduction, while sexual reproduction would
play a more important role for reestablishment after disturbance and long distance
dispersal (Van Wijk 1989). Within the western Palaearctic, along the migratory routes of
Bewick’s swans, the asexual propagules (tubers) are prone to high predation pressures of
these birds (Beekman et al. 2002).
P. filiformis has a circumboreal distribution and it often occurs in sandy substrate
and shallow water (Casper & Krausch 1980; Hultén & Fries 1986). P. x suecicus occurs in
regions of overlap between P. pectinatus and P. filiformis, although, relict populations do
also occur in Great Britain in areas from which P. filiformis has probably been absent for
thousands of years (Hollingsworth et al. 1996). P. x suecicus is sterile: all pollen is
irregularly shaped and presumably sterile, and no ripe fruits have ever been observed
(Bance 1946; Hollingsworth et al. 1996). This indicates that P. x suecicus has the capacity
to persist and spread vegetatively successfully (Preston 1995; Hollingsworth et al. 1996)
and that backcrossing does not occur. Hollingsworth et al. (1996) observed that at sites
where habitat heterogeneity was sufficient, all three taxa occur on different substrates,
with P. filiformis on coarse sand and gravel, P. pectinatus on mud, and the hybrid on
muddy gravel, although this ecological separation was incomplete.
In the Pechora Delta, northern Russia (68ºN 54ºE), Bewick’s swans breed and
forage in the tundra until the end of summer. By that time, pondweeds have produced
many tubers and the Bewick’s swans move to the pondweed beds, where they forage
intensively upon the tubers until they leave for their autumn migration (Beekman et al.
1996; 2002).
132
Ecological zonation in a hybrid complex
predation pressure
high
low
tide
high light
sandy
low light
clay-rich
0
27
20
31
Depth:
Clay %:
0
31
4
36
39
61
x
Depth:
Clay %:
x
14
x x
x
G
a
s
19
53
5m
x
Z
e
l
o
n
i
Deep
Shallow
P. pectinatus
Hybrid
P. filiformis
Figure 2 Upper panel: Schematic representation of tidal water-depth related variation in abiotic
and biotic factors that may affect fitness of Potamogeton taxa differentially. Light intensity and
percentage clay particles in the substrate both vary with water-depth. Predation pressure on tubers
by Bewick’s swans varies over tidal water-depth as a result of the shallow parts being more
accessible for swans than the deeper areas. Lower panel: Aerial view of the distribution of
Potamogeton pectinatus, P. filiformis and P. x suecicus along two transects across a water-depth
gradient at Gas-14 and Zeloni located in the Pechora Delta, Russia (see Fig. 1). Every five meters a
plant was collected across the water-depth gradient (total sixteen plants). At the beginning, middle
and end another eight plants were collected perpendicular to the depth gradient. At the crosssections relative water-depth was measured in cm (shallowest value was set to zero) and substrate
composition as percentage clay particles (i.e. particles < 63 μm). x stands for missing data. Arrows
indicate the clones selected for the factorial substrate-irradiance experiment.
133
Chapter 6
Detection and mapping of the hybrid zone
To find out whether a hybrid zone occurs in the Pechora Delta, we sampled at a large
scale in the delta. Then to be able to test whether ecological or genetic factors regulate the
local hybrid complex we sampled at a local scale across a water-depth gradient at two
sites within the Pechora Delta. Plants were collected and abiotic measurements were
made along the depth transects to describe the area both taxonomically and abiotically.
By using Restriction Fragment Length Polymorphism (RFLP) of the nuclear internal
transcribed spacer (ITS) region of ribosomal DNA we distinguished between P.
pectinatus, P. filiformis and P. x suecicus (King et al. 2001).
Large-scale hybrid zone detection within the Pechora Delta
Near the island of Gas-14 two beds of pondweeds were located in September 1998 (Fig.
1). The two beds were separated by a deep-water gully. Within each bed we chose four
plots approximately 200 m apart. At each plot a subsample of 16 sampling points was
randomly selected from a regular 6 + 6 grid of points placed every 3 m. This distance was
chosen to minimise the chance that tubers sampled at different points would belong to
the same ramet, since rhizomes of P. pectinatus, and probably those of the other taxa as
well, may become several meters long. A substrate core of 10 cm wide and approximately
30 cm deep was taken at each point. Tubers were sieved from the substrate and one
randomly chosen tuber per core was selected. The 128 selected tubers were taken to the
NIOO - Centre for Limnology in the Netherlands and stratified for one month at 4 °C in
the dark. They were then planted in cups containing a mixture of sand and clay which
were placed in aquaria filled with tap water in a climate chamber at 20 °C (16L : 8D).
After four weeks of growth, two to three leaves were harvested from each plant and DNA
was extracted for taxon identification from DNA RFLP profiles (see below).
Local hybrid-complex distribution across water-depth gradients
At two locations in the Pechora Delta plants were collected along a water-depth gradient
transect. The first location was at Gas-14, the same location as where the large scale
sampling had taken place. The centre of this transect coincided with the centre of the
southern plot second from the left (Fig. 1). The second location was approximately 18.5
km to the east, next to the island of Zeloni (Fig. 1). A single plant with attached tubers
was sampled every 5 m at increasing water-depths until 16 had been collected (i.e. total
transect of 75 m). Another eight plants were collected at three points perpendicular to
the depth gradient: at the first, the eighth and the 16th (i.e. last) point of the transect (Fig.
2). At these three positions water-depth was measured. Since water levels fluctuate
following the tidal cycles, water-depth was standardised to a relative water-depth by
134
Ecological zonation in a hybrid complex
setting the value of the shallowest position to zero. Water-depth values between the three
measured points were estimated by interpolation. In addition, a substrate core was taken
at these three water-depth positions to examine particle size composition by means of
Malvern analyses. Particles smaller than 63 µm were regarded as clay particles. The
collected tubers were treated and analysed for taxon determination as described above.
To test whether the occurrence of P. pectinatus and the hybrid was related to waterdepth, a logistic regression was carried out with a binomial distribution (P. filiformis was
not included in the analysis because it rarely occurred).
Laboratory procedures
DNA extraction took place according to the instructions of Gentra Systems Puregene
DNA isolation kit with an additional PCI (phenol:chloroform:isoamyl alcohol, 25:24:1)
cleaning step. DNA quality and quantity was visually checked on a 1.2% agarose 0.5 x
TBE gel. The ITS 1 / 5.8S / ITS 2 region was amplified by using the primer ITS 4 and ITS
F (King et al. 2001). The reactions were carried out in a total volume of 25 μL containing
16.68 μL distilled water, 2.5 μL 10 x PCR buffer (Bioline), 1.25 μL dNTP's, 1 μL MgCl2 (50
mM), 1μL 100x bovine serum albumin, 0.5 μL ITS 4 (10 μM), 0.5 ITS F (10 μM) and,
0.375 U BIOTAQ DNA polymerase (Bioline), and 1.5 μL genomic DNA. This mixture
was overlayed with a drop of mineral oil. The PCR's were performed in a Perkin Elmer
Cetus thermal cycler programmed for one cycle of 5 min at 95 °C followed by 30 cycles
of 30 s at 94 °C, 30 s at 55 °C, 1 min at 72 °C and completed with one cycle of 10 min at
70 °C. Successful amplification was checked electrophoretically on a 1.0 % agarose 0.5 x
TBE gel. Thereupon 78 μL of the ITS amplification product was digested with 0.2 μL of
the restriction enzyme CfoI (Gibco), 1 μL distilled water and 1 μL reaction buffer 10x
(Bioline) at 37 °C for at least an hour. The restriction products were separated on a 1.6 %
agarose 0.5 x TBE gel, revealing either 2 bands close together (P. filiformis), three bands
more separated (P. pectinatus) or a combination of these patterns resulting in 4 bands (P.
x suecicus, the hybrid) (see King et al. 2001). This technique does not discriminate P.
filiformis from P. vaginatus and P. x suecicus from P. x bottnicus (hybrid of P. pectinatus
and P. vaginatus). However, since we sampled at depths < 1.5m while P. vaginatus occurs
at depths larger than 2m only (Elven & Johanson 1984; King et al. 2001), this was a
suitable technique to use in our situation. Moreover, the morphology of P. vaginatus is
clearly different from that of P. filiformis and P. pectinatus and the absence of P.
vaginatus was confirmed by visual observations on all specimens sampled.
135
Chapter 6
Effects of irradiance and substrate type
A growth-chamber experiment was conducted to compare the performance and plastic
responses of the different taxa to abiotic conditions related to the water-depth gradient
(i.e. irradiance and substrate type). For this purpose clones from the different taxa
collected at the field sites described above, were grown on a factorial combination of two
irradiance levels and two substrate types that varied nearly fivefold in light intensity and
clay content, respectively.
Prior to the start of the experiment the tubers from the selected clones had been
grown for a complete season in order to produce clonal propagules (tubers) of each, and
to remove environmental carry-over effects related to the growth conditions of the
parent plant in the field. For this purpose, tubers were grown in 500 ml cups filled with a
mixture of washed aquarium sand and river clay (3 : 1 ratio, in dry weight). Cups were
randomly assigned to aquaria filled with tap water (16 cups per aquarium) and set to
grow at 20 °C water temperature, 133 μmol m-2 s-1 irradiance and 16 L : 8 D photoperiod
in a climate room. Plants were left to grow for five and a half months. The tubers
produced were then harvested and stored in the dark at 4 °C for three months, after
which the main experiment began.
Six clones of P. pectinatus and six clones of the hybrid were selected, originating
in both cases from Gas-14 and Zeloni (three clones each; Fig. 2). Because P. filiformis
occurred sparsely in the transects, in particular at Zeloni, we were only able to include
three clones of P. filiformis (two from Gas-14 and one from Zeloni). For each of the P.
pectinatus and hybrid clones, four clonal replicates were grown at each of the four
treatments, making a total of 16 plants per clone. For one clone of P. filiformis from Gas14 this was also the case. For the other P. filiformis clone from Gas-14, each treatment
had only one clonal replicate. For the P. filiformis clone from Zeloni each treatment had
two clonal replicates except for the low irradiance treatment on clay-rich substrate,
which had only one clonal replicate. Before these tubers were grown under experimental
conditions, they were placed in trays with sand for a week to sprout in the same
environment (20 °C, light intensity of 150 μmol m-2 s-1; light regime 16 L : 8 D). Ninetysix sprouted tubers of P. pectinatus, 96 of the hybrid and 27 of P. filiformis were then
transferred to the experimental set-up. The sandy treatment consisted of sand : clay = 14
: 1 (in dw) while the clay-rich treatment consisted of sand : clay = 3 : 1 (in dw). The
substrate mixture was put in cups with a volume of 150 ml and topped off with a layer of
1 cm washed sand to prevent nutrient leakage into the surrounding water. The low
irradiance level was 50 μmol m-2 s-1 and the high irradiance level was 250 μmol m-2 s-1.
The low irradiance level was accomplished by covering aquaria with neutral density
shading nets. The irradiance was measured 2 cm underneath the water surface with an
136
Ecological zonation in a hybrid complex
underwater quantum sensor (LI-192SA, LICOR, Lincon, NE, USA), which measured
photosynthetically active radiation (PAR). In total eight aquaria were used, four with the
low irradiance level and four with the high irradiance level. Within each aquarium (30 x
40 x 40 cm) two replicates of each P. pectinatus and hybrid clone were present: one with
the sandy substrate mixture and the other with the clay-rich mixture (block design). The
clonal replicates of P. filiformis with the same treatment were also placed in different
aquaria and in such a manner that all aquaria consisted of 27 to 28 cups. All cups were
randomly positioned within each aquarium. Aquaria were also randomly placed within
the growth chamber, which was maintained at 20 °C with a light regime of 22 L : 2 D.
After five weeks of growth the plants were harvested by gently sieving them out of
the substrate. First photosynthetic performance was measured (see below), after which
the plants were separated into three fractions: roots and rhizomes; shoots; and leaves.
Main shoots were distinguished from side shoots, with numbers, lengths and inter-node
lengths being recorded. Dry weights of the roots and rhizomes and of the shoots were
measured after drying for 48 hours at 70 °C. The number of leaves was counted after
which they were divided into two subsamples of which the fresh-weight was measured.
One subsample was used to calculate total dry-weight of the leaves through a fresh- to
dry-weight regression of the subsample (after drying for 48 hours at 70 °C). The other
subsample was stored at – 20 °C after which chlorophyll a and b measurements were
conducted according to Porra et al. (1989). The chlorophyll content of each clone was
assessed from a mixture of leaves from all the clonal replicates of a particular treatment.
Photosynthetic performance was assessed by measuring oxygen-exchange rates of the
clonal replicates of a treatment at a series of irradiance levels to acquire a light-response
curve. The experimental set-up to measure oxygen-exchange was the same as the set-up
used by Pilon & Santamaría (2002a) (for schematic illustration see Pilon & Santamaría
2002b), with the exception that we used smaller Perspex cuvettes in which four clonal
replicates of a particular treatment were placed. This led to a reduction of the total
volume of the closed systems to 294 ml. Oxygen concentration within the closed system
was measured every 10 sec during a period of at least half an hour at irradiances of 25,
50, 75, 100, 150, 200, 300, 400, 500 μmol m-2 s-1. Prior to these measurements the oxygen
concentration during dark respiration was measured. By using linear regression, oxygen
exchange rates per unit time and biomass were calculated at the different irradiance
levels. Subsequently light-response curves were constructed and parameters estimated by
fitting the rectangular hyperbola:
P=
Pm × I
− Rd ,
K 0.5 + I
137
Chapter 6
where P (μg 02 g-1 dw min-1) is the rate of net photosynthesis, Pm (μg 02 g-1 dw min-1) is
the maximum rate of gross photosynthesis, I (μmol m-2 s-1) is the irradiance level, K0.5
(μmol m-2 s-1) is the half-saturation constant, and Rd (μg 02 g-1 dw min-1) is the rate of
dark respiration (Santamaría et al. 1994; Pilon & Santamaría 2002a). Other parameters of
interest were α (μg 02 m2 s g-1 dw min-1) which stands for the apparent quantum yield and
is calculated as the Pm divided by K0.5, and LCP (μmol m-2 s-1) which stands for the light
compensation point and is calculated as the irradiance level at which P = 0 in the above
equation.
To analyse whether P. pectinatus and the hybrid varied in their performance at,
and responses to abiotic factors similar and dissimilar to their home environment (so
called ‘home’ and ‘away’ environments which here are shallow or deep water), ANOVAs
were conducted on the measured variables. Taxa, population, substrate and irradiance
treatment were taken as fixed factors (i.e. the clone was the experimental unit). Only
first-order interactions were tested. Second- and third-order interactions were not tested
since ANOVAs with them included were non-significant. Note that P. filiformis was not
included in these ANOVAs due to the low number of (clonal) replicates and insufficient
plant material for the chlorophyll and photosynthesis measurements. Two t-tests were
carried out for each of the three taxa to analyse potential differentiation in allocation to
leaves and roots specifically at home and away environmental conditions. All variables
were transformed (log(x+1), square root, arcsinus square root) to assure
homoscedasticity and normality of residuals.
Tuber predation by swans
The possibility that tuber predation by Bewick’s swans might structure the hybrid
complex over a water-depth gradient was tested in three steps. First, it was tested
whether tuber predation pressure (i.e. foraging pressure by Bewick’s swans) varies over a
water-depth gradient. Second, it was tested whether P. pectinatus and the hybrid differ in
the size characteristics of tubers they produce. Third, the degree of predation
experienced by different sizes of tubers was analysed by offering swans a mixture of
tubers of known sizes in the substrate and comparing this with the size distribution of
tubers left after one hour of foraging.
Water-depth-related foraging pressure by Bewick’s swans
To analyse whether foraging pressure of Bewick’s swans on tubers varies over the tidal
water-depth gradient, we selected an area of 76000 m2 within the southern Gas-14
pondweed bed (i.e. overlapping the three most western plots at the southern side and the
138
Ecological zonation in a hybrid complex
depth transect; Fig. 1). The water-depth across the area was manually measured at 935
stations, which were equally spaced along three transects, each approximately 280m long
perpendicular to the shore and seven transects parallel to the shore. During the day,
behavioural observations were made from a hide on the shore adjacent to the
experimental field, over the complete feeding period of the swans, i.e. from their arrival
from the breeding grounds to their departure for migration (11-26 September 1998). In
addition, a total of four nights spent in the hide indicated through acoustic observation
(calling of swans in the research area), that the foraging activity during night probably
resembles daytime foraging activity. In total, visual observations were made during 1185
hours or 21% of the total foraging period. The total foraging time of the swans (i.e. swan
hours) was recorded for seven depth zones running parallel to the shore varying in size
from 8100 to 12600 m2. The available observations were used to extrapolate foraging
activity over the complete foraging period. Subsequently average foraging activity (swan
hours per 100 m2) and average relative water-depths in these depth zones were
compared. A one-sided test of correlation was carried out to discover whether tuber
predation pressure indeed increased with decreasing water-depth.
Taxon-specific tuber characteristics
Because tuber predation risk might be affected by tuber size and morphology, an
experiment was conducted to analyse the potential differences between tubers of P.
pectinatus and the hybrid. P. filiformis was not included in this experiment due to a
shortage of plant material. Six clones of P. pectinatus and six of the hybrid were grown
under common-garden conditions. Four clones originated from the transects of Gas-14,
four from Zeloni and four from Sredni shar (Fig. 1). Two clones from Gas-14 were P.
pectinatus clones and two were hybrids. All four clones from Zeloni were hybrids and all
four from Sredni shar were P. pectinatus. One tuber from each clone, derived from the
propagated tubers from the field, was put in a 5.5-L pot. The substrate in the pots
consisted of sand : clay = 3 : 1 (in dw). All pots were randomly distributed over three
tanks filled with tap water and located in a common-garden at Heteren (the
Netherlands). Each tank contained 18 pots (also pots of another experiment). The plants
were left to grow for five months (June - October 2000), after which they were harvested
and the tubers sieved out. From each plant the number of tubers was counted and the
individual tuber fresh weights were measured. Next, a picture was taken of the newlyformed tubers and the following characteristics were measured with a video image
processing system (COMEF 3.0, OEG GmbH. Frankfurt a/d Oder, Germany): length of
the tuber without tip (maximal length from tip onwards) and the tuber width (maximal
width perpendicular to length). To determine whether the two taxa differed in tuber
139
Chapter 6
morphology an ANOVA with taxa as fixed factor was conducted on the average plant
values of tuber biomass, length and width. Additionally, tuber number and total tuber
biomass were tested as measures of fitness. Homoscedasticity and normality of residuals
of the variables was tested and approved. Average tuber biomass of a plant was measured
as the average from the log (x + 1) transformed individual tuber sizes to adjust for the
fact that tuber biomass is strongly right skewed within a plant.
Effect of tuber size on predation risk by Bewick’s swans
To measure whether differences in tuber size affect predation risk by Bewick’s swans, a
laboratory experiment was carried out whereby swans were offered substrate with a
known mixture of tuber sizes. The tuber size distribution remaining after one hour of
foraging was measured and the corresponding predation risk was calculated.
Tuber-predation risk was measured under three different conditions, namely in
shallow water (40 cm) with clay-rich substrate (21% clay particles, i.e. < 63 μm), shallow
water with sandy substrate (1% clay particles), and in deep water (60 cm) with sandy
substrate. For this experiment we made use of tubers from P. pectinatus that had been
collected from Lake IJsselmeer in the Netherlands by pumping substrate through a 3 mm
sieve. The size range of tubers used in the experiment overlapped with the natural size
range of tubers found in the field at Gas-14. The collected tubers were weighed and 11
size classes were defined, differing by 0.1 g fresh weight and ranging from an average size
of 0.05 g fw to 0.95, while the 11th class contained all tubers larger than 1.0 g, with an
average of 1.16 g fw. All treatments consisted of four tanks, each with an area of 1m2 and
a layer of substrate of 26 cm. In each tank the collected tubers were scattered over four
layers with an eventual burial depth of 22.5, 17.5, 12.5 and 7.5 cm in order to mimic the
field situation (together c. 40 g dw/m2)(Santamaría & Rodríguez-Gironés 2002). The
tuber sizes were randomly mixed over the four burial layers, i.e. there was no
relationship between tuber size and tuber burial depth. The four tanks of a treatment
were placed in a basin where the water level could be regulated. Four Bewick’s swans
were let into the basin to forage upon the tubers for one hour. The remaining tubers were
sieved out and each was individually weighed. Data were expressed as predation risk (i.e.
frequency of tubers eaten) per tuber size class, and analysed by means of Generalised
Linear Modelling, with treatment (clay-rich shallow, sandy shallow, and sandy deep) as
fixed effect and tuber size as a continuous co-variate. We used a binomial error
distribution and logit link. The analysis was performed using GLIMMIX procedure of
SAS v.8 (1999).
140
Ecological zonation in a hybrid complex
Results
Distribution of the hybrid complex
Large-scale hybrid zone detection within the Pechora Delta
The molecular analysis of the large-scale sampling in the Pechora Delta at Gas-14
revealed that a hybrid zone was present. Forty one % of the sampled tubers were P.
pectinatus, 19% were P. filiformis and 40% were the hybrid P. x suecicus (Fig. 1). Within
the eight sampling plots all different combinations of taxa occurred: both parent species
but no hybrid present, one or the other parent species and the hybrid present, and all
three taxa present.
Local hybrid-complex distribution across water-depth gradients
The water-depth gradient was steeper at Gas-14 than at Zeloni (Fig. 2). Malvern analysis
showed that at both transects the clay content of the substrate increased with waterdepth (Fig. 2). Here again the differences were larger at Gas-14 than at Zeloni (Fig. 2).
The distribution of the hybrid and P. pectinatus showed a relationship with water-depth
at both locations (Gas-14: df = 1, Wald statistic = 9.72, P = 0.008; Zeloni: df = 1, Wald
statistic = 11.78, P = 0.001; Fig. 2). P. pectinatus occurred in the deeper parts, the hybrid
in the shallower and intermediate ones, and P. filiformis occurred sporadically in shallow
parts (Fig. 2).
Effect of irradiance and substrate type
Because P. filiformis was not included in the ANOVAs, all results presented from here on
are based on P. pectinatus and hybrid plants unless stated otherwise. P. pectinatus
differed significantly from the hybrid in several ways: P. pectinatus had more leaves than
the hybrid but they were smaller (Table 1, Fig. 3). Allocation to shoots was consistently
larger for the hybrid than for P. pectinatus, as was the internode length of the main shoot
and chlorophyll (a + b) concentration (Table 1, Fig. 3). A notable result was that P.
pectinatus and the hybrid did not differ in any of the photosynthetic parameters (Table
1). A comparison of the variables that did differ between P. pectinatus and the hybrid
with those measured in P. filiformis, indicated that the hybrid did not have intermediate
values (Fig. 3).
Irradiance had a strong effect on nearly all variables (Table 1). High irradiance
resulted in increased vegetative biomass, number of leaves, number of side shoots,
internode- and total-length of the side shoots, and allocation to roots, while chlorophyll
(a + b) concentration and allocation to leaves and to shoots decreased (Fig. 4). Plants
141
Chapter 6
grown at low irradiance had higher rates of dark respiration (Rd), maximum rates of
gross photosynthesis (Pm) and apparent quantum yield (α) than plants grown at high
irradiance, while they had a lower half-saturation constant (K0.5) and light compensation
point (LCP).
a
25
15
5
1.5
average leaf biomass
(mg dw)
leaf number
35
b
1.0
0.5
% allocation to shoots
30
c
20
10
0
P. pectinatus
Hybrid
P. filiformis
average internode length
main shoot (mm)
0.0
20
d
15
10
5
0
P. pectinatus
Hybrid
P. filiformis
Figure 3 Leaf number (a), average leaf biomass (b), percentage allocation to shoots (c) and, average
internode length of the main shoot (d) of P. pectinatus, P. filiformis and their hybrid, P. x. suecicus.
Based on the average values of six clones for P. pectinatus and the hybrid and on three clones for P.
filiformis. Error bars represent standard errors. P. pectinatus and the hybrid were significantly
different for all four variables (P < 0.05). P. filiformis was not included in significance testing due to
its small sample size.
Substrate type affected three of the four variables that were not affected by
irradiance, namely leaf biomass, internode-length and total length of the main shoot.
These three variables were all significantly larger for plants grown on sandy substrate.
Furthermore, growth on the sandy substrate also resulted in significantly higher
vegetative biomass and number of leaves, while rate of dark respiration (Rd) and
maximum rate of gross photosynthesis (Pm) were lower on the sandy substrate treatment
(Table 1). In addition, the interaction between substrate and irradiance treatment had
significant effects on chlorophyll (a + b) concentration (the response to irradiance was
142
Ecological zonation in a hybrid complex
larger under sandy substrate than under clay-rich conditions, Table 1) and for the
allocation to leaves and roots (Table 1, Fig. 4).
Table 1 F-ratios and significance levels of ANOVAs on morphological traits, biomass yield and
allocation traits, chlorophyll concentration and photosynthesis parameters of P. pectinatus and the
hybrid P. x suecicus clones, grown at a factorial combination of two substrate mixtures (sand : clay
in dw = 14 : 1 vs. 3 :1) and two irradiance levels (50 vs. 250 µmol m-2 s-1 ). Pop. refers to the
population of origin of the clones. *P < 0.05, **P < 0.01, ***P < 0.001
Error df
Factor df:
Taxa
1
Morphometrics & allocation
vegetative biomassa 37 0.21
37 12.58**
% shoot biomassb
b
37 1.63
% leaf biomass
37 2.02
% root biomassb
c
37 66.60***
no. leaves
a 37 85.61***
average leaf biomass
37 1.26
length main shoota
av. internode length 37 4.45*
main shoota
37 1.27
no. of side shootsc
av. length side shootsa 37 1.95
av. internode length 37 0.00
side shootsa
Chlorophyll
Chlorophyll A + Ba
Chlorophyll A / Ba
Pop. Subst.
1
1
1
1
1
1
40.50*** 0.42 1.11
0.01
0.35 0.47
0.33
20.59*** 0.02 1.19
1.47
0.76 0.03
0.00
7.09*
0.13
65.12*** 6.01* 7.09* 8.22** 0.29 3.44
5.00*
7.60** 0.01
145.11*** 6.48* 4.16* 16.65*** 1.51 3.50
5.69*
0.51
4.26*
9.64**
4.32*
40.49*** 0.15 2.93
4.46*
0.01 0.06
0.32
0.08
1.46 0.04
0.00
0.77 0.04
0.93
5.20* 10.17**
0.57
0.01 1.08
0.59
0.10 0.03
0.04
3.35
8.21**
0.27
0.15 1.44
0.36
0.16 0.00
0.02
2.33
0.10
17.35*** 0.54 1.09
0.31
0.16 0.35
0.55
0.12
0.21
10.05**
0.00 2.39
1.11
1.11 4.53* 0.01
0.60
0.02
12.58**
1.40 4.36* 0.78
0.85 4.88* 0.34
58.38*** 0.77 1.83
0.24
3.80
0.52
0.04
Photosynthesis
Pma
37
0.19
0.37
K0.5a
35
0.16
1.44
37
2.29
35
0.06
35
1.38
LCP
1
0.54
1.30
a
1
7.36*
4.35*
αa
TxP TxS TxI PxS PxI SxI
3.46
37
Rd
1
0.00
37
a
Irrad.
0.96
0.08 0.36 13.98***
2.87 0.16
0.80
0.25 0.18
0.04
4.43*
25.87*** 0.32 1.25
0.99
3.36 2.62
3.17
0.00
27.59*** 0.78 0.05
0.02
0.13 0.06
2.04
1.26
6.11*
21.58*** 0.45 2.13
1.29
3.78 2.52
2.98
1.50
0.44
55.11*** 1.70 0.00
0.01
0.84 0.08
3.25
0.00
0.68
36.38*** 1.54 1.00
0.19
0.03 0.02
0.53
3.50
a
: log (x + 1)
b
: arcsinus square root
c
: square root
143
Chapter 6
leaves
P. pectinatus
% allocation
70
roots
Hybrid
P. filiformis
50
30
10
LI
sand
LI
clay
HI
sand
HI
clay
LI
sand
LI
clay
HI
sand
HI
clay
LI
sand
LI
clay
HI
sand
HI
clay
Figure 4 Changes in biomass allocation to roots and to leaves at different combinations of
irradiance and substrate type for three taxa: Potamogeton pectinatus, P. filiformis and their hybrid
P. x suecicus. LI: low irradiance (50 μmol m-2 s-1); HI: high irradiance (250 μmol m-2 s-1); sand: low
clay content (sand : clay = 14 : 1 in dw); clay: high clay content (sand : clay = 3 : 1 in dw). Error
bars represent standard errors. The arrows indicate the conditions at which the taxa generally
occur in the field. Significance values between allocation to leaves and roots for the LI clay and HI
sand treatments are given in Table 2.
The origin of the clones also had an effect on a number of variables: clones from
Zeloni had a longer main shoot, higher average leaf biomass and allocated more to their
roots but less to their leaves in comparison with clones from Gas-14. However, the factor
population showed no interaction with substrate type or irradiance for these characters
(i.e. no among population variation in plastic responses). On the other hand, internodelength and total length of the side shoots did show a significant interaction between
population and irradiance, revealing in both cases that plants from Gas-14 responded
less to irradiance than plants originating from Zeloni.
In general few variables were significantly affected by an interaction between taxa
and irradiance or substrate (Table 1). Leaf number (which was consistently higher for P.
pectinatus than the hybrid) increased more with increasing irradiance than for the
hybrid. Internode length of the side shoots showed the opposite responses to substrate
type for the two taxa: it decreased with increased clay content for P. pectinatus while it
increased for the hybrid. Notably, biomass allocation to leaves and to roots was
differently affected by substrate and irradiance depending on the taxon (i.e. significant
taxon x substrate and taxon x irradiance interaction) and the factor taxa had no overall
effect (Fig. 4). In the case of allocation to shoots, however, the opposite pattern was
found: the factor taxa had an overall effect but its interaction with substrate or irradiance
144
Ecological zonation in a hybrid complex
Table 2 Results of t-tests on the allocation to leaves and roots in three taxa of a pondweed hybrid
complex grown at low irradiance and clay-rich substrate (as in deep water) and at high irradiance
and sandy substrate (as in shallow water). Underlined water levels represent levels at which the
taxa occur in the field.
Allocation to leaves and roots
conditions as
at water level
t-value
P
10
10
3.26
0.22
0.009
0.828
deep
shallow
10
10
10.74
-3.33
< 0.001
0.008
deep
shallow
4
4
0.00
-2.42
1.000
0.073
P. pectinatus
low irradiance - clay rich substrate
high irradiance - sandy substrate
deep
shallow
Hybrid
low irradiance - sandy substrate
high irradiance - clay rich substrate
P. filiformis
low irradiance - sandy substrate
high irradiance - clay rich substrate
df
was not significant (Fig. 3c). P. filiformis increased its investment into roots at the cost of
a low allocation to leaves at high irradiance, while P. pectinatus did the opposite at low
irradiance (Fig. 4). The hybrid showed a more plastic allocation strategy, showing both
increased allocation to roots at high irradiance and increased allocation to leaves at low
irradiance (Fig. 4). Hence, the parental taxa in the ‘home’ treatments (i.e. low irradiance
and clay-rich substrate for P. pectinatus and high irradiance and sandy substrate for P.
filiformis) seemed to differentiate their allocation to roots and leaves, while maintaining a
comparable allocation to leaves and roots in the ‘away’ treatments (Table 2, Fig. 4). In
contrast the hybrid had differentiated allocation at its ‘home’ and ‘away’ environments
(Table 2, Fig. 4) similar to that of the parent taxa in their home treatments.
Tuber predation by swans
Water-depth-related foraging pressure by Bewick’s swans
The swan observations carried out at Gas-14, confirmed that foraging pressure decreased
with increasing water-depth (r = - 0.81, P = 0.026, one-sided test; Fig. 5). Data from the
shortest distance class from the shore were omitted from this analysis because the
presence nearby of predatory foxes most likely discouraged swan foraging. Nevertheless,
when they were included the foraging effect remained significant (r = -0.70, P = 0.041).
145
50
10
40
8
30
6
20
4
10
2
0
0
0-4
4
0
0-8
0
0
0
0
0
-12 0-16 0-20 0-24 0-28
0
8
24
20
16
12
(cm)
12
relative water depth
(swan hours / 100 m2)
predation pressure
Chapter 6
0
distance to shore (m)
Figure 5 Predation pressure on pondweed tubers by Bewick’s swans along a 280 m long transect
running from the shore to a deep-water gully, covering a total area of 76000 m2 at Gas-14.
Predation pressure was measured as the total amount of time that swans were foraging during
autumn 1998. Values are extrapolated from detailed observations over 22% of the total period that
swans were observed foraging in the area. Also indicated is the relative water-depth along the same
gradient.
Taxon-specific tuber characteristics
The morphology of the tubers of P. pectinatus and the hybrid differed significantly (Fig.
6). Although P. pectinatus tubers were shorter, the width was larger (F1, 10 = 31.80, P <
0.001; F1, 10 = 111.68, P < 0.001 respectively). Thus tubers of P. pectinatus are more
spherical than those of the hybrid. As a result P. pectinatus produced heavier tubers than
the hybrid (F1, 10 = 23.93, P = 0.001). Furthermore, despite producing a comparable
number of tubers (F1, 10 = 0.99, P > 0.05), P. pectinatus had a higher total tuber biomass
than the hybrid (F1, 10 = 8.49, P = 0.0154).
It must be noted that tubers produced under experimental conditions tend to be
smaller than those produced in the field. The differences in size of tubers produced
among (P. pectinatus) clones, however, persists over subsequent asexual generations
(Hangelbroek et al. unpublished manuscript). Moreover, environmental effects on tuber
size are most likely additive, resulting in comparable differences among clones, even
though absolute sizes may have increased (Hangelbroek & Santamaría 2004). This
indicates that, although tuber sizes measured in this experiment may be smaller than in
the field, the size differences among taxa are proportional.
146
Ecological zonation in a hybrid complex
50
a
P. pectinatus
Hybrid
40
30
20
a
a
b
a
b
10
a
b
a
0
tuber
biomass
(mg fw)
tuber
length
2
(mm )
b
tuber
width
(mm)
total tuber total tuber
number
biomass
2
(10 mg fw)
Figure 6 Tuber characteristics of P. pectinatus and the hybrid, P. x suecicus when grown at
common-garden conditions. Different letters symbolise significant differences between taxa.
Effect of tuber size on predation risk by Bewick’s swans
Predation risk differed significantly among treatments (substrate and water-depth; F2, 5372
= 45.72, P < 0.001). A significant size x treatment interaction (F3, 5372 = 42.45, P < 0.001)
indicated that data were best fitted by a heterogeneous slopes model. Predation risk
increased with tuber size in all three treatments (t = 15.09, P < 0.001; t = 11.32, P < 0.001;
t = 8.46, P < 0.001, for clay-rich shallow, sandy shallow, and sandy deep respectively),
and the increase was steeper at the clay-rich than at the sandy substrate (Fig. 7).
Discussion
In the Pechora Delta, northern Russia, where the geographic distributions of P.
pectinatus and P. filiformis overlap, we found that the hybrid P. x suecicus occurs
frequently. On a local scale the distribution of the hybrid complex was related to the
presence of a water-depth gradient: P. pectinatus occurs alone in the deeper parts, the
147
Chapter 6
Predation risk
1.0
0.8
0.6
0.4
clay-rich shallow
sandy shallow
sandy deep
0.2
0.0
0.0
0.2
0.4
0.6
0.8
1.0
1.2
tuber size (g fw)
Figure 7 Predation risk of tubers of different sizes by Bewick’s swans when all tuber sizes are
accessible to the swans (i.e. no relationship between tuber size and burial depth). Experiments were
carried out at three different conditions varying in water level (deep vs. shallow) and in clay
content of the substrate (clay-rich vs. shallow). The lines represent fits by logistic regression.
hybrid alone in the shallower water (occasionally accompanied by P. filiformis), and at
intermediate depths P. pectinatus and the hybrid co-occur. The complete separation of P.
pectinatus from the hybrid at the extremes of the environmental clines implies that
ecological selection takes place. Moreover, if vegetative biomass is taken as a surrogate
for performance (i.e. not sexual reproduction), our laboratory experiments indicate that
the overall performance of the hybrids was not lower than that of P. pectinatus, thereby
allowing us to reject that endogenous factors structure this local hybrid complex.
A number of characters were taxon-specific, but they did not explain the physical
separation found in the field. On the contrary, they would seem more likely to contribute
to enhanced performance in the so-called ‘away’ environment, i.e. deep low light
conditions for the hybrid. For instance, the hybrid had a higher chlorophyll (a + b)
concentration than P. pectinatus which does not seem necessary in shallow areas with
high irradiance (Boardman 1977). Further, allocation to shoots and average internode
length of the main shoot were both higher for the hybrid, even though this would seem
more beneficial to plants growing at greater depths, facilitating growth towards the light
(Barko & Smart 1981). On the other hand, P. pectinatus did produce more leaves, a
148
Ecological zonation in a hybrid complex
strategy profitable at low irradiance levels since it increases the total amount of leaf area
exploitable for light capture (Björkman 1981). But the hybrids produced heavier leaves,
most likely as a result of increased length (personal observation) thereby also resulting in
an increased leaf area. Moreover, if we compare these characters, with the necessary
caution, with those of P. filiformis, we indeed see that P. filiformis does behave as would
be expected from a species occurring in intermediate to shallow waters. Namely, it seems
to produce fewer and smaller leaves than P. pectinatus and allocation to shoots and
average internode length of the main shoot seem to be less than in P. pectinatus. These
results of differences in static (non-plastic) characters therefore do not explain the
physical separation of taxa. The differences in tuber characteristics between the two taxa,
however, may potentially do so. Total tuber biomass was higher in P. pectinatus than in
the hybrid as a result of differences in tuber size. But because the number of tubers
produced was similar between the two taxa, their contribution to the next asexual
generation is also similar unless tuber size affects tuber fitness (i.e. survival and
performance). This difference in tuber size may have a crucial affect on the distribution
of these taxa along the water-depth gradient. On the one hand, when the large tubers of
P. pectinatus are available to the swans (chiefly in shallow water) they are most likely to
be preferentially eaten, while the tubers of the hybrid may escape predation owing to
their smaller size. On the other hand, in the deeper water where predation pressure is
low, the large tuber size of P. pectinatus may result in a competitive advantage
(Rodríguez-Gironés et al. 2003) particularly at low light conditions (Black 1958). The
extra starch reserves in the P. pectinatus tubers may lead to enhanced growth of the
shoots before roots are produced. Consequently, P. pectinatus may capture the scarce
light, potentially resulting in competitive exclusion of the hybrid. At intermediate waterdepths, where swans may still be able to reach the top substrate layer, larger tubers may
escape predation by their deeper burial depth (spatial refuge) compared with smaller
tubers, resulting in small shallow-buried tubers only being available to Bewick’s swans
(Santamaría & Rodríguez-Gironés 2002; Hangelbroek et al. unpublished manuscript). In
the latter case both taxa would be expected to be present, which is indeed the case at both
water-depth transects.
As mentioned before, differences in phenotypic plasticity (i.e. reaction norms)
may also reveal adaptation to local conditions that could explain the separation of the
taxa and maintenance of the hybrid zone found in the field. P. pectinatus and the hybrid
showed high phenotypic plasticity for all measured characters, with the exception of
chlorophyll a/b ratio. However, nearly all of the characters responded similarly to the
variation in substrate composition and irradiance. Allocation to leaves and roots, in
contrast, did show taxon-specific responses to irradiance and to substrate type. The
149
Chapter 6
parent taxa optimise their performance in the conditions in which they occur in the field
(i.e. in their home environment) by differentiating their allocation to leaves and to roots.
Thus P. pectinatus allocates more to leaves than to roots at low light conditions (home),
while at high light conditions (away) it allocates equal amounts to them. P. filiformis, on
the other hand, shows a contrasting pattern to P. pectinatus but it is in agreement with
differentiation and non-differentiation of allocation at home and away environments
respectively: P. filiformis allocates more to its roots than to its leaves at high light
conditions (which in the field is related to sandy substrate and home environment) while
it allocates equal amounts to leaves and roots at low light conditions (away). If
differentiating between allocation is indeed the key adaptation to local abiotic
conditions, then the hybrid seems to have combined the beneficial response to low
irradiance from P. pectinatus with the beneficial response to high irradiance from P.
filiformis (i.e. combination of different parental trait responses). This would imply that
the hybrid could occur in both environmental conditions. However, this is not the case at
our field sites, possibly as a result of competition between tubers in the deeper, low-light
areas (see above). One should also bear in mind that the differences in allocation
response of the two taxa (P. filiformis was not tested) was not accompanied by
differences in vegetative biomass, i.e. it did not result in differences in performance. This
lack of associated difference in performance may be the consequence of growing the
plants alone under controlled conditions. Siebentritt & Ganf (2000) for instance, found
that two species of Bolboschoenus both performed well in monoculture at a range of
environmental conditions but when grown in mixture one became dominant under
specific environmental conditions. This suggests that the taxon-specific allocation
patterns found in this study may pay off in more natural conditions where competition
with other plants for limiting recourses, as light or nutrients, occurs.
The traits of the hybrid seem to be transgressive (i.e. extreme) and not
intermediate to the parent species. Intermediacy of hybrids was long thought to be the
rule, but nowadays transgressive traits are often reported (Schwarzbach et al. 2001;
Rosenthal et al. 2002). Rosenthal et al. (2002) suggested that ecological segregation, as we
see here, may be the result of the generation of such extreme traits. If the tubers of the
hybrid are not only smaller than those of P. pectinatus but also than those of P. filiformis
then this trait may indeed have enabled the hybrid to establish itself in a habitat (the
shallow part of the cline) where both parents could not. Other suggestions of Rosenthal
et al. (2002) leading to ecological segregation were new combinations of different
parental traits or true intermediacy of parental traits. The latter did not seem to occur
here but the former seemed to occur with the allocation pattern of the taxa if ‘trait
responses’ may be regarded as ‘traits’. Nevertheless, here the combination of different
150
Ecological zonation in a hybrid complex
parental trait responses does not lead to segregation, since not a new habitat but a wider
range of habitats can be occupied by the hybrid (i.e. those of both parent taxa), leading to
co-occurrence.
When comparing the abiotic (substrate and irradiance) and biotic (tuber
predation) factors potentially affecting the zonation and maintenance of this hybrid
complex, we see that not only do the abiotic factors seem to create areas where hybrids
seem to have a better performance than at least one parent (shallow and allocation
pattern) but also the biotic factor results in the persistence of the hybrid, since the hybrid
seems more resistant to predation. This is contrasting with what is most often found for
hybrids namely lower resistance to herbivory (Strauss 1994; Fritz 1999).
P. filiformis was expected to occur in the shallow, high irradiance areas,
according to its taxon-specific traits and its allocation pattern (see above) and according
to literature (Casper & Krausch 1980; Preston 1995; Hollingsworth et al. 1996). However,
P. filiformis was encountered only sparingly in such areas. A possible explanation could
be that P. filiformis makes large tubers just as P. pectinatus does and that high predation
pressure subsequently reduces its frequency in the shallow water. Whereas P. pectinatus
can take refuge in the deeper water, because of its allocation pattern, P. filiformis cannot
and therefore occurs in limited numbers. Abiotic and biotic factors related to waterdepth gradient may thus have opposing effects on the suitability of an environment for a
particular taxa (e.g. P. filiformis in shallow water, but also the hybrid in deeper water)
potentially resulting in its absence from that environment.
In conclusion, in the Pechora Delta, where the pondweeds P. pectinatus and P.
filiformis meet, a hybrid zone occurs. At a local scale across an environmental gradient,
abiotic and biotic factors were found to simultaneously play an important role in
structuring and maintaining the hybrid complex. Abiotic factors (irradiance and
substrate type) may promote ecological differentiation through differences in biomass
allocation patterns while the biotic factor tuber-foraging pressure by Bewick’s swans
involved differences in tuber-predation risk related to tuber size. Competition is also
likely to be involved, mediated by differences in tuber size. Furthermore, it can be
concluded that abiotic and biotic factors related to water-depth gradient may not have
comparable effects on the suitability of a particular environment for a taxon. Together
abiotic and biotic factors lead to a specific pattern and maintenance of the hybrid
complex structure, which can not be explained by them separately.
151
Chapter 6
Acknowledgements
We are grateful for the co-operation with Dr. A.I. Taskayev and Dr. V. Volodin (Institute of
Biology, Syktyvkar, Russia) that enabled us to work in the Pechora Delta. We further thank S.A.
Petrusjenko, A.S. Glotov and S.A. Kuznetsov for their field-assistance in the Pechora Delta and E.
Wessel for his assistance in the organisation of the expedition. Furthermore, we would like to
thank H. Korthals, S. van Dijk en B. van Lith for their assistance in the Netherlands and J. van
Groenendael for his critical comments on the manuscript. This work was supported by
Netherlands Organization for Scientific Research (NWO; project 047-002.008).
References
Arnold, M.L. & Hodges, S.A. (1995) Are natural hybrids fit or unfit relative to their parents?
Trends in Ecology & Evolution 10: 67-71.
Ayres, D.R., Garcia-Rossi, D., Davis, H.G., & Strong, D.R. (1999) Extent and degree of
hybridization between exotic (Spartina alterniflora) and native (S. foliosa) cordgrass
(Poaceae) in California, USA determined by random amplified polymorphic DNA
(RAPDs). Molecular Ecology 8: 1179-1186.
Bance, H.M. (1946) A comparative account of the structure of Potamogeton filiformis Pers. and P.
pectinatus L. in relation to the identity of a supposed hybrid of these species. Transactions
& Proceedings of the Botanical Society of Edinburgh 34: 361-367.
Barko, J.W. & Smart, R.M. (1981) Comparative influences of light and temperature on the grwoth
and metabolism of selected submersed freshwater macrophytes. Ecological Monographs 51:
219-235.
Bartish, I.V., Rumpunen, K., & Nybom, H. (2000) Combined analyses of RAPDs, cpDNA and
morphology demonstrate spontaneous hybridization in the plant genus Chaenomeles.
Heredity 85: 383-392.
Barton, N.H. & Hewitt, G.M. (1985) Analysis of hiybrid zones. Annual Review of Ecology and
Systematics 16: 113-148.
Beekman, J.H., van Eerden, M.R., & Dirksen, S. (1991) Bewick's Swans Cygnus columbianus
bewickii utilising the changing resource of Potamogeton pectinatus during autumn in the
Netherlands. Wildfowl Supplement 1: 238-248.
Beekman, J.H., Nolet, B.A., & Klaassen, M. (2002) Skipping swans: fuelling rates and wind
conditions determine differential use of migratory stopover sites of Bewick's Swans Cygnus
bewickii. Ardea 90: 437-460.
Beekman, J.H., van Eerden, M.R., Mineyev, Y.N., Luigujõe, L., & Den Hollander, H.J. (1996)
Landsat satellite images for detection of submerged macrophytes: in search of potential
stop-over feeding sites for Bewick's Swans (Cygnus columbianus bewickii) along their
migratory route. Game and Wildlife 13: 421-450.
152
Ecological zonation in a hybrid complex
Björkman, O. (1981) Responses to different quantum flux densities. In: Physiological plant ecology
1. Responses to the physical environment (eds O.L. Lange, P.S. Nobel, C.B. Osmond & H.
Ziegler), pp. 57-107. Springer-Verlag, New York.
Black, J.N. (1958) Competition between plants of different initial seed sizes in swards of
subterranean clover (Trifolium subterraneum L.) with particular reference to leaf area and
the light microclimate. Australian Journal of Agricultural Research 9: 299-318.
Boardman, N.K. (1977) Comparative photsynthesis of sun and shade plants. Annual Review of
Plant Physiology 28: 355-377.
Boecklen, W.J. & Spellenberg, R. (1990) Structure of herbivore communities in two oak (Quercus
spp) hybrid zones. Oecologia 85: 92-100.
Campbell, D.R. & Waser, N.M. (2001) Genotype-by-environment interaction and the fitness of
plant hybrids in the wild. Evolution 55: 669-676.
Campbell, D.R., Crawford, N., Brody, A.K., & Forbis, T.A. (2002) Resistance to pre-dispersal seed
predators in a natural hybrid zone. Oecologia 131: 436-443.
Caraway, V., Carr, G.D., & Morden, C.W. (2001) Assessment of hybridization and introgression in
lava- colonizing Hawaiian Dubautia (Asteraceae : Madiinae) using RAPD markers.
American Journal of Botany 88: 1688-1694.
Casper, S.J. & Krausch, H.D. (1980) Pteridophyta und Anthophyta. Fischer, Stuttgart.
Cruzan, M.B. & Arnold, M.L. (1993) Ecological and genetic associations in an Iris hybrid zone.
Evolution 47: 1432-1445.
Eisenbach, J. (1996) Three-trophic-level interactions in cattail hybrid zones. Oecologia 105: 258265.
Elven, R. & Johanson, V. (1984) Sliretjønnaks - Potamogenton vaginatus - ny for Norge. Blyttia 42:
39-43.
Emms, S.K. & Arnold, M.L. (1997) The effect of habitat on parental and hybrid fitness: Transplant
experiments with Louisiana irises. Evolution 51: 1112-1119.
Endler, J.A. (1973) Gene flow and population differentiation. Science 179: 243-250.
Endler, J.A. (1977) Geographic variation, speciation, and clines. Princeton University Press,
Princeton.
Fritsche, F. & Kaltz, O. (2000) Is the Prunella (Lamiaceae) hybrid zone structured by an
environmental gradient? Evidence from a reciprocal transplant experiment. American
Journal of Botany 87: 995-1003.
Fritz, R.S. (1999) Resistance of hybrid plants to herbivores: Genes, environment, or both? Ecology
80: 382-391.
Fritz, R.S., Nicholsorians, C.M., & Brunsfeld, S.J. (1994) Interspecific hybridization of plants and
resistance to herbivores: hypotheses, genetics, and variable responses in a diverse herbivore
community. Oecologia 97: 106-117.
Haldane , J.B.S. (1948) The theory of a cline. Journal of Genetics 48: 277-284.
153
Chapter 6
Hangelbroek, H.H. & Santamaría, L. (2004) Regulation of propagule size in the aquatic pseudoannual Potamogeton pectinatus: are genetic and maternal non-genetic effects additive?
Evolutionary Ecology Research 6: 147-161.
Hangelbroek, H.H., Santamaría, L., & De Boer, T. (2003) Local adaptation of the pondweed
Potamogeton pectinatus to contrasting substrate types mediated by changes in propagule
provisioning. Journal of Ecology 91: 1081-1092.
Hangelbroek, H.H., Santamaría, L., & Rodríguez-Gironés, M.A. (unpublished manuscript)
Population responses to propagule predation: the role of clonal propagule size.
Hardig, T.M., Brunsfeld, S.J., Fritz, R.S., Morgan, M., & Orians, C.M. (2000) Morphological and
molecular evidence for hybridization and introgression in a willow (Salix) hybrid zone.
Molecular Ecology 9: 9-24.
Hollingsworth, M.L., Bailey, J.P., Hollingsworth, P.M., & Ferris, C. (1999) Chloroplast DNA
variation and hybridization between invasive populations of Japanese knotweed and giant
knotweed (Fallopia, Polygonaceae). Botanical Journal of the Linnean Society 129: 139-154.
Hollingsworth, P.M., Preston, C.D., & Gornall, R.J. (1996) Isozyme evidence for the parentage and
multiple origins of Potamogeton x suecicus (P. pectinatus x P. filiformis,
Potamogetonaceae). Plant Systematics and Evolution 202: 219-232.
Hultén, E. & Fries, M. (1986) Atlas of north European plants north of the Tropic of Cancer. Koeltz
Scientific Books, Königstein.
Kaplan, Z. (2002) Phenotypic plasticity in Potamogeton (Potamogetonaceae). Folia Geobotanica 37:
141-170.
Kautsky, L. (1991) Insitu experiments on interrelationships between six brackish macrophyte
species. Aquatic Botany 39: 159-172.
Key, K.H.L. (1968) The concept of stasipatric speciation. Systematic Zoology 17: 14-22.
King, R.A., Gornall, R.J., Preston, C.D., & Croft, J.M. (2001) Molecular confirmation of
Potamogeton x bottnicus (P. pectinatus x P. vaginatus, Potamogetonaceae) in Britain.
Botanical Journal of the Linnean Society 135: 67-70.
Moore, W.S. (1977) An evaluation of narrow hybrid zones in vertebrates. Quarterly Review of
Biology 52: 263-277.
Nolet, B.A. & Drent, R.H. (1998) Bewick's Swans refuelling on pondweed tubers in the Dvina Bay
(White Sea) during their spring migration: first come, first served. Journal of Avian Biology
29: 574-581.
Nolet, B.A. & Mooij, W.M. (2002) Search paths of swans foraging on spatially autocorrelated
tubers. Journal of Animal Ecology 71: 451-462.
Nolet, B.A., Langevoord, O., Bevan, R.M., Engelaar, K.R., Klaassen, M., Mulder, R.J.W., & Van
Dijk, S. (2001) Spatial variation in tuber depletion by swans explained by differences in net
intake rates. Ecology 82: 1655-1667.
Pilon, J. & Santamaría, L. (2002a) Clonal variation in morphological and physiological responses to
irradiance and photoperiod for the aquatic angiosperm Potamogeton pectinatus. Journal of
Ecology 90: 859-870.
154
Ecological zonation in a hybrid complex
Pilon, J. & Santamaría, L. (2002b) Clonal variation in the thermal response of the submerged
aquatic macrophyte Potamogeton pectinatus. Journal of Ecology 90: 141-152.
Porra, R.J., Thompson, W.A., & Kriedemann, P.E. (1989) Determination of accurate extinction
coefficients and simultaneous equations for assaying chlorophyll a and b extracted with
four different solvents: verification of the concentration of chlorophyll standards by atomic
absorption spectroscopy. Biochimica Et Biophysica Acta 975: 384-394.
Preston, C.D. (1995) Pondweeds of Great Britain and Ireland. Botanical Society of the British Isles,
London.
Rodríguez-Gironés, M.A., Sandsten, H., & Santamaría, L. (2003) Asymmetric competition and the
evolution of propagule size. Journal of Ecology 91: 554-562.
Rosenthal, D.M., Schwarzbach, A.E., Donovan, L.A., Raymond, O., & Rieseberg, L.H. (2002)
Phenotypic differentiation between three ancient hybrid taxa and their parental species.
International Journal of Plant Sciences 163: 387-398.
Santamaría, L. & Rodríguez-Gironés, M.A. (2002) Hiding from swans: optimal burial depth of sago
pondweed tubers foraged by Bewick's swans. Journal of Ecology 90: 303-315.
Santamaría, L., Dias, C., & Hootsmans, M.J.M. (1994) The influence of ammonia on the growth
and photosynthesis of Ruppia drepanensis tineo from Donana National Park (Sw Spain).
Hydrobiologia 276: 219-231.
SAS Institute, I. (1999) SAS version 8 Cary, NC.
Schwarzbach, A.E., Donovan, L.A., & Rieseberg, L.H. (2001) Transgressive character expression in
a hybrid sunflower species. American Journal of Botany 88: 270-277.
Schweitzer, J.A., Martinsen, G.D., & Whitham, T.G. (2002) Cottonwood hybrids gain fitness traits
of both parents: A mechanism for their long-term persistence? American Journal of Botany
89: 981-990.
Siebentritt, M.A. & Ganf, G.G. (2000) Influence of abiotic and biotic factors on two co-occurring
species of Bolboschoenus. Marine and Freshwater Research 51: 73-80.
Slatkin, M. (1973) Gene flow and selection in a cline. Genetics 75: 733-756.
Steen, S.W., Gielly, L., Taberlet, P., & Brochmann, C. (2000) Same parental species, but different
taxa: molecular evidence for hybrid origins of the rare endemics Saxifraga opdalensis and
S. svalbardensis (Saxifragaceae). Botanical Journal of the Linnean Society 132: 153-164.
Strauss, S.Y. (1994) Levels of herbivory and parasitism in host hybrid zones. Trends in Ecology &
Evolution 9: 209-214.
Van Eerden, M.R., Beekman, J.H., Smit, M., & Oosterbeek, K. (1997) Patch use by Bewick's Swans
Cygnus columbianus bewickii feeding upon Sago Pondweed Potamogeton pectinatus in
shallow lakes in the Netherlands: variation in exploitation threshold caused by social,
environmental and time dependent factors. In: Patchwork, pp. 187-214. PhD-thesis
University Groningen, Lelystad.
Van Wijk, R.J. (1989) Ecological studies on Potamogeton pectinatus L .3. Reproductive strategies
and germination ecology. Aquatic Botany 33: 271-299.
155
Chapter 6
Wang, H., McArthur, E.D., Sanderson, S.C., Graham, J.H., & Freeman, D.C. (1997) Narrow hybrid
zone between two subspecies of big sagebrush (Artemisia tridentata: Asteraceae) .4.
Reciprocal transplant experiments. Evolution 51: 95-102.
Wiegleb, G. & Kaplan, Z. (1998) An account of the species of Potamogeton L. (Potamogetonaceae).
Folia Geobotanica 33: 241-316.
156
Chapter 7
Summarising discussion
In the course of evolutionary time species or populations of species may become adapted
to the environmental conditions they experience through natural selection. Some classic
examples are cactus’ and camels adapted to long term drought, Darwin’s finches to
dietary variation (Grant 1986) and, within species, the peppered moth to changes in
predation risk as a result of darkening of tree trunks due to pollution (Kettlewell 1973).
Besides adaptation at the species and population level, adaptation may also occur within
populations for example to varying levels of herbivory (Sork et al. 1993), elevation (Galen
et al. 1991) or interspecific competition (Prati & Schmid 2000). Yet, local adaptation
within populations is less likely to occur as frequent as between populations, since gene
flow within populations is generally high. As a result, selective forces must be strong to
compensate for the equalising effect of gene flow. An example of such a strong selective
force may be predation on reproductive propagules (sexual or asexual seeds, or
specialised vegetative organs of reproduction). Predation on propagules is likely to have a
strong selective effect on defence mechanisms since predation directly decreases effective
fecundity (Janzen 1969). Defence mechanisms are generally costly in the absence of
predation because the unnecessary defence mechanisms will come at the expense of
reproductive output. Therefore, the allocation to defence and/or the frequency of
defended genotypes is expected to vary in accordance with varying levels of propagule
predation pressure. At a local scale, contrasting environmental conditions, such as
variation in predation pressure, may thus lead to local adaptation within a population.
Such a process will be reflected by a distinct spatial structure of genotypes within the
population. However, a spatial pattern of genotypes may also reflect non-adaptive
evolutionary change. Such non-selection induced spatial patterns may result from
random factors such as restricted gene flow followed by genetic drift or founder effects.
Also, if phenotypes rather than genotypes are studied, a pattern may solely be the result
of plastic responses to environmental variation. Therefore, a number of conditions must
be tested before it can be concluded that adaptation to local conditions has occurred and
Chapter 7
has resulted in a population structure (see General introduction and below). Contrasting
environmental conditions at a local scale may not only affect within species spatial
structure, but may also affect between species community structure. Species may be
segregated across environmental gradients because of differential habitat requirements
resulting from past selection. On the other hand, in the case of for instance a hybrid
complex, the abundance of different taxa may also be affected by potential genetic
incompatibility of hybrids.
In this thesis the focus was on the factors determining local spatial structures of
the clonal angiosperm fennel pondweed (Potamogeton pectinatus L.) at both the
population and community level. Particular attention was paid to the adaptive value of
propagule size under various ecological conditions, with special emphasis on the role of
propagule predation by Bewick’s swans.
The asexually produced subterranean propagules (tubers) of P. pectinatus are subjected
to high levels of predation by Bewick’s swans when they occur in shallow-water and
sandy substrate, while in deep-water and clay-rich substrate predation pressure is
considerably lower (Nolet et al. 2001). Subsequently, Santamarίa & Rodríguez-Gironés
(2002) revealed a spatial pattern within the same study population in Lake Lauwersmeer,
the Netherlands, that was related to variation in substrate composition: clones
originating from the sandy shore produced large tubers when grown under common
garden conditions and clones from the clay-rich shore produced small tubers.
Consequently deep burial of large tubers of P. pectinatus was suggested as an escape
mechanism to predation by Bewick’s swans. However, much more information is
required before the tuber size pattern in this population can be attributed to natural
selection and adaptation to different levels of tuber predation pressure by Bewick’s
swans.
In the first part of this thesis we unravelled this topic in much more detail, using
the above-mentioned study site in the Lauwersmeer. Firstly, since P. pectinatus is a clonal
species, the population could exist of ramets all belonging to the same genet (i.e. no
clonal diversity), which would immediately lead to the conclusion that the pattern found
in the field would result from environmental variation. Therefore it needed to be
analysed whether clonal diversity was present. Secondly, to rule out the possibility that
the pattern was a result of differential random processes on the two shores (e.g. genetic
drift or founder effects), the possibility of restricted gene flow between the shores needed
to be verified. If clonal diversity occurred and gene flow was not restricted between the
shores, the focus could move to the possibility of natural selection acting on tuber size.
Therefore we tested the three prerequisites for natural selection (Endler 1986): 1) does
158
Summarising discussion
tuber size have a genetic basis, 2) does tuber size vary within the population, and 3) is
variation in tuber size associated to variation in fitness. While testing the third
prerequisite the potential of substrate acting as a selective force was also tested and
whether the direction of selection would then be opposing or reinforcing to that of
predation pressure by Bewick’s swans.
In this endeavour we had to take into account two possibly confounding effects.
Firstly, substrate type could also act as an environmental factor resulting in plastic
responses, possibly explaining the tuber size patterns found in the population. Thus, the
effect of substrate on tuber size was also tested. Secondly, maternal non-genetic effects
may affect the pace of selection. Therefore, we also studied maternal effects, in the form
of phenotypic maternal tuber size, on produced tuber size and how this interacted with
the genetic component of tuber size.
The second part of this thesis focused on the spatial distribution of a hybrid
complex composed of two parental taxa (P. pectinatus and P. filiformis) and their hybrid
(P. x suecicus). This part aimed at discerning whether the pattern was caused by the same
ecological factors affecting within-population structure of P. pectinatus, namely substrate
composition and predation by Bewick’s swans, supplemented by the factor irradiance.
The studied pondweed community was located in the Pechora Delta in northern Russia
where the distributions of the parental species overlap.
In the following sections, I will summarise the main findings of these studies
conducted in this thesis and evaluate them in the light of (i) whether propagule
predation may act as a structuring force at both population and community level, and
(ii) how propagule size itself may be affected by ecological, genetic and maternal nongenetic factors.
Clonal diversity and gene flow at the population level
Clonal plant species reproduce both sexually and asexually. If the balance between the
two is strongly biased towards asexual reproduction, few new genotypes (clones) will be
produced and genotypic diversity will decrease over time and become low in older
populations. In particular in aquatic systems where lakes may be regarded as islands, one
individual may found a population solely through clonal growth. Although genotypic
diversity (i.e. clonal diversity) may be low, genetic variation (based on the genetic
differences between genets) may be comparable to that of sexually reproducing species
(Hamrick & Godt 1989). Furthermore, low rates of sexual recruitment may be enough to
maintain high levels of genetic variation within populations (Soane & Watkinson 1979;
159
Chapter 7
Watkinson & Powell 1993). Plant genotypic diversity is also affected by ecological factors
such as the number of founding individuals, population age, life history traits and
disturbance frequency (related e.g. to wind storms, wave action or propagule predation
by animals).
P. pectinatus is a pseudo-annual and local recruitment takes place mainly through
asexual reproduction of tubers (Van Wijk 1989). To evaluate whether in this specific
system, clonal reproduction has resulted in low levels of genotypic diversity, and how
both genotypic diversity and genetic variation might be affected by ecological or random
factors, we estimated its amount and spatial distribution using neutral genetic markers
(Chapter 2). Random amplified polymorphic DNA (RAPD) analyses identified 97
different genets from within the 128 sampled ramets, revealing high clonal diversity.
Compared to a recent study by King et al. (2002) of 40 P. pectinatus populations (n = 217) in the Baltic sea using ISSRs (inter simple sequence repeat loci), our results are on the
high side but not abnormal. Preliminary results using AFLP markers on samples from
the Pechora Delta, Northern Russia, are also in concordance with the Lauwersmeer
results in that a high clonal diversity was found (Ouborg, de Jong and Hangelbroek
unpublished MS). If we look at studies on clonal diversity within populations of other
clonal plant species measured with RAPDs, variation between species and populations is
high and several show high levels of clonal diversity (e.g. Eriksson & Bremer 1993; Auge
et al. 2001; Xie et al. 2001). However, clonal diversity is very sensitive to the scale of
sampling and the size of the sampled area (Widén et al. 1994; McLellan 1997). For
instance, if samples have been taken at large distances clonal diversity may be high while
clonal diversity sampled in the same population on a much smaller scale may reveal a
much lower clonal diversity. Therefore one must be cautious when drawing conclusions;
high clonal diversity may reveal that diversity is present yet it does not imply that clonal
reproduction is unimportant in affecting population dynamics.
Within the Lauwersmeer study population most genetic variation was found to be
distributed within plots rather than among plots or between the two shores (=
subpopulations). Autocorrelation statistics at the ramet- and genet-level revealed that
clonal growth resulted in a spatial genetic population structure. However, this process
did not result in genetic differentiation between the two shores, implying that gene flow
was not restricted at this spatial scale and that the plants on the two shores could be
regarded as belonging to the same population. These results suggest that sexual
reproduction may be of greater importance to local recruitment than previously thought
Genotypic (clonal) diversity was affected by several ecological factors. Water
depth and clay content had direct negative effects on genotypic diversity, while tuber
predation by Bewick’s swans had an indirect negative effect through their reduction of
160
Summarising discussion
the tuber-bank biomass during the winter half year. The reduction of genotypic diversity
through tuber predation by Bewick’s swan, suggests that heavily foraged areas are
probably more prone to stochastic loss of clones. Alternatively, it may reflect genotypic
selection against clones that are more sensitive to swan predation.
In contrast to genotypic diversity, genetic (allelic) variation was not affected by
ecological factors. This is in accordance with the neutral character of RAPD markers,
since neutral variation is only expected to be affected by stochastic processes (such as
restricted gene flow, genetic drift or founder effects) and not by natural selection
(Steinger et al. 2002; Storz 2002).
We thus concluded that the study population in the Lauwersmeer was
characterised by high genotypic diversity and that no neutral genetic structuring had
occurred between the two shores as a result of chance factors (i.e. genetic drift, different
founders). Moreover, the effect of ecological factors on clonal diversity suggests that
genotypic selection, in the form of clonal sorting (sensu Solbrig & Simpson 1977), may
have played a role in structuring this population.
Tuber size: selective forces and adaptive role
Genetic determination and within-population variation of tuber size
Tuber predation by Bewick’s swans and substrate type may both act as selective forces on
tuber size and eventually result in a spatial population structure of this trait. Yet, for
natural selection to act on tuber size, it must have a genetic basis (Endler 1986). To test
this an experiment was set up (Chapter 3) where 15 different clones (confirmed to
represent 15 different genets, by means of AFLP analysis) were selected from the study
population and grown for three asexual generations under standardised, commongarden conditions. In the second and third years, the size of the maternal tubers (i.e.
those planted at the beginning of the growth season) was standardised to a predetermined range for all clones, so that no differences in initial tuber size existed among
clones. This was possible since the size of produced tubers also varies within each clone,
resulting in an overlap of tuber sizes between different clones. In both years, clones
differed significantly from one another in the average size of tubers produced, despite
being grown from tubers of comparable size. Broad sense heritability was estimated as
the trans-generational trait repeatability under negligible environmental effects (Dohm
2002), using the slope of the regression between the produced tuber sizes of the two last
clonal generations. This resulted in a heritability of H2 = 1.01, indicating that tuber size
has a strong genetic basis. Whether the high broad sense heritability is due to nuclear
161
Chapter 7
genes or non-nuclear genes of cytoplasmic organelles such as chloroplast genes is
irrelevant, because natural selection may act upon both potentially resulting in
evolutionary change and adaptation (Platenkamp & Shaw 1993; Mazer & Damuth 2001).
So far an important assumption has been that larger tubers are placed deeper in the
substrate and, by doing so, they are able to escape predation by Bewick’s swans. In
Chapter 3, it was established that genetic differences in tuber size among clones was
indeed directly related to the placement of tubers in the substrate: while all clones
produced larger tubers at deeper burial depths than at shallow burial depths, clones
genetically determined to produce large tubers placed a larger proportion of tubers deep
in the substrate than those determined to produce small tubers
Tuber size-number trade-off
Besides size, selection might also act on tuber number. However, propagule size and
number are likely to be inversely related, resulting in a size-number trade-off (Smith &
Fretwell 1974; Lloyd 1987). Nevertheless, many studies have not been able to find such
trade offs (e.g. Schaal 1980; Mazer 1987; Mendez 1997). Venable (1992) pointed out that
variation in plant size or resource availability may be responsible for masking existing
trade offs. If a genetic trade-off between propagule size and number exists this can have
large implications for evolutionary change, since selection on size and number shall be
constrained (Rausher 1992).
Many factors may affect the occurrence of a potential trade-off between size and
number. For instance, we found that when plants were grown under stressful conditions
(low nutrient availability) no trade off occurred whereas at higher nutrient conditions it
did (Chapter 4). We suggest that at low nutrient conditions meristem limitation due to
small plant size may have led to the absence of a trade off. Notably, Gianoli (2002)
revealed that in twining vine a trade off occurred depending on the environmental
conditions of the maternal plants of the plants producing seeds. In Chapter 5 we revealed
that the genotype of a maternal tuber had a direct effect on tuber size while its phenotype
(its actual size) had an indirect effect on size through enhancing vegetative biomass.
Consequently, a trade off existed which was directly affected by the genotype and
indirectly by the phenotype of the plant. This relationship sheds light on the complexity
of the phenomenon of propagule size-number trade-off and enforces that selection acts
more strongly on tuber size than on tuber number.
Clonal population dynamics
At this stage, we had established that tuber size shows heritable variation within the
population, and that this variation is related to differences in burial depth (Chapter 3).
162
Summarising discussion
Furthermore, we knew from the studies of Santamaría & Rodríguez-Gironés (2002) and
Nolet et al. (2001) that tuber mortality risk due to predation decreases with burial depth
and with increased clay-content of the substrate, while tuber mortality due to reduced
sprouting success increases with burial depth and with reduced clay content of the
substrate. Increased tuber size relieves these mortality risks, and thus enhances fitness by
increasing achievable burial depth and sprouting success, particularly in sandy
substrates. Since the heritable differences in tuber size are associated with variation in
fitness, it can be concluded that natural selection on tuber size may take place.
Subsequently we used a population model to investigate which ecological factors may be
important selective forces and cause the pattern found in the field in the Lauwersmeer
(Chapter 3). The population model investigated the clonal dynamics of a population of
plants with contrasting (genetically determined) tuber provisioning strategies, under
varying combinations of swan predation pressure and substrate type. Allocation of
available resources of a plant to the genetically determined tuber sizes determined the
number of tubers produced (i.e. a size-number trade-off was included). The parameters
and functions of the model were based on empirical results from Chapter 3, Santamaría
& Rodríguez-Gironés (2002) and Rodríguez-Gironés et al. (2003). The life cycle of the
plant was dived into three subsequent phases: (1) tuber sprouting in spring, (2) plant
growth and tuber production during summer and autumn, and (3) tuber mortality
during winter, including tuber predation by Bewick’s swans. The model showed that
deep burial of tubers of large-tuber genotypes increases survival at high predation
pressure. However, deep burial of tubers of large-tuber genotypes also results in a loss of
competitive advantage at low predation pressure or in sandy substrate. Furthermore, the
model indicated that, under the range of spatial variation in predation pressure and
substrate type observed in the Lauwersmeer, natural selection would favour locally a
single genotype from either of two extremes: small-shallow or large-deep tuberproducing genotypes. The existing tuber size polymorphism observed in the field seems
to be in contradiction with the model predictions. However, the model indicated that the
population (which is only 25 years old) might be too young to have reached equilibrium
through clonal sorting, since the latter would require 50 to 250 years. Sensitivity analysis
of the model also indicated that model predictions were quite sensitive to variation in
average tuber size (i.e. for both shallow and deep tubers). Since tuber size is also affected
by environmental factors (such as nutrient supply, interannual variation in irradiance
and temperature, and environmental carry-over effects), the resulting phenotypic
variation in tuber size could slow down the pace of selection.
The predictions of the population model are in contrast with the optimization
model of Santamaría & Rogríguez-Gironés (2002). According to the model presented in
163
Chapter 7
Chapter 3, selection would lead to large-tuber clones occurring in clay-rich substrate and
small-tuber clones in the sandy substrate, while Santamaría & Rogríguez-Gironés (2002)
predicted optimal tuber size to be larger in sandy than in clay-rich substrate. This
probably results from the larger burial depth associated to larger tubers, which is
accompanied by an increased sprouting mortality. In sandy substrate, where sprouting
mortality is more severe than in clay-rich substrate, the highest recorded allocation to
large tubers does not provision for tubers large enough to compensate for the increased
sprouting mortality that they face at larger burial depths. Hence, optimal tuber size and
depth in sandy substrate seem to be too expensive and, at any rate, not attainable in the
absence of maternal effects (which were not incorporated into the model). Future
modelling steps should take into account both the effects that variation of (non-genetic)
maternal tuber size might have on tuber characteristics (i.e. tuber production, size and
number; see below) and the variation in the costs of propagule provisioning at different
substrate types (thus in nutrient supply of the mother plants).
The cost of tuber production under contrasting substrate types
Many studies have shown that plants respond to differences in substrate conditions
(Sultan & Bazzaz 1993; Cheplick 1995; Idestam-Almquist & Kautsky 1995; Pigliucci &
Schlichting 1995; Leiss & MullerScharer 2001). It is easy to imagine that producing larger
propagules in resource poor conditions could represent an adaptive strategy. However,
energetic and functional costs of propagule provisioning are likely to be influenced by
nutrient conditions, thereby affecting resource allocation to propagules. The cost of
propagule production probably increases in resource poor conditions and their relative
importance will partially depend on the number of tubers produced, which may be
affected in turn by a reduction of apical meristems (meristem limitation) due to reduced
plant growth. In the case of the pondweed population studied in the Lauwersmeer, the
differential costs of propagule-provisioning at different substrate types may result in
diversifying or disruptive selection for different sized tubers at the sandy and clay-rich
shores. However, the direction of these putative selection pressures may either
counteract or promote the direction of the selection putatively inflicted by foraging
swans and sprouting survival.
To analyse the cost of propagule provisioning at different substrate types, we
compared the performance of clones differing in their genetically-determined tuber size
in a common-garden experiment (Chapter 4). Fifteen clones originating from the study
population (the same used in Chapter 3) were grown on sandy and clay-rich substrate
mixtures. Plants from all clonal lines were grown from tubers of a comparable size, to
rule out differences in clone performance that relate to maternal resources rather than
164
Summarising discussion
the provisioning of “daughter” (i.e. newly-made) propagules. Performance of the
different clones differed between substrate types. In sandy substrate, clones genetically
determined to produce large tubers showed a higher fitness than those producing small
tubers (i.e. they showed higher total tuber production, resulting from larger tuber sizes
but a comparable number of tubers). In clay-rich substrate, on the other hand, a sizenumber trade-off resulted in clones that produced small tubers showing comparable
total tuber production but a higher number of tubers. The latter may reflect a higher
fitness of clones producing small tubers in clay-rich substrate, since in clay-rich substrate
size is of lesser importance to survive the sprouting phase (i.e. to be able to sprout and
penetrate the overlaying substrate) and an increased number will thus directly increase
the number of offspring. These results imply that selection acting on tuber size could
take place at different substrate types, potentially resulting in local adaptation. The
direction of selection on tuber size is, within each substrate type, similar to the putative
selection that results from tuber predation by Bewick’s swans (which favours larger
tubers in sandy substrate), i.e. both selection forces are likely to reinforce each other.
Tuber size regulation: interaction between genetic and maternal nongenetic effects
The phenotype of a particular trait is generally shaped by the combination of genetic and
environmental effects. In Chapter 3, we demonstrated that tuber size had a strong
genetic basis. However, this genetic effect was obtained in the absence of variation in
maternal tuber sizes, because the phenotypic value of the maternal tuber (i.e. maternal
tuber size) was likely to be correlated to the genetic component. If this would indeed be
the case, it would be impossible to distinguish between genetic and environmental
(maternal non-genetic) components affecting tuber size, and both effects would be
incorporated in the calculated value of heritability (Falconer & Mackay 1996). If
maternal non-genetic effects also influence “daughter” tuber size, it is important to know
their relative importance and how they interact with the genetic effects. The genetic
component of a trait determines whether selection could result in evolutionary change
and the strength of the maternal non-genetic effect can affect the pace of selection
(Roach & Wulff 1987). However, if genotypes are differently affected by maternal nongenetic effects (i.e. if the strength of these effects varies between clones), the outcome of
diversifying selection may also be affected. For instance, if two tuber sizes are equally
favoured by selection but the small-tuber-genotype endures a larger maternal nongenetic effect, then selection on the small-tuber-genotype will be slower and the large
one may eventually persist in the population.
165
Chapter 7
For the Lauwersmeer population, it has been hypothesised that small tuberproducing clones are selected for in the clay-rich, low predation pressure areas, while in
the sandy, high predation pressure areas large tuber-producing clones would be favoured
(e.g. Santamaría & Rodríguez-Gironés 2002). But, if maternal non-genetic effects act
differentially on these genotypes, evolutionary change may be affected. We thus aimed at
quantifying whether genetic and maternal non-genetic effects on produced tuber size are
additive or whether they interact in a non-additive way (Chapter 5). Fifteen clonal lines
were selected from the study population (the same as in Chapter 3 & 4) and grown for
three asexual generations at common garden conditions. The second generation was
grown from tubers of a comparable size range across clones but the last generation was
grown from tubers with two different sizes. Maternal tuber size had a large effect on
produced tuber size, tuber number and total tuber production. However, the effects of
genetic and maternal non-genetic tuber size were purely additive. Hence, maternal nongenetic effects may slow down the pace of evolution, but it should not result in
differential evolutionary response to potential selection pressure on tuber size. Maternal
non-genetic effects acted indirectly, through enhancing vegetative biomass and total
tuber production of plants grown from larger tubers. These results do seem to explain
the structure found in the population: the genetic component of tuber size may respond
to tuber size selection creating differences between the shores in the size of tubers,
whereas the maternal non-genetic effect may explain the high variation in tuber size
found within both shores.
The effect of tuber predation, substrate and irradiance on
community structure
Factors affecting population structure may also influence spatial structure at a higher
taxonomic level, such as community structure or the distribution of hybrid zones. For
example, ecological selection pressures along a cline may result in segregation of taxa
(Haldane 1948; Slatkin 1973), including the parental taxa and their hybrid. These hybridcomplex structures may, however, also result from the lower fitness of hybrids, due to
genetic incompatibility balanced by gene flow (Key 1968; Barton & Hewitt 1985). In the
final study included in this thesis (Chapter 6), we tested whether the ecological factors
that shaped the fennel pondweed population structure, supplemented by the factor
irradiance, might also have a structuring effect on the distribution of the hybrid complex
composed of Potamogeton pectinatus, P. filiformis and P. x suecicus. In northern Russia,
the geographic distributions of P. pectinatus and P. filiformis overlap and the hybrid P. x
166
Summarising discussion
suecicus occurs. The three taxa are morphologically very similar but could be
distinguished by the use of molecular techniques (RFLP of ITS I and II)(King et al. 2001).
Across a water-depth gradient, we found a replacement pattern: the hybrid occurred in
shallow water, while P. pectinatus occurred in deep water. P. filiformis occurred
sporadically at shallow and intermediate depths. Changes in water-depth were related to
changes in substrate composition, foraging pressure by Bewick’s swans and irradiance
(since water turbidity was fairly high). Thus, shallow water was characterised by low clay
content, high irradiance and high tuber predation.
We first measured the effect of abiotic factors on parental and hybrid fitness. An
experiment was carried out where clones of the different taxa were grown at a factorial
combination of two substrate types and two light intensities. Photosynthetic
performance, chlorophyll content and several morphological characteristics were
measured. In contrast to our expectations, P. pectinatus did not perform better in clayrich substrate and at low irradiance, nor did the hybrid perform better in sandy substrate
and at high irradiance. However, biomass allocation to leaves and to roots showed a
contrasting pattern between both parentals and the hybrid: P. pectinatus had an
increased allocation to leaves at the expense of a low allocation to roots at low irradiance
(‘home’ environment), and P. filiformis showed the opposite allocation pattern at high
irradiance (also its ‘home’ environment), while they both allocated similarly to leaves and
roots in their ‘away’ environments. The hybrid, on the other hand, was more plastic and
allocated, as both parental taxa did, in both its ‘home’ and ‘away’ environments.
Nevertheless, these differences in allocation were not accompanied by higher biomass
production (used as surrogate for fitness) and therefore did not explain the zonation in
the field. However, it is important to note that competition between these taxa may
change this conclusion in such a manner that differences in allocation do turn out to
have a fitness effect. Furthermore, the hybrid did not show reduced fitness compared to
its parent taxa, which is in consensus with many recent hybrid studies (Wang et al. 1997;
Schweitzer et al. 2002).
Secondly, the potential effect of tuber predation by Bewick’s swans was analysed.
Field observations confirmed that swan foraging pressure decreased with water-depth.
Tubers of P. pectinatus were larger than those of the hybrid, and an experiment showed
that when different sizes of tubers are available to foraging swans, larger tubers
experienced a higher risk of predation than small tubers. These results support the
notion that in shallow water, where swans can reach all tubers, the smaller tubers
produced by P. x suecicus suffer a reduced mortality cost as a result of swan predation
pressure, while the larger tubers produced by P. pectinatus are probably excluded as a
result of the high predation pressure. At deeper water, P. pectinatus tubers will be able to
167
Chapter 7
escape predation by using deep burial depths as spatial refuges. At even deeper water, the
large tubers produced by P. pectinatus may confer this species a competitive advantage
(Black 1958; Wulff 1986) since, at low light conditions their capacity to invest more
reserves into growth of the shoots before roots are produced may give them a head start
and lead to competitive exclusion of the hybrid.
Conclusions
Predation on pondweed tubers by Bewick’s swans clearly plays an important role in
structuring both within-species population structure and community structure of
parental and hybrid taxa. Neutral genetic factors did not contribute to the patterns found
(Chapter 2 & 6). Within the P. pectinatus population studied in the Lauwersmeer,
natural selection on tuber size took place. The three prerequisites for natural selection to
take place were met (Endler 1986): (1) tuber size had a heritable basis (Chapter 3), (2)
within population variation of this trait was present (Chapter 3, 4 & 5, Santamaría &
Rodríguez-Gironés 2002), (3) variation in the trait resulted in differential fitness
(Chapter 4, Santamaría & Rodríguez-Gironés 2002). Furthermore, the selection
pressures were stable (i.e. spatial variation in substrate type is persistent, at least at a scale
of decades, and predation pressure was consistent over a 3-year time series; B.A. Nolet,
unpublished data). Deep burial of large tubers can thus be regarded as an adaptive
strategy to escape predation by Bewick’s swans. However, maternal non-genetic effects
also influence tuber size (Chapter 5). This effect slows down the pace of selection,
allowing the persistence of polymorphic variation in tuber size, as found in the study
population. The spatial structure at the community level (i.e. the studied hybrid
complex) was also affected by spatial variation in swan predation pressure (Chapter 6).
The hybrid was present at shallow zones, where swan-foraging pressure is maximal. The
hybrid’s small-sized tubers resulted in reduced mortality risk under intense swan
predation. There is an apparent contradiction between this assertion and the negative
relationship between tuber size and swan predation described for P. pectinatus. However,
this contradiction is only apparent when swans can reach all tubers i.e. when burial
depth does not function as a spatial refuge against swan predation because all depths are
accessible to the swans due to low water depths. Swans will then prefer larger tubers and
small tubers shall more often escape predation by chance. In areas where swans cannot
reach all burial depths in the substrate (i.e. at higher water depth), large tubers are
increasingly able to escape predation at deep burial depths (Fig. 1). The presence of P.
pectinatus in the deep water and the absence of P. x suecicus in the deep water can be
168
Summarising discussion
maximum
burial depth:
small tubers
large tubers
maximum
foraging depth
all tubers available
escape of deeply
buried tubers
no tubers available
Figure 1 Schematic representation of tuber availability to Bewick’s swans at different water-depths
in relation to maximum possible foraging depth of the swans and tuber size related burial depth.
Three different zones can be distinguished: in shallow water all tubers are potentially available and
preference by Bewick’s swans for large tubers shall result in a higher frequency of small tubers
remaining in the substrate; at intermediate water-depths large deeply buried tubers cannot be
reached and escape tuber predation by foraging swans while smaller tubers cannot escape
predation resulting in higher frequencies of large tubers in the substrate; in deep water no tubers at
all are available to the swans and tuber size related competition may potentially play a role in a
higher abundance of plants from large tubers.
explained by these factors. Competitive exclusion of the hybrid by P. pectinatus,
mediated by enhanced fitness shown by plants grown from large tubers at low
irradiances, is also a likely alternative (or complementary) explanation. Competition
experiments between tubers of different size and of the different taxa may further shed
light on this issue.
This thesis has shown that even at a local scale (i.e. ≤ 800 x 300 m) spatial
variation in abundance within and among clonal plant species (i.e. population and
community level) may result from evolutionary responses to contrasting ecological
conditions. Selection on asexual propagules (or ramets) may result in evolutionary
change through clonal sorting, which also indirectly affects gene frequencies after sexual
reproduction between abundant clones (i.e. clones with many ramets) has taken place. In
this study we have also made clear the necessity to analyse whether the trait under
selection has a heritable basis and how it is affected by maternal non-genetic effects.
Especially if maternal effects are correlated to the genetic component. Maternal nongenetic effects can maintain variation around a favoured trait value and reduce the pace
169
Chapter 7
of selection but they may also enable genotypes to produce successful phenotypes.
Furthermore, we have shown the importance of size of propagules, besides number of
propagules, as measure of total plant fitness, since size may strongly affect propagule
survival. Depending on environmental conditions, different balances between the size
and number of propagules produced may be beneficial. Selection can act upon this if a
genetic size-number trade-off exists, enforcing the importance of both size and number
of propagules as components of plant fitness.
References
Auge, H., Neuffer, B., Erlinghagen, F., Grupe, R., & Brandl, R. (2001) Demographic and random
amplified polymorphic DNA analyses reveal high levels of genetic diversity in a clonal
violet. Molecular Ecology 10: 1811-1819.
Barton, N.H. & Hewitt, G.M. (1985) Analysis of hiybrid zones. Annual Review of Ecology and
Systematics 16: 113-148.
Black, J.N. (1958) Competition between plants of different initial seed sizes in swards of
subterranean clover (Trifolium subterraneum L.) with particular reference to leaf area
and the light microclimate. Australian Journal of Agricultural Research 9: 299-318.
Cheplick, G.P. (1995) Genotypic variation and plasticity of clonal growth in relation to nutrient
availability in Amphibromus scabrivalvis. Journal of Ecology 83: 459-468.
Dohm, M.R. (2002) Repeatability estimates do not always set an upper limit to heritability.
Functional Ecology 16: 273-280.
Endler, J.A. (1986) Natural selection in the wild. Princeton University Press, Princeton.
Eriksson, O. & Bremer, B. (1993) Genet dynamics of the clonal plant Rubus saxatilis. Journal of
Ecology 81: 533-542.
Falconer, D.S. & Mackay, T.F.C. (1996) Introduction to quantitative genetics. Fourth edn.
Longman, Essex, UK.
Galen, C., Shore, J.S., & Deyoe, H. (1991) Ecotypic divergence in Alpine Polemonium viscosum:
genetic structure, quantitative variation, and local adaptation. Evolution 45: 1218-1228.
Gianoli, E. (2002) Maternal environmental effects on the phenotypic responses of the twining vine
Ipomoea purpurea to support availability. Oikos 99: 324-330.
Grant, P.R. (1986) Ecology and evolution of Darwin's finches. Princeton University Press,
Princeton.
Haldane , J.B.S. (1948) The theory of a cline. Journal of Genetics 48: 277-284.
Hamrick, J.L. & Godt, M.J.W. (1989) Allozyme diversity in plant species. In: Plant population
genetics breeding and genetic variation in plants (eds A.H.D. Brown, M.T. Clegg, A.L.
Kahler & B.S. Weir), pp. 43-63. Sinauer, Sunderland.
170
Summarising discussion
Idestam-Almquist, J. & Kautsky, L. (1995) Plastic responses in morphology of Potamogeton
pectinatus L. to sediment and above-sediment conditions at two sites in the northern
Baltic proper. Aquatic Botany 52: 205-216.
Janzen, D.H. (1969) Seed-eaters versus seed size, number, toxicity and dispersal. Evolution 23: 123.
Kettlewell, H.B.D. (1973) The evolution of melanism. Clarendon Press, Oxford.
Key, K.H.L. (1968) The concept of stasipatric speciation. Systematic Zoology 17: 14-22.
King, R.A., Gornall, R.J., Preston, C.D., & Croft, J.M. (2001) Molecular confirmation of
Potamogeton x bottnicus (P. pectinatus x P. vaginatus, Potamogetonaceae) in Britain.
Botanical Journal of the Linnean Society 135: 67-70.
King, R.A., Gornall, R.J., Preston, C.D., & Croft, J.M. (2002) Population differentiation of
Potamogeton pectinatus in the Baltic Sea with reference to waterfowl dispersal.
Molecular Ecology 11: 1947-1956.
Leiss, K.A. & MullerScharer, H. (2001) Adaptation of Senecio vulgares (Asteraceae) to ruderal and
agricultural habitats. American Journal of Botany 88: 1593-1599.
Lloyd, D.G. (1987) Selection of offspring size at independence and other size-versus-number
strategies. American Naturalist 129: 800-817.
Mazer, S.J. (1987) The quantitative genetics of life history and fitness in Raphanus raphanistrum L.
(Brassicaceae): ecological and evolutionary consequences of seed mass variation.
American Naturalist 130: 891-914.
Mazer, S.J. & Damuth, J. (2001) Evolutionary significance of variation. In: Evolutionary Ecology:
concepts and case studies (eds C.W. Fox, D.A. Roff & D.J. Fairbairn). Oxford University
Press, New York.
McLellan, A.J. (1997) Structure and analysis of phenotypic and genetic variation in clonal plants.
In: The ecology and evolution of clonal plants (eds H. de Kroon & J. van Groenendael),
pp. 185-210. Backhuys Publishers, Leiden, the Netherlands.
Mendez, M. (1997) Sources of variation in seed mass in Arum italicum. International Journal of
Plant Sciences 158: 298-305.
Nolet, B.A., Langevoord, O., Bevan, R.M., Engelaar, K.R., Klaassen, M., Mulder, R.J.W., & Van
Dijk, S. (2001) Spatial variation in tuber depletion by swans explained by differences in
net intake rates. Ecology 82: 1655-1667.
Pigliucci, M. & Schlichting, C.D. (1995) Reaction norms of Arabidopsis thaliana (Brassicaceae). III.
Response to nutrients in 26 populations from a worldwide collection. American Journal
of Botany 82: 1117-1125.
Platenkamp, G.A.J. & Shaw, R.G. (1993) Environmental and genetic maternal effects on seed
characters in Nemophila menziesii. Evolution 47: 540-555.
Prati, D. & Schmid, B. (2000) Genetic differentiation of life-history traits within populations of the
clonal plant Ranunculus reptans. Oikos 90: 442-456.
Rausher, M.D. (1992) The measurement of selection on quantitative traits: Biases due to
environmental covariances between traits and fitness. Evolution 46: 616-626.
171
Chapter 7
Roach, D.A. & Wulff, R.D. (1987) Maternal effects in plants. Annual Review of Ecology and
Systematics 18: 209-235.
Rodríguez-Gironés, M.A., Sandsten, H., & Santamaría, L. (2003) Asymmetric competition and the
evolution of propagule size. Journal of Ecology 91: 554-562.
Santamaría, L. & Rodríguez-Gironés, M.A. (2002) Hiding from swans: optimal burial depth of sago
pondweed tubers foraged by Bewick's swans. Journal of Ecology 90: 303-315.
Schaal, B.A. (1980) Reproductive capacity and seed size in Lupinus texensis. American Journal of
Botany 67: 703-709.
Schweitzer, J.A., Martinsen, G.D., & Whitham, T.G. (2002) Cottonwood hybrids gain fitness traits
of both parents: A mechanism for their long-term persistence? American Journal of
Botany 89: 981-990.
Slatkin, M. (1973) Gene flow and selection in a cline. Genetics 75: 733-756.
Smith, C.C. & Fretwell, S.D. (1974) The optimal balance between size and number of offspring.
American Naturalist 108: 499-506.
Soane, I.D. & Watkinson, A.R. (1979) Clonal variation in populations of Ranunculus repens. New
Phytologist 82: 557-573.
Solbrig, O.T. & Simpson, B.B. (1977) A garden experiment on competition between biotopes of the
common dandelion (Taraxacum officinale). Journal of Ecology 65: 427-430.
Sork, V.L., Stowe, K.A., & Hochwender, C. (1993) Evidence for local adaptation in closely adjacent
subpopulations of northern red oak (Quercus rubra L) expressed as resistance to leaf
herbivores. American Naturalist 142: 928-936.
Steinger, T., Haldimann, P., Leiss, K.A., & Muller-Scharer, H. (2002) Does natural selection
promote population divergence? A comparative analysis of population structure using
amplified fragment length polymorphism markers and quantitative traits. Molecular
Ecology 11: 2583-2590.
Storz, J.F. (2002) Contrasting patterns of divergence in quantitative traits and neutral DNA
markers: analysis of clinal variation. Molecular Ecology 11: 2537-2551.
Sultan, S.E. & Bazzaz, F.A. (1993) Phenotypic plasticity in Polygonum persicaria. III. The evolution
of ecological breadth for nutrient environment. Evolution 47: 1050-1071.
Van Wijk, R.J. (1989) Ecological studies on Potamogeton pectinatus L .3. Reproductive strategies
and germination ecology. Aquatic Botany 33: 271-299.
Venable, D.L. (1992) Size-number trade-offs and the variation of seed size with plant resource
status. American Naturalist 140: 287-304.
Wang, H., McArthur, E.D., Sanderson, S.C., Graham, J.H., & Freeman, D.C. (1997) Narrow hybrid
zone between two subspecies of big sagebrush (Artemisia tridentata: Asteraceae) .4.
Reciprocal transplant experiments. Evolution 51: 95-102.
Watkinson, A.R. & Powell, J.C. (1993) Seedling recruitment and the maintenance of clonal
diversity in plant populations - a computer simulation of Ranunculus repens. Journal of
Ecology 81: 707-717.
172
Summarising discussion
Widén, B., Cronenberg, N., & Widén, M. (1994) Genotypic diversity, molecular markers and
spatial distribution of genets in clonal plants, a literature survey. Folia Geobotanica et
Phytotaxonomica 29: 245-263.
Wulff, R.A. (1986) Seed size variation in Desmodium paniculatum III. Effects of reproductive yield
and competitive ability. Journal of Ecology 74: 115-121.
Xie, Z.W., Lu, Y.Q., Ge, S., Hong, D.Y., & Li, F.Z. (2001) Clonality in wild rice (Oryza rufipogon,
Poaceae) and its implications for conservation management. American Journal of Botany
88: 1058-1064.
173
Dutch summary
Nederlandse samenvatting - Lokale ruimtelijke structuur in
fonteinkruid populaties: de rol van knolgrootte
H.H. Hangelbroek - Local spatial structure in pondweed populations: the role of
propagule size
Deze samenvatting is bedoeld voor niet-vakgenoten. Vakgenoten wordt aangeraden de
Engelse samenvattende discussie te lezen.
In dit proefschrift heb ik onderzocht of natuurlijke selectie op zeer lokale schaal plaats
kan vinden en zowel de ruimtelijke structuur binnen een populatie alsook binnen een
levensgemeenschap kan bepalen. Als modelorganisme heb ik de voornamelijk klonaal
voortplantende waterplant schedefonteinkruid (Potamogeton pectinatus) gebruikt,
waarbij ik specifieke aandacht heb besteed aan de adaptieve waarde van knolgrootte in
relatie tot knolpredatie door de kleine zwaan (Cygnus columbianus bewickii).
Het is algemeen bekend dat planten zijn aangepast aan de grote verscheidenheid van
milieuomstandigheden die er op de aarde te vinden zijn. Denk bijvoorbeeld aan soorten
die in de tropen voorkomen en soorten die in de toendra of woestijn leven. Zij
beschikken vaak over morfologische en fysiologische aanpassing die hun overleving en
voortplantingssucces (m.a.w. fitness) in hun ‘thuis’ milieu zullen verhogen terwijl hun
fitness laag zal zijn in één van de andere milieus. Deze aanpassingen, ofwel adaptieve
eigenschappen, zijn vaak het gevolg van natuurlijke selectie. Natuurlijke selectie vindt
plaats als organismen met bepaalde genetische eigenschappen in een specifiek milieu een
hogere fitness hebben en dus een grotere hoeveelheid overlevende nakomelingen
produceren. Als de nakomelingen diezelfde ‘gunstige’ genetische eigenschappen bezitten,
zullen zij op hun beurt ook weer veel nakomelingen produceren. Hierdoor verspreiden
die eigenschappen zich door de populatie waardoor de populatie op een gegeven
moment aangepast raakt aan het lokale milieu. Deze adaptieve eigenschappen voor
bepaalde milieuomstandigheden zijn vaak ongunstig onder andere milieu
omstandigheden. Wanneer gebieden met verschillende milieuomstandigheden dicht bij
elkaar liggen, waardoor genetische uitwisseling tussen planten uit beide gebieden kan
plaatsvinden, verwacht men dat adaptatie aan lokale omstandigheden veel minder
waarschijnlijk is of in ieder geval veel langer zal duren. Hoewel selectiedruk (de sterkte
van het effect van omgevingsfactoren op fitness) hierin ook een belangrijke rol zal spelen
en de reducerende werking van genetische uitwisseling enigszins kan compenseren. In
175
Nederlandse samenvatting
dit proefschrift richtte het onderzoek zich er juist op om te kijken of natuurlijke selectie
op zeer lokale schaal (≤ 0.24 km2) kan plaatsvinden. Om dit te onderzoeken is gekeken
naar een systeem waar planten op een lokale schaal sterk verschillende selectiedruk
ondervinden. De plant-herbivore interactie tussen het schedefonteinkruid en de kleine
zwaan voldoet hieraan en is als modelsysteem gebruikt in dit onderzoek
Schedefonteinkruid is een zich voornamelijk ongeslachtelijk of klonaal
voortplantende, ondergedoken waterplant. Klonale planten, kunnen zich desalniettemin
zowel seksueel als aseksueel voortplanten. Seksuele reproductie vindt plaats via de zaden,
die vaak een belangrijke rol spelen in langeafstandsdispersie en kolonisatie van nieuw
habitat. Aseksuele reproductie kan op vele verschillende manieren plaatsvinden,
bijvoorbeeld door middel van vegetatieve groei gevolgd door fragmentatie, productie van
aseksuele zaden of door productie van gespecialiseerde vegetatieve organen zoals tubers
of knollen. Aseksuele reproductie speelt vaak een belangrijke rol bij verspreiding op
lokale schaal. Schedefonteinkruid produceert ondergrondse knolletjes (tubers) die rijk
aan zetmeel zijn en daardoor een zeer geliefde kost voor kleine zwanen zijn. Kleine
zwanen foerageren op deze tubers door met hun poten kuilen in de bodem te trappelen
waarna ze er de tubers met hun snavel uitzeven. De predatiedruk op tubers kan in
bepaalde gebieden erg groot zijn aangezien er soms honderden zwanen tegelijk op een
paar honderd m2 foerageren. De predatiedruk kan echter lokaal sterk verschillen doordat
waterdiepte en substraattype het foerageren van de zwanen beïnvloedt: hoe dieper het
water en kleiiger het substraat des te meer moeite de zwanen zullen hebben om de tubers
te bemachtigen. Een mogelijke adaptieve eigenschap van de planten zou het produceren
van tubers diep in het substraat kunnen zijn, zodat de zwanen er niet bij kunnen. Maar
om uit het diepe substraat te komen moet de spruit van een tuber een lange weg afleggen
waarvoor grote energie-reserves nodig zijn. M.a.w een tuber die diep in het substraat zit
moet groter zijn. Deze strategie heeft echter tot gevolg dat minder tubers geproduceerd
kunnen worden, omdat de hoeveelheid te besteden reserves aan aseksuele reproductie
(d.w.z totale tuberproductie) verdeeld moet worden over aantal en grootte. De
alternatieven bewegen zich dus tussen veel kleine of weinig grote tubers. In gebieden
waar predatiedruk op tubers laag is lijkt een tuberproductiestrategie van veel kleine
(ondiepe) tubers het meest waarschijnlijke alternatief. Zowel uit voorgaand onderzoek
alsook uit onderzoek voor dit proefschrift blijkt dat grote tubers inderdaad dieper in het
substraat worden geproduceerd en kleine tubers juist dichter aan het oppervlak worden
geplaatst.
In twee gebieden is gekeken naar de ruimtelijke structuur van tubergrootte. In het
eerste gebied (Lauwersmeer in Nederland) werd de structuur binnen een populatie van
schedefonteinkruid onderzocht. In een gebied van 800 x 300 m, verschilden twee oevers
176
Dutch summary
in substraattype (kleigehalte) en de daaraan gerelateerde tuberpredatiedruk door kleine
zwanen. Klonen (planten van verschillende klonen zijn genetisch verschillend en planten
binnen een kloon zijn genetisch identiek) afkomstig van de zanderige oever met hoge
predatiedruk, produceerden grote tubers, terwijl klonen afkomstig van de klei-rijke oever
met lage predatiedruk, kleinere tubers produceerden. Dit zou het resultaat kunnen zijn
van natuurlijk selectie op tubergrootte. Op de oever met de hoge tuberpredatiedruk zou
de productie van grote diepe tubers leiden tot een lagere tuberpredatiekans en dus een
hogere fitness. Op de oever met de lage predatiedruk levert de productie van veel kleine
(ondiepe) tubers juist een hogere fitness op.
In het tweede gebied (Pechora Delta, Rusland) werd de structuur van een
levensgemeenschap van de fonteinkruidfamilie onderzocht, namelijk die van
schedefonteinkruid, draadfonteinkruid (P. filiformis) en hun hybride (P. x suecicus). Het
voorkomen van deze taxa veranderde over een waterdiepte gradient van 75 meter lang.
In het diepe water, met een klei-rijk substraat en lage tuberpredatiedruk, kwam
schedefonteinkruid exclusief voor terwijl in het ondiepe water, met zanderig substraat en
een hoge tuberpredatiedruk, de hybride voorkwam met hier en daar een
draadfonteinkruid plant. Dit zou het gevolg kunnen zijn van verschillende mileubehoeften van de taxa, resulterend van natuurlijke selectie in het verleden.
De verschillen in de ruimtelijke verdeling van klonen die grote en die kleine
tubers produceren binnen de schedefonteinkruidpopulatie in het Lauwersmeer kan ook
het gevolg zijn van andere factoren dan natuurlijke selectie. Het kan het directe resultaat
zijn van verschillen in het milieu die los staan van genetische verschillen tussen planten.
Lokale variatie in voedingsstoffen in de bodem zou bijvoorbeeld kunnen leiden tot
verschillen in groei en vervolgens in reproductie. Verder kunnen het weldegelijk
genetische verschillen zijn maar deze kunnen door toeval zijn ontstaan, waardoor ze niet
adaptief zijn. Bijvoorbeeld als een populatie klein is kunnen door toeval bepaalde
willekeurige genetisch eigenschappen verloren of juist gefixeerd raken door seksuele
reproductie.
Om te onderzoeken of de ruimtelijke structuur van tubergroottes binnen de
schedefonteinkruidpopulatie in het Lauwersmeer werkelijk het resultaat was van
natuurlijke selectie op lokale schaal, werd als eerste, met behulp van moleculaire
technieken, vastgesteld of de populatie al dan niet een zeer hoge klonale diversiteit bezat
(Hoofdstuk 2). Zonder klonale diversiteit kan natuurlijke selectie niet plaatsvinden (er
valt dan niets te selecteren), maar de klonale diversiteit binnen de Lauwersmeerpopulatie
bleek juist erg hoog. Tijdens dezelfde analyse werd ook vastgesteld dat genetische
uitwisseling tussen de twee oevers vrijelijk kon plaatsvinden. M.a.w., de verschillen in
structuur waren niet het gevolg van toevalsprocessen. Vervolgens werden een serie groei
177
Nederlandse samenvatting
experimenten uitgevoerd onder gelijke milieuomstandigheden (common-garden
experimenten) waarbij eventuele verschillen tussen klonen duiden op genetische
verschillen. Het eerste common-garden experiment werd uitgevoerd om te testen of de
eigenschap ‘tubergrootte’ een genetische basis had. Tubergrootte bleek inderdaad een
grote genetische basis te hebben waardoor selectie op deze eigenschap dus in principe tot
de mogelijkheden behoort (Hoofdstuk 3). In een volgend common-garden experiment
werd gekeken hoe tubergrootte beïnvloed werd door niet-genetische, via de moederplant
(maternaal) overdraagbare effecten. Als maternale effecten groot zijn kan dat een sterk
vertragend effect hebben op adaptatie door selectie en dit zelfs tegengaan. De maternale
effecten bleken groot te zijn maar hadden een gelijkwaardige uitwerking op alle klonen
onafhankelijk of ze een genetische basis hadden om kleine dan wel grote tubers te
produceren. Uiteindelijk blijven dus de verschillen tussen de klonen in de grootte van de
tubers die ze produceren bestaan, maar wordt het tempo van potentiële evolutionaire
veranderingen ten gevolge van natuurlijke selectie door deze maternale effecten
vertraagd (Hoofdstuk 5). Uit de resultaten van deze experimenten kan samenvattend
geconcludeerd worden dat natuurlijk selectie op tubergrootte kan plaats vinden en wel
omdat (1) deze eigenschap een genetische basis heeft, (2) er voldoende genetische
variatie is binnen de populatie en (3) omdat we weten dat verschillen in tubergrootte
resulteren in verschillen in fitness afhankelijk van het niveau van de tuberpredatiedruk
door zwanen.
Dit laatste punt zou echter beïnvloed kunnen worden door een direct effect van
substraattype op de fitness van klonen. Substraattype en predatiedruk zijn immers
gecorreleerd. Als bijvoorbeeld in zanderig substraat klonen die kleine tubers produceren
een hogere fitness hebben dan klonen die grote tubers produceren, dan zou de richting
van natuurlijk selectie door tuberpredatie van zwanen tegengewerkt worden (in zanderig
substraat is de predatiedruk immers hoger hetgeen juist klonen met diepe, grote tubers
een hogere fitness geeft). Het effect van substraattype op de fitness van klonen werd
daarom getest in een volgend common-garden experiment. Het bleek dat in zanderig
substraat klonen die grote tubers produceren een hogere fitness hadden dan klonen die
kleine tubers produceren omdat ze ondanks de grotere tubers in staat waren om toch
hetzelfde aantal tubers te produceren. De grootte blijkt uit voorgaand onderzoek de
overleving van spruitende tubers aanzienlijk te vergroten in zanderig substraat waar
spruitsterfte veel hoger is dan in klei-rijk substraat. Daartegenover staat dat in klei-rijk
substraat klonen die kleine tubers produceren een hogere fitness hadden dan klonen die
grote tubers produceren, omdat klonen die kleine tubers maken in klei-rijk substraat
juist meer tubers en dus meer nakomelingen produceerden (in klei maakt grootte niet
veel uit voor overleving want de omstandigheden zijn goed). Kortom, hieruit kan
178
Dutch summary
geconcludeerd worden dat de selectiedruk van zwanen en substraattype op tubergrootte
in dezelfde richting is en elkaar dus versterkt (Hoofdstuk 4). Tevens bleek uit dit laatste
experiment dat de ruimtelijke structuur in het veld van klonen die grote en kleine tubers
maken niet verklaard kon worden door verschillen in substraattype alleen, onafhankelijk
van het genotype. Samenvattend kan uit deze experimenten geconcludeerd worden dat
er natuurlijke selectie op tubergrootte in schedefonteinkruid heeft plaatsgevonden op een
zeer lokale schaal, welke heeft geleid tot lokale adaptatie aan verschillen in zowel
substraattype alsook tuberpredatiedruk.
Vervolgens werd onderzocht of de structuur van de fonteinkruidlevensgemeenschap in de Pechora Delta het resultaat was van dezelfde factoren die een
rol speelden op het populatie niveau (Hoofdstuk 6). Over de hierboven omschreven
waterdieptegradiënt bleken het substraat type, de predatiedruk op tubers door zwanen én
lichtintensiteit te variëren. Klonen van de verschillende taxa werden verzameld langs
twee waterdiepteraaien en doorgekweekt in Nederland. Om te onderzoeken of de
verschillende taxa beter waren aangepast aan bepaalde abiotische omstandigheden, welke
de opvallende ruimtelijke structuur binnen de levensgemeenschap zou kunnen
verklaren, werden de taxa geplaatst onder vier verschillende abiotische
milieuomstandigheden (bestaand uit de combinaties van twee lichtniveaus en twee
substraattypes). De fitness van deze planten, hier gemeten als verschillende
componenten van de fotosynthese, biomassaproductie en chlorofylconcentratie, was
echter niet verschillend ondanks de sterk uiteenlopende groeiomstandigheden
waaronder ze werden getest. Vervolgens concentreerde zich het onderzoek op de
biotische factor, tuberpredatie door kleine zwanen. Een experiment toonde aan dat
schedefonteinkruid grotere tubers produceert dan de hybride. In het daaropvolgende
experiment werd onderzocht of het predatierisico van een tuber afhankelijk is van de
grootte ervan. Vier zwanen kregen een uur de tijd om te foerageren op een substraat met
daarin een mengsel van tubers van uiteenlopende grootte. Alle tubers waren op een voor
zwanen beschikbare diepte geplaatst. M.a.w., ontsnapping aan predatie door diepte werd
in het experiment uitgesloten. Uit dit experiment bleek dat de zwanen grote tubers
prefereren. Dit zou de ruimtelijke verspreiding van de taxa, zoals die in het veld
waargenomen werd, kunnen verklaren, met het taxon dat de kleinste tubers produceert
(de hybride) in het ondiepe water. In het ondiepe water kunnen de zwanen tot grote
diepte in het substraat foerageren waardoor diepe plaatsing in het substraat van grote
tubers niet resulteert in ontsnapping aan predatie. Aangezien alle tubers dus beschikbaar
zijn voor de zwanen in het ondiepe water, hebben grote tubers (d.w.z., die van
schedefonteinkruid) een grotere kans om gevonden en opgegeten te worden terwijl de
kleinere hybride tubers juist vaker aan predatie ontsnappen. In het diepere water
179
Nederlandse samenvatting
daarentegen konden de grotere schedefonteinkruidtubers wel in de diepte ontsnappen
terwijl de hybride tubers dat niet konden waardoor die tubers weggegeten werden met
als gevolg dat schedefonteinkruid in het diepe water voorkomt en de hybride niet.
Samenvattend blijkt uit deze experimenten dat de structuur van deze
fonteinkruidlevensgemeenschap over een waterdieptegradiënt in de Pechora Delta
beïnvloed wordt door verschillen in grootte gerelateerde tuberpredatie door kleine
zwanen.
Conclusie
In dit proefschrift heb ik aangetoond dat natuurlijke selectie bij klonale planten op een
zeer lokale schaal kan plaatsvinden en dat deze daarbij de ruimtelijke structuur, de
verspreiding van genotypen en taxa, zowel binnen een populatie als binnen een
levensgemeenschap kan bepalen. Mede is aangetoond dat tubergrootte en plaatsingsdiepte als mechanismen voor de ontsnapping aan predatie kunnen dienen. Uit het
onderzoek blijkt verder dat de rol van aantal versus grootte van propagules in het
verhogen van de fitness, afhankelijk is van het milieu waarin de planten groeien. Voor
een correcte interpretatie van de fitnessconsequenties van eigenschappen moet met
milieuafhankelijkheid rekening worden gehouden wanneer de fitness van individuen uit
verschillende milieus met elkaar wordt vergeleken. Een volgend cruciaal punt dat in dit
onderzoek naar voren kwam was het belang om te identificeren of een eigenschap onder
selectie daadwerkelijk een genetische basis heeft en zo ja, hoe de interactie is met
maternale, niet-genetische effecten. De sterkte en richting van beide factoren kan de
uiteindelijke loop en het tempo van evolutionaire veranderingen beïnvloeden.
180
Acknowledgements
Dankwoord
Vele mensen hebben een bijdrage geleverd aan het tot stand komen van dit proefschrift.
Of dat nou een wetenschappelijke of een meer sociale bijdrage was, al die mensen wil ik
hier bedanken. In de eerste plaats gaat mijn dank uit naar mijn begeleiders, Luis
Santamaría, Jan van Groenendael, en Joop Ouborg. Luis jij was mijn begeleider op het
NIOO en jij bent bij al het werk betrokken geweest. Ik heb heel erg veel gehad aan en ook
erg veel geleerd van jouw uitgebreide statistische kennis en je zeer goede commentaar op
mijn manuscripten. Joop ondanks het feit dat jij relatief ver weg in Nijmegen zat, heb ik
toch veel profijt gehad van je moleculaire kennis en je hulp bij het ‘leren’ schrijven. Jan
ook jij zat in Nijmegen, en ook hiervoor geldt dat dit feit het misschien iets moeilijker
maakte om je continue op de hoogte te houden hoe het ermee stond, maar de discussies
die we hadden en het vertouwen dat je had in het verloop van mijn proefschrift heb ik
altijd zeer gewaardeerd. Je kritische commentaren en je kennis van klonale planten
waren voor mij vooral in de eindfase van groot belang.
Naast mijn begeleiders heb ik de beginfase van mijn promotieonderzoek zeer veel
ondersteuning gehad van Klaus Schwenk. Ik dank je voor het leren van het klappen van
de zweep in het lab en de wijze lessen over het oio-dom. Verder wil ik Wim van Vierssen
bedanken voor het helpen opzetten van dit project. Miguel Rodríguez-Gironés dank voor
je interesse in tubergroottes en het delen van je kennis van het modelleren. Richard
Gornall thanks for inviting me to your lab in Leicester to work on the identification of
the hybrid-complex and for your helpful input in the related manuscript. I would also
like to thank Andrew King for showing me around in the lab and teaching me the
techniques. I got a lot of work done and had a very good time in Leicester. Vooral na het
vertrek van Luis naar IMEDEA in Spanje heb ik erg veel gehad aan de discussies en hulp
van Marcel Klaassen en Bart Nolet. Ik heb er echt plezier in gehad om ook met jullie te
kunnen werken. Raymond Klaassen als kamergenoot kreeg jij alles wat maar in me
opkwam direct te horen, of je dat nou wilde of niet. Heel veel dank voor al het
meedenken maar ook voor al het plezier dat we samen hadden.
Veel dank ben ik ook verschuldigd aan iedereen die mij tijdens het praktische
werk heeft bijgestaan. Dan doel ik onder andere op het veldwerk in Lauwersmeer,
waarbij de hele werkgroep van Plant-Dier Interacties (PDI) mij heeft geholpen. Dit
waren altijd memorabele (in positieve zin) uitjes. De expeditie in de Pechora Delta samen
met Marcel en Thijs was een geweldige ervaring. De experimenten buiten in Heteren
waren vaak een zware klus. Koos, Thijs en Bart v. L. veel dank voor het helpen met
sediment mengen en tubers zeven. Bij het wegen van tubers en ander plantmaterial heb
ik ook veel hulp gekregen, veel dank hiervoor Thijs, Ten en Eric. Dank ook aan Harry,
181
Dankwoord
wij waren echt een team in het moleculaire lab. Miranda dat je altijd klaar stond om van
alles en nog wat uit te leggen in het lab heb ik erg gewaardeerd. Hans de Jong ook jij
bedankt voor het moleculaire werk dat je in Nijmegen hebt gedaan. Oscar en Eric aan
jullie aandeel in een aantal van de illustraties in dit proefschrift heb ik erg veel gehad
zoals je kunt zien. Koen Verhoeven veel dank voor alle layout aanwijzingen.
Naast het werken heb ik ook een hele leuke tijd op het NIOO-CL gehad, wat
natuurlijk weer bevordelijk was voor het werk. Iedereen van het CL heeft hieraan
bijgedragen. Ik hoop dat jullie het belang hiervan beseffen. Ik heb twee kamergenoten
gehad, eerst Jan Beekman daarna Raymond Klaassen. Bedankt voor jullie gezelschap, ik
had het niet beter kunnen treffen. Jörn jij ging mij voor als oio bij de PDI. Daar heb ik
erg van kunnen profiteren, veel dank daarvoor. Iris you started just after me and
therefore we could always relate and chat about the difficulties of a particular phase of
the PhD. Oscar jij organiseerde altijd vanalles en zorgde voor een goede sfeer. Silke,
Peter, Arnaud en Jan v. Gils jullie vulden de PDI later aan. Ook met jullie heb ik erg veel
plezier gehad. De avonden op het NIOO waren mij ook heel waardevol. Met z’n allen
naar de appie, koken in de (te) kleine keuken en daarna in de prachtige tuin van de villa
eten (of eigenlijk vaker in de kantine). Dat zorgde ervoor dat lang doorwerken geen enkel
punt was. De woensdag voetbal- en/of chinees-avond was ook altijd een succes. Al heb ik
zelf nooit meegevoetbald (ik geloof dat ik een proefschrift aan het afschrijven was), maar
wel altijd gechineesd. Kortom, op den duur werd het instituut een soort tweede thuis
voor mij. Dank jullie allemaal daarvoor!
Naast al deze mensen van het werk heb ik ook veel aan mijn andere vrienden te
danken. Vooral in de eindfase hebben ze niet veel meer van mij gezien. Gelukkig hadden
ze begrip voor dit a-sociaal gedrag van mij en bleven zij geïnteresseerd in mij en mijn
onderzoek. Eén zo’n vriendin is daarom ook één van mijn paranimfen. Anne Martine jij
bent één van mijn trouwste vriendinnen, dankje voor je vriendschap! Mijn andere
paranimf, Raymond, is hierboven al meerdere malen aan bod gekomen, Ray bedankt
voor de mooie tijden!
Als laatste wil ik mijn familie bedanken. Mijn broer Ype wil ik vooral bedanken
voor de aangename onderbrekingen die hij en zijn familie mij bezorgden tijdens de
laatste fase van het schrijven bij onze ouders in Bergambacht. Mijn ouders wil ik heel erg
bedanken voor hun niet-aflaatende vertrouwen, steun en positieve instelling. Zonder hen
was het afronden van dit proefschrift een stuk moeilijker geweest.
Helen,
St. Paul, 2 april 2004
182
Curriculum vitae
Curriculum vitae
I was born on the 8th of May 1970 in Voorburg, the Netherlands. After one year I moved
with my family to Australia where I spent the next eight years. We then moved back to
the Netherlands, and I grew up in Bergambacht. After I completed my secondary
education (VWO) at the Montessori Lyceum in Rotterdam, I went to the University of
Leiden to study biology in 1990. I specialized in Ecology. But first I did a four-month
research project at the Department of Behavioural Biology on the circadian rhythm of
sexual male sticklebacks under the supervision of Prof. Dr. P. Sevenster. Next, I did a
ten-month research project on the effect of the chemical defenses of Chrysanthemum
cultivars against Frankliniella occidentalis (thrips) on the natural enemy Amblyseius
cucumeris (predatory mite). This project took place in the Department of Plant Ecology
and I was supervised by Prof. Dr. E. van der Meijden and Dr. K. Vrieling. Finally, I did a
4-month research project at the Botanical Institute of the University of Bergen, Norway
on the spatial distribution pattern of the moss Ulota crispa in relation to the distribution
of its substrate trees. This project was supervised by Prof. Dr. H.J.B. Birks and Dr. E.
Heegard. In 1996 I received my Masters degree. After working as a guest-worker for a
few months at the Department of Plant Ecology, I started my PhD project in 1997 at the
Department of Plant-Animal Interactions, Netherlands Institute of Ecology (NIOO) in
Nieuwersluis. I was supervised by Dr. L. Santamaría, who then also worked at the NIOO,
and Prof. Dr. J.M. van Groenendael and Dr. N.J. Ouborg from the Catholic University of
Nijmegen. Most of my work was carried out in the Netherlands but some parts were
performed elsewhere. In 1998 I participated in a scientific expedition to the Pechora
Delta in northern Russia which led to chapter 6 of this thesis. In 2000 I visited the
laboratory of Dr. R.J. Gornall at the University of Leicester, UK, where I worked with Dr.
Gornall and Dr. R.A. King on distinguishing the taxa of the pondweed hybrid complex
using molecular techniques. During the last year of my PhD project and after Dr.
Santamaría moved to work at IMEDEA in Spain, I managed the molecular part of a
project of his. This project concerned a reciprocal transplant experiment on competition
between indigenous and foreign clones of fennel pondweed which were distinguished
from one and another with molecular techniques.
Since November 2003 I have been working as a postdoctoral research associate at
the Department of Ecology, Evolution, and Behavior, University of Minnesota with Prof.
Dr. R.G. Shaw and Dr. S. Wagenius. Here I study the effects of habitat fragmentation on
a typical prairie plant, purple coneflower. Of particular interest are the relationships with
its associated insects (herbivores and pollinators) and how, or whether, these are affected
by different inbreeding levels in fragmented populations.
183

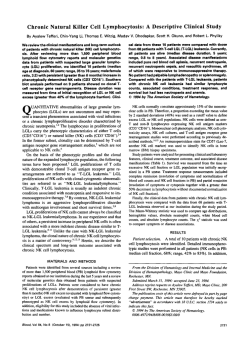

© Copyright 2026