
Full book - Media General
LIN Media is focused on
being the market-leading
multimedia company &
consumers’ & advertisers’
preferred choice on all screens
LIN Media has evolved from one of the country’s
Our industry-leading digital media business is an
great local broadcasters to one of the most innovative
important part of our story. We were one of the first
multimedia companies with unique content and
broadcasters to make a substantial commitment in the
marketing solutions for every screen.
digital space and have built an ecosystem that drives
In a world of virtually unlimited media choices, local
television continues to be in high demand by both
scale, synergies and opportunities to further expand
our national, regional and local sales channels.
consumers and advertisers. Our focus on delivering
Our strategy to deliver the greatest possible media
superior content to the largest local audiences, with
experience to our viewers and best-in-class
the highest level of user engagement, drives brand
marketing solutions to our clients truly differentiates
loyalty and sets us apart from the rest.
us industry-wide.
1
40283Narrative.indd 1
3/13/14 11:16 PM
DEAR SHAREHOLDERS
was another amazing year
for our company. Our team
worked tirelessly to successfully integrate
the largest acquired group of television
stations in our company’s history. In
pay television subscriber fee market with
a relentless focus on closing the gap
between our highly rated content and
fees received. Also, in 2013, we reached
an agreement with NBC to resolve our
our digital media business and expanded
our best-in-class solutions for agencies
and brands. We continued to drive the
performance is strong and our ability to
advance our strategy continues to help
differentiate our story from our peers.
SOME OF OUR PROUD ACCOMPLISHMENTS ARE AS FOLLOWS:
acquisition television stations by:
Converting each station to our news,
sales and digital platforms
effectiveness through key personnel
changes, training, sharing best
practices, and benchmarking analysis
market and upgrading the quality of
newscasts and programming
Building out three technology
centers to generate meaningful
cost savings
Acquired a majority ownership interest
in two digital marketing companies,
HYFN and Dedicated Media,
increasing our digital competency
and product offerings
Developed and launched a proprietary
suite of social and mobile advertising
solutions
Grew Digital Media revenues by
65% versus 2012, or to 14% of total
company-wide revenue1
Increased pay-TV subscriber fees
by 72% versus 2012
Launched African-American channel
Growing subscriber fees
Decreasing paid programming and
non-value focused activities
Building a digital culture and providing
employees the tools they need to sell
more across multiple screens
e are excited that investors have
rediscovered local television’s value
a strong, innovative operator. Research
consistently shows high levels of television
consumption and the tremendous growth
in digital consumption, especially video.
These are the businesses we are engaged
in and singularly focused upon.
We will continue to evolve and transform
local television into a true multimedia
experience, delivering the highest quality
video offerings inside or outside the home,
on multiple devices, wired or unwired.
With our unique consumer offerings, we
will continue to provide advertisers with
expert marketing advice and the ability to
Unwound the NBC JV, resolving the
debt guarantee contingent liability and
tax overhang
Closed the year as one of the NYSE’s
top performing stocks
consider it a privilege to work with them
each and every day.
I look forward to updating you on our
progress throughout the year.
audiences through our premium TV and
digital platforms.
Thank you once again for your support
and know that we have some of the most
talented and hard working employees who
take a great deal of pride in their careers.
Vincent Sadusky
2
40283Narrative.indd 2
3/12/14 8:08 PM
U.S. Unique Visitors
Of our Big-4 news stations
We reach 37% of the Total U.S.
Internet Audience 2
ranked #1 or #2
in their local market3
Revenue Growth
E
D
BIT
A
CA
ranked #1 or #2 for
overall engagement 4
Interactive Revenues 6
(in millions)
2
GR
Of our web
& mobile sites
(in millions)
1%
Page
Views
Video
Views
on our web & mobile sites 5
Local Programming 7
(hours in thousands)
$75.9
$652.4
34
$400.0
Revenue
$327.8
EBITDA
$86.4
$27.2
$122.9
2009
2011
31
$185.9
29
$2.8
2013
2009
2011
2013
2013
2011
2009
Revenue Diversification 8
2009
Television
Ad Revenue
84%
Other
12%
Digital
Media
4%
2013
Television
Ad Revenue
64%
Other
22%
Digital
Media
14%
Notes: Interactive revenues include revenues from LIN Digital in 2009; revenues from LIN Digital and Nami Media in 2011 and revenues from LIN
Digital, LIN Mobile, Nami Media, HYFN and Dedicated Media in 2013. Digital Media revenues include revenues generated from our television station
websites in 2009 and revenues generated from our television station websites, LIN Digital, LIN Mobile, Nami Media, HYFN and Dedicated Media in
2013. Additional footnotes and the GAAP reconciliation from operating income to Adjusted EBITDA can be found on page 8.
40283Narrative.indd 3
RESULTS
3
3/12/14 8:08 PM
O u r c o m m i t m e n t t o d e l i v e r i n g the best and most relevant local content to
c o n s u m e r s o n m u l t i p l e s c r e ens continues to set us apart. Our brands are
u b i q u i t o u s , a u t h o r i t a t i v e a n d our local communities rely on us for valuable
n e w s , i n f o r m a t i o n a n d e n t e r t a i n m e n t , 2 4 h o u r s a d a y, o n a n y d e v i c e .
In 2013, we made important investments in
our broadcast operations so we could continue
producing the highest quality and quantity of
unique local content. 11 of our television stations
launched or expanded their local news products
in 2013 and all of our stations are broadcasting
in HD, as well as live streaming their local news
online and on mobile devices. By extending the
reach of our unique local content to different day
parts and audiences, we are increasing brand
loyalty, which in turn, attracts advertisers.
Demand for local news on all screens is high
amongst consumers and advertisers. In 2013,
we capitalized on our duopoly strategy and
added or expanded our morning news shows
on several of our secondary stations when
most of the major national networks are all
airing national network morning shows.
Our model of community service
value and responsibility to the
local community.
4
40283Narrative.indd 4
3/12/14 8:08 PM
Our innovative local lifestyle
programs provide unique advertising
opportunities beyond traditional
spots and create proprietary content
for our web and mobile screens,
which helps to differentiate our
stations from the local competition.
We believe our commitment to groundbreaking, in-depth investigative
journalism that informs and protects our viewers is compelling and
distinctive. Our reporters are known for never giving up, never giving in and
never stopping until they can share their story with viewers on all screens.
We are developing much closer relationships with consumers through
our relentless focus on engagement and innovating new products that
make it more convenient for users to engage with our unique local
content. For example, our innovative and proprietary technology
called Report!t® allows viewers to participate in the newsgathering
process and instantaneously upload photos and videos to our
stations’ news desks from any mobile device.
We remain ahead of the curve by investing in the latest,
proven technology and newsgathering equipment for
40283Narrative.indd 5
3/12/14 8:08 PM
INDUSTRY-LEADING DIGITAL MEDIA BUSINESS
We were one of the first in our industry to make a substantial commitment to
building our own unique digital media business that drives scale, synergies and
opportunities to further expand our national, regional and local sales channels.
In 2013, we aligned our robust
portfolio of digital offerings
called LIN Digital Media in order
to seize opportunities to further
nationalize our sales force, take
full advantage of operating
synergies and drive further
growth and success.
Also during the year, LIN Digital opened
its new headquarters in Austin, TX
Media has evolved alongside the maturing digital media landscape
to meet the needs of today’s advertisers, leveraging the full potential
and we expanded our digital media
of data, developing industry-leading native advertising solutions, and
ecosystem with two innovative
delivering high-impact, rich media creative across all screens.
companies that deepen and
differentiate our digital marketing
services and provide best-in-class
HYFN is a full service digital agency that develops and implements
award-winning mobile, social and web experiences for some
solutions to our clients.
Los Angeles, CA and New York, NY, HYFN is a collective force of
Dedicated Media is an innovator in performance-
strategic, creative, engineering and client service specialists that
based marketing, data targeting and analytics. Founded in 2004 and
design and develop groundbreaking, cross-platform solutions
IL and San Francisco, CA, Dedicated Media enables our company to
landscape and evolving digital culture. We are excited about the
further optimize our clients’ digital marketing campaigns and deliver
potential for each of these digital companies, including our most
even greater return on investment. Over the past 10 years, Dedicated
recent addition to the portfolio, Federated Media Publishing, Inc.
6
40283Narrative.indd 6
3/12/14 8:08 PM
In 2013, HYFN unveiled its new Social Media Management
We continue to stay ahead
Platform called HYFN8 that utilizes cutting-edge, proprietary
of the curve through
technology to allow marketers to listen to conversations
our continuous product
happening around their brand in real-time, so they may
innovation and digital
create hyper relevant advertising campaigns. The more
marketing solutions that
a marketer uses HYFN8, the more intelligent the system
reach target audiences and
becomes allowing it to make real-time recommendations
generate results.
on messaging and optimal times for that messaging to be
the most effective. As a result, marketers are able to better
monetize their social media campaigns.
LIN Digital developed its Video Insights PlatformTM,
a comprehensive, cross-screen video measurement
solution that empowers agencies by providing all of
the metrics and insights needed to evaluate true
campaign performance in a single, powerful tool.
LIN Mobile launched ONETM, a new suite of mobile marketing solutions that
leverages our proprietary web-based platform to engage consumers on the
devices they use most frequently, with the intelligence required to effectively
TM
responsive mobile ad units to reach the marketplace that ensures seamless
mobile integration between operating systems, screen sizes and publisher
device. ONETM handles every step in the campaign process from insertion orders
to delivering real-time insights and actionable analytics throughout the campaign.
Our digital media portfolio provides our national, regional and local sales teams
with access to numerous proprietary products and an expanded toolbox that
allows us to gain more share of our clients’ advertising budgets.
We enable agencies and brands to effectively and efficiently reach their target
audiences at scale by utilizing our ComScore Top 15 Video and Top 25 Display
market share, and the latest in conversational marketing, video, display, mobile,
social intelligence and monetization, as well as reporting across all screens.
REACH TARGET
TARGET AUDIENCES AT SCALE
40283Narrative.indd 7
3/12/14 8:08 PM
believes this should be the primary basis for evaluating its performance.
The reconciliation of our operating income to adjusted earnings before interest, taxes, depreciation, and amortization
(EBITDA) is provided below.
Reconciliation of Operating Income to Adjusted EBITDA9
(in thousands)
$
Operating income - U.S. GAAP
Add:
Amortization of program rights
Depreciation
Amortization of intangible assets
Impairment of intangible assets
Restructuring charge
Contract termination costs
Stock-based compensation expense
Loss (gain) on sale of other assets
Non-recurring and acquisition-related charges
Subtract:
Cash payments for programming
$
Adjusted EBITDA - Non-GAAP
2013
89,944
29,242
46,854
22,826
3,895
3,887
9,374
710
10,842
(31,677)
185,897
$
$
2011
89,104
21,406
26,246
1,199
707
6,176
472
2,171
(24,622)
122,859
$
$
2009
22,294
23,751
28,639
633
39,487
498
2,413
(5,828)
(25,447)
86,440
[1]
Digital Media revenues include revenues generated from our television station websites, LIN Digital, LIN Mobile, Nami Media, HYFN and Dedicated Media.
[2]
comScore Media Metrix, Audience Duplication, December 2013 including our television station websites, LIN Digital and Dedicated Media.
[3]
2013 Nielsen average of the Company’s Big 4 newscasts (February/May/July/November). ABC/CBS/NBC based on Adults 25-54. FOX based on Adults 18-49. All Nielsen
data included in this report represents Nielsen’s estimates, and Nielsen has neither reviewed nor approved the data included in this report.
[4]
comScore Media Metrix Multi Platform data; November 2013. Overall engagement references comScore’s average minutes per visitors. The basis for comparison is
calculated against the Company’s and local media competitors’ self-defined classification from within the comScore dictionary, excluding the following LIN Media markets
not currently measured by comScore: Birmingham, Wichita, Savannah, Topeka, Mason City, Terre Haute and Lafayette.
[5]
Adobe Analytics, January through December 2013, Page Views Report & Video Views Report.
[6]
Interactive revenues include revenues from LIN Digital in 2009; revenues from LIN Digital and Nami Media in 2011 and revenues from LIN Digital, LIN Mobile, Nami
Media, HYFN and Dedicated Media in 2013.
[7]
Excludes local programming aired by the television stations acquired and those sold in 2012.
[8]
Digital Media revenues include revenues generated from our television station websites in 2009 and revenues generated from our television station websites,
LIN Digital, LIN Mobile, Nami Media, HYFN and Dedicated Media in 2013. Other revenues include network compensation, barter, pay-TV subscriber fees and other
miscellaneous revenues.
[9]
Adjusted EBITDA is a non-GAAP financial measure and should be viewed in addition to, and not as an alternative for our reported results. Our consolidated results for
the years ended December 31, 2011 and 2009 reflect the operations of WWHO-TV in Columbus, OH and WUPW-TV in Toledo, OH, which were sold in 2012, as
discontinued operations.
8
40283Narrative.indd 8
3/12/14 8:08 PM
UNITED STATES
SECURITIES AND EXCHANGE COMMISSION
Washington, D.C. 20549
_______________________________________________
Form 10-K
ANNUAL REPORT PURSUANT TO SECTION 13 OR 15(d) OF THE SECURITIES EXCHANGE
ACT OF 1934
For the fiscal year ended December 31, 2013
or
TRANSITION REPORT PURSUANT TO SECTION 13 OR 15(d) OF THE SECURITIES
EXCHANGE ACT OF 1934
For the transition period from
to
LIN Media LLC
(Exact name of registrant as specified in its charter)
Commission File Number: 001-36032
LIN Television Corporation
(Exact name of registrant as specified in its charter)
Commission File Number: 000-25206
Delaware
(State or other jurisdiction of incorporation or organization)
05-0501252
(I.R.S. Employer Identification No.)
Delaware
(State or other jurisdiction of incorporation or organization)
13-3581627
(I.R.S. Employer Identification No.)
701 Brazos Street, Suite 800, Austin, Texas 78701
(Address of principal executive offices)
(512) 380-4400
(Registrant's telephone number, including area code)
Securities Registered Pursuant to Section 12(b) of the Exchange Act:
Title of each class
Class A common shares
Name of each exchange on which registered
New York Stock Exchange
Indicate by check mark if the registrant is a well-known seasoned issuer, as defined in Rule 405 of the Securities Act. Yes
Indicate by check mark if the registrant is not required to file reports pursuant to Section 13 or Section 15(d) of the Act. Yes
No
No
Indicate by check mark whether the registrant: (1) has filed all reports required to be filed by Section 13 or 15(d) of the Securities Exchange Act
of 1934 during the preceding 12 months (or for such shorter period that the registrant was required to file such reports), and (2) has been subject to such
filing requirements for the past 90 days. Yes
No
Indicate by check mark whether the registrant has submitted electronically and posted to its corporate Web site, if any, every Interactive Date
File required to be submitted and posted pursuant to Rule 405 of Regulation S-T (§232.405 of this chapter) during the preceding twelve months (or for
such shorter period that the registrant was required to submit and post such files). Yes
No
Indicate by check mark if disclosure of delinquent filers pursuant to Item 405 of Regulation S-K is not contained herein, and will not be contained,
to the best of registrant's knowledge, in definitive proxy or information statements incorporated by reference in Part III of this Form 10-K or any amendment
to this Form 10-K.
Indicate by check mark whether the registrant is a large accelerated filer, an accelerated filer, a non-accelerated filer, or a smaller reporting company.
See the definitions of "large accelerated filer," "accelerated filer" and "smaller reporting company" in Rule 12b-2 of the Exchange Act. (Check one):
Large accelerated filer
Accelerated Filer
Non-accelerated filer
(Do not check if a
smaller reporting company)
Indicate by check mark whether the registrant is a shell company (as defined in Rule 12b-2 of the Act.) Yes
Smaller reporting company
No
The aggregate market value of the voting and non-voting common equity held by non-affiliates (based on the last reported sale price of the registrant's
class A common shares on June 30, 2013 on the New York Stock Exchange) was approximately $794 million.
Document Description
Portions of the Registrant's Proxy Statement on Schedule14A for the Annual Meeting of Shareholders to be held on
May 6, 2014
Form 10-K
Part III
DOCUMENTS INCORPORATED BY REFERENCE
NOTE:
This combined Form 10-K is separately filed by LIN Media LLC and LIN Television Corporation. LIN Television Corporation meets the conditions
set forth in general instruction I(1) (a) and (b) of Form 10-K and is, therefore, filing this form with the reduced disclosure format permitted by such instruction.
LIN Media LLC Class A common shares, issued and outstanding as of February 27, 2014 : 34,495,067 shares.
LIN Media LLC Class B common shares, issued and outstanding as of February 27, 2014: 20,901,726 shares.
LIN Media LLC Class C common shares, issued and outstanding as of February 27, 2014: 2 shares.
LIN Television Corporation common shares, issued and outstanding as of February 27, 2014: 1,000 shares.
EXPLANATORY NOTE
On July 30, 2013, LIN TV Corp., a Delaware corporation (“LIN TV”), completed its merger with and into LIN Media
LLC, a Delaware limited liability company and wholly owned subsidiary of LIN TV (“LIN LLC”), with LIN LLC as the
surviving entity (the “Merger”) pursuant to the Agreement and Plan of Merger, dated February 12, 2013, by and between LIN
TV and LIN LLC (the “Merger Agreement”). Entry into the Merger Agreement had previously been reported by LIN TV on
its Current Report on Form 8-K filed with the U.S. Securities and Exchange Commission on February 15, 2013.
LIN LLC filed a Current Report on Form 8-K on July 31, 2013 (the “Form 8-K”) for the purpose of establishing
LIN LLC as the successor registrant to LIN TV pursuant to Rule 12g-3(a) under the Securities Exchange Act of 1934, as
amended (the “Exchange Act”), and to disclose certain related matters, including the consummation of the Merger. Pursuant
to Rule 12g-3(a) under the Exchange Act and in accordance with the filing of the Form 8-K, the class A common shares
representing limited liability interests in LIN LLC, as the successor issuer to LIN TV, were deemed registered under Section
12(b) of the Exchange Act. References to LIN LLC, we, us, or the Company in this Annual Report on Form 10-K that include
any period at and before the effectiveness of the Merger shall be deemed to refer to LIN TV as the predecessor registrant to
LIN LLC. For more information concerning the effects of the Merger and the succession of LIN LLC to LIN TV upon its
effectiveness, please see the above referenced Form 8-K.
Table of Contents
PART I
Item 1.
Item 1A.
Item 1B.
Item 2.
Item 3.
Item 4.
PART II
Business .....................................................................................................................................................
Risk Factors ...............................................................................................................................................
Unresolved Staff Comments ......................................................................................................................
Properties ...................................................................................................................................................
Legal Proceedings......................................................................................................................................
Mine Safety Disclosures ............................................................................................................................
5
21
31
31
31
32
Item 5.
Market for Registrant's Common Equity, Related Shareholder Matters and Issuer Purchases of Equity
Securities....................................................................................................................................................
Selected Financial Data..............................................................................................................................
Management's Discussion and Analysis of Financial Condition and Results of Operations.....................
Quantitative and Qualitative Disclosures About Market Risk...................................................................
Financial Statements and Supplementary Data..........................................................................................
Changes in and Disagreements with Accountants on Accounting and Financial Disclosure....................
Controls and Procedures ............................................................................................................................
Other Information ......................................................................................................................................
33
34
36
53
54
54
54
54
Item 10.
Item 11.
Item 12.
Item 13.
Item 14.
PART IV
Directors and Executive Officers and Corporate Governance...................................................................
Executive Compensation ...........................................................................................................................
Security Ownership of Certain Beneficial Owners and Management and Related Shareholder Matters .
Certain Relationships and Related Transactions and Director Independence ...........................................
Principal Accounting Fees and Services....................................................................................................
55
55
55
55
56
Item 15.
Schedule I
EXHIBITS
Exhibits and Financial Statements Schedules............................................................................................
Condensed Financial Information of the Registrant ..................................................................................
57
F-95
21
10.23
Subsidiaries of the Registrant
Stock Purchase Agreement, dated January 27, 2014, between LIN Digital Media LLC and FMPL
Holdings, Inc.
Consent of PricewaterhouseCoopers LLP
Consent of PricewaterhouseCoopers LLP
Certification pursuant to Section 302 of the CEO of LIN Media LLC
Certification pursuant to Section 302 of the CFO of LIN Media LLC
Certification pursuant to Section 302 of the CEO of LIN Television Corporation
Certification pursuant to Section 302 of the CFO of LIN Television Corporation
Certification pursuant to Section 906 of the CEO and CFO of LIN Media LLC
Certification pursuant to Section 906 of the CEO and CFO of LIN Television Corporation
XBRL Instance Document
XBRL Taxonomy Extension Schema Document
XBRL Taxonomy Extension Calculation Linkbase Document
XBRL Taxonomy Extension Label Linkbase Document
XBRL Taxonomy Extension Presentation Linkbase Document
XBRL Taxonomy Extension Definition Linkbase Document
Item 6.
Item 7.
Item 7A.
Item 8.
Item 9.
Item 9A.
Item 9B.
PART III
23.1
23.2
31.1
31.2
31.3
31.4
32.1
32.2
101.INS**
101.SCH**
101.CAL**
101.LAB**
101.PRE**
101.DEF**
3
SPECIAL NOTE ABOUT FORWARD-LOOKING STATEMENTS
This report contains certain forward-looking statements with respect to our financial condition, results of operations
and business, including statements under the captions Item 1. "Business" and Item 7. "Management's Discussion and Analysis
of Financial Condition and Results of Operations". All of these forward-looking statements are based on estimates and
assumptions made by our management, which, although we believe them to be reasonable, are inherently uncertain. Therefore,
you should not place undue reliance upon such estimates or statements. We cannot assure you that any of such estimates or
statements will be realized and actual results may differ materially from those contemplated by such forward-looking
statements. Factors that may cause such differences include those discussed under the caption Item 1A. "Risk Factors", as
well as the following:
changes in, or interpretations of, the exceptions to the Federal Communications Commission ("FCC")
Many of these factors are beyond our control. Forward-looking statements contained herein speak only as of the date
hereof. We undertake no obligation to publicly release the result of any revisions to these forward-looking statements, to
reflect events or circumstances after the date hereof or to reflect the occurrence of unanticipated events except to the extent
required by applicable law.
4
PART I
Item 1.
Business
Overview
LIN Media LLC ("LIN LLC") is a local multimedia company that currently owns, operates or services 43 television
stations and seven digital channels in 23 U.S. markets, along with a diverse portfolio of websites, apps and mobile products
that make it more convenient to access our unique and relevant content on multiple screens. Our highly-rated television stations
deliver superior local news, community service, and popular sports and entertainment programming to viewers, reaching
10.5% of U.S. television homes. All of our television stations are affiliated with a national broadcast network and are primarily
located in the top 75 Designated Market Areas ("DMAs") as measured by Nielsen Media Research ("Nielsen"). Our digital
media division operates from 31 markets across the country, including New York City, Los Angeles, San Francisco, Chicago,
Atlanta, Dallas, Detroit and Washington D.C., and delivers measurable results to some of the nation's most respected agencies
and companies. In this report, the terms "Company," "we," "us" or "our" mean LIN LLC and all subsidiaries included in our
consolidated financial statements. Our class A common shares are traded on the New York Stock Exchange ("NYSE") under
the symbol "LIN".
We provide free, over-the-air broadcasts of our programming 24 hours per day to the communities we are licensed to
serve. We are committed to serving the public interest by making advertising time available to political candidates, by providing
free daily local news coverage, making public service announcements and broadcasting children's programming.
We seek to have the largest local media presence in each of our local markets by combining strong network and syndicated
programming with leading local news, and by pursuing our multi-channel strategy. We also deliver our content online and on
mobile applications, which we believe could provide a significant revenue stream to the television broadcasting industry.
Mobile digital broadcast television enables consumers to watch live television on their laptops, smartphones, tablet computers
and other mobile devices. We expect over-the-air television delivered to mobile and out-of-home devices in our local markets
to meet the growing demand of on-the-go consumers. Additionally, we invest in companies that focus on emerging media
and interactive technologies to expand our local multi-platform and digital product offerings.
Development of Our Business
Ownership and organizational structure
Our Company (including its predecessors) has owned and operated television stations since 1966. LIN Television
Corporation ("LIN Television"), our wholly-owned subsidiary, is a Delaware corporation and was incorporated on June 18,
1990. LIN TV Corp., a Delaware corporation ("LIN TV") was incorporated on February 11, 1998 and on May 3, 2002,
completed its initial public offering and shares of LIN TV class A common stock began trading on the NYSE. On July 30,
2013, LIN TV merged with and into LIN LLC, a Delaware limited liability company and wholly owned subsidiary of LIN
TV, with LIN LLC as the surviving entity (the “Merger”) pursuant to the Agreement and Plan of Merger, dated February 12,
2013, by and between LIN TV and LIN LLC (the “Merger Agreement”).
LIN LLC filed a Current Report on Form 8-K on July 31, 2013 (the “Form 8-K”) for the purpose of establishing LIN
LLC as the successor registrant to LIN TV pursuant to Rule 12g-3(a) under the Securities Exchange Act of 1934, as amended
(the “Exchange Act”), and to disclose certain related matters, including the consummation of the Merger. Pursuant to Rule
12g-3(a) under the Exchange Act and in accordance with the filing of the Form 8-K, the class A common shares representing
limited liability interests in LIN LLC, as the successor registrant to LIN TV, were deemed registered under Section 12(b) of
the Exchange Act. References to "LIN LLC," "we," "us," or the "Company" in this Annual Report on Form 10-K that include
any period at and before the effectiveness of the Merger shall be deemed to refer to LIN TV as the predecessor registrant to
LIN LLC. For more information concerning the effects of the Merger and the succession of LIN LLC to LIN TV upon its
effectiveness, please see the Form 8-K.
Our corporate offices are located at 701 Brazos Street, Suite 800, Austin, Texas 78701.
We have three classes of common shares. The class A common shares and the class C common shares are both voting
common shares, with the class C common shares having 70% of the aggregate voting power. The class B common shares are
held by current and former affiliates of HMC and have no voting rights, except that without the consent of a majority of the
class B common shares, we cannot enter into a wide range of corporate transactions.
5
This capital structure allowed us to issue voting shares while preserving the pre-existing ownership structure in which
the class B shareholders did not have an attributable ownership interest in our television broadcast licenses pursuant to the
rules of the FCC.
The following diagram summarizes our corporate structure as of February 27, 2014:
Class A Common Shares
Class B Common Shares
Class C Common Shares
34,495,067 shares outstanding
listed on the NYSE under the
symbol "LIN"
20,901,726 shares outstanding,
all of which are currently held
by affiliates or former affiliates
of HMC
2 shares outstanding, 1 of which
is held by affiliates of Mr. Royal
W. Carson III, a director, and
the other by HMC
30% voting power
Non-voting
70% voting power
LIN Media LLC
LIN Television Corporation
Television Stations and Digital Operations
All of the shares of our class B common shares are held by affiliates of HMC or former affiliates of HMC. The class B
common shares are convertible into class A common shares or class C common shares in various circumstances. The class C
common shares are also convertible into class A common shares in certain circumstances. If affiliates of HMC converted their
shares of class B common shares into shares of class A common shares and the shares of class C common shares were converted
into shares of class A common shares as of February 27, 2014, the holders of the converted shares of class C common shares
would own less than .01% of the total outstanding shares of class A common shares and resulting voting power, and the
affiliates of HMC would own 37.7% of the total outstanding shares of class A common shares and resulting voting power.
Our television stations
We own, operate or service 43 television stations and seven digital channels in 23 U.S. markets, including two affiliates
and one digital channel pursuant to local marketing agreements, six affiliates pursuant to joint sales and shared services
agreements, two affiliates pursuant to shared services agreements, and three low-power stations, which are affiliated with a
national network and operate as a stand-alone affiliate. The following table lists the stations and digital channels that we own,
operate or service:
6
Market (1)
DMA Rank
Channel
KOIN-TV(4)
WISH-TV(4)
WNDY-TV
WTNH-TV
WCTX-TV
CBS
CBS
MNTV
ABC
MNTV
40
9
32
10
39
2/1/2015
8/1/2013
8/1/2021
4/1/2015
4/1/2015
WOOD-TV(4)
NBC
7
10/1/2013
(6)
ABC
MNTV
NBC
CW
MNTV
CBS
20
Various
21
49
27
30
10/1/2013
10/1/2021
8/1/2014
8/1/2014
8/1/2014
4/1/2013
(6)
44
WOTV-TV
WXSP-CD
KXAN-TV
KNVA-TV(4)
KBVO-TV(5)
WIAT-TV
45
WAVY-TV(4)
NBC
31
10/1/2012
(6)
WVBT-TV
KRQE-TV(4)
KASA-TV(4)
KWBQ-TV(4)
KASY-TV
WIVB-TV
WNLO-TV
FOX
CBS
FOX
CW
MNTV
CBS
CW
29
13
27
29
45
39
32
10/1/2012
10/1/2014
10/1/2014
10/1/2014
10/1/2014
6/1/2015
6/1/2015
(6)
Hartford-New Haven, CT ...............
30
Grand Rapids-Kalamazoo-Battle
Creek, MI ........................................
39
Albuquerque-Santa Fe, NM ............
40
47
Buffalo, NY.....................................
52
Providence, RI-New Bedford, MA .
53
Mobile, AL/Pensacola, FL..............
Dayton, OH .....................................
Wichita-Hutchinson, KS .................
59
64
67
Honolulu, HI ...................................
69
Green Bay-Appleton, WI ................
70
Savannah, GA .................................
92
Fort Wayne, IN................................
Youngstown, OH.............................
Springfield-Holyoke, MA ...............
Topeka, KS......................................
109
113
114
134
Mason City, IA................................
153
Terre Haute, IN ...............................
155
Lafayette, IN ...................................
(1)
FCC license
expiration
Affiliation(s)
22
26
Birmingham, AL .............................
Norfolk-Portsmouth-Newport
News, VA........................................
Status (3)
Station
Portland, OR ...................................
Indianapolis, IN...............................
Austin, TX.......................................
(2)
189
WPRI-TV
CBS
13
WNAC-TV
WNAC-TV-D2
WALA-TV
WFNA-TV
WDTN-TV
WBDT-TV
KSNW-TV(4)
KSNG-TV-D2
KHON-TV(4)
KHON-TV-D2
WLUK-TV(4)
WCWF-TV
WJCL-TV
WTGS-TV
WANE-TV
WYTV-DT
WKBN-TV
WYFX-LD
WYTV-DT2
WWLP-TV(4)
KTKA-TV
KTKA-TV-D3
KSNT-TV(4)
KTMJ-CD
KIMT-TV
KIMT-TV-DT2
WTHI-TV(4)
WTHI-TV-D2
WLFI-TV
FOX
MNTV
FOX
CW
NBC
CW
NBC
TEL
FOX
CW
FOX
CW
ABC
FOX
CBS
ABC
CBS
FOX
MNTV
NBC
ABC
CW
NBC
FOX
CBS
MNTV
CBS
FOX
CBS
12
12.2
9
25
50
26
45
11.2
8
8
11
21
22
28
31
36
41
19
36.2
11
49
49.3
27
43
42
42.2
10
10.2
11
LMA
SSA
SSA
(6)
(6)
4/1/2015
LMA
LMA
SSA/JSA
SSA/JSA
SSA/JSA
SSA/JSA
SSA/JSA
SSA/JSA
4/1/2007
4/1/2007
4/1/2013
4/1/2013
10/1/2013
10/1/2013
6/1/2014
6/1/2014
2/1/2015
2/1/2015
12/1/2013
12/1/2021
12/31/2018
12/1/2012
8/1/2013
8/31/2013
10/1/2013
10/1/2013
10/1/2013
4/1/2015
6/1/2014
6/1/2014
6/1/2014
6/1/2014
2/1/2022
2/1/2022
8/1/2013
8/1/2013
8/1/2021
(6)
(6)
(6)
(6)
(6)
(6)
(6)
(6)
(6)
(6)
(6)
(6)
(6)
(6)
(6)
(6)
(6)
(6)
(6)
(6)
(6)
On February 12, 2013, we sold our equity interest in a joint venture with NBCUniversal Media, LLC ("NBC"). The joint venture was a
limited partner in a business that owns television stations KXAS-TV, an NBC affiliate in Dallas, and KNSD-TV, an NBC affiliate in San
Diego. For further information, see "Joint Venture Sale Transaction."
7
(2)
DMA estimates and rankings are taken from Nielsen Local Universe Estimates for the 2013-2014 Broadcast Season, effective September 28,
2013. There are 210 DMAs in the United States. All Nielsen data included in this report represents Nielsen's estimates, and Nielsen has
neither reviewed nor approved the data included in this report.
(3)
We own and operate all of our stations and digital channels except for those (i) noted as "LMA" which indicates stations to which we provide
services under a local marketing agreement (see "Distribution of Programming-Full-power television stations" for a description of these
agreements), (ii) noted as "SSA" which indicates stations to which we provide technical, engineering, promotional, administrative and other
operational support services under a shared services agreement (see "Distribution of Programming-Full-power television stations" for a
description of these agreements), and (iii) noted as "JSA" which indicates stations to which we provide advertising sales services under a
joint sales agreement (see "Principal Sources of Revenue-Other revenues" for a description of these agreements).
(4)
WISH-TV includes a low-power station, WIIH-CD. WOOD-TV, WAVY-TV, KNVA-TV, KRQE-TV, KASA-TV, KOIN-TV, KSNT-TV,
WLUK-TV and WWLP-TV each includes a group of low-power stations. KRQE-TV includes two satellite stations, KBIM-TV and KREZTV. KWBQ-TV includes one satellite station KRWB-TV. KHON-TV includes two satellite stations, KHAW-TV and KAII-TV. KSNW-TV
includes KSNC(TV), KSNG(TV) and KSNK(TV) as satellite stations and KSNL-LD as a translator. We own, operate or service all of these
satellite stations and low-power stations, which broadcast either identical programming as the primary station or programming specific to
such channel.
(5)
KBVO-TV is a full power satellite station of KXAN-TV and its primary affiliate is MyNetworkTV.
(6)
License renewal applications have been filed with the FCC and are currently pending. For further information on license renewals, see
"Federal Regulation of Television Broadcasting-License Renewals".
Joint Venture Sale Transaction and Merger
On February 12, 2013, we, along with our wholly-owned subsidiaries LIN Television and LIN Television of Texas, L.P.,
a Delaware limited partnership (“LIN Texas”), entered into and closed the transactions contemplated by a transaction agreement
(the “Transaction Agreement”) with NBC Telemundo License LLC, a Delaware limited liability company (“NBC”), NBCU
New LLC I, a Delaware limited liability company, NBCU New LLC II, a Delaware limited liability company, General Electric
Company, a New York corporation (“GE”), General Electric Capital Corporation, a Delaware corporation (“GECC” and
together with GE, the “GE Parties”), National Broadcasting Company Holding, Inc., a Delaware corporation, Comcast
Corporation, a Pennsylvania corporation (“Comcast”), NBCUniversal Media, LLC, a Delaware limited liability company
(“NBCUniversal”), Lone Star SPV, LLC, a Delaware limited liability company and Station Venture Holdings, LLC, a Delaware
limited liability company (“SVH”). SVH held a 99.75% interest in Station Venture Operations, LP (“SVO”), which is the
operating company that managed KXAS-TV and KNSD-TV, the television stations that comprised the joint venture. The
Transaction Agreement effected a series of transactions related to the ownership and sale of LIN Texas’s 20.38% equity interest
in SVH, a joint venture in which NBC, an affiliate of NBCUniversal, held the remaining 79.62% equity interest (collectively,
the “JV Sale Transaction”).
SVH was a limited partner in a business that operated an NBC affiliate in Dallas and an NBC affiliate in San Diego
pursuant to a management agreement. At the time of LIN Texas’s acquisition of its interest in SVH in 1998, GECC provided
secured debt financing to SVH in the form of a $815.5 million non-amortizing senior secured note due 2023 to GECC (the
“GECC Note”), and, in connection with SVH’s assumption of the GECC Note, LIN TV guaranteed the payment of the full
amount of principal and interest on the GECC Note (the “GECC Guarantee”).
In addition, during 2009, 2010, 2011 and 2012, LIN Television entered into agreements with SVH, the GE Parties and
NBCUniversal pursuant to which LIN Television, the GE Parties and NBCUniversal caused to be provided to SVH certain
unsecured shortfall funding loans (the “Shortfall Funding Loans”) on the basis of each party’s percentage of equity interest
in SVH in order to fund interest payments on the GECC Note.
Pursuant to the JV Sale Transaction, in exchange for LIN Television causing a $100 million capital contribution to be
made to SVH (which was used to prepay a portion of the GECC Note), LIN TV was released from the GECC Guarantee and
any further obligations related to any shortfall funding agreements. Further, LIN Texas sold its 20.38% equity interest in SVH
to affiliates of NBCUniversal, and the LIN parties transferred their rights to receivables related to the Shortfall Funding Loans
for $1.00. As a result of the JV Sale Transaction, neither we nor any of our direct or indirect subsidiaries have any further
investment in or obligations (funding or otherwise) related to SVH, including, without limitation, to make any other unsecured
shortfall loans or payments under the GECC Note or the GECC Guarantee.
We accrued for and expensed the $100 million capital contribution to SVH to secure the release of the GECC Guarantee
and recorded the related tax effects of the JV Sale Transaction, and the capital contribution in our consolidated financial
statements as of December 31, 2012 because it represented a probable and estimable obligation of the Company. In February
2013, we entered into a $60 million incremental term loan facility and utilized $40 million of cash on hand and borrowings
under our revolving credit facility to fund the $100 million capital contribution. As a result of the JV Sale Transaction, after
utilizing all of our available federal net operating loss carryforwards to offset the taxable gain recognized in such transaction,
8
we had an approximate $162.8 million income tax payable associated with this transaction remaining, $131.5 million of which
was extinguished as a result of the closing of the transactions contemplated by the Merger Agreement further described below.
Concurrent with the closing of the JV Sale Transaction, LIN TV entered into the Merger Agreement with LIN LLC as
described above. The Merger enabled the surviving entity to be classified as a partnership for federal income tax purposes
and the change in classification was treated as a liquidation of LIN TV for federal income tax purposes and LIN TV realized
a capital loss in its 100% equity interest in LIN Television.
Based on an average of the opening and closing trading prices of LIN TV's class A common stock on the day of the
Merger, LIN TV realized a capital loss in the amount of approximately $343 million, which represented the difference between
its tax basis in the stock of LIN Television, and the fair market value of such stock as of July 30, 2013. The capital loss realized
and existing net operating losses were used to offset a portion of the capital gain recognized in the JV Sale Transaction and
we realized cash savings of $131.5 million, resulting in a remaining tax liability of $31.3 million associated with the JV Sale
Transaction. We made state and federal tax payments to settle this tax liability during the fourth quarter of 2013.
Recent Acquisitions
On April 4, 2013, LIN Television acquired a 50.1% interest (calculated on a fully diluted basis) in HYFN, Inc. ("HYFN"),
a full service digital advertising agency specializing in the planning, development, deployment and support for websites,
mobile sites, interactive banners, games and various applications for multiple devices, for $7.2 million. Additionally, on April
9, 2013, LIN Television acquired a 60% interest (calculated on a fully diluted basis) in Dedicated Media, Inc. ("Dedicated
Media"), a multi-channel advertisement buying and optimization company, for $5.8 million. Dedicated Media employs new
technologies to create, plan and execute digital marketing campaigns on behalf of its clients.
On February 3, 2014, LIN Digital Media LLC, a wholly owned subsidiary of LIN Television, acquired 100% of the
capital stock of Federated Media Publishing, Inc. ("Federated Media"), a digital content and conversational marketing company.
The purchase price totaled $22.4 million plus an adjustment for working capital delivered at closing, and was funded from
cash on hand and amounts drawn on our revolving credit facility.
For additional information on these acquisitions, see Note 2, "Acquisitions" to our consolidated financial statements.
Description of Our Business
We own, operate or service 43 television stations, seven digital channels, websites and mobile apps in 23 U.S. markets,
with multiple network affiliated channels in 18 markets. Our growing digital media portfolio helps agencies and brands
effectively and efficiently reach their target audiences at scale by utilizing our comScore, Inc. rated Top 15 Video market
share(1) and the latest in conversational marketing, video, display, mobile, social intelligence and monetization, as well as
reporting across all screens. Our vision is to be the market-leading multimedia company and consumers' and advertisers'
preferred choice for unique, innovative and relevant content on all screens.
The principal components of our strategy include:
Sustain our Local News Leadership & Extend the Reach of Our Brands. The strength of our local news brands is a
result of our ability to embrace changing media habits, focus on superior multiscreen content production and
distribution, invest in localism, and commit to training and sharing best practices throughout our organization. In
2013, we launched high definition newscasts at five stations, which completes the transition of all of our television
stations to high definition and enhances our competitive positions in our local markets. In addition, 11 of our television
stations launched or expanded their local news products in 2013. Finally, in 2013, we launched live streaming of our
local newscasts on all of our television station websites. We capitalized on our duopoly strategy and added or expanded
morning news on several of our secondary stations when the big three networks are all airing network morning
shows. Delivering the best and most relevant local content to viewers on multiple screens is an important part of our
strategy. Regardless of the screen, viewers have instant and easy access to our unique local content, 24/7, and on
any device. For example, we provide groundbreaking, in-depth investigative journalism that informs our viewers
through on-air stories, interactive features and online special sections. We are focused on extending the reach of our
local brands, which drives brand loyalty, and in turn, attracts advertising dollars. As a result of our strategy and
efforts, the majority of our television, website and mobile screens consistently rank at the top of our local markets
compared to our broadcast competitors.
__________________________________
(1)
h.
9
Build Scale, Synergies & Efficiencies. In 2013, we successfully integrated the largest acquired group of TV stations
television stations are providing significant opportunities to grow our digital business, increase our bargaining power
with multichannel video programming distributors ("MVPDs"), networks and syndicators, and add greater scale to
amortize digital media and technology investments, including our shared services capabilities. Also in 2013, we
opened our third regional technology center, which provides engineering, operations, financial and administrative
functions for several of our television stations in order to maximize operating synergies and reduced capital costs.
We also continued to achieve company-wide operating efficiencies through economies of scale in the purchase of
programming, ratings services, research services, national sales representation, capital equipment and other vendor
services. Finally, in 2013, we continued to advance our "Accelerate" sales strategy in order to create cross-selling
and standardize all sales support functions and operations to benefit our advertisers.
Grow and Differentiate Our Digital Media Business. We are committed to building our digital media business in a
smart and strategic way. In 2013, we expanded our portfolio with two companies that greatly enhance our digital
marketing capabilities, increase our scale, deliver important synergies and differentiate us from the competition.
HYFN is a full service digital agency that develops and implements award-winning mobile, social and web
experiences for some of the world’s largest brands. In 2013, HYFN unveiled its new social media management
platform called HYFN8 that allows marketers to listen and react to online consumer behavior in real-time. We also
invested in Dedicated Media, an innovator in performance-based marketing, data targeting and analytics. Dedicated
Media enables us to further optimize our clients’ digital marketing campaigns and deliver even greater return on
investment. We remained ahead of the curve in 2013 through our continuous multiscreen product innovation and
advertising solutions that reach target audiences and generate results. For example, LIN Mobile unveiled ONETM,
on the devices they use most frequently, with the intelligence required to effectively deliver unified brand messaging
across screens. In 2013, we continued to build our national digital sales force, while, at the same time, leveraging
the strong relationships we have in each of our markets to sell more multiscreen campaigns to large, local advertisers.
Our portfolio of video, display, mobile and social platforms, including our recently launched Video Insights Platform
(“VIP”), helps agencies and brands efficiently and effectively reach our targeted audiences at scale, leveraging the
latest in conversational marketing, digital solutions and reporting across all platforms. As a result of our strategy,
digital revenues have increased from 1% of total revenues in 2007, when our digital media business was launched,
to 14% of total revenues in 2013.(2)
. According to Nielsen, cable, satellite television and
telecommunications companies currently provide video program services to approximately 90% of total U.S.
television households.(3) The surge of competition from satellite and telecommunications companies, combined with
our strong local and national programming, provides us with compelling negotiating positions to obtain compensation
for our channels. It is of critical importance to the broadcast industry that pay-television operators pay subscriber
fees that are commensurate with the superior ratings our channels achieve relative to cable channels. In 2013, we
successfully renewed agreements with pay television providers that account for nearly 20% of the subscribers in our
markets, and over the next two years, we will work to negotiate renewals that represent more than 75% of the
subscribers in our markets. This is an important revenue stream for broadcasters and we are focused on closing the
gap between our highest-rated content the fees we receive.
__________________________________
(2)
Digital revenues include revenues generated from our television websites, LIN Digital, LIN Mobile, Nami, as well as HYFN and Dedicated Media.
(3)
Nielsen DMA Media Related TV Households as of 12/31/2013. All Nielsen data included in this report represents Nielsen's estimates, and Nielsen has
neither reviewed nor approved the data included in this report.
10
. We believe our spectrum has value beyond traditional television
channels, and digital technology enables us to separate a portion of that spectrum for incremental services. We
currently own or service seven digital sub-channels that utilize spectrum shared with another national network
affiliate. In 2013, we launched Bounce TV, the nation’s first-ever over-the-air broadcast television network designed
for African-American audiences, on our digital sub-channels in nine of our local markets in order to better serve
minority communities. Our multi-channel strategy helps us appeal to a wider audience and market of advertisers
while providing economies of scale to provide these additional programming services at a low incremental cost.
. Our model of community service exemplifies broadcasting's great value and
responsibility to the local community. We believe it is critically important to ensure the dynamic future of our industry,
which is why we have been awarding two-year scholarships to ambitious students interested in a wide spectrum of
fields in or relating to broadcast television since 1998, and digital media since 2011. In addition, we provide
programming that is responsive to community needs, such as emergency alerts, closed captioning for hearing impaired
viewers and childrens’ programming. We also support numerous non-profit organizations, programs, telethons and
events that help make the communities we serve better, stronger and more vibrant places to live, work and do business.
Principal Sources of Revenue
Local, national and political advertising revenues
We generate local, national and political advertising revenues principally from advertising time sold in our local news,
network and syndicated programming. In general, advertising rates are based upon a variety of factors, including:
We have retransmission consent agreements with cable, satellite and telecommunications providers from which we earn
retransmission consent fees for the right to carry our signals in their pay-television services to consumers.
We generate revenues through advertisements on our television stations' websites and mobile applications.
Interactive revenues
We generate interactive revenues primarily by providing online advertising and media services through our online
advertising and media services business, LIN Digital, Nami Media, HYFN and Dedicated Media.
Other revenues
Other revenues include barter of unsold advertising inventory for goods and services that are required to operate our
television stations or are used in sales and marketing efforts. We also acquire certain syndicated programming by providing
a portion of the available advertising inventory within the program, in lieu of cash payments.
Additionally, we receive other revenues from sources such as renting space on our television towers, renting our
production facilities, copyright royalties and providing television production services. Finally, we earn fee income through
shared services agreements for two stations located in the Albuquerque-Santa Fe market, under which we provide technical,
engineering, promotional, administrative and other operational support services from our stations that we own and operate
within the market. We also have shared services agreements and joint sales agreements for stations in the Dayton, Ohio,
Savannah, Georgia, Topeka, Kansas and Youngstown, Ohio markets, pursuant to which we also provide advertising sales
services.
Sources and Availability of Programming
We program our television stations from the following program sources:
11
Our television stations and digital channels produce an aggregate of approximately 882 hours of local news programming
per week that we broadcast on all but seven of our stations. Local news programming also allows us greater control over our
programming costs.
The number of weekly hours of network, local news and other local programming produced by our television stations
and digital channels are as follows:
Network
DMA
ABC ...................... Hartford-New Haven,
CT
Grand RapidsKalamazoo-Battle Creek,
MI
Station
Weekly Hours
of Network
Programming
Weekly Hours
of Local News
Programming
Weekly Hours
of Other Local
Programming
30
WTNH-TV
81
29
3
8/31/2017
39
WOTV-TV
80
8
3
8/31/2017
12/31/2018
DMA
Rank
Network
Affiliation
End Date
Savannah, GA
92
WJCL-TV
79
17
—
Youngstown, OH
113
WYTV-DT
78
20
—
8/31/2017
Topeka, KS
134
KTKA-TV
78
19
—
12/31/2015
CBS ....................... Portland, OR
22
KOIN-TV
95
31
1
9/18/2016
Indianapolis, IN
26
WISH-TV
91
35
6
12/31/2014
Birmingham, AL
44
WIAT-TV
96
22
1
12/31/2014
Albuquerque-Santa Fe,
NM
47
KRQE-TV
95
34
—
12/31/2014
Buffalo, NY
52
WIVB-TV
87
30
1
12/31/2014
Providence, RI-New
Bedford, MA
53
WPRI-TV
92
32
6
12/31/2014
Fort Wayne, IN
109
WANE-TV
96
24
—
12/31/2014
Youngstown, OH
113
WKBN-TV
91
22
—
1/31/2017
Mason City, IA
153
KIMT-TV
94
24
—
6/30/2015
Terre Haute, IN
155
WTHI-TV
97
20
3
12/31/2014
Lafayette, IN
189
WLFI-TV
95
23
—
12/31/2017
NBC ...................... Grand RapidsKalamazoo-Battle Creek,
MI
39
WOOD-TV
96
34
6
1/1/2017
Norfolk-PortsmouthNewport News, VA
45
WAVY-TV
95
35
5
1/1/2017
Austin, TX
40
KXAN-TV
92
32
1
1/1/2017
Dayton, OH
64
WDTN-TV
97
28
5
1/1/2017
Wichita-Hutchinson, KS
67
KSNW-TV
96
30
—
1/1/2017
Springfield-Holyoke,
MA
114
WWLP-TV
95
34
6
1/1/2017
Topeka, KS
134
KSNT-TV
96
24
—
1/1/2017
FOX ...................... Norfolk-PortsmouthNewport News, VA
45
WVBT-TV
26
14
—
12/31/2017
Albuquerque-Santa Fe,
NM
47
KASA-TV
26
19
5
12/31/2017
Providence, RI-New
Bedford, MA
53
WNAC-TV
26
16
—
12/31/2017
Mobile, AL/Pensacola,
FL
59
WALA-TV
26
34
5
12/31/2017
12
Network
DMA
DMA
Rank
Green Bay-Appleton, WI
70
Honolulu, HI
69
Station
Weekly Hours
of Network
Programming
Weekly Hours
of Local News
Programming
Weekly Hours
of Other Local
Programming
Network
Affiliation
End Date
WLUK-TV
26
KHON-TV
27
43
7
12/31/2017
27
—
12/31/2017
Savannah, GA
92
WTGS-TV
26
7
—
12/31/2017
Youngstown, OH
113
WYFX-LD
26
16
—
12/31/2017
Topeka, KS
134
KTMJ-CD
26
15
—
12/31/2017
155
WTHI-TVD2
37
3
—
12/31/2017
20
14
—
9/17/2016
Terre Haute, IN
CW ........................ Austin, TX
40
KNVA-TV
Albuquerque-Santa Fe,
NM
47
KWBQ-TV
20
—
—
9/17/2016
Buffalo, NY
52
WNLO-TV
33
13
5
9/17/2016
Mobile, AL/Pensacola,
FL
59
WFNA-TV
20
—
3
9/17/2016
Dayton, OH
64
WBDT-TV
20
14
—
9/17/2016
Green Bay-Appleton, WI
70
WCWF-TV
20
—
1
9/17/2016
69
KHON-TVD2
20
—
—
9/17/2020
134
KTKA-TVD2
20
—
—
9/17/2019
Honolulu, HI
Topeka, KS
MyNetworkTV...... Indianapolis, IN
26
WNDY-TV
13
9
1
9/28/2014
Hartford-New Haven,
CT
30
WCTX-TV
10
9
3
9/28/2014
Grand RapidsKalamazoo-Battle Creek,
MI
39
WXSP-CD
10
4
—
9/28/2014
Austin, TX
40
KBVO-TV
10
1
—
9/28/2014
Albuquerque-Santa Fe,
NM
47
KASY-TV
10
—
—
9/28/2014
53
WNAC-TVD2
11
1
6
9/28/2014
113
WYTV-DTD2
10
10
4
9/28/2014
153
KIMT-TVD2
10
6
—
9/28/2014
67
KSNG-TVD2
12/31/2014
Providence, RI-New
Bedford, MA
Youngstown, OH
Mason City, IA
Telemundo............. Wichita-Hutchinson, KS
168
—
—
2,789
882
87
All of our stations are affiliated with one of the national television networks. Our network affiliation agreements provide
a local station certain exclusive rights and an obligation, subject to certain limited preemption rights, to carry the network
programming. While the networks retain most of the advertising time within their programs for their own use, the local station
also has the right to sell a limited amount of advertising time within the network programs. Other time periods, which are not
programmed by the networks, are programmed by the local station, for which the local station retains substantially all of the
advertising revenues. Networks also share certain of their programming with cable networks and make certain of their
programming available through their website or on websites such as hulu.com, Netflix and Amazon Prime. These outlets
compete with us for viewers in the communities served by our stations.
The programming strength of a particular national television network may affect a local station's competitive position.
Our stations, however, are diversified among the various networks, reducing the potential impact of any one network's
performance. We believe that national television network affiliations remain an efficient means of obtaining competitive
programming, both for established stations with strong local news franchises and for newer stations with greater programming
needs. Our affiliation agreements have terms with scheduled expiration dates ranging through September 17, 2020. These
agreements are subject to earlier termination by the networks under specified circumstances, including a change of control
of our Company, which would generally result from the acquisition of shares having 50% or more of the voting power of our
Company.
13
We acquire the rights to programs for time periods in which we do not air our local news or network programs. These
programs generally include first-run syndicated programs, such as "Jeopardy", "Entertainment Tonight" or "Wheel of Fortune",
or reruns of current or former network programs, such as "Criminal Minds" or "How I Met Your Mother". We pay cash for
these programs or exchange advertising time within the program for the cost of the program rights. We compete with other
local television stations to acquire these programs. In addition, a television viewer can now choose to watch many of these
programs on national cable networks or purchase these programs on DVDs or via downloads to computers, mobile video
devices or web-based video players, which increases fragmentation of our local television audience.
Distribution of Programming
The programming that airs on our television stations can reach the television audience by one or more of the following
distribution systems:
marketing agreements ("LMAs"), joint sales agreements ("JSAs"), shared services arrangements ("SSAs") or
Full-power television stations
We own, operate or service 40 full-power television stations that operate on over-the-air channels 7 through 50. Our
full-power television stations include two full-power stations for which we provide programming, sales and other related
services under grandfathered LMAs, six full-power stations and two digital channels for which we provide technical,
engineering, promotional, administrative and other operational support services under SSAs (for four of these stations and
the two digital channels we also provide advertising sales services under a JSA). See "Our television stations" for a listing of
our full-power television stations.
The FCC television licenses for the two full-power television stations for which we provide programming, sales and
other related services under LMAs are not owned by us. Revenues generated by these stations contributed 4% to our net
revenues for the year ended December 31, 2013. We incur programming costs, operating costs and capital expenditures related
to the operation of these stations, and retain all advertising revenues. In Providence and Austin, the two local markets where
these stations are located, we own and operate at least one other station. These LMA stations are an important part of our
multi-channel strategy. We have purchase options to acquire the FCC licenses for the LMA stations in Providence and Austin,
which are exercisable if the legal requirements limiting ownership of these stations change.
The FCC television licenses for the six full-power television stations for which we provide technical, engineering,
promotional, administrative and other operational support services under SSAs and other arrangements are also not owned
by us. Revenues generated by these stations contributed 3% to our net revenues for the year ended December 31, 2013. In
each of the five markets where these stations are located, we own and operate at least one other station. These SSA stations
are also an important part of our multi-channel strategy. We have purchase options to acquire the FCC licenses for the SSA
stations in Albuquerque, Dayton, Savannah, Youngstown, and Topeka, which are exercisable if the legal requirements limiting
ownership of these stations change.
According to Nielsen, cable, satellite television and telecommunications companies currently provide video program
services to approximately 90% of total U.S. television households, with cable and telecommunications companies serving
59% of U.S. households and direct broadcast satellite ("DBS") providers serving 30%. As a result, cable, satellite television
and telecommunications companies are not only primary competitors, but the primary means by which our television audience
views our television stations. Most of our stations are distributed pursuant to retransmission consent agreements with MVPDs
that operate in markets we serve. As of December 31, 2013, we had retransmission consent agreements with 159 distributors,
including 154 Multiple System Operators ("MSOs") and regional telecommunications companies, the two major satellite
television providers, and two national telecommunications providers. For an overview of FCC regulations governing carriage
14
of television broadcast signals by MVPDs, see "Federal Regulation of Television Broadcastingof Local Television Signals."
We operate television station websites in 23 U.S. markets and offer a growing portfolio of Internet-based products and
services that provide traditional and new audiences around-the-clock access to our trusted local news and information. We
launched our mobile business in 2009 with iPhone and BlackBerry smartphone applications and we have since launched
Android and iPad applications. In addition, we launched SMS/text messaging, video blogging and other advanced interactive
features that further extend the distribution of our content.
Low-power television stations
We own and operate a number of low-power television stations. We operate these stations either as stand-alone or
satellite stations. These low-power broadcast television stations are licensed by the FCC to provide service to substantially
smaller areas than those of full-power stations.
In ten of our markets, Albuquerque, Austin, Grand Rapids, Green Bay, Indianapolis, Springfield, Norfolk-PortsmouthNewport News, Portland, Wichita and Topeka, we use our low power stations to extend the geographic reach of our primary
stations in these markets. In Grand Rapids, we affiliated WXSP-CD, a group of low-power television stations, with
MyNetworkTV, to cover substantially all of the local market. In Topeka and Youngstown, we have also affiliated the low
power stations, KTMJ-CD and WYFX-LD, with the FOX network.
Seasonality of Our Business
Our advertising revenues are generally highest in the second and fourth quarters of each calendar year, due to higher
advertising in the Spring season and in the period leading up to and including the end-of-year holiday season. Our operating
results are also significantly affected by annual cycles, as advertising revenues are generally higher in even-numbered years
due to additional revenues associated with political advertising related to local and national elections, and incremental
advertising revenues associated with Olympic broadcasts.
Our industry is cyclical in nature and affected by prevailing economic conditions. Since we rely on sales of advertising
for a substantial majority of our revenues, our operating results are sensitive to general economic and regional conditions in
each local market where we operate.
Competitive Conditions in the Television Industry
The television broadcast industry has become highly competitive as a result of new technologies and new program
distribution systems. In most of our local markets, we compete directly against other local broadcast stations and cable networks
carried on cable, satellite television and telecommunication systems for audience. We also compete with online video services,
including local news websites and websites such as hulu.com, Netflix and Amazon Prime, which provide access to some of
the same programming, including network programming that we provide, and other emerging technologies. Many of our
current and potential competitors have greater financing, marketing, programming and broadcasting resources than we do.
Technological innovation and the resulting proliferation of television entertainment alternatives, such as cable, satellite
television and telecommunications video services, Internet, wireless, pay-per-view and video-on-demand, digital video
recorders, DVDs and mobile video devices have fragmented television viewing audiences and have subjected free over-theair television broadcast stations to new types of competition. As a result, we are experiencing increased competition for
viewing audience and advertisers.
Federal Regulation of Television Broadcasting
Overview of Regulatory Issues. Our television operations are subject to the jurisdiction of the FCC under the
Communications Act of 1934, as amended (the "Communications Act"). The Communications Act prohibits the operation of
broadcast stations except pursuant to licenses issued by the FCC and empowers the FCC, among other things, to issue, renew,
and, in especially egregious cases, license revocation or denial of license renewals for violations of its regulations.
The Communications Act prohibits the assignment of a broadcast license or the transfer of control of a licensee without
the FCC's prior approval. The FCC also regulates certain aspects of the operation of cable television systems, DBS systems
and other electronic media that compete with broadcast stations. In addition, the FCC regulates matters such as television
15
station ownership, affiliate relations with the networks, cable and DBS systems' carriage of television station signals, carriage
of syndicated and network programming on distant stations, political advertising practices, children's programming and
obscene and indecent programming.
Pursuant to the Communications Act, the FCC bears responsibility for the allocation and licensing
of all non-federal government spectrum. Subject to certain procedural, congressional, and judicial constraints, the FCC has
the ability to reallocate entire spectrum bands to a new use or to modify individual licenses to a new use. An FCC license
the federal government. As a part of its National Broadband Plan, the FCC requested additional authority from Congress to
hold incentive spectrum auctions, whereby current users of particular bands or licenses would receive compensation for
voluntarily relinquishing some or all rights to spectrum they are licensed to use. On February 17, 2012, Congress approved
legislation authorizing the FCC to conduct voluntary incentive spectrum auctions. The legislation, which the President
subsequently signed into law, includes some safeguards for broadcasters. In particular, the legislation requires the FCC to
make all reasonable efforts to ensure that stations retain their existing coverage areas, prevents the FCC from forcing a
broadcaster to move from a UHF to a VHF channel, and establishes a fund to reimburse broadcasters for reasonable relocation
expenses relating to the spectrum repacking. On October 2, 2012, the FCC released a Notice of Proposed Rule Making to
implement the incentive auction statute. That proceeding remains pending. The FCC Chairman has indicated that he anticipates
that the FCC will adopt rules for the incentive auction in the first half of 2014 and that he believes that the FCC will conduct
the incentive auction by the middle of 2015. We cannot predict the precise timing or scope of the incentive spectrum auctions,
nor the impact, if any, that the reallocation of spectrum will have on our business.
License Renewals. Under the Communications Act, the FCC generally may grant and renew broadcast licenses for
terms of eight years, although licenses may be renewed for a shorter period under certain circumstances. The Communications
Act requires the FCC to renew a broadcast license if the FCC finds that (i) the station has served the public interest, convenience
king
its determination, the FCC may consider petitions to deny but cannot consider whether the public interest would be better
served by issuing the license to a person other than the renewal applicant. We are in good standing with respect to each of
our FCC licenses. The table on pages 7 and 8 includes the expiration date of the primary broadcasting licenses for the stations
that we own, as well as for the stations to which we provide services. As indicated in the table, the licenses for these stations
have expiration dates ranging between 2007 and 2022. License renewal applications were timely filed for each of the stations
for which the license is now expired. Once an application for renewal is filed, each station remains licensed while its application
is pending, even after its license expiration date has passed. Action on many license renewal applications may have been
delayed for reasons, such as, the pendency of complaints that programming provided by the various networks contained
indecent material and complaints regarding alleged violations of sponsorship identification rules. We cannot predict when
the FCC will act on pending renewal applications. We expect the FCC to renew each of these licenses but we make no assurance
that it will do so.
Ownership Regulation. The Communications Act and FCC rules limit the ability of individuals and entities to have
ownership or other attributable interests in certain combinations of broadcast stations and other media. The Communications
Act also requires the FCC to review its broadcast ownership rules every four years to determine whether they remain necessary
in the public interest. In 1999, the FCC modified its local television ownership rules. In 2003, the FCC issued an order that
would have liberalized most of the ownership rules, permitting us to acquire television stations in certain markets where we
are currently prohibited from acquiring additional stations. In 2004, the Third Circuit Court of Appeals stayed and remanded
several of the FCC's 2003 ownership rule changes. In 2006, as part of the FCC's statutorily required quadrennial review of
its media ownership rules, the FCC sought comment on how to address the issues raised by the Third Circuit Court of Appeals'
decision. In 2008, the FCC released an order that re-adopted its 1999 local television ownership rules, and those rules are
currently in effect. Several parties appealed the FCC's 2008 decision, and in 2011, the United States Court of Appeals for the
Third Circuit mostly denied those petitions. In 2011, the FCC issued its Notice of Proposed Rulemaking as part of its 2010
Quadrennial Review of the media ownership rules (the “2010 Quadrennial Review NPRM”). The 2010 Quadrennial Review
NPRM indicates that the FCC intends to maintain the current local television ownership rules with only minor modifications.
Despite the pending status of the 2010 Quadrennial Review, the FCC under the Communications Act, must commence a new
quadrennial review proceeding in 2014. We cannot predict the effect that the commencement of the 2014 Quadrennial Review
proceeding might have on the pending 2010 Quadrennial Review, nor can we predict whether either review proceeding may
ultimately result in changes to the FCC’s broadcast ownership rules. The FCC's current ownership rules that are material to
our operations are summarized below.
16
Local Television Ownership. Under the FCC's current local television ownership (or "duopoly") rule, a party may
own multiple television stations without regard to signal contour overlap provided they are located in separate Nielsen DMAs.
In addition, the rules permit parties to own up to two TV stations in the same DMA so long as (i) at least one of the two stations
is not among the top four-ranked stations in the market based on audience share at the time an application for approval of the
acquisition is filed with the FCC, and (ii) at least eight independently owned and operating full-power commercial and noncommercial television stations would remain in the market after the acquisition. In addition, without regard to the number of
remaining or independently owned television stations, the FCC currently permits television duopolies within the same DMA
so long as the commonly owned stations' signal contours do not overlap, although the FCC proposed to remove this exception
in the 2010 Quadrennial Review NPRM. Stations designated by the FCC as "satellite" stations are exempt from the local
television ownership rule. Also, the FCC may grant a waiver of the local television ownership rule if one of the two television
stations is a "failed" or "failing" station or if the proposed transaction would result in the construction of a new television
station (an unbuilt-station waiver). We believe that we are currently in compliance with the local television ownership rule.
The FCC's 1999 ownership order established a rule attributing LMAs for ownership purposes. The FCC grandfathered
LMAs that were entered into prior to November 5, 1996, permitting those stations to continue operations pursuant to such
LMAs. The FCC, which retains the authority to review the status of grandfathered LMAs, stated it would conduct a case-bycase review of grandfathered LMAs and assess the appropriateness of extending the grandfathering periods. We do not know
when, or if, the FCC will conduct any such review of grandfathered LMAs. Grandfathered LMAs can be freely transferred
during the grandfather period, but duopolies may be transferred only where the two-station combination continues to qualify
under the duopoly rule. We currently have grandfathered LMAs pursuant to which we provide programming to stations in
Providence, Rhode Island and Austin, Texas.
From 2010 through 2012, we entered into SSAs and certain other arrangements for stations in Dayton, Ohio,
Albuquerque, New Mexico, Savannah, Georgia, Topeka, Kansas, and Youngstown, Ohio. SSAs are currently permitted under
the FCC's local television ownership rule and allow for technical, engineering, promotional, administrative and other
operational support services. SSAs are different from LMAs in various respects, for example, only a limited amount of
programming is permitted under an SSA. JSAs further permit us to sell advertising time on these stations. The FCC included
in the 2010 Quadrennial Review NPRM a review of SSAs, JSAs and similar arrangements and seeks comment whether they
should be attributable for purposes of the media ownership rules. If the FCC decides these arrangements are attributable, we
may be required to restructure operations in these markets. We cannot predict whether the pending 2010 Quadrennial Review
proceeding or the upcoming 2014 Quadrennial Review proceeding may ultimately result in changes to the FCC's rules regarding
SSAs or JSAs.
National Television Ownership Cap. The Communications Act, as amended in 2004, limits the number of television
stations one entity may own nationally. Under the rule, no entity may have an attributable interest in television stations that
reach, in the aggregate, more than 39% of all U.S. television households. The FCC currently discounts the audience reach of
a station operating on an ultra-high frequency (“UHF”) channel by 50% when computing the national television ownership
cap (the “UHF Discount”). Our stations reach is approximately 10.5% of U.S. households.
On September 26, 2013, the FCC issued a Notice of Proposed Rule Making (“UHF Discount NPRM”) proposing to
eliminate the UHF Discount while grandfathering those existing station combinations that would exceed the 39% national
ownership cap solely as a result of the elimination of the UHF Discount. The FCC also proposed, as of the date of the UHF
Discount NPRM, to grandfather pending transactions that proposed station combinations that would exceed the 39% national
ownership cap following the elimination of the UHF Discount. Further, and in recognition of the technical difficulties that
certain television stations assigned to very-high frequency (“VHF”) channels encountered following the DTV transition, the
FCC has also proposed to replace the UHF Discount with a similarly structured discounting of VHF television stations under
which such stations would receive a discount of 50% of their audience reach for purposes of calculating compliance with the
national ownership cap. We cannot predict whether the pending UHF Discount NPRM may ultimately result in changes to
the FCC's national television ownership rule.
Under the FCC's attribution policies, the following relationships and interests generally are
attributable for purposes of the FCC's broadcast ownership restrictions:
17
holder supplies more than 15% of the station's total weekly programming, or is a same-market broadcast
company, cable operator or newspaper (the "equity/debt plus" standard).
Under the single majority shareholder exception to the FCC's attribution policies, otherwise attributable interests under
50% are not attributable if a corporate licensee is controlled by a single majority shareholder and the minority interest holder
is not otherwise attributable under the "equity/debt plus" standard.
Because of these multiple ownership and cross-ownership rules, any person or entity that acquires an attributable interest
in us may violate the FCC's rules if that purchaser also has an attributable interest in other television or radio stations, or in
daily newspapers, depending on the number and location of those radio or television stations or daily newspapers. Such person
or entity also may be restricted in the companies in which it may invest to the extent that those investments give rise to an
attributable interest. If the holder of an attributable interest violates any of these ownership rules or if a proposed acquisition
by us would cause such a violation, we may be unable to obtain from the FCC one or more authorizations needed to conduct
our television station business and may be unable to obtain the FCC's consents for certain future acquisitions.
Foreign Ownership. Under the Communications Act, foreign interests (defined to include foreign governments,
representatives of foreign governments, aliens, representatives of aliens, and corporations or partnerships organized under
the laws of a foreign nation) are prohibited from directly holding broadcast licenses. In addition, the Communications Act
limits the aggregate investment of foreign interests in broadcast license holders and their corporate parents. Foreign interests
may not own or vote more than 20% of the capital stock of a broadcast license holder or own or vote more than 25% of the
capital stock of an entity that directly or indirectly controls a broadcast license holder (a “broadcast holding company”).
Although the 20% limit may not be waived, the Communications Act permits the FCC to authorize aggregate foreign investment
in a broadcast holding company to exceed the 25% threshold if the increased foreign ownership would be consistent with the
public interest. On November 14, 2013, the FCC issued a declaratory ruling clarifying its foreign ownership policy by
implementing a procedural framework to enable broadcasters to seek the FCC’s permission to exceed the 25% aggregate
foreign ownership threshold. The 2013 declaratory ruling did not, however, establish specific criteria under which the FCC
will review such requests. Although the declaratory ruling could permit us to seek FCC approval to issue shares to foreign
interests in excess of 25% of our total outstanding shares, our LLC agreement does not currently permit us to issue shares to
foreign interests in excess of 25%.
Digital Television. We terminated all analog broadcasts on our full power stations on or before June 12, 2009 in
connection with the national transition to digital television. Following the transition, each of our full power stations broadcasts
a 19.4 megabit-per-second (Mbps) data stream, rather than a single analog program stream. FCC regulations permit substantial
flexibility in how we use that data stream. For example, we are permitted to provide a mix of high definition and standard
television program streams free-to-air, additional program-related data, subscription video or audio streams, and non-broadcast
services. A new technical standard permits digital stations to provide video and data streams that can be more readily received
on mobile devices (such as computers and smartphones), if those devices incorporate the technology. These digital channels
remain subject to specific FCC regulations. For example, we are required to carry additional children's educational
programming if we transmit multiple program streams, and we must pay the U.S. Treasury 5% of gross revenues for any nonbroadcast services we provide using our digital signals. The FCC is evaluating whether to impose further public interest
programming requirements on digital channels. The FCC's digital transition implementation plan maintained the secondary
status of low-power television ("LPTV") stations but did not set a deadline for such stations to convert to digital operations.
In 2011, the FCC set a firm deadline, and by September 1, 2015 LPTV stations must cease analog broadcasts and convert to
digital operations.
Pursuant to FCC rules, full power television stations can
obtain carriage of their primary channel signals by multi-channel video program distributors in one of two ways: via mandatory
carriage or via "retransmission consent." Once every three years each station must formally elect either mandatory carriage
("must-carry") or retransmission consent. The current elections were effective January 1, 2012 and extend through
December 31, 2014. A mandatory carriage election invokes FCC rules that require the distributor to carry a single program
stream designated by the station and that program stream's related data in the station's local market. Distributors may decline
carriage for certain reasons specified in the rules, including a lack of channel capacity, the station's failure to deliver a good
quality signal, the presence of a nearby affiliate of the same network or, in the case of satellite distributors, if the distributor
does not carry any other local broadcast station in the electing station's market. Distributors do not pay a fee to stations that
elect mandatory carriage.
A station that elects retransmission consent waives its mandatory carriage rights, and the station and the distributor must
negotiate in good faith for carriage of the station's signal. Negotiated terms may include channel position, service tier carriage,
18
carriage of multiple program streams, compensation and other consideration. If a station elects to negotiate retransmission
terms, it is possible that the station and the distributor will not reach agreement and that the distributor will not carry the
station's signal.
FCC rules govern which local television signals a satellite subscriber may receive. Congress has also imposed certain
requirements relating to satellite distribution of local television signals to "unserved" households that do not receive a usable
signal from a local station or that reside in a market without a local affiliate of the pertinent network. The Satellite Television
Extension and Localism Act of 2010 ("STELA") updated the blanket license scheme previously enacted under the Satellite
Home Viewer Extension and Reauthorization Act of 2004 ("SHVERA") by, among other things, extending for five years,
until December 31, 2014, statutory licenses that allow satellite television companies to retransmit broadcast signals from
distant markets to eligible customers. A satellite provider also is permitted to import the signal of an out-of-market station,
with that station's consent, to the specific counties and communities within a local market in which the out-of-market station
is deemed to be "significantly viewed," subject to certain conditions. Such carriage previously was governed by the distant
signal provisions. Under STELA, it is now treated as a retransmission into the station's local market, which means that the
statutory copyright for such carriage will not sunset at the end of 2014. STELA also eliminated the requirement that DBS
operators carry the local affiliate of a particular network before they could import an out-of-market station deemed to be
significantly viewed in a given county or community. At this time, we are monitoring developments in this area but cannot
determine whether this new legislation will result in significant changes to the satellite distribution scheme or whether or how
any of the other changes in STELA will impact our broadcast business.
Several cable system and DBS operators have jointly petitioned the FCC to initiate a rulemaking proceeding to consider
amending its retransmission consent rules. The FCC solicited public comment on the petition and subsequently released a
notice of proposed rule making in 2011 seeking public comment on whether it should amend its rules to (i) modify its standards
(iii) eliminate the FCC's network non-duplication and syndicated exclusivity rules. The proceeding is currently pending, and
we cannot predict its outcome.
On January 10, 2014, the Supreme Court agreed to hear a case captioned
al. v. Aereo, which involves a challenge by several broadcasters of the Aereo service, which transmits its subscribers’ broadcast
television programs over the Internet for a monthly subscription fee. At issue is whether Aereo’s service violates copyright
law and whether Aereo must obtain permission to retransmit broadcasters’ programming. Should Aereo and its competitors
prevail in the pending litigation, and certain online video distributors and over-the-top video distributors become eligible for
a statutory license that would enable them to stream broadcast programming over the Internet, it could have a negative impact
on our retransmission consent negotiations with MVPDs, and our business and results of operations could be materially and
adversely affected. We cannot predict the ultimate outcome of this proceeding.
The Communications Act requires broadcasters to serve the public interest.
Broadcast station licensees are required to present programming that is responsive to community problems, needs and interests
and to maintain records demonstrating such responsiveness. Stations must follow various rules that regulate, among other
things, children's television programming and advertising, political advertising, sponsorship identification, closed captioning,
and contest and lottery advertising. The FCC has also adopted requirements to require stations affiliated with certain networks
and serving the nation's largest television markets to provide aural descriptions of video content for the benefit of visually
impaired viewers. The FCC has proposed to re-establish a number of formalized procedures that it believes will improve
television broadcasters' service to their local communities. These proposals include the establishment of community advisory
boards, quantitative programming guidelines and maintenance of a main studio in a station's community of license. If the
FCC adopts such proposals, the burden of complying with such requirements could impose additional costs on our stations.
The FCC is also charged with enforcing restrictions or prohibitions on the broadcast of obscene and indecent programs.
In 2007, Congress increased the maximum monetary penalty for carriage of indecent programming tenfold to $325,000 per
station per violation with a cap of $3 million for any "single act," and put the licenses of repeat offenders in jeopardy. At
approximately the same time, the FCC increased its broadcast indecency enforcement activity and issued large fines against
radio and television stations found to have carried indecent programming (even if originated by a third-party program supplier,
such as a network). In 2010, the U.S. Court of Appeals for the Second Circuit found that the FCC's enforcement policy for
broadcast indecency was unconstitutionally vague. The FCC successfully petitioned the United States Supreme Court to grant
certiorari, and, on June 21, 2012, the Supreme Court set aside the specific FCC decisions at issue, finding that a lack of notice
of a change to the FCC's enforcement of its broadcast indecency rules violated the broadcasters' due process rights. The
Supreme Court did not reach the broadcasters' First Amendment challenge of the FCC's broadcast indecency regime. On
April 1, 2013, the FCC’s Office of General Counsel and its Enforcement Bureau released a joint public notice in which they
announced an interim policy directive to reduce the backlog of pending broadcast indecency complaints by focusing
19
enforcement resources in egregious cases. The April 2013 public notice also sought public comment on whether the full
Commission should alter or retain its existing broadcast indecency policies. The FCC has not taken further action related to
the comments received in response to its April 1, 2013 public notice. In light of the Supreme Court’s decision not to address
broadcasters’ First Amendment challenges of the FCC’s broadcast indecency policies, the FCC’s announcement of an interim
“egregious case” policy, and the FCC’s request for public comment on the future of broadcast indecency regulation, we are
unable to predict the extent to which future enforcement of the FCC's broadcast indecency rules may have a material adverse
effect on our ability to provide competitive programming.
Congress and the FCC currently have under
consideration, and may in the future adopt, new laws, regulations and policies regarding a wide variety of matters that could
affect, directly or indirectly, the operation and ownership of our stations. The foregoing discussion summarizes the federal
statutes and regulations material to our operations, but does not purport to be a complete summary of all the provisions of the
Communications Act or of other current or proposed statutes, regulations, and policies affecting our business. The summaries
should be read in conjunction with the text of the statutes, rules, regulations, orders, and decisions described herein. We are
unable at this time to predict the outcome of any of the pending FCC rule-making proceedings referenced above, the outcome
of any reconsideration or appellate proceedings concerning any changes in FCC rules or policies noted above, the possible
outcome of any proposed or pending Congressional legislation, or the impact of any of those changes on our stations.
Employees
As of December 31, 2013, we employed 2,786 full time employees, 331 of which were represented by labor unions.
We believe that our relations with our employees are satisfactory.
Available Information
We file annual, quarterly, and current reports, proxy statements, and other documents with the Securities and Exchange
Commission ("SEC") under the Exchange Act. The public may read and copy any materials that we file with the SEC at the
SEC's Public Reference Room at 100 F Street, NE, Washington, DC 20549. The public may obtain information on the operation
of the Public Reference Room by calling the SEC at 1-800-SEC-0330. Also, the SEC maintains an Internet website that
contains reports, proxy and information statements, and other information regarding issuers, including our filings, which we
file electronically with the SEC. The public can obtain any documents that we file with the SEC at http://www.sec.gov.
We make available free-of-charge through our Internet website (at http://www.linmedia.com) copies of our Annual
Report on Form 10-K, Quarterly Reports on Form 10-Q, Current Reports on Form 8-K, and, if applicable, amendments to
those reports filed or furnished pursuant to Section 13(a) of the Exchange Act as soon as reasonably practicable after we
electronically file such material with, or furnish such material to, the SEC. We will also provide a physical copy of our Annual
Report on Form 10-K free of charge upon the written request of any shareholder.
We also make available on our website our corporate governance guidelines, the charters for our audit committee,
compensation committee, and nominating and corporate governance committee, our code of business conduct and ethics, and
our code of ethics for senior financial officers. This information is available on our website to any stockholder who is interested
in reviewing this information. In addition, we intend to disclose on our website any amendments to, or waivers from, our code
of business conduct and ethics that are required to be publicly disclosed pursuant to rules of the SEC and the NYSE.
20
Item 1A.
Risk Factors
Risks Associated with Our Business Activities
Our operating results are primarily dependent on advertising revenues, which can vary substantially from period-to-period
based on many factors beyond our control, including economic downturns and viewer preferences.
Our operations and performance are dependent on advertising revenues, which can be materially affected by a number
of factors beyond our control, including economic conditions and viewer preferences. Volatility in advertising revenue impacts
our financial condition, cash flows and results of operations. Decreases in advertising revenues caused by economic conditions
could have a material adverse effect on our financial condition, cash flows and results of operations, which could impair our
ability to comply with the covenants in our debt instruments, as more fully described below.
In addition to economic conditions, our ability to generate advertising revenues depends on factors such as:
Our programming may not attract sufficient targeted viewership or we may not achieve favorable ratings. Our ratings
depend partly upon unpredictable and volatile factors beyond our control, such as viewer preferences, competing programming
and the availability of other entertainment activities. A shift in viewer preferences could cause our programming not to gain
popularity or to decline in popularity, which could cause our advertising revenues to decline. We, and those on whom we rely
for programming, may not be able to anticipate and react effectively to shifts in viewer tastes and interests of our local markets.
In addition, political advertising revenue from elections and advertising revenues from Olympic Games, which generally
occur in even-numbered years, create large fluctuations in our operating results on a year-to-year basis. For example, during
2012, we had net political advertising revenues of $76.5 million, compared to $7.6 million in 2013.
We depend on automotive advertising to a significant degree.
Approximately 26%, 26% and 24% of our local and national advertising revenues for the years ended December 31,
2013, 2012 and 2011, respectively, consisted of automotive advertising. A significant decrease in these revenues in the future
could have a material adverse effect on our results of operations and cash flows, which could affect our ability to fund operations
and service our debt obligations and affect the value of our common shares.
We have a substantial amount of debt, which could adversely affect our financial condition, liquidity and results of
operations, reduce our operating flexibility and put us at greater risk for default and acceleration of our debt.
As of December 31, 2013, we had approximately $932.2 million of consolidated net debt, which is equal to the difference
between total debt and unrestricted cash, and $89.1 million of total LIN LLC shareholders' equity. The outstanding revolving
credit loans and term loans under our senior secured credit facility, which were $30 million and $118.4 million, respectively,
as of March 3, 2014, and are due October 26, 2017 and the outstanding incremental term loans under our senior secured credit
facility were $312.5 million as of March 3, 2014 and are due on December 21, 2018. The outstanding Senior Notes (as defined
in "Description of Indebtedness"), which were $200 million and $290 million as of March 3, 2014 are due on April 15, 2018
and January 15, 2021, respectively. Subject to the limitations in our senior secured credit facility and the indentures governing
our Senior Notes, we may incur additional material indebtedness in the future, and we may become more leveraged.
Accordingly, we now have and will continue to have significant debt service obligations. Our large amount of indebtedness
could, for example:
indebtedness and reduce the availability of our cash flow to fund working capital, capital expenditures,
and place us at a disadvantage relative to our less leveraged competitors.
21
The indentures governing our Senior Notes also contain change of control provisions which may require us to purchase
all or a portion of our Senior Notes at a price equal to 101% of the principal amount of the notes, together with accrued and
unpaid interest.
Any of these consequences relating to such debt could have a material adverse effect on our business, liquidity and
results of operations.
We could fail to comply with our financial covenants, which would adversely affect our financial condition.
Our debt instruments require us to comply with financial covenants, including, among others, leverage ratios. These
covenants restrict the manner in which we conduct our business and may impact our operating results. Weak results of
operations due to reduced advertising revenues may make it harder for us to comply with such covenants. Our failure to
comply with these covenants could result in events of default, which, if not cured or waived, would permit acceleration of
our indebtedness under our debt agreements or under other instruments that contain cross-acceleration or cross-default
provisions.
Our debt instruments also contain certain other restrictions on our business and operations, including, for example,
covenants that restrict our ability to dispose of assets, incur additional indebtedness, pay dividends, make investments, make
acquisitions and engage in mergers or consolidations. These restrictions could affect our ability to implement strategic
initiatives, which could have an adverse effect on our results of operations.
We may not be able to refinance all or a portion of our indebtedness or obtain additional financing on satisfactory terms.
The outstanding revolving credit loans and term loans under our secured credit facility are due October 26, 2017 and
the outstanding incremental term loans under our senior secured credit facility are due December 21, 2018. Our outstanding
Senior Notes are due on April 15, 2018 and January 15, 2021, respectively. If we do not refinance, redeem or discharge our
83/8% Senior Notes on or prior to January 15, 2018, then, in such event, the maturity of the incremental term loan facility will
be accelerated from December 21, 2018 to January 15, 2018. While we expect to refinance, redeem, or discharge all of the
outstanding 83/8% Senior Notes prior to January 15, 2018, we can provide no assurances that this will occur. Our inability to
refinance our 83/8% Senior Notes prior to January 15, 2018, and the resulting acceleration of the incremental term loans would
have a material adverse effect on our business, liquidity and results of operations.
Economic conditions may have an adverse impact on our industry, business, results of operations or financial condition.
Economic conditions have been challenging and the continuation or worsening of such conditions could further reduce
consumer confidence and have an adverse effect on the fundamentals of our business, financial condition, cash flows and
results of operations. Poor economic conditions could have a negative impact on our industry or the industry of those customers
who advertise on our stations, including, among others, the automotive industry, which is a significant source of our advertising
revenue. Additionally, financial institutions, capital providers, or other consumers may be adversely affected. Potential
consequences of any economic decline, among others, include:
We have a material amount of intangible assets and we have recorded substantial impairments of these assets. Future
write-downs of intangible assets would reduce net income or increase net loss, which could have a material adverse effect
on our results of operations and the value of our class A common shares.
Future impairment charges could have a significant adverse effect on our reported results of operations. Approximately
$740 million, or 61% of our total assets as of December 31, 2013 consisted of indefinite-lived intangible assets. Intangible
assets principally include broadcast licenses and goodwill, which are required to be tested for impairment at least annually,
with impairment being measured as the excess of the carrying value of the goodwill or the intangible asset over its fair value.
In addition, goodwill and other intangible assets will be tested more often for impairment as circumstances warrant.
22
During the year ended December 31, 2011, we recorded a $1.6 million impairment charge to a broadcast license recorded
within discontinued operations.
If we determine in a future period, as part of our testing for impairment of intangible assets and goodwill, that the
carrying amount of our intangible assets exceeds the fair value of these assets, we may incur an impairment charge that could
have a material adverse effect on our results of operations and the value of our class A common shares.
Our strategy has historically included growth through acquisitions, which could pose various risks and increase our
leverage.
We have pursued and intend to selectively continue to pursue strategic acquisitions, subject to market conditions, our
liquidity, and the availability of attractive acquisition candidates, with the goal of improving our business. We may not be
successful in identifying attractive acquisition targets nor have the financial capacity to complete future acquisitions.
Acquisitions involve inherent risks, such as increasing leverage, debt service requirements, future performance-based purchase
obligations and combining company cultures and facilities, and we may not be able to successfully expand our digital
operations, which could have a material adverse effect on our operating results, particularly during the period immediately
following any acquisition. We may not be able to successfully implement effective cost controls or increase revenues as a
result of any acquisition. In addition, future acquisitions may result in our assumption of unexpected liabilities and may result
in the diversion of management's attention from the operation of our core business.
Certain acquisitions, such as television stations, are subject to the approval of the FCC and, potentially, other regulatory
authorities. The need for FCC and other regulatory approvals could restrict our ability to consummate future transactions and
potentially require us to divest some television stations if the FCC believes that a proposed acquisition would result in excessive
concentration in a market, even if the proposed combinations may otherwise comply with FCC ownership limitations.
If we are unable to compete effectively, our revenue could decline.
The entertainment industry, and particularly the television industry, is highly competitive and is undergoing a period
of consolidation and significant change. Many of our current and potential competitors have greater financial, marketing,
programming and broadcasting resources than we do. Technological innovation and the resulting proliferation of television
entertainment alternatives, such as cable, satellite television and telecommunications video services, Internet, wireless, payper-view and video-on-demand, digital video recorders, DVDs and mobile video devices have fragmented television viewing
audiences and have subjected free over-the-air television broadcast stations to new types of competition. As a result, we are
experiencing increased competition for viewing audience and advertisers. Significant declines in viewership and advertising
revenues could materially and adversely affect our business, financial condition and results of operations.
New technologies may affect our broadcasting operations.
The television broadcasting business is subject to technological change, evolving industry standards, and the emergence
of new technologies. We cannot predict the effect such technologies will have on our broadcast operations. In addition, the
capital expenditures necessary to implement these new technologies could be substantial and other companies employing
such technologies before we are able to do so could aggressively compete with our business.
The loss of network affiliation agreements or changes in network affiliations could have a material and adverse effect on
our results of operations.
The non-renewal or termination of a network affiliation agreement or a change in network affiliations could have a
material adverse effect on us. Each of the networks generally provides our affiliated stations with up to 22 hours of prime
time programming per week. In return, our stations broadcast network-inserted commercials during that programming. In
some cases, we make cash payments to certain networks.
Some of our network affiliation agreements are subject to early termination by the networks under specified
circumstances, including as a result of a change of control of our Company, which would generally result upon the acquisition
of shares having 50% or more of our voting power. In the event that affiliates of HMC elect to convert our class B common
shares held by them into shares of either class A common shares or class C common shares, such conversion may result in a
change of control of our Company causing an early termination of some or all of our network affiliation agreements. The
majority of the networks with which our stations are affiliated have required us, upon renewal of affiliation agreements, to
make cash payments to the network and to accept other material modifications of existing affiliation agreements. Consequently,
our affiliation agreements may not all remain in place and each network may not continue to provide programming to us on
the same basis as it currently provides programming. If any of our stations cease to maintain affiliation agreements with
23
networks for any reason, we would need to find alternative sources of programming, which may be less attractive and more
expensive.
A change in network affiliation in a given television market may have many short-term and long-term consequences,
depending upon the circumstances surrounding the change. Potential short-term consequences include: (i) increased marketing
costs and increased internal operating costs, which can vary widely depending on the amount of marketing required to educate
r
r
programming, equipment and logos to the new network affiliation. Long-term consequences are more difficult to assess, due
to the cyclical nature of each of the major network's share of the audience that changes from year-to-year with programs
coming to the end of their production cycle, the audience acceptance of new programs in the future and the fact that national
network audience ratings are not necessarily indicative of how a network's programming is accepted in an individual market.
How well a particular network fares in an affiliation switch depends largely on the value of the broadcast license, which is
influenced by the length of time the television station has been broadcasting, the quality and location of the license, the
audience acceptance of the local news programming and community involvement of the local television station and the quality
of the station non-network programming. In addition, the majority of the revenue earned by television stations is attributable
to locally produced news and syndicated programming, rather than advertising sales related to network programming. The
circumstances that may surround a network affiliation switch cause uncertainty as to the actual costs that will be incurred by
us and, if these costs are significant, the switch could have a material adverse impact on the income we derive from the affected
station.
Changes by the national broadcast television networks in their respective business models and practices could adversely
affect our business, financial condition and results of operations.
In recent years, the national broadcast networks have streamed their programming on the Internet and other distribution
platforms in close proximity to network programming broadcast on local television stations, including those we own. These
and other practices by the networks dilute the exclusivity and value of network programming originally broadcast by the local
stations and could adversely affect the business, financial conditions and results of operations of our stations.
We depend on key personnel, and we may not be able to operate and grow our businesses effectively if we lose the services
of our management or are unable to attract and retain qualified personnel in the future.
We depend on the efforts of our management and other key employees. The success of our business depends heavily
on our ability to develop and retain management and to attract and retain qualified personnel in the future. Competition for
senior management personnel is intense and we may not be able to retain our key personnel. If we are unable to do so, our
business, financial condition or results of operations may be adversely affected.
Our defined benefit pension plan obligations are currently underfunded, and we may have to make significant cash
payments to this plan, which would reduce the cash available for our business.
We have unfunded obligations under our defined benefit pension plan. The funded status of the defined benefit pension
plan depends on such factors as asset returns, market interest rates, legislative changes and funding regulations. Our future
required cash contributions and pension costs to the plan could increase if: (i) the returns on the assets of our plan were to
assumptions were to be modified. Any such increases could have a material and adverse effect on our business, financial
condition, results of operations or cash flows. The need to make contributions, which may be substantial, to such plan may
reduce the cash available to meet our other obligations, including our debt obligations with respect to our senior secured credit
facility and our Senior Notes to meet the needs of our business. In addition, the PBGC may terminate our defined benefit
pension plan under limited circumstances, including in the event the PBGC concludes that the risk may increase unreasonably
if such plan continues. In the event a defined benefit pension plan is terminated for any reason while it is underfunded, we
could be required to make an immediate payment to the PBGC of all or a substantial portion of such plan's underfunding, as
calculated by the PBGC based on its own assumptions (which might result in a larger obligation than that based on the
assumptions we have used to fund such plan).
24
Risks Related to Our Governance and Capital Structure
HMC and its affiliates, whose interests may differ from the interests of the holders of our Class A common shares, have
approval rights with respect to significant transactions and could convert their equity interests in our Company into a
block of substantial voting power, thereby reducing the voting power of other holders of our common shares.
HMC and its affiliates own one share of our class C common shares, which represents 35% of our outstanding voting
power, and also have the ability to convert shares of our non-voting class B common shares into class A common shares,
which may be subject to FCC approval. Upon the conversion of the majority of the non-voting class B common shares into
class A common shares, the class C common shares will automatically convert into an equal number of shares of class A
common shares. If this occurs, affiliates of HMC would own approximately 37.7% of our voting equity interests and will
effectively have the ability to elect the entire board of directors and to approve or disapprove any corporate transaction or
other matters submitted to our shareholders for approval, including the approval of mergers or other significant corporate
transactions. The interests of HMC and its affiliates may differ from the interests of our other shareholders and HMC and its
affiliates could take actions or make decisions that are not in the best interests of our other shareholders.
For example, HMC may from time-to-time acquire and hold controlling or non-controlling interests in television
broadcast assets that may directly or indirectly compete with our company for advertising revenues. In addition, HMC and
its affiliates may from time-to-time identify, pursue and consummate acquisitions of television stations or other broadcast
related businesses that may be complementary to our business and therefore such acquisition opportunities may not be available
to us.
Moreover, Royal W. Carson, III, a director, and HMC, combined beneficially own all of our class C common shares
and therefore possess 70% of the combined voting power. Accordingly, Mr. Carson and HMC together have the power to
elect our entire board of directors and, through this control, to approve or disapprove any corporate transaction or other matter
submitted to our shareholders for approval, including the approval of mergers or other significant corporate transactions.
Mr. Carson has prior business relations with HMC. Mr. Carson is the President of Carson Private Capital Incorporated, an
investment firm that sponsors funds-of-funds and dedicated funds that have invested substantially all of the net capital of
these funds in private equity investment funds sponsored by firms like HMC or its affiliates. Mr. Carson also serves on an
advisory board representing the interests of limited partners of Sector Performance Fund, L.P., which was sponsored by an
affiliate of HMC. The fund does not have an investment in us.
It would be difficult to take us over, which could adversely affect the trading price of our class A common shares.
Affiliates of HMC effectively have the ability to determine whether a change of control will occur through their ownership
of one of the two outstanding shares of our class C common shares and all of the shares of our class B common shares.
Provisions of Delaware corporate law and our bylaws and certificate of incorporation, including the 70% voting power of our
class C common shares held by affiliates of Mr. Carson and HMC and the voting power that affiliates of HMC would hold
upon conversion of their shares of class B shares into class A shares or class C shares, make it difficult for a third party to
acquire control of us, even if a change of control would benefit the holders of our class A common shares. These provisions
and controlling ownership by affiliates of HMC could also adversely affect the public trading price of our class A common
shares.
We may issue additional debt and equity securities which are senior to our common shares as to distributions and in
liquidation, which could materially adversely affect the market price of our class A common shares.
In the future, we may attempt to increase our capital resources by entering into additional debt or debt-like financings
that are secured by all or up to all of our assets, or issuing debt or equity securities, which could include issuances of secured
liquidity notes, medium-term notes, senior notes, subordinated notes or shares. In the event of our liquidation, our lenders
and holders of our debt securities would receive a distribution of our available assets before distributions to holders of our
common shares. Any preferred securities may have a preference with respect to distributions and upon liquidation. Because
our decision to incur debt and issue securities in our future offerings will depend on market conditions and other factors
beyond our control, we cannot predict or estimate the amount, timing or nature of our future offerings and debt financing.
Further, market conditions could require us to accept less favorable terms for the issuance of our securities in the future.
Accordingly, holders of our Class A common shares will bear the risk of our future offerings reducing the value of our common
shares and diluting their interest in us. In addition, we can change our leverage strategy from time to time without approval
of holders of our common shares, which could adversely affect the market price of our class A common shares.
25
The board of directors of LIN LLC will have the authority to adopt amendments to the Amended and Restated Limited
Liability Company Agreement (the "LLC Agreement") that change many of the terms of the LIN LLC common shares in
ways with which the holders of our Class A common shares may disagree without approval of holders of our common
shares.
Owners of our common shares may disagree with amendments to the LLC Agreement adopted by the board of directors
of LIN LLC that change the terms of such shares, and may disagree with the decision made by the LIN LLC board of directors
that the changes made to the terms of our common shares are not adverse to holders of our common shares or that such changes
do not alter the characterization of LIN LLC. The recourse of holders of our common shares, if they disagree, will be limited
because the LLC Agreement gives broad authority and discretion to the board of directors of LIN LLC to adopt certain
amendments to the LLC Agreement without the consent of shareholders of LIN LLC.
While we do not currently anticipate making regular cash distributions to holders of our common shares, the board of
directors of LIN LLC has full authority and discretion over any distributions and it may decide to change or eliminate
distributions at any time, which may adversely affect the market price for our shares.
We do not currently anticipate making regular cash distributions to holders of LIN LLC common shares. However, our
board of directors will have full authority and discretion to determine whether or not a distribution by LIN LLC should be
declared and paid to holders of our common shares, as well as the amount and timing of any distribution. Our board of directors
may, based on its review of our financial condition, liquidity and results of operations, determine to change or eliminate
distributions, which, if distributions are then being paid to holders of our common shares, may have a material adverse effect
on the market price of our common shares. In addition, in computing U.S. federal income tax liability for a taxable year, each
holder of our common shares will be required to take into account its allocable share of items of our income, gain, loss,
deduction and credit for the taxable year of LIN LLC ending within or with such holder's taxable year, regardless of whether
such holder has received any distributions. As a result, it is possible that a holder's U.S. federal income tax liability with
respect to its allocable share of the earnings of LIN LLC in a particular taxable year could exceed the cash distributions to it,
thus requiring an out-of-pocket tax payment by such holder.
Tax Risks to Holders of LIN LLC Common Shares
Our structure involves complex provisions of U.S. federal income tax law for which no clear precedent or authority may
be available. Our structure also is subject to potential legislative, judicial or administrative change and differing
interpretations, possibly on a retroactive basis.
The U.S. federal income tax treatment of holders depends in some instances on determinations of fact and interpretations
of complex provisions of U.S. federal income tax law for which no clear precedent or authority may be available. Holders of
our common shares should be aware that the U.S. federal income tax rules are constantly under review by persons involved
in the legislative process, the IRS and the U.S. Treasury Department, frequently resulting in revised interpretations of
established concepts, statutory changes, revisions to regulations and other modifications and interpretations. The IRS pays
close attention to the proper application of tax laws to partnerships. The present U.S. federal income tax treatment of an
investment in LIN LLC common shares may be modified by administrative, legislative or judicial interpretation at any time,
possibly on a retroactive basis. Changes to the U.S. federal income tax laws and interpretations thereof could make it more
difficult or impossible to meet the exception for us to be treated as a partnership for U.S. federal income tax purposes that is
not taxable as a corporation (referred to as the "Qualifying Income Exception"), affect the tax considerations of an investment
in us, change the character or treatment of portions of our income and adversely affect an investment in our common shares.
Our LLC Agreement will permit our board of directors to amend our LLC Agreement from time to time, without the
consent of the holders, to address certain changes in U.S. federal income tax regulations, legislation or interpretation. In some
circumstances, such revisions could have a material adverse impact on some or all holders. In addition, although our board
of directors has no plan or intention to do so, it could elect at some point to treat us as an association taxable as a corporation
for U.S. federal (and applicable state) income tax purposes, in which event the U.S. federal income tax consequences of
owning our common shares would differ. If we were treated as a corporation for U.S. federal income tax purposes, we would
pay U.S. federal income tax on our taxable income at the applicable tax rates. In addition, we would likely be liable for state
and local income and/or franchise tax on all our income. Distributions to holders of our common shares would generally be
taxed again as corporate distributions, and no income, gains, losses, deductions or credits would otherwise flow through to
them.
Moreover, we will apply certain assumptions and conventions in an attempt to comply with applicable rules and to
report income, gain, deduction, loss and credit to holders in a manner that reflects such holders' beneficial ownership of
partnership items, taking into account variation in ownership interests during each taxable year because of trading activity.
26
As a result, a holder transferring common shares may be allocated income, gain, loss and deductions realized after the date
of transfer. However, those assumptions and conventions may not be in compliance with all aspects of applicable tax
requirements. It is possible that the IRS will assert successfully that the conventions and assumptions used by us do not satisfy
the technical requirements of the Code and/or Treasury regulations and could require that items of income, gain, loss, deductions
or credit, including interest deductions, be adjusted, reallocated or disallowed in a manner that adversely affects holders.
Holders of our common shares will be subject to U.S. federal income tax on their share of our taxable income, regardless
of whether they receive any cash distributions from us.
As long as 90% of our gross income for each taxable year constitutes qualifying income as defined in Section 7704 of
the Code and we are not required to register as an investment company under the 1940 Act, and assuming there is no change
in law, we will be treated, for U.S. federal income tax purposes, as a partnership and not as an association or a publicly traded
partnership taxable as a corporation. Accordingly, holders of our common shares will be required to take into account their
allocable share of our items of income, gain, loss, deduction and credit. Distributions to holders of our common shares generally
will be taxable for U.S. federal income tax purposes only to the extent the amount distributed exceeds their tax basis in
LIN LLC common shares. This treatment contrasts with the treatment of a shareholder in a corporation. For example, a
shareholder in a corporation who receives a distribution of earnings from the corporation generally will report the distribution
as dividend income for U.S. federal income tax purposes. In contrast, a holder of our common shares who receives a distribution
of earnings from us will not report the distribution as dividend income (and will treat the distribution as taxable only to the
extent the amount distributed exceeds the holder's tax basis in the common shares), but will instead report the holder's allocable
share of items of our income for U.S. federal income tax purposes. As a result, holders of our common shares may be subject
to U.S. federal, state and local income taxation on their allocable share of our items of income, gain, loss, deduction and credit
(including our allocable share of those items of any entity in which we invest that is treated as a partnership or is otherwise
subject to tax on a flow through basis) for each of our taxable years ending with or within their taxable years, regardless of
whether or not holders of our common shares receive cash distributions from us.
Tax gain or loss on disposition of LIN LLC common shares could be more or less than expected.
If holders of our common shares sell their common shares, they will recognize a gain or loss equal to the difference
between the amount realized and the adjusted tax basis in those common shares. Prior distributions to them in excess of the
total net taxable income allocated to them, which decreased the tax basis in their common shares, will in effect become taxable
income to them if the common shares are sold at a price greater than their tax basis in those common shares, even if the price
is less than the original cost.
Non-U.S. persons face unique U.S. tax issues from owning LIN LLC common shares that may result in adverse tax
consequences to them.
In light of our activities as a holding company owning only the common stock of LIN Television, we generally do not
expect to generate significant amounts of income treated as effectively connected income with respect to non-U.S. holders
of our common shares ("ECI"). However, there can be no assurance that we will not generate ECI currently or in the future
and, subject to the qualifying income rules described above, we are under no obligation to minimize ECI. To the extent our
income is treated as ECI, non-U.S. holders generally would be subject to withholding tax on their allocable shares of such
income, would be required to file a U.S. federal income tax return for such year reporting their allocable shares of income
effectively connected with such trade or business and any other income treated as ECI, and would be subject to U.S. federal
income tax at regular U.S. tax rates on any such income (state and local income taxes and filings may also apply in that event).
In addition, certain income of non-U.S. holders from U.S. sources not connected to any such U.S. trade or business conducted
by us could be treated as ECI. Non-U.S. holders that are corporations may also be subject to a 30% branch profits tax on their
allocable share of such income. In addition, certain income from U.S. sources that is not ECI allocable to non-U.S. holders
will be reduced by withholding taxes imposed at the highest effective applicable tax rate. A portion of any gain recognized
by a non-U.S. holder on the sale or exchange of common shares could also be treated as ECI.
Tax-exempt entities face unique tax issues from owning LIN LLC common shares that may result in adverse tax
consequences to them.
In light of our activities as a holding company owning only the common stock of LIN Television, we generally do not
expect to directly hold operating businesses that generate unrelated business taxable income for tax-exempt holders of our
common shares ("UBTI") other than through corporations. However, certain of our activities may be treated as debt-financed,
which may give rise to debt-financed UBTI. Accordingly, no assurance can be given that we will not generate UBTI currently
or in the future and, subject to the qualifying income rules, we are under no obligation to minimize UBTI. Consequently, a
holder of common shares that is a tax-exempt organization may be subject to "unrelated business income tax" to the extent
27
that its allocable share of our income consists of UBTI. A tax-exempt partner of a partnership could be treated as earning
UBTI if the partnership regularly engages in a trade or business that is unrelated to the exempt function of the tax-exempt
partner, if the partnership derives income from debt-financed property or if the partnership interest itself is debt-financed.
We cannot match transferors and transferees of the LIN LLC class A common shares, and we will therefore adopt certain
income tax accounting positions that may not conform with all aspects of applicable tax requirements. The IRS may
challenge this treatment, which could adversely affect the value of our common shares.
Because we cannot match transferors and transferees of common shares, we will adopt tax accounting positions that
may not conform with all aspects of existing Treasury regulations. A successful IRS challenge to those positions could adversely
affect the amount of tax benefits available to our holders. It also could affect the timing of these tax benefits or the amount
of gain on the sale of common shares and could have a negative impact on the value of our common shares or result in audits
of and adjustments to our holders' tax returns.
In addition, our taxable income and losses will be determined and apportioned among holders using conventions we
regard as consistent with applicable law. As a result, if holders of our common shares transfer their common shares, they may
be allocated income, gain, loss and deduction realized by us after the date of transfer. Similarly, a transferee may be allocated
income, gain, loss and deduction realized by us prior to the date of the transferee's acquisition of our common shares. A
transferee may also bear the cost of withholding tax imposed with respect to income allocated to a transferor through a
reduction in the cash distributed to the transferee.
The sale or exchange of 50% or more of our capital and profit interests within a twelve-month period will result in the
termination of our partnership for U.S. federal income tax purposes. Our termination would, among other things, result in the
closing of our taxable year for all holders.
Holders may be subject to state and local taxes and return filing requirements as a result of holding LIN LLC common
shares.
In addition to U.S. federal income taxes, our holders may be subject to other taxes, including state and local taxes,
unincorporated business taxes and estate, inheritance or intangible taxes that are imposed by the various jurisdictions in which
we do business or own property now or in the future, even if our holders do not reside in any of those jurisdictions. Our holders
may also be required to file state and local income tax returns and pay state and local income taxes in some or all of these
jurisdictions. Further, holders may be subject to penalties for failure to comply with those requirements. It is the responsibility
of each holder to file all U.S. federal, state and local tax returns that may be required of such holder.
It is possible that holders may be required to file amended income tax returns.
It is possible that a holder will be required to file amended income tax returns as a result of adjustments to items on the
corresponding income tax returns of the partnership. Any obligation for a holder to file amended income tax returns for that
or any other reason, including any costs incurred in the preparation or filing of such returns, is the responsibility of each
holder.
Due to uncertainty in the proper application of applicable law, we may over-withhold or under-withhold on distributions
to holders.
For each calendar year, we will report to holders and the IRS the amount of distributions we made to holders and the
amount of U.S. federal income tax (if any) that we withheld on those distributions. The proper application to us of rules for
withholding under Section 1441 of the Code (applicable to certain dividends, interest and similar items) is unclear. Because
the documentation we receive may not properly reflect the identities of holders at any particular time (in light of possible
sales of common shares), we may over-withhold or under-withhold with respect to a particular holder of common shares. For
example, we may impose withholding, remit that amount to the IRS and thus reduce the amount of a distribution paid to a
non-U.S. holder. It may turn out, however, that the corresponding amount of our income was not properly allocable to such
holder, and the withholding should have been less than the actual withholding. Such holder would be entitled to a credit against
the holder's U.S. tax liability for all withholding, including any such excess withholding, but if the withholding exceeded the
holder's U.S. tax liability, the holder would have to apply for a refund to obtain the benefit of the excess withholding. Similarly,
we may fail to withhold on a distribution, and it may turn out that the corresponding income was properly allocable to a nonU.S. holder and withholding should have been imposed. In that event, we intend to pay the under-withheld amount to the IRS,
and we may treat such under-withholding as an expense that will be borne by all holders of common shares on a pro rata basis
(since we may be unable to allocate any such excess withholding tax cost to the relevant non-U.S. holder).
28
Risks Related to Our Industry
The FCC's spectrum incentive auctions proceeding could result in the reallocation of broadcast spectrum for wireless
broadband use, which could materially impair our ability to provide competitive services.
Pursuant to The American Recovery and Reinvestment Act of 2009, on March 16, 2010, the FCC delivered to Congress
a staff report titled, "Connecting America: The National Broadband Plan" (the "NBP"). Among the many far-reaching
recommendations contained in the 375-page NBP is that the FCC reallocate 120 MHz of spectrum currently occupied by
television broadcast stations to mobile wireless broadband services by means of, among other things, amending the FCC's
technical rules to reduce television station service areas and distance separations, permitting channel sharing, conducting
voluntary "incentive" auctions for the return of television broadcast spectrum, and certain other voluntary and involuntary
mechanisms. The NBP also recommended spectrum "repacking," pursuant to which certain stations would be required to
move to new channels, and suggested the imposition of spectrum usage fees, which may require Congressional authorization.
the recommendations would appear to require further action by the FCC or Congress, or both.
In 2010, the FCC initiated a rulemaking proceeding to consider proposals to, among other things, implement rule changes
that could facilitate channel sharing by television stations and shared use of current television broadcast spectrum by wireless
broadband providers. In that proceeding, the FCC also sought comment on ways to improve VHF spectrum band television
operations (VHF stations have experienced reception difficulties following the DTV transition), to encourage stations on UHF
channels to move to VHF channels. On April 27, 2012, the FCC adopted rules establishing a framework for multiple fullservice and Class A television stations operating within the same market to share a single 6 MHz television channel while
retaining distinct station licenses and MVPD carriage rights. Under the FCC's new rules, only those stations participating in
the future incentive auction will be eligible to enter into channel sharing arrangements of this type. Because the FCC has not
yet implemented rules for the incentive auction, stations are not yet able to enter into channel sharing arrangements of this
type. Accordingly, we cannot predict the impact that channel sharing among television stations will have on either the industry
or our operations. This proceeding remains pending with respect to proposals to improve VHF band television operations and
impact on the industry or our operations.
On February 17, 2012, Congress adopted legislation authorizing the FCC to direct a portion of auction proceeds to
commercial users, including broadcasters, that voluntarily surrender some or all of their allotted spectrum for auction. The
legislation, which the President subsequently signed into law, includes safeguards for broadcasters. In particular, in the context
of an involuntary repacking of the TV bands, the legislation requires the FCC to make all reasonable efforts to ensure that
stations retain their existing coverage areas, prevents the FCC from forcing a broadcaster to move from a UHF to a VHF
channel, and establishes a fund to reimburse broadcasters for reasonable relocation expenses. On October 2, 2012, the FCC
released a Notice of Proposed Rule Making to implement the incentive auction statute. That proceeding remains pending. If
the FCC requires some or all of our television stations to make involuntary changes to their operations, such as through
frequency changes, reductions of service areas, and/or reduction of interference protection, our stations could suffer material
adverse effects, including, but not limited to, substantial conversion costs, and reduction or loss of over-the-air signal coverage.
The FCC Chairman has indicated that he anticipates that the FCC will adopt rules for the incentive auction in the first half of
2014 and that he believes that the FCC will conduct the incentive auction by the middle of 2015. We cannot predict the precise
timing or scope of the incentive spectrum auctions, nor the impact, if any, that the reallocation of spectrum will have on our
business.
We may be unable to successfully negotiate future retransmission consent agreements and these negotiations may be
further hindered by consolidation in that industry and the interests of networks with whom we are affiliated or by statutory
or regulatory developments.
We may be unable to successfully negotiate retransmission consent agreements with MVPDs when the current terms
of these agreements expire for various reasons, including consolidation within that industry. In addition, our affiliation
agreements with some broadcast networks include certain terms that may affect our ability to permit MVPDs to retransmit
our stations' signals containing network programming, and in some cases, we may lose the right to grant retransmission consent
to such providers. If the broadcast networks withhold their consent to the retransmission of those portions of our stations'
signals containing network programming we may be unable to successfully complete negotiations for new retransmission
consent agreements. Certain networks require us to pay them compensation in exchange for permitting redistribution of
network programming by MVPDs. Escalating payments to networks in connection with signal retransmission may adversely
affect our operating results. If we lose the right to grant retransmission consent, we may be unable to satisfy certain obligations
29
under our existing retransmission consent agreements with MVPDs and there could be a material adverse effect on our results
of operations.
Several cable system and DBS operators jointly petitioned the FCC to initiate a rulemaking proceeding to consider
amending its retransmission consent rules. The FCC solicited public comment on the petition and subsequently released a
notice of proposed rule making seeking public comment on whether it should amend its rules to: (i) modify its standards for
the FCC's network non-duplication and syndicated exclusivity rules. The proceeding is currently pending, and we cannot
predict its outcome.
On January 10, 2014, the Supreme Court agreed to hear a case captioned
al. v. Aereo, Inc., which involves a challenge from several broadcasters of the Aereo service, which transmits to its subscribers
broadcast television programs over the Internet for a monthly subscription fee. At issue is whether Aereo’s service violates
copyright law and whether Aereo must obtain permission to retransmit broadcasters’ programming. Should Aereo and its
competitors prevail in the pending litigation, and certain online video distributors and over-the-top video distributors become
eligible for a statutory license that would enable them to stream broadcast programming over the Internet, it could have a
negative impact on our retransmission consent negotiations with MVPDs, and our business and results of operations could
be materially and adversely affected. We cannot predict the ultimate outcome of this proceeding.
Our industry is subject to significant syndicated and other programming costs, and increased programming costs could
adversely affect our operating results.
Our industry is subject to significant syndicated and other programming costs. We often acquire program rights two or
three years in advance, making it difficult for us to accurately predict how a program will perform. In some instances, we
may have to replace programs before their costs have been fully amortized, resulting in impairments and write-offs that
increase station operating costs. We may be exposed to future programming cost increases, which may adversely affect our
operating results.
Federal regulation of the broadcasting industry limits our operating flexibility, which may affect our ability to generate
revenue or reduce our costs.
The FCC regulates our business, just as it does all other companies in the broadcasting industry. We must ask the FCC's
approval whenever we need a new license, seek to renew, assign or modify a license, purchase a new station, sell an existing
station or transfer the control of one of our subsidiaries that holds a license. Our FCC licenses and those of the stations that
the FCC will renew these licenses in the future or approve new acquisitions in a timely manner, if at all. If licenses are not
renewed or acquisitions approved, we may lose revenue that we otherwise could have earned.
In addition, Congress and the FCC may, in the future, adopt new laws, regulations and policies regarding a wide variety
of matters (including retransmission consent, spectrum allocation, media ownership and technological changes) that could,
directly or indirectly, materially and adversely affect the operation and ownership of our broadcast properties. (See Item 1.
Business-"Federal Regulation of Television Broadcasting").
Changes in FCC ownership rules through FCC action, judicial review or federal legislation may limit our ability to continue
providing services to stations under sharing arrangements (such as LMAs, JSAs, SSAs and other similar agreements) may
prevent us from obtaining ownership of the stations we currently provide services to under sharing arrangements, may
require us to amend or terminate certain agreements and/or may preclude us from obtaining the full economic value of
one or more of our duopoly, or two-station operations upon a sale, merger or other similar transaction transferring
ownership of such station or stations.
FCC ownership rules currently impose significant limitations on the ability of broadcast licensees to have attributable
interests in multiple media properties. Federal law prohibits one company from owning broadcast television stations that
collectively have service areas encompassing more than an aggregate 39% share of national television households. Ownership
restrictions under FCC rules also include a variety of local limits on media ownership. The restrictions include an ownership
limit of one television station in most medium and smaller television markets and two stations in most larger markets, known
as the television duopoly rule. The regulations also include limits on the common ownership of a newspaper and television
station in the same market (newspaper-television cross-ownership), limits on common ownership of radio and television
stations in the same market (radio-television station ownership) and limits on radio ownership of four to eight radio stations
in a local market.
30
Should the FCC modify its media ownership rules, attractive opportunities may arise for additional television station
and other media acquisitions. But these changes also create additional competition for us from other entities, such as national
broadcast networks, large station groups, newspaper chains and cable operators, which may be better positioned to take
advantage of such changes and benefit from the resulting operating synergies both nationally and in specific markets.
Should the television duopoly rule be relaxed, we may be able to acquire the ownership of one or more of the stations
in Austin, TX, Dayton, OH, Providence, RI, Albuquerque, NM, Savannah, GA, Topeka, KS and Youngstown, OH for which
we currently provide programming, sales and/or other related services under sharing arrangements, as the case may be, and
for which we have purchase option agreements to purchase these stations.
Should we be unable to acquire the ownership of the stations currently serviced by LMAs, there is no assurance that
the grandfathering of our LMAs will be permitted beyond conclusion of the FCC's current review of the ownership rules.
Should the FCC conclude, as part of a periodic review of its ownership rules, that SSAs, JSAs, and similar arrangements
should be attributable for purposes of the media ownership rules, there is no assurance that the FCC would grandfather the
non-attributable status of our existing agreements, and, as a result, we may be required to terminate these agreements.
Any potential hostilities, natural disasters, cybersecurity threats, breaches of information technology security, terrorist
attacks or other disruptions may affect our revenues and results of operations.
If the U.S. becomes engaged in new, large scale foreign hostilities, is impacted by any significant natural disasters or
if there is a terrorist attack against the U.S., we may lose advertising revenue and incur increased broadcasting expenses due
to pre-emption, delay or cancellation of advertising campaigns and increased costs of providing news coverage of such events.
In light of the increased dependence on digital technologies by public companies and the increasing frequency and severity
of cyber incidents, we may be subject to cybersecurity risks or other breaches of information technology security. A breach
of our cyber/data security measures could disrupt our normal business operations and affect our ability to control our assets,
access information and limit communication with third parties. We cannot predict the extent and duration of any future
disruption to our programming schedule, the amount of advertising revenue that would be lost or delayed or the amount by
which our expenses would increase as a result. Consequently, any related future loss of revenue and increased expenses could
negatively affect our results of operations.
Item 1B.
Unresolved Staff Comments
None.
Item 2.
Properties
We maintain our corporate headquarters in Austin, TX under an operating lease that expires on May 31, 2018.
Each of our stations has facilities consisting of offices, studios, sales offices and tower and transmitter sites. Tower and
transmitter sites are located in areas that provide optimal coverage to each of our markets. We own substantially all of the
offices and studios where our stations are located and generally own the property where our towers and primary transmitters
are located. We lease the remaining properties, consisting primarily of office locations and microwave transmitter sites. While
none of the station properties owned or leased by us are individually material to our operations, if we were required to relocate
any of our towers, the cost could be significant. This is because the number of sites in any geographic area that permit a tower
of reasonable height to provide good coverage of the market is limited, and zoning and other land use restrictions, as well as
Federal Aviation Administration and FCC regulations, limit the number of alternative locations or increase the cost of acquiring
them for tower sites.
Item 3.
Legal Proceedings
We are involved in various claims and lawsuits that are generally incidental to our business. We are vigorously contesting
all of these matters. The outcome of any current or future litigation cannot be accurately predicted. We record accruals for
such contingencies to the extent that we conclude it is probable that a liability has been incurred and the amount of the loss
can be reasonably estimated. No estimate of the possible loss or range of loss can be made at this time because the inherently
unpredictable nature of legal proceedings may be exacerbated by various factors, including: (i) the damages sought in the
ntial
31
outcomes. Although the outcome of these and other legal proceedings cannot be predicted, we believe that their ultimate
resolution will not have a material adverse effect on us.
Item 4.
Mine Safety Disclosures
Not applicable.
32
PART II
Item 5. Market for Registrant's Common Equity, Related Shareholder Matters and Issuer Purchases of Equity
Securities
Our class A common shares are listed on the NYSE under the symbol "LIN." There is no established trading market for
our class B common shares or our class C common shares.
The following table sets forth the high and low sales prices for our class A common shares for the periods indicated, as
reported by the NYSE:
High
2013
1st Quarter ................................................................................................................................ $
2nd Quarter...............................................................................................................................
3rd Quarter ...............................................................................................................................
4th Quarter................................................................................................................................
2012
1st Quarter ................................................................................................................................ $
2nd Quarter...............................................................................................................................
3rd Quarter ...............................................................................................................................
4th Quarter................................................................................................................................
Low
13.40
16.64
20.55
29.24
$
7.69
10.01
14.25
20.24
5.00
4.15
4.54
7.80
$
3.88
2.64
2.94
4.35
We have never declared or paid any cash dividends on our class A common shares and the terms of our indebtedness
limit the payment of such dividends.
As of December 31, 2013, there were approximately 30 shareholders of record of our class A common shares, 18
shareholders of record of our class B common shares and two shareholders of record of our class C common shares.
The common stock of our wholly-owned subsidiary, LIN Television, all of which is held directly by us, has not been
registered under the Exchange Act and is not listed on any national securities exchange.
On November 14, 2012, we publicly announced that our Board of Directors extended our authorization to repurchase
up to $25 million of our class A common shares in the open market, in privately negotiated transactions or pursuant to a
Rule 10b5-1 plan. This authorization expired on the earlier of the completion of all purchases contemplated by the plan or
stock repurchase program. We did not repurchase any shares during 2013.
The following graph compares the cumulative total return performance of our class A common shares for the five years
Nexstar Broadcasting Group, Inc. (the "Television Index"). The graph assumes the investment of $100 in our class A common
shares and in each of the indices on December 31, 2008. The performance shown is not necessarily indicative of future
performance.
33
12/31/2008
LIN Media LLC (LIN) .... $
NYSE Composite Index.. $
Television Index.............. $
Item 6.
100.00 $
100.00 $
100.00 $
12/31/2009
409.17
124.80
314.80
12/31/2010
$
$
$
486.24
138.34
447.79
12/31/2011
$
$
$
388.07
129.88
582.37
12/31/2012
$
$
$
690.83
146.66
786.98
12/31/2013
$
$
$
2,633.94
180.65
4,278.06
Selected Financial Data
Set forth below is our selected consolidated financial data for each of the five years in the period ended December 31,
2013. The selected financial data as of December 31, 2013 and 2012 and for the years ended December 31, 2013, 2012 and
2011 is derived from audited consolidated financial statements that appear elsewhere in this report. The selected financial
data should be read in conjunction with Item 7. "Management's Discussion and Analysis of Financial Condition and Results
of Operations" and our historical consolidated financial statements and the notes thereto. All financial information shown
reflect the operations of WWHO-TV in Columbus, OH and WUPW-TV in Toledo, OH as discontinued for all periods presented.
The sale of WWHO-TV was completed on February 16, 2012 and the sale of WUPW-TV was completed on April 21, 2012.
The selected consolidated financial data of LIN LLC for 2009 through 2013 is presented below. Prior to the Merger,
LIN LLC had no operations or assets other than its investments in its subsidiaries. Subsequent to the Merger and consistent
with its classification as a partnership for federal income tax purposes, LIN LLC has separate operations relating to the
administration of the limited liability company. The consolidated financial statements of LIN LLC represent its own operations
and the consolidated operations of LIN Television, which remains a corporation after the Merger. Accordingly, the consolidated
financial data of LIN Television and LIN LLC is identical for the years 2012 through 2009 with the exception of basic and
diluted loss per common share, which is not presented for LIN Television. The consolidated financial data of LIN Television
is substantially similar to that of LIN LLC for 2013, with the exception of the separate assets, liabilities and operations related
to administration of the limited liability company.
34
Year Ended December 31,
2013
2012
2011
2010
2009
(in thousands, except per share data)
Consolidated Statement of Operations Data:
Net revenues.......................................................................... $
652,363
$
553,462
$
400,003
$
408,190
$
327,842
Impairment of goodwill, broadcast licenses
and broadcast equipment....................................................
—
—
—
—
39,487
Operating income..................................................................
89,944
171,061
89,104
111,839
22,294
Loss (gain) on extinguishment of debt..................................
—
3,341
1,694
2,749
(50,149)
Income (loss) from continuing operations(1) .........................
156,601
(17,972)
49,701
36,181
9,704
(Loss) income from discontinued operations, net of tax.......
—
(1,018)
(920)
317
(591)
Gain from the sale of discontinued operations, net of tax ....
—
11,389
—
—
—
Net income (loss) ..................................................................
156,601
(7,601)
48,781
36,498
9,113
(556)
204
—
—
(7,045)
48,577
36,498
9,113
Net (loss) income attributable to noncontrolling interests....
Net income (loss) attributable to LIN LLC...........................
(1,512)
158,113
Basic income (loss) per common share attributable to
LIN LLC:
Income (loss) from continuing operations attributable to
LIN LLC ...............................................................................
3.02
(0.32)
0.89
0.67
0.19
(Loss) income from discontinued operations, net of tax.......
—
(0.02)
(0.02)
0.01
(0.01)
Gain from sale of discontinued operations, net of tax ..........
Net income (loss) attributable to LIN LLC........................... $
Weighted-average basic shares outstanding..........................
—
3.02
0.21
$
52,439
—
(0.13) $
54,130
0.87
—
$
55,768
0.68
—
$
53,978
0.18
51,464
Diluted income (loss) per common share attributable to
LIN LLC:
Income (loss) from continuing operations attributable to
LIN LLC ............................................................................... $
(Loss) income from discontinued operations, net of tax.......
Gain from the sale of discontinued operations, net of tax ....
Net income (loss) attributable to LIN LLC........................... $
Weighted-average diluted shares outstanding.......................
2.84
$
—
—
2.84
(0.32) $
(0.02)
0.21
$
55,639
0.87
$
(0.02)
54,130
0.85
$
0.01
—
(0.13) $
0.65
—
$
57,079
0.66
0.19
(0.01)
—
$
55,489
0.18
51,499
Consolidated Balance Sheet Data (at period end):
Cash and cash equivalents .................................................... $
12,525
$
46,307
$
18,057
$
11,648
$
11,105
Restricted cash ......................................................................
—
—
255,159
—
2,000
Broadcast licenses, intangible assets, net and goodwill........
787,092
788,583
522,150
504,512
506,061
Total assets............................................................................
1,216,850
1,241,414
1,081,944
790,469
790,503
Total debt ..............................................................................
944,692
890,227
868,717
623,260
682,954
Consolidated net debt(2).........................................................
932,167
843,920
595,501
611,612
671,849
Total LIN LLC shareholders' equity (deficit) ......................
89,127
(91,564)
(84,632)
(131,432)
(173,561)
Other Data:
Program payments ................................................................ $
31,677
$
24,258
$
24,622
$
25,066
$
23,081
___________________________________________________________________________
(1)
Income from continuing operations during the year ended December 31, 2013 includes a $124.3 million tax benefit recognized as a result
of the Merger as well as an $18.2 million tax benefit recognized as a result of the reversal of our valuation allowance on deferred tax
assets. For additional information, refer to Note 14 - "Income Taxes" to our consolidated financial statements.
(2)
Consolidated net debt is a non-GAAP financial measure, and is equal to total debt less cash and cash equivalents. Solely for the purpose of
computing consolidated net debt as of December 31, 2011, our senior secured credit facility permitted restricted cash to be offset against
total debt. Beginning in 2012, for the purpose of our debt covenant calculations, our senior credit facility permitted a maximum of $45 million
to be offset against total debt in arriving at consolidated net debt. For purposes of the consolidated balance sheet data above, we have
subtracted the total balance of our cash and cash equivalents in arriving at consolidated net debt. Consolidated net debt provides investors
with useful information about our financial position, and is one of the financial measures used to evaluate compliance with our debt covenants.
35
Item 7. Management's Discussion and Analysis of Financial Condition and Results of Operations
Executive Summary
We own, operate or service 43 television stations and seven digital channels in 23 U.S. markets, with multiple network
affiliated channels in 18 markets. Our growing digital media portfolio helps agencies and brands effectively and efficiently
reach their target audiences at scale by utilizing our comScore, Inc. rated Top 15 Video market share and the latest in
conversational marketing, video, display, mobile, social intelligence and monetization, as well as reporting across all screens.
Our operating revenues are primarily derived from the sale of advertising time to local, national and political advertisers. Less
significant revenues are generated from our television station websites, retransmission consent fees, interactive revenues and
other revenues. We recorded net income (loss) of $156.6 million, $(7.6) million and $48.8 million for the years ended
December 31, 2013, 2012, and 2011, respectively.
Our operating highlights for 2013 include the following:
35%, increase in local revenues, which include net local advertising sales, retransmission consent fees and
television station website revenues, as well as an increase of $35 million, or 85%, in interactive revenues, which
include revenues from LIN Digital, Nami Media, HYFN, and Dedicated Media. Also contributing to the increase
in net revenues was an increase in net national revenues of $23.6 million, or 22%. Excluding the impact of the
television stations acquired in 2012 and the 2013 acquisitions of majority interests in HYFN and Dedicated
Media, net revenues decreased approximately $31.8 million, or 6%, primarily the result of a decrease in political
advertising revenues.
Television causing a $100 million capital contribution to be made to SVH (which was used to prepay a portion
of the GECC Note), LIN Texas sold its interest in SVH, a joint venture with NBC, and LIN TV was released
from the GECC Guarantee and any further obligations related to the shortfall funding agreements. The
$100 million capital contribution was financed by a combination of cash on hand, borrowings under LIN
Television's revolving credit facility, and a new $60 million incremental term facility under LIN Television's
existing senior secured credit facility. The JV Sale Transaction resulted in a $100 million charge recognized in
the fourth quarter of 2012 to accrue for our obligations related to the JV Sale Transaction, and the recognition
of taxable gains from the JV Sale Transaction resulting in a $162.8 million short-term deferred federal and state
tax liability. For further information, see Item 1. "Business—Joint Venture Sale Transaction," Note 1—"Basis
of Presentation and Summary of Significant Accounting Policies," and Note 13—"Commitments and
Contingencies" to our consolidated financial statements.
the surviving entity. As a result of the Merger, we realized a capital loss in the amount of approximately $343
million. The capital loss realized and existing net operating losses were used to offset a portion of the capital
gain recognized in the JV Sale Transaction and we realized cash savings of $131.5 million, resulting in a remaining
tax liability of $31.3 million associated with the JV Sale Transaction. We made state and federal tax payments
to settle this tax liability during the fourth quarter of 2013. For further information, see Item 1. "Business—
Joint Venture Sale Transaction," Note 1—"Basis of Presentation and Summary of Significant Accounting
Policies," and Note 13—"Commitments and Contingencies" to our consolidated financial statements.
digital advertising agency specializing in the planning, development, deployment and support for websites,
mobile sites, interactive banners, games and various applications for multiple devices, for $7.2 million.
channel advertisement buying and optimization company, for $5.8 million. Dedicated Media employs new
technologies to create, plan and execute digital marketing campaigns on behalf of its clients.
Critical Accounting Policies, Estimates and Recently Issued Accounting Pronouncements
Certain of our accounting policies, as well as estimates we make, are critical to the presentation of our financial condition
and results of operations since they are particularly sensitive to our judgment. Some of these policies and estimates relate to
matters that are inherently uncertain. The estimates and judgments we make affect the reported amounts of assets, liabilities,
revenues and expenses, and related disclosures of contingent liabilities. On an on-going basis, we evaluate our estimates,
36
including those used for allowance for doubtful accounts in receivables, valuation of goodwill and intangible assets,
amortization and impairment of program rights and intangible assets, share-based compensation and other long-term incentive
compensation arrangements, pension costs, barter transactions, income taxes, employee medical insurance claims, useful lives
of property and equipment, contingencies, litigation and net assets of businesses acquired. We base our estimates on historical
experience and on various other assumptions that we believe to be reasonable under the circumstances, the results of which
form the basis for making judgments about the carrying values of assets and liabilities that are not readily apparent from other
sources. Actual results may differ from these estimates under different assumptions or conditions, and it is possible that such
differences could have a material impact on our consolidated financial statements.
We believe the following critical accounting policies are those that are most important to the presentation of our
consolidated financial statements, affect our more significant estimates and assumptions, and require the most subjective or
complex judgments by management. We have discussed each of these critical accounting policies and related estimates with
the Audit Committee of our Board of Directors. For additional information about these and other accounting policies, see
Note 1—"Basis of Presentation and Summary of Significant Accounting Policies" to our consolidated financial statements
included elsewhere in this report.
Approximately $740 million, or 61% of our total assets as of December 31, 2013, consisted of indefinite-lived intangible
assets. Intangible assets principally include broadcast licenses and goodwill. If the fair value of these assets is less than the
carrying value, we may be required to record an impairment charge.
We test the impairment of our broadcast licenses annually or whenever events or changes in circumstances indicate that
such assets might be impaired. We proceed directly to the first step of the impairment test without attempting to qualitatively
assess whether an impairment was more likely than not. The impairment test consists of a comparison of the fair value of
broadcast licenses with their carrying amount on a market-by-market basis using a discounted cash flow valuation method,
assuming a hypothetical startup scenario. The future value of our broadcast licenses could be significantly impaired by the
loss of the corresponding network affiliation agreements. Accordingly, such an event could trigger an assessment of the
carrying value of a broadcast license.
We test the impairment of our goodwill annually or whenever events or changes in circumstances indicate that goodwill
might be impaired. Our reporting units are comprised of the markets in which our television stations operate, LIN Digital,
Nami Media, HYFN and Dedicated Media. We proceed directly to the first step of the impairment test without attempting to
qualitatively assess whether an impairment was more likely than not. The first step of the goodwill impairment test compares
the fair value of a reporting unit with its carrying amount, including goodwill. The fair value of a reporting unit is determined
through the use of a discounted cash flow analysis. The valuation assumptions used in the discounted cash flow model reflect
historical and projected performance of the reporting unit and prevailing rates in the markets for broadcasters. If the fair value
of the reporting unit exceeds its carrying amount, goodwill is not considered impaired. If the carrying amount of the reporting
unit exceeds its fair value, the second step of the goodwill impairment test is performed to measure the amount of impairment
loss, if any. The second step of the goodwill impairment test compares the implied fair value of goodwill with the carrying
amount of that goodwill. The implied fair value of goodwill is determined by performing a hypothetical purchase price
allocation, using the reporting unit's fair value (as determined in the first step described above) as the purchase price. If the
carrying amount of goodwill exceeds the implied fair value, an impairment charge is recognized in an amount equal to that
excess, but not more than the carrying value of the goodwill. An impairment assessment could be triggered by a significant
reduction, or a forecast of such reduction, in operating results or cash flows at one or more of our reporting units, a significant
adverse change in the national or local advertising marketplaces in which our television stations operate, or by adverse changes
to FCC ownership rules, among other factors.
The assumptions used in the valuation testing have certain subjective components including anticipated future operating
results and cash flows based on our own internal business plans as well as future expectations about general economic and
local market conditions. The changes in the discount rate used for our broadcast licenses and goodwill reflected in the table
below are primarily driven by changes in the average beta for the public equity of companies in the television and media
sector and the average cost of capital in each of the periods. The changes in the market growth rates and operating profit
margins for both our broadcast licenses and goodwill reflect changes in the outlook for advertising revenues in certain markets
where our stations operate in each of the periods.
We based the valuation of broadcast licenses on the following average industry-based assumptions:
37
December 31,
2013
Market revenue growth ...................................................................................
Operating cash flow margins ..........................................................................
Discount rate ...................................................................................................
Tax rate............................................................................................................
Long-term growth rate ....................................................................................
2.7%
32.4%
11.0%
38.9%
2.0%
December 31,
2012
December 31,
2011
0.87%
30.9%
10.5%
38.3%
1.8%
1.2%
30.6%
10.5%
38.3%
1.8%
As of December 31, 2013, we would incur an impairment charge of $1 million and $7.7 million if we were to decrease
the market revenue growth rate by 1% and 2%, respectively. A 5% and 10% decrease in operating cash flow margins would
result in an impairment charge of approximately $10.4 million and $88.7 million, respectively. An increase of 1% in the
discount rate would result in an impairment charge of approximately $1.8 million and an increase of 2% would result in an
impairment charge of approximately $10.8 million.
The valuation of goodwill for our television stations is based on the following assumptions, which take into account
our internal projections and industry assumptions related to market revenue growth, operating cash flows and prevailing
discount rates:
December 31,
2013
Market revenue growth ...................................................................................
Operating cash flow margins ..........................................................................
Discount rate ...................................................................................................
Tax rate............................................................................................................
Long-term growth rate ....................................................................................
2.7%
41.5%
12.5%
39.0%
2.0%
December 31,
2012
December 31,
2011
1.2%
48.2%
12.0%
38.4%
1.8%
1.8%
42.3%
12.0%
38.4%
1.8%
As of December 31, 2013, if we were to decrease the market revenue growth by 1% and 2% of the projected growth
rate, the enterprise value of our stations with goodwill would decrease by $41.2 million and $76.8 million, respectively. If
we were to decrease the operating cash flow margins by 5% and 10% from the projected operating cash flow margins, the
enterprise value of our stations with goodwill would decrease by $178.3 million and $355.8 million, respectively. If we were
to increase the discount rate used in the valuation calculation by 1% and 2%, the enterprise value of our stations with goodwill
would decrease by $103.6 million and $196.7 million, respectively.
Network affiliations
Other broadcast companies may use different assumptions in valuing acquired broadcast licenses and their related
network affiliations than those that we use. These different assumptions may result in the use of valuation methods that can
result in significant variances in the amount of purchase price allocated to these assets by these broadcast companies.
We believe that the value of a television station is derived primarily from the attributes of its broadcast license. These
attributes have a significant impact on the audience for network programming in a local television market compared to the
national viewing patterns of the same network programming. These attributes and their impact on audiences can include:
station. The local television station's news programming that attracts the largest audience in a market
syndicated programming that attracts the largest audience in a market generally will provide larger audience
lead-ins to its network programming.
38
A local television station can be the top-rated station in a market, regardless of the national ranking of its affiliated
network, depending on the factors or attributes listed above. ABC, CBS, FOX and NBC, each have affiliations with local
television stations that have the largest primetime audience in the local market in which the station operates regardless of the
network's primetime rating.
Some broadcasting companies believe that network affiliations are the most important component of the value of a
station. These companies generally believe that television stations with network affiliations have the most successful local
news programming and the network affiliation relationship enhances the audience for local syndicated programming. As a
result, these broadcasting companies allocate a significant portion of the purchase price for any station that they may acquire
to the network affiliation relationship.
We generally have acquired broadcast licenses in markets with a number of commercial television stations equal to or
less than the number of television networks seeking affiliates. The methodology we used in connection with the valuation of
the stations acquired is based on our evaluation of the broadcast licenses and the characteristics of the markets in which they
operated. We believe that in substantially all our markets we would be able to replace a network affiliation agreement with
little or no economic loss to our television station. As a result of this assumption, we ascribed no incremental value to the
incumbent network affiliation in substantially all our markets in which we operate beyond the cost of negotiating a new
agreement with another network and the value of any terms that were more favorable or unfavorable than those generally
prevailing in the market. Other broadcasting companies have valued network affiliations on the basis that it is the affiliation
and not the other attributes of the station, including its broadcast license, which contributes to the operating performance of
that station. As a result, we believe that these broadcasting companies include in their network affiliation valuation amounts
related to attributes that we believe are more appropriately reflected in the value of the broadcast license or goodwill.
In future acquisitions, the valuation of the broadcast licenses and network affiliations may differ from those attributable
to our existing stations due to different facts and circumstances for each station and market being evaluated.
Valuation allowance for deferred tax assets
We consider future taxable income and feasible tax planning strategies in assessing the need for establishing or removing
a valuation allowance. We record or subsequently remove a valuation allowance to reflect our deferred tax assets at an amount
that is more likely than not to be realized.
In the event that our determination changes regarding the realization of all or part of our deferred tax assets in the future,
an adjustment to the deferred tax asset is recorded to our consolidated statement of operations in the period in which such a
determination is made.
As of December 31, 2012, we had a valuation allowance of $18.2 million offsetting certain state net operating loss
carryforwards and other state deferred tax assets. During the third quarter of 2013, after evaluating our ability to recover
certain net operating loss carryforwards due to the change in tax structure as a result of the Merger, we determined that we
will more likely than not be able to realize these deferred tax assets. As a result, we reversed the valuation allowance and
recognized a corresponding tax benefit of $18.2 million.
Revenue recognition
We recognize local, national and political advertising sales, net of agency commissions, during the period in which the
advertisements or programs are aired on our television stations, and when payment is reasonably assured. Internet and mobile
advertisement sales are recognized when the advertisement is displayed on our websites or the websites, mobile applications,
or those of our advertising network. We recognize retransmission consent fees in the period in which our service is delivered.
Revenue generated by our digital companies is recognized over the service delivery period when necessary provisions of the
contracts have been met. In addition, for the sale of third-party products and services by our digital companies, we evaluate
whether it is appropriate to recognize revenue based on the gross amount billed to the customer or the net amount retained
by us.
We estimate the fair value of share option awards using a Black-Scholes valuation model. The Black-Scholes model
requires us to make assumptions and judgments about the variables used in the calculation, including the option's expected
term, the price volatility of the underlying shares and the number of share option awards that are expected to be forfeited.
The expected term represents the weighted-average period of time that options granted are expected to be outstanding giving
consideration to vesting schedules and our historical exercise patterns. Expected volatility is based on historical trends for
our class A common shares over the expected term. Expected forfeitures are estimated using our historical experience. If
39
future changes in estimates differ significantly from our current estimates, our future share-based compensation expense and
results of operations could be materially impacted.
We have historically provided defined benefit retirement plans to our employees who did not receive matching
contributions from our Company to their 401(k) Plan accounts. Our pension benefit obligations and related costs are calculated
using actuarial concepts. Our defined benefit plan is a non-contributory plan under which we made contributions either to:
a) traditional plan participants based on periodic actuarial valuations, which are expensed over the expected average remaining
balance plan participants based on 5% of each participant's eligible compensation through the Supplemental Benefit Retirement
Plan of LIN Television Corporation ("SERP"). Effective April 1, 2009, these plans were frozen and we do not expect to make
additional benefit accruals to these plans, however we continue to fund our existing vested obligations.
We contributed $5.4 million, $7.4 million and $5.4 million to our pension plans during the years ended December 31,
2013, 2012 and 2011, respectively. We anticipate contributing $5.7 million to our pension plans in 2014.
Weighted-average assumptions used to estimate our pension benefit obligations and to determine our net periodic pension
benefit cost are as follows:
Year Ended December 31,
2013
Discount rate used to estimate our pension
benefit obligation ........................................
Discount rate used to determine net
periodic pension benefit..............................
Rate of compensation increase ...................
Expected long-term rate-of-return on plan
assets ...........................................................
2012
2011
SERP
Retirement
Plan
SERP
Retirement
Plan
4.70%
5.00%
3.60%
4.00%
3.90%
4.20%
3.60%
N/A
4.00%
N/A
3.90%
N/A
4.20%
N/A
5.25%
N/A
5.25%
N/A
N/A
7.00%
N/A
7.00%
N/A
7.00%
SERP
Retirement
Plan
The discount rate for the years ended December 31, 2013, 2012 and 2011 was determined using a custom bond modeler
be purchased to settle the obligations of the plan. The yield on this hypothetical portfolio represents a reasonable rate to value
our plan liability.
We considered the current levels of expected returns on a risk-free investment, the historical levels of risk premium
associated with each of our pension asset classes, the expected future returns for each of our pension asset classes and then
weighted each asset class based on our pension plan asset allocation to derive an expected long-term return on pension plan
assets. During the year ended December 31, 2013, our actual rate of return on plan assets was 12%.
As a result of the plan freeze during 2009, we have no further service cost or amortization of prior service cost related
to the plans. In addition, because the plans are now frozen and participants became inactive during 2009, the net losses related
to the plans included in accumulated other comprehensive income are now amortized over the average remaining life
expectancy of the inactive participants instead of the average remaining service period. We expect to record a pension expense
of approximately $0.2 million in 2014. For every 0.25% change in the actual return compared to the expected long-term return
on pension plan assets and for every 0.25% change in the actual discount rate compared to the discount rate assumption for
2014, our 2014 pension expense would change by less than $0.2 million and less than $0.1 million, respectively.
Our investment objective is to achieve a consistent total rate-of-return that will equal or exceed our actuarial assumptions
and to equal or exceed the benchmarks that we use for each of our pension plan asset classes. The following asset allocation
is designed to create a diversified portfolio of pension plan assets that is consistent with our target asset allocation and risk
policy:
40
Percentage
of Plan
Assets as of
December 31,
Target
Allocation
Asset Category
2013
Equity securities ..............................................................................................
Debt securities.................................................................................................
2013
60%
40%
100%
2012
60%
40%
100%
55%
45%
100%
For a discussion of new accounting standards please read Note 1, "Basis of Presentation and Summary of Significant
Accounting Policies" to our consolidated financial statements included in this report.
Results of Operations
Set forth below are the key operating areas that contributed to our results for the years ended December 31, 2013, 2012
and 2011. Our consolidated financial statements reflect the operations of WWHO-TV, in Columbus, OH and WUPW-TV in
Toledo, OH as discontinued for all periods presented. As a result, reported financial results may not be comparable to certain
historical financial information.
Our results of operations are as follows (in thousands):
Year Ended December 31,
2013
2012
$
2011
Local revenues .............................. $
National advertising sales .............
Political advertising sales .............
Interactive revenues ......................
Other revenues ..............................
Net revenues ...............................
Operating expenses:
427,819
130,935
7,600
75,853
10,156
652,363
Direct operating ............................
Selling, general and
administrative ...............................
Amortization of program rights ....
Corporate ......................................
Depreciation..................................
Amortization of intangible assets .
Restructuring.................................
Contract termination costs ............
Loss from asset dispositions .........
Total operating costs.....................
Operating income.......................... $
251,078
160,222
130,618
90,856
162,550
29,242
41,377
125,267
23,048
34,246
103,770
21,406
26,481
37,283
6,194
7,131
46,854
22,826
3,895
3,887
710
562,419
89,944
32,149
6,364
1,009
—
96
382,401
171,061
26,246
1,199
707
—
472
310,899
89,104
14,705
16,462
2,886
3,887
614
180,018
(81,117)
$
316,471
107,325
76,458
41,095
12,113
553,462
$
$
255,478
95,734
8,132
27,220
13,439
400,003
2013 vs. 2012
$
111,348
23,610
(68,858)
34,758
(1,957)
98,901
$
2012 vs. 2011
35 % $
22 %
(90)%
85 %
(16)%
18 %
153,459
24 %
12 %
840 %
51 %
(10)%
38 %
57 %
29,604
23 %
30 %
27 %
21 %
21,497
1,642
7,765
21 %
8%
29 %
46 %
259 %
286 %
100 %
640 %
47 %
(47)% $
60,993
11,591
68,326
13,875
(1,326)
5,903
5,165
302
—
(376)
71,502
81,957
22 %
431 %
43 %
—%
(80)%
23 %
92 %
Three-Year Comparison
Net revenues consist primarily of local, national, and political advertising sales, net of sales adjustments and agency
commissions. Additional revenues are generated from advertising on our television station websites, mobile applications, and
those of our advertising networks, retransmission consent fees, interactive revenues, barter revenues, network compensation,
production revenues, tower rental income and station copyright royalties.
41
Net revenues during the year ended December 31, 2013 increased by $98.9 million when compared to the prior year.
Excluding the impact of the television stations acquired during 2012 and of the acquisition of a majority interest in HYFN
and Dedicated Media, net revenues decreased $31.8 million, or 6%, primarily due to a $61.5 million decrease in political
revenues. This decrease was partially offset by a $23.2 million increase in local revenues, primarily due to a growth in
retransmission consent fee revenues as a result of contractual rate increases and renewals, and a $9.4 million increase in
interactive revenues as a result of growth in the volume of advertising delivered through our network.
Historically, our revenues related to political advertising are stronger during federal election years, typically years ending
in an even number. In addition to federal elections, most state and local elections also occur on the same election cycle.
Consequently, political advertising sales during the year ended December 31, 2012 were higher than political advertising sales
during the year ended December 31, 2011 and 2013. We expect this trend of stronger political advertising sales during election
years to continue in the future.
The automotive category represented 26% of our local and national advertising sales during each of the years ended
December 31, 2013 and 2012.
Net revenues during the year ended December 31, 2012 increased by $153.5 million when compared with the prior year.
The increase was primarily due to a $68.3 million increase in political advertising sales, a $61 million increase in local
revenues, and a $13.9 million increase in interactive revenues, primarily as a result of a growth in customer base and new
product offerings. Also contributing to the increase was an $11.6 million increase in national advertising sales. Net revenues
for the year ending December 31, 2012 include $40.5 million that is attributable to television stations acquired during the
fourth quarter of 2012.
The automotive category, which represented 26% of our local and national advertising sales during the year ended
December 31, 2012, was up 15% as compared to 2011, during which the automotive category represented 24% of our local
and national advertising sales.
Direct operating expenses (excluding depreciation and amortization of intangible assets), which consist primarily of
news, engineering, and programming expenses, increased $90.9 million, or 57%, for the year ended December 31, 2013
compared to the prior year and $29.6 million, or 23%, for the year ended December 31, 2012, compared to the prior year.
Excluding the impact of the stations acquired during the fourth quarter of 2012 and the 2013 acquisitions of majority interests
in HYFN and Dedicated Media, direct operating expenses increased $28.1 million, or 19% for the year ending December 31,
2013 and $20.2 million, or 15% for the year ending December 31, 2012 as compared to their respective prior years. The
increase for both years is primarily the result of an increase in fees pursuant to network affiliation agreements, growth in
employee compensation expense, and higher costs of sales related to our digital operations.
Selling, general and administrative expenses consist primarily of employee salaries, sales commissions, employee
benefit costs, advertising, promotional expenses and research. These costs increased $37.3 million, or 30%, for the year ended
December 31, 2013, compared to the prior year. The increase was primarily a result of our 2012 television station acquisitions
as well as the 2013 acquisition of majority interests in HYFN and Dedicated Media.
Selling, general and administrative expenses increased $21.5 million, or 21%, for the year ended December 31, 2012,
compared to the prior year. Television stations acquired during 2012 accounted for $9.7 million of the increase. The remainder
of the increase was primarily due to higher variable costs attributable to the growth in revenue compared to the prior year.
Selling expenses as a percentage of net revenues were 6.8%, 6.6% and 7.4% for the years ended December 31, 2013,
2012 and 2011, respectively.
Amortization of program rights represents the recognition of expense associated with syndicated programming, features
and specials, and these costs increased $6.2 million, or 27%, for the year ended December 31, 2013 and increased $1.6 million,
or 8%, for the year ended December 31, 2012, compared to their respective prior years. The increases in both periods as
compared to their respective prior periods were attributable to the amortization of programming rights associated with the
television stations acquired during the fourth quarter of 2012.
Corporate expenses represent corporate executive management, accounting, legal and other costs associated with the
centralized management of our stations, and these costs increased $7.1 million, or 21%, for the year ended December 31,
2013, compared to the prior year. The increase was primarily due to $5.7 million of expenses incurred related to the JV Sale
Transaction and the Merger with LIN LLC, as well as an increase in employee compensation expense compared to the prior
year. Corporate expenses increased $7.8 million, or 29%, for the year ended December 31, 2012, compared to the prior year.
42
The increase was primarily due to increases in employee compensation and acquisition related expenses compared to the prior
year.
Depreciation expense increased $14.7 million, or 46%, for the year ended December 31, 2013 and $5.9 million, or 22%,
for the year ended December 31, 2012, compared to their respective prior years. The increase in both periods was primarily
attributable to the property and equipment associated with our acquisitions of television stations in the fourth quarter of 2012
and the acquisition of majority interests in HYFN and Dedicated Media in 2013.
Amortization of intangible assets increased $16.5 million, or 259%, for the year ended December 31, 2013 and $5.2
million, or 431% for the year ended December 31, 2012, compared to their respective prior years. The increases in both periods
was primarily attributable to the increase in finite-lived intangible assets from our television stations acquired in the fourth
quarter of 2012 and the 2013 acquisitions of the majority interest in HYFN and Dedicated Media.
Impairment of goodwill and broadcast licenses related to discontinued operations in the amount of $1.6 million were
recorded during the year ended December 31, 2011. For further information, see Note 6—"Intangible Assets" to our
consolidated financial statements.
Restructuring charges of $3.9 million, $1.0 million and, $0.7 million were recorded during the years ended December 31,
2013, 2012 and 2011, respectively. Restructuring charges incurred during the year ended December 31, 2013 were primarily
due to severance and related costs as a result of the integration of the television stations acquired during 2012. Restructuring
charges incurred during the years ended December 31, 2012 and 2011 primarily relate to the consolidation of certain activities
at our stations and our corporate headquarters
Contract termination costs of $3.9 million in 2013 were due to costs incurred in 2013 to terminate our contract with a
service provider that previously provided national sales representation. For further information, see Note 12 - "Restructuring
and Contract Termination Costs" to our consolidated financial statements.
Other Expense
Year Ended December 31,
2013
2012
2011
Components of other expense:
Interest expense, net ........................................................................................ $
Share of loss in equity investments.................................................................
Gain on derivative instruments .......................................................................
Loss on extinguishment of debt ......................................................................
Other expense, net...........................................................................................
Total other expense, net................................................................................ $
56,607
56
—
—
2,100
58,763
$
$
46,683
98,309
—
3,341
237
148,570
$
$
50,706
4,957
(1,960)
1,694
51
55,448
Interest expense, net increased $9.9 million, or 21%, for the year ended December 31, 2013 compared to the prior year
primarily as a result of the interest incurred on our 63/8% Senior Notes, which were issued during the fourth quarter of 2012
to finance a portion of the consideration paid to acquire the former New Vision television stations. This increase was partially
offset by a decrease in interest expense due to the redemption of our 61/2% Senior Subordinated Notes during the first quarter
of 2012 as well as reductions in interest expense under our senior secured credit facility, primarily attributable to reductions
in outstanding principal.
Interest expense, net decreased $4.0 million, or 8%, for the year ended December 31, 2012 compared to the prior year
primarily as a result of the redemption of our 61/2% Senior Subordinated Notes during the first quarter of 2012. This decrease
was partially offset by an increase in borrowings under our senior secured credit facility compared to the same period last
year as well as new debt issued in connection with the acquisition of the former New Vision stations.
43
The following table summarizes our total interest expense, net (in thousands):
For the year ended December 31,
2013
2012
2011
Components of interest expense:
Senior secured credit facility........................................................................... $
83/8% Senior Notes ..........................................................................................
63/8% Senior Notes ..........................................................................................
61/2% Senior Subordinated Notes ....................................................................
61/2% Senior Subordinated Notes—Class B ....................................................
Other................................................................................................................
Total interest expense, net............................................................................. $
18,751
17,387
19,396
—
—
1,073
56,607
$
$
19,651
17,389
4,401
595
306
4,341
46,683
$
$
2,389
17,389
—
18,002
10,505
2,421
50,706
Share of loss in equity investments decreased $98.3 million as compared to the prior year primarily due to a $100 million
accrual recorded in 2012 related to the capital contribution made to SVH in connection with the JV Sale Transaction and
corresponding release from the GECC Guarantee. That accrual was partially offset by the reversal of accrued shortfall funding
liabilities that were extinguished pursuant to the terms of the JV Sale Agreement, as further described in Item 1. "Business
—Joint Venture Sale Transaction" and in Note 13—"Commitments and Contingencies" to our consolidated financial
statements.
Other expense, net increased $1.9 million as compared to the prior year primarily as a result of an impairment recorded
during the third quarter of 2013 of a minority interest that we held in a website platform service provider.
Gain on derivative instruments during 2011 was approximately $2 million, which represented the change in fair value
of our interest rate hedge. The interest rate hedge was entered into during the second quarter of 2006 (the "2006 interest rate
hedge") in order to hedge the variability in cash flows associated with a notional amount of the declining balances of our term
loans under our previous senior secured credit facility. The 2006 interest rate hedge expired on November 4, 2011.
Consequently, there is no impact to our statement of operations for the years ended December 31, 2013 or 2012. For additional
information, refer to Note 8 - "Derivative Financial Instruments" to our consolidated financial statements.
Loss on extinguishment of debt during the year ended December 31, 2012 was primarily a result of the redemption of
our 61/2% Senior Subordinated Notes during January 2012 and the December 2012 amendment to our existing $75 million
revolving credit loans. The loss on extinguishment of debt during the year ended December 31, 2011 included a write down
of deferred financing fees as a result of the payment of principal on our revolving credit facility and term loans as further
described in "Description of Indebtedness." Additionally, the loss on extinguishment of debt during the year ended
December 31, 2011 included a write-down of deferred financing fees and unamortized discount due to the redemption of
$109.1 million of our 61/2% Senior Subordinated Notes, and $55.9 million of our 61/2% Senior Subordinated Notes—Class B.
Income taxes reflected a (benefit from) provision for income tax of $(125.4) million, $40.5 million and $(16.0) million
for the years ended December 31, 2013, 2012, and 2011, respectively. Our effective tax rate on pre-tax income was (402.2)%,
179.9% and (47.7)% for the years ended December 31, 2013, 2012 and 2011, respectively.
Our effective tax rate fluctuates from year to year. The factors that most impact our effective tax rate are changes to our
valuation allowance, changes in tax laws, allocation of income to the various state jurisdictions in which we operate, and
acquisition and divestiture transactions, including the JV Sale Transaction and the Merger.
Our effective tax rate for the year ended December 31, 2013 decreased from 2012 primarily due to a $124.3 million tax
benefit recognized as a result of the Merger as well as an $18.2 million tax benefit recognized as a result of the reversal of
state valuation allowances. These valuation allowances were reversed after evaluating our ability to recover certain net
operating loss carryforwards due to the change in tax structure as a result of the Merger, as it was determined that we will
more likely than not be able to realize these deferred tax assets.
The combined $142.5 million tax benefit described above was offset in part by a $12.8 million income tax provision as
a result of generating income from continuing operations, as well as a $2.2 million tax provision relating to state net operating
loss adjustments from apportionment changes and a $1.6 million tax provision for non-deductible acquisition related costs
incurred during 2013.
44
Our effective tax rate for the year ended December 31, 2012 increased from 2011, primarily due to the recognition of
$28.4 million of income tax expense related to the recognition of a taxable gain associated with the JV Sale Transaction, as
further described in Item 1. "Business—Joint Venture Sale Transaction."
The 2011 tax benefit is primarily a result of the 2011 reversal of $35.1 million of our federal valuation allowance relating
to 1999 to 2002 net operating losses and the 2011 reversal of $1.0 million of our state valuation allowance relating to 2002
to 2010 net operating losses. These valuation allowances were reversed primarily due to our recent history of taxable income,
and our projected ability to generate sufficient taxable income prior to the expiration of those net operating loss carryforwards.
Upon the reversal of the federal and state valuation allowances, as of December 31, 2011, we had a remaining valuation
allowance of $23.4 million placed against our deferred tax assets primarily related to state net operating loss carryforwards.
The combined 2011 $36.1 million income tax benefit described above was offset in part by a $5.1 million discrete
deferred income tax expense recognized in the second quarter of 2011, which resulted from state tax legislation enacted in
Michigan in May 2011, which repealed the Michigan business tax ("MBT"), and implemented a corporate income tax instead,
effective January 2012. As a result of the elimination of the MBT, certain future tax deductions that were available to be
utilized beginning in 2015, and had been recognized as deferred tax assets in our financial statements, were no longer deductible.
Therefore, during the year ended December 31, 2011, we recognized incremental deferred income tax expense of $5.1 million,
net of federal benefit, for the reversal of these previously established deferred tax assets.
Results of Discontinued Operations
Our consolidated financial statements reflect the operations, assets and liabilities of WWHO-TV in Columbus, OH and
WUPW-TV in Toledo, OH, as discontinued for all periods presented. The sale of WWHO-TV in Columbus, OH was completed
on February 16, 2012. The sale of WUPW-TV in Toledo, OH was completed on April 21, 2012. As a result, loss from
discontinued operations was $1.0 million and $0.9 million for the years ended December 31, 2012 and 2011, respectively.
For further information see Note 3—"Discontinued Operations" to our consolidated financial statements.
Liquidity and Capital Resources
Our liquidity position depends on our ability to generate cash from operations and to utilize borrowings under our senior
secured credit facility and/or obtain financing from other sources. Our ability to make use of the revolving credit facility and
to access the capital markets is contingent on our compliance with certain financial covenants, which are measured, in part,
by the level of EBITDA we generate from our operations. As of December 31, 2013, we were in compliance with all financial
and non-financial covenants under our senior secured credit facility. As of December 31, 2013, we had unrestricted cash and
cash equivalents of $12.5 million, and a $75 million revolving credit facility, of which $70 million and $45 million were
available as of December 31, 2013 and as of the date of this report, respectively.
Joint Venture Sale Transaction
On February 12, 2013, we, along with our wholly-owned subsidiaries LIN Television and LIN Texas entered into and
closed the JV Sale Transaction with Comcast Corporation, affiliates of NBCUniversal, the GE Parties and SVH, a joint venture
with NBCUniversal whereby LIN Texas sold its 20.38% equity interest in SVH for $1.00. In addition, in exchange for LIN
Television causing a $100 million capital contribution to be made to SVH (which was used to prepay a portion of the GECC
Note), LIN TV was released from the GECC Guarantee and any further obligations related to any shortfall funding agreements.
We accrued for and expensed the $100 million capital contribution to SVH to secure the release of the GECC Guarantee
and recorded the related tax effects of the JV Sale Transaction and the capital contribution in our consolidated financial
statements as of December 31, 2012 because it represented a probable and estimable obligation of the Company. In February
2013, we issued a $60 million incremental term loan, and utilized $40 million of cash on hand and borrowings under our
revolving credit facility to fund the $100 million capital contribution.
As a result of the JV Sale Transaction, after utilizing all of our available federal net operating loss (“NOL”) carryforwards
to offset the taxable gain recognized in such transaction, we had an approximate $162.8 million income tax payable remaining,
$131.5 million of which was extinguished as a result of the Merger as described below.
On July 30, 2013, LIN TV was merged with and into LIN LLC with LIN LLC continuing as the surviving entity. The
Merger enabled LIN TV to be classified as a partnership for federal income tax purposes and that change in classification was
treated as a liquidation of LIN TV for federal income tax purposes, with the result that LIN TV realized a capital loss in its
100% equity interest in LIN Television.
45
Based on an average of the opening and closing trading prices of LIN TV's class A common stock on the day of the
Merger, LIN TV realized a capital loss in the amount of approximately $343 million, which represents the difference between
its tax basis in the stock of LIN Television, and the fair market value of such stock as of July 30, 2013. The capital loss realized
and existing net operating losses were used to offset a portion of the capital gain recognized in the JV Sale Transaction and,
as a result, we realized cash savings of $131.5 million, resulting in a remaining tax liability of $31.3 million associated with
the JV Sale Transaction. We made state and federal tax payments to settle this tax liability during the fourth quarter of 2013.
We incurred approximately $5.7 million in transaction costs related to the JV Sale Transaction and the Merger during
the year ended December 31, 2013. These costs are classified as corporate expense in our consolidated statement of operations.
Below is a discussion of other significant sources and uses of cash and should be read in conjunction with our consolidated
statements of cash flows.
Operating activities
Cash provided by operating activities is primarily driven by our net revenues and changes in working capital as a result
of the timing of collections and payments. Our total net revenues have primarily been, and will primarily be affected by,
among other things, the following:
Continued growth in local and interactive revenues. During the years ended December 31, 2013 and 2012, our
local revenues, which include net local advertising sales, retransmission consent fees and revenues from our
television station websites and mobile applications, increased 35% and 24%, respectively, compared to their
respective prior years. Additionally, during the years ended December 31, 2013 and 2012, our interactive
revenues, which are generated by LIN Digital, Nami Media, HYFN and Dedicated Media, increased 85% and
51%, respectively. We expect further growth in our local revenues and interactive revenues, however, there can
be no assurance that this will occur.
Cyclical fluctuations. We experience significant fluctuations in our political advertising revenues since
advertising revenues are generally higher in even-numbered years due to additional revenues associated with
political advertising related to local and national elections. Political advertising revenues were $7.6 million,
$76.5 million, and $8.1 million for the years ended December 31, 2013, 2012, and 2011, respectively. We also
experience incremental advertising revenues associated with Olympic broadcasts during even-numbered years.
We experienced a significant decrease in advertising revenues during 2013 and expect an increase in advertising
revenues during 2014 as a result of these cyclical fluctuations.
Our employee benefit plan contributions include contributions to our pension
plan and our 401(k) Plan. Volatility in the debt and equity markets impacts the fair value of our pension plan
assets and ultimately the cash funding requirements of our pension plan. We contributed $5.4 million, $7.4 million
and $5.4 million to our pension plan during the years ended December 31, 2013, 2012 and 2011, respectively,
and anticipate contributing $5.7 million to our pension plan during 2014. We contributed approximately $4.8
million, $3.9 million, and $3.6 million to our 401(k) Plan during the years ended December 31, 2013, 2012 and
2011, respectively, and expect to contribute approximately $4.3 million to the plan during 2014.
We made cash payments related to certain restructuring
initiatives of $4.2 million, $0.8 million and $1.1 million during the years ended December 31, 2013, 2012 and
2011, respectively. For further details on these restructuring initiatives see Note 12—"Restructuring and Contract
Termination Costs" to our consolidated financial statements.
On October 2, 2009, LIN Television
acquired Red McCombs Media, LP, an online advertising and media services company based in Austin, TX,
which was rebranded as “LIN Digital” in the first quarter of 2013. In connection with the acquisition, we entered
into an incentive compensation arrangement with certain key members of management. The arrangement
provided payments to those employees based on a computation of EBITDA generated by LIN Digital during
2012. During the second quarter of 2013, we paid $8.9 million related to this incentive compensation arrangement.
In December 2013, we terminated an agreement with a service provider that provided
national sales representation and made a payment of $5.4 million to exit our agreement prior to its expiration.
Concurrent with the termination of the agreement, we released $1.5 million of deferred credits associated with
the terminated contract. The amount of the one-time termination payment, offset by the release of the deferred
credits has been reflected as contract termination costs in our consolidated statement of operations for 2013.
46
Investing activities
Cash used in investing activities has primarily been, and will primarily be affected by, among other things, the following:
In April 2013, LIN Television acquired a 60%
interest (calculated on a fully diluted basis) in Dedicated Media for $5.8 million and a 50.1% interest (calculated
on a fully diluted basis) in HYFN for $7.2 million. In connection with these acquisitions, we may be required
to purchase the remaining outstanding shares of Dedicated Media and HYFN in 2015 and 2016, respectively,
if certain financial targets as defined in each applicable purchase agreement are met. Our maximum potential
obligation under the Dedicated Media and HYFN agreements is $26 million, and $62.4 million, respectively.
However, we estimate that our total obligation will not exceed $45 million in the aggregate between 2015 and
2016. For further information see Note 2 — “Acquisitions” to our consolidated financial statements.
Capital expenditures. Capital expenditures increased $1.1 million to $29.4 million, and increased $8.2 million
to $28.2 million, for the years ended December 31, 2013 and 2012, respectively, compared to the respective
prior year. We anticipate capital expenditures of approximately $25 million during the year ended December 31,
2014, which we expect to fund using cash flows from operations.
Acquisition of Federated Media. On February 3, 2014, LIN Digital Media LLC, a wholly owned subsidiary of
LIN Television, acquired 100% of the capital stock of Federated Media Publishing, Inc. ("Federated Media").
Federated Media is a digital content and conversational marketing company that leverages the relationships and
content from its publishing network to deliver contextually relevant advertising and conversational and
engagement tools that reach agencies’ and brands’ targeted audiences across digital and social media platforms.
The purchase price totaled $22.4 million plus an adjustment for working capital delivered at closing and was
funded from cash on hand and amounts drawn on our revolving credit facility. For further information see Note
2 — “Acquisitions” to our consolidated financial statements.
Financing activities
Cash used in financing activities was primarily affected by, among other things, the following:
On February 12, 2013, we entered into a $60 million, 5 year incremental term loan
pursuant to the Credit Agreement governing LIN Television's senior secured credit facility. The proceeds of
the incremental facility, as well as cash on hand and cash from revolving borrowings, were used to fund the
$100 million transferred to SVH in the JV Sale Transaction.
We believe that our cash flows from current operations, together with available borrowings under our senior secured
credit facility, will be sufficient to meet our anticipated cash requirements for the next 12 months, and beyond. These cash
requirements include working capital, state and federal income taxes, capital expenditures, and scheduled interest and principal
payments. For our long-term liquidity needs, in addition to the sources described above, we may rely upon, among other
things, the issuance of long-term debt, the issuance of equity, or other financing sources available to us. Volatility and disruption
of the capital and credit markets could impact our ability to access such sources. Anticipated cash payments for our debt and
related interest are described below.
47
Contractual Obligations
The following table summarizes our estimated future contractual cash obligations as of December 31, 2013 (in
thousands)(1):
2014
Principal payments and mandatory
redemptions on debt(2) ...................................... $
Cash interest on debt(3) .....................................
Program payments(4) .........................................
Operating leases(5) ..............................................
Operating agreements(6) ...................................
Deferred compensation payments(7) ............
Total....................................................... $
2015-2016
17,364
53,079
27,119
3,860
41,216
130
142,768
$
53,484
104,231
44,062
6,076
43,994
317
252,164
$
2019 and
thereafter
2017-2018
$
$
574,105
87,119
3,286
4,284
9,473
115
678,382
$
$
301,768
50,617
214
7,062
77
453
360,191
Total
$
$
946,721
295,046
74,681
21,282
94,760
1,015
1,433,505
_______________________________________________________________________________
(1)
The amounts included in the table above do not include contingent payments for the remaining outstanding shares of Dedicated Media and
HYFN. For additional information regarding these contingent payments, see Note 2 - "Acquisitions."
(2)
An additional $25 million was outstanding on our revolving credit facility as of the date of this report and is not reflected in our balance
sheet as of December 31, 2013. We are obligated to make mandatory quarterly principal payments and to use proceeds of asset sales not
reinvested to pay-down the term loans under our senior secured credit facility. We are also obligated to repay in full our Senior Notes at
maturity as described in Item 1A. "Risk Factors—We may not be able to refinance all or a portion of our indebtedness or obtain additional
financing on satisfactory terms."
(3)
We have contractual obligations to pay cash interest on our senior secured credit facility and on our Senior Notes through April 15, 2018
and January 15, 2021, as well as commitment fees of 0.375% on our revolving credit facility, as described in "Description of Indebtedness".
(4)
We have entered into commitments for future syndicated news, entertainment, and sports programming. We have recorded $6.3 million of
program obligations as of December 31, 2013 and have unrecorded commitments of $68.4 million for programming that is not available
to air as of December 31, 2013.
(5)
We lease land, buildings, vehicles and equipment under non-cancelable operating lease agreements.
(6)
We have entered into a variety of agreements for services used in the operation of our stations including ratings services, consulting and
research services, news video services, news weather services, marketing services and other contracts under non-cancelable operating
agreements.
(7)
Includes scheduled payments to certain employees covered under our deferred compensation plans.
The above table excludes future payments for our defined benefit retirement plans, deferred taxes, uncertain tax positions,
and executive compensation, with the exception of scheduled deferred compensation payments detailed above, because their
future cash outflows are uncertain. For additional information regarding our financial commitments as of December 31, 2013
see Note 7—"Debt", Note 10 —"Retirement Plans" and Note 13 —"Commitments and Contingencies" to our consolidated
financial statements.
Summary of Cash Flows
The following table presents summarized cash flow information (in thousands):
Year Ended December 31,
Net cash provided by operating activities $
Net cash used in investing activities ........
Net cash provided by (used in) financing
activities ...................................................
Net (decrease) increase in cash and cash
equivalents ............................................... $
2013
2012
2011
48,967 $
(139,370)
146,699 $
(104,259)
62,660 $
(289,180)
(14,190)
56,621
(33,782) $
28,250
48
2013 vs. 2012
232,929
$
6,409
(97,732) $
(35,111)
70,811
$
(62,032) $
2012 vs. 2011
84,039
184,921
(247,119)
21,841
Net cash provided by operating activities decreased $97.7 million to $49 million for the year ended December 31, 2013
compared to cash provided by operating activities of $146.7 million for the prior year. The decrease is primarily attributable
to an $81.1 million decrease in operating income as well as an increase in cash outflows related to working capital of $9.2
million and an increase in cash interest expense of approximately $8.9 million.
Net cash provided by operating activities increased $84.0 million to $146.7 million for the year ended December 31,
2012, compared to cash provided by operating activities of $62.7 million for the prior year. The increase was primarily
attributable to an $82 million increase in operating income as compared to the year ended December 31, 2011.
Net cash used in investing activities increased $35.1 million to $139.4 million for year ended December 31, 2013,
compared to cash used in investing activities of $104.3 million for the year ended December 31, 2012. Net cash used in
investing activities during the year ended December 31, 2013 was comprised primarily of the $100 million capital contribution
made to the joint venture in February 2013 in connection with the JV Sale Transaction as well as capital expenditures of $29.4
million and payments made for the acquisitions of HYFN and Dedicated Media of $10.1 million (net of cash acquired).
Cash used in investing activities for the year ended December 31, 2012 decreased $184.9 million to $104.3 million.
The decrease was primarily attributable to a decrease in restricted cash that had been placed on irrevocable deposit as of
December 31, 2011 and was subsequently used to fund the aggregate redemption price of our 61/2% Senior Subordinated Notes
in January 2012. The decrease in restricted cash was partially offset by payments of $358.5 million (net of cash acquired) for
the acquisition of the New Vision and ACME television stations in 2012.
Net cash provided by financing activities was $56.6 million for the year ended December 31, 2013, compared to net
cash used in financing activities of $14.2 million for the prior year. The difference is primarily attributable to an increase of
$47.7 million in proceeds from long term debt, net of cash payments, as well as a decrease in cash outflows of $9.6 million
and $11.4 million related to debt financing costs and the purchase of treasury stock, respectively, which occurred during the
year ended December 31, 2012.
Net cash used in financing activities was $14.2 million for the year ended December 31, 2012, compared to net cash
provided by financing activities of $232.9 million for the prior year. The increase is primarily attributable to the redemption
of $252 million of our Senior Subordinated Notes during 2012, partially offset by a decrease in proceeds from borrowings
under our senior secured credit facility as further described in "Description of Indebtedness".
Description of Indebtedness
Debt consisted of the following (in thousands):
December 31,
2013
Senior Secured Credit Facility:
Revolving credit loans..............................................................................................................
$118,750 and $125,000 Term loans, net of discount of $345 and $435 as December 31,
2013 and December 31, 2012, respectively .............................................................................
$314,200 and $257,400 Incremental term loans, net of discount of $1,684 and $2,020 as of
December 31, 2013 and December 31, 2012, respectively ......................................................
8 3/8% Senior Notes due 2018.....................................................................................................
6 3/8% Senior Notes due 2021.....................................................................................................
Capital lease obligations .............................................................................................................
Other debt ...................................................................................................................................
Total debt ....................................................................................................................................
Less current portion ....................................................................................................................
Total long-term debt ...................................................................................................................
Total debt ....................................................................................................................................
Cash and cash equivalents ..........................................................................................................
Consolidated net debt(1) ...........................................................................................................................................
$
$
$
$
5,000
2012
$
—
118,405
124,565
312,516
200,000
290,000
14,604
4,167
944,692
17,364
927,328 $
944,692 $
(12,525)
932,167 $
255,380
200,000
290,000
14,881
5,401
890,227
10,756
879,471
890,227
(46,307)
843,920
_____________________________________________________________________
(1)
Consolidated net debt is a non-GAAP financial measure, and is equal to total debt less cash and cash equivalents. Beginning in
2012, for the purpose of our debt covenant calculations, our senior credit facility permits a maximum of $45 million in unrestricted
49
cash and cash equivalents to be offset against total debt in arriving at consolidated net debt. For purposes of the table above, we
have subtracted the total balance of our cash and cash equivalents in arriving at consolidated net debt. Consolidated net debt
provides investors with useful information about our financial position, and is one of the financial measures used to evaluate
compliance with our debt covenants.
Senior Secured Credit Facility
Our senior secured credit facility is comprised of a six-year, $125 million tranche A term loan and a five-year, $75 million
revolving credit facility, and bears interest at a rate based on, at our option, either a) the LIBOR interest rate, or b) the ABR
rate, which is an interest rate that is equal to the greatest of (i) the Prime Rate, (ii) the Federal Funds Effective Rate plus 1/2
of 1 percent, and (iii) the one-month LIBOR rate plus 1%. In addition, the rate we select also bears an applicable margin based
upon our Consolidated Senior Secured Leverage Ratio, currently set at 2.75% and 1.75% for LIBOR based loans and ABR
rate loans, respectively. Following the issuance of this report during the first quarter of 2014, these rates will be 3% and 2%
for LIBOR based loans and ABR rate loans, respectively. Lastly, the unused portion of the revolving credit facility is subject
to a commitment fee based upon our Consolidated Senior Secured Leverage Ratio, currently set at 0.375% and will increase
to 0.50% following the issuance of this report during the first quarter of 2014 for both LIBOR based loans and ABR rate
loans.
Our senior secured credit facility also includes a seven-year, $260 million tranche B incremental term loan facility and
a $60 million tranche B-2 incremental term facility that was funded on February 12, 2013 in connection with the JV Sale
Transaction, each of which is subject to the terms of our Credit Agreement. Borrowings under the incremental term loan
facility were used (i) to pay the call price for our redemption of all of our remaining 61/2% Senior Subordinated Notes, as
described below, and (ii) to pay accrued interest, fees and expenses associated with the redemption. Borrowings under the
incremental term loan facility bear interest at a rate based, at our option, on an adjusted LIBOR rate, plus an applicable margin
Base Rate shall at no time be less than 1% and 2%, respectively.
On December 24, 2012, we entered into an amendment to our Credit Agreement which (1) replaced our $257.4 million
tranche B term loan maturing in December 2018 with a new tranche B term loan of the same maturity which bears interest
at a reduced rate and (2) made certain other changes to the Credit Agreement, including changes to the financial covenants
therein that are favorable to LIN Television and its affiliates and (3) extended the maturity for a $60 million tranche of our
revolving credit facility to October 2017 and on May 9, 2013, we extended the maturity date of the remaining $15 million
tranche of our revolving credit facility to October 2017. We paid customary fees and expenses in connection with the closing
of these amendments. As a result of these amendments, we recorded a loss on extinguishment of debt of $1.2 million associated
with a write-down of deferred financing fees and unamortized discount to our consolidated statement of operations during
the three months ended December 31, 2012.
The terms of the Credit Agreement provide for customary representations and warranties, affirmative and negative
covenants (including financial covenants), and events of default. The Credit Agreement also provides for the payment of
customary fees and expenses by us. The senior secured credit facility can be accelerated upon events of default and require
the term loans to be prepaid under certain circumstances with amounts determined by reference to the proceeds from certain
asset sales (subject to reinvestment rights), the incurrence of certain indebtedness and a percentage of annual excess cash
flow.
The senior secured credit facility ranks senior in right of payment to our existing and future subordinated indebtedness.
LIN LLC and certain of our existing, or hereafter created or acquired, domestic subsidiaries guarantee the credit facilities on
a senior basis. LIN Television and each of our subsidiary guarantors have granted a security interest in all or substantially all
of our assets to secure the obligations under the senior secured credit facility, and LIN LLC has granted a security interest in
its capital stock of LIN Television to secure such obligations.
Our senior secured credit facility permits us to prepay loans and to permanently reduce the revolving credit commitments,
in whole or in part, at any time. We are also obligated to make mandatory quarterly principal payments. In addition, our senior
secured credit facility restricts the use of proceeds from asset sales not reinvested in our business and the use of proceeds
from the issuance of debt (subject to certain exceptions), which must be used for mandatory prepayments of principal of the
term loans.
The Credit Agreement governing our senior secured credit facility also requires on an annual basis, following the delivery
of our year-end financial statements, and commencing after the year ended December 31, 2012, mandatory prepayments of
principal of the term loans based on a computation of excess cash flow for the preceding fiscal year, as more fully described
50
in the Credit Agreement. However, based on the excess cash flow computation for the year ended December 31, 2013, we
will not be required to make such prepayments during the year ending December 31, 2014.
The incremental term loan facility is a senior secured obligation and ranks senior in right of payment to our existing
and future subordinated indebtedness. The incremental term loan facility is guaranteed and secured on the same basis as the
other credit facilities under the Credit Agreement. If we do not refinance, redeem or discharge our 83/8% Senior Notes on or
prior to January 15, 2018, then, in such event, the maturity of the incremental term loan facility will be accelerated from
December 21, 2018 to January 15, 2018.
The following table summarizes certain key terms including the LIBOR-based borrowing rates of our senior secured
credit facility as of December 31, 2013 (in thousands):
Credit Facility
Revolving
Facility
Final maturity date ..........................................................................................
10/26/2017
Available balance as of December 31, 2013................................................... $
70,000
Interest rate......................................................................................................
Applicable margin...........................................................................................
Total.................................................................................................................
0.17%
2.75%
2.92%
Term Loans
Incremental
Term Loans
10/26/2017
$
—
12/21/2018
$
—
0.17%
2.75%
2.92%
1.00%
3.00%
4.00%
During the year ended December 31, 2011, we recorded a loss on extinguishment of debt of $0.2 million consisting of
a write-down of deferred financing fees related to the revolving credit facility and term loans under our 2009 senior secured
credit facility.
8 /8% Senior Notes
83/8% Senior Notes
Final maturity date .........................................................................................................................................
Annual interest rate ........................................................................................................................................
Payable semi-annually in arrears ...................................................................................................................
4/15/2018
8.375%
April 15th
October 15th
Our 83/8% Senior Notes are unsecured but rank equally in right of payment with all senior secured indebtedness and
senior to all subordinated indebtedness.
The indenture governing our 83/8% Senior Notes contains covenants limiting our ability and the ability of our restricted
ricted
r
into certain transactions with affiliates. These covenants are subject to certain exceptions and qualifications. The indenture
also has change of control provisions which may require our Company to purchase our 83/8% Senior Notes at a price equal to
101% of the principal amount thereof, together with accrued and unpaid interest. Additionally, if we sell assets under certain
circumstances, we will be required to make an offer to purchase our 83/8% Senior Notes at their face amount, plus accrued
and unpaid interest, if any, through the purchase date.
6 /8% Senior Notes
63/8% Senior Notes
Final maturity date .........................................................................................................................................
Annual interest rate ........................................................................................................................................
Payable semi-annually in arrears ...................................................................................................................
51
1/15/2021
6.375%
January 15th
July 15th
On October 12, 2012, we completed the issuance and sale of $290 million in aggregate principal amount of our 63/8%
Senior Notes. The net proceeds of our 63/8% Senior Notes were used to fund the remaining purchase price for the acquisition
of the New Vision stations as further described in Note 2—"Acquisitions" to our consolidated financial statements.
Our 63/8% Senior Notes are unsecured but rank equally in right of payment with all senior secured indebtedness and
senior to all subordinated indebtedness.
The indenture governing our 63/8% Senior Notes contains covenants limiting our ability and the ability of our restricted
ricted
r
into certain transactions with affiliates. These covenants are subject to certain exceptions and qualifications. The indenture
also has change of control provisions which may require our Company to purchase our 63/8% Senior Notes at a price equal to
101% of the principal amount thereof, together with accrued and unpaid interest. Additionally, if we sell assets under certain
circumstances, we will be required to make an offer to purchase our 63/8% Senior Notes at their face amount, plus accrued
and unpaid interest, if any, through the purchase date.
6/
/
During the year ended December 31, 2012, we redeemed $252 million of our 61/2% Senior Subordinated Notes. The
redemption of these notes, at par, was funded in part by proceeds from the term loan, incremental term loan, the revolving
credit facility and cash on hand. As a result of these redemptions, during the year ended December 31, 2012, we recorded a
loss on extinguishment of debt of $2.1 million associated with a write-down of deferred financing fees and unamortized
discount to our consolidated statement of operations.
As part of the transactions further described in Note 2—"Acquisitions," to our consolidated financial statements we
assumed $15.1 million in capital lease obligations related to land, buildings, vehicles and equipment. These leases mature
over a period of four to nineteen years and are payable in monthly installments. The amortization related to the capital lease
obligations is recorded within depreciation. The total outstanding balance of these capital lease obligations was $14.6 million
as of December 31, 2013. LIN Television fully and unconditionally guarantees these lease obligations.
During the year ended December 31, 2012, Vaughan, a consolidated VIE, entered into a term loan with an unrelated
third party in an original principal amount of $4.6 million to fund a portion of the purchase price for the television stations
from PBC that were acquired by Vaughan. This term loan matures in equal quarterly installments through October 2017. LIN
Television fully and unconditionally guarantees this loan.
During the year ended December 31, 2012, KASY, a consolidated VIE, entered into a term loan with an unrelated third
party in an original principal amount of $1.7 million to fund a portion of the purchase price for the acquisition of certain assets
of KASY-TV, KRWB-TV, and KWBQ-TV. This term loan matures in equal quarterly installments through December 2017.
LIN Television fully and unconditionally guarantees this loan.
During the year ended December 31, 2011, WBDT, a consolidated VIE, entered into a term loan with an unrelated third
party in an original principal amount of $0.9 million to fund a portion of the purchase price for the acquisition of certain assets
of WBDT-TV. This term loan matures in equal quarterly installments through May 2016. LIN Television fully and
unconditionally guarantees this loan.
The following table summarizes scheduled future principal repayments on our debt agreements (in thousands):
52
Revolving
Facilities
Final maturity date..
Term Loans
10/26/2017
Incremental
Term Loans
10/26/2017
4/15/2018
1/15/2021
12/21/2018
$ 14,604
$
3,200
—
—
25,000
3,200
—
—
2017 ........................
5,000
62,500
3,200
—
—
2018 ........................
—
—
301,400
200,000
—
—
$
118,750
—
290,000
18,750
—
—
$
—
$
$
—
—
314,200
$
200,000
$
Total
Various
290,000
—
2016 ........................
5,000
3,200
Other Debt
Various
$
2015 ........................
Total........................ $
$
Capital
Leases
502
528
620
577
609
11,768
—
(1)
12,500
63/8% Senior
Notes
2014 ........................ $
2019 and thereafter.
$
83/8% Senior
Notes
$
1,162
$ 17,364
1,162
23,640
1,024
29,844
819
72,096
—
502,009
—
301,768
4,167
$ 946,721
____________________________________________________________
(1)
An additional $25 million was drawn on our revolving credit facility during January and February 2014 and is not reflected in our
balance sheet as of December 31, 2013.
The fair values of our long-term debt are estimated based on quoted market prices for the same or similar issues (Level 2
of the fair value hierarchy). The carrying amounts and fair values of our long-term debt were as follows (in thousands):
December 31, 2013
Carrying
Amount
Revolving credit loans......................................................... $
Term loans ...........................................................................
Senior notes .........................................................................
Other debt ............................................................................
Total..................................................................................... $
5,000
430,921
490,000
4,167
930,088
December 31, 2012
Estimated
Fair Value
$
$
5,000
432,105
512,983
4,167
954,255
Carrying
Amount
$
$
—
379,945
490,000
5,401
875,346
Estimated
Fair Value
$
$
—
380,599
524,500
5,401
910,500
We record program rights agreements on our balance sheet on the first broadcast date the programs are available for
air. As a result, we have commitments for future program rights agreements not recorded on our balance sheet as of
December 31, 2013 of $68.4 million, as detailed in Note 13 —"Commitments and Contingencies" to our consolidated financial
statements.
Item 7A.
Quantitative and Qualitative Disclosures About Market Risk
We are exposed to market risk related to interest rates on our senior secured credit facility debt. In accordance with our
interest rate risk management policy, we do not enter into derivative instruments unless there is an underlying exposure, and
we do not enter into derivative financial instruments for speculative trading purposes.
Interest Rate Risk
Our total debt as of December 31, 2013 was $944.7 million, including the current portion of $17.4 million, of which
our 83/8% Senior Notes and 63/8% Senior Notes bear a fixed interest rate and the credit facility bears an interest rate based on,
either a) the LIBOR interest rate, or b) the ABR rate, which is an interest rate that is equal to the greatest of (i) the Prime Rate,
(ii) the Federal Funds Effective Rate plus 1/2 of 1 percent, and (iii) the one-month LIBOR rate plus 1%. In addition, the rate
we select also bears an applicable margin based upon our consolidated senior secured leverage ratio, set at 2.75% and 1.75%
for LIBOR based loans and ABR rate loans, respectively, as of the date of this report. Following the issuance of this report
during the first quarter of 2014, these rates will be 3% and 2% for LIBOR based loans and ABR rate loans, respectively.
Additionally, borrowings under the incremental term loan facility bear interest at a rate based, at our option, on an adjusted
adjusted LIBOR rate and the adjusted Base Rate shall at no time be less than 1% and 2%, respectively.
Accordingly, we are exposed to potential losses related to increases in interest rates. The outstanding balance on our
senior secured credit facility was $435.9 million as of December 31, 2013. Therefore, a hypothetical 1% increase in the floating
rate used as the basis for the interest charged on our senior secured credit facility as of December 31, 2013 would increase
our annualized interest expense by $4.4 million, assuming such amounts remain outstanding under the facility.
53
Item 8.
Financial Statements and Supplementary Data
See index on page F-1.
Item 9.
Changes in and Disagreements with Accountants on Accounting and Financial Disclosure
None.
Item 9A.
Controls and Procedures
a) Evaluation of disclosure controls and procedures. Our management, with the participation of our Chief
Executive Officer and Chief Financial Officer, evaluated the effectiveness of our disclosure controls and procedures as of
December 31, 2013. The term "disclosure controls and procedures," as defined in Rules 13a-15(e) and 15d-15(e) under the
Exchange Act, means controls and other procedures of a company that are designed to provide reasonable assurance that
information required to be disclosed by a company in the reports that it files or submits under the Exchange Act is recorded,
processed, summarized and reported, within the time periods specified in the SEC's rules and forms. Disclosure controls and
procedures include, without limitation, controls and procedures designed to provide reasonable assurance that information
required to be disclosed by a company in the reports that it files or submits under the Exchange Act is accumulated and
communicated to the company's management, including its principal executive and principal financial officers, as appropriate
to allow timely decisions regarding required disclosure. Management recognizes that any controls and procedures, no matter
how well designed and operated, can provide only reasonable assurance of achieving their objectives and management
necessarily applies its judgment in evaluating the cost-benefit relationship of possible controls and procedures. Based on the
evaluation of our disclosure controls and procedures as of December 31, 2013, our Chief Executive Officer and Chief Financial
Officer concluded that, as of such date, our disclosure controls and procedures were effective at the reasonable assurance
level.
b) Management's Report on Internal Control Over Financial Reporting. Our management is responsible for
establishing and maintaining adequate internal control over financial reporting, as defined in Exchange Act Rule 13a-15(f).
Because of its inherent limitations, internal control over financial reporting may not prevent or detect misstatements. Also,
projections of any evaluation of effectiveness to future periods are subject to the risk that controls may become inadequate
because of changes in conditions, or that the degree of compliance with the policy or procedures may deteriorate. Under the
supervision and with the participation of our management, including our Chief Executive Officer and Chief Financial Officer,
we have conducted an evaluation of the effectiveness of our internal control over financial reporting based upon the Internal
Control—Integrated Framework (1992) issued by the Committee of Sponsoring Organizations of the Treadway Commission.
As permitted by the SEC, we have excluded the acquisitions of Dedicated Media and HYFN from our evaluation as of
December 31, 2013 because those companies were acquired by us in purchase business combinations in April 2013. Dedicated
Media and HYFN assets each represent 1% of consolidated total assets as of December 31, 2013 and net revenues from
Dedicated Media and HYFN represent 3% and less than 1%, respectively, of consolidated net revenue for the year ending
December 31, 2013. Based on this evaluation, which excludes Dedicated Media and HYFN, our Chief Executive Officer and
Chief Financial Officer have concluded that our internal control over financial reporting was effective as of December 31,
2013.
The effectiveness of our internal control over financial reporting as of December 31, 2013 has been audited by
PricewaterhouseCoopers LLP, an independent registered public accounting firm, as stated in their report which is included
herein.
c) Changes in internal controls. There were no changes in our internal control over financial reporting identified
in connection with the evaluation that occurred during the quarter ended December 31, 2013 that have materially affected or
are reasonably likely to materially affect our internal control over financial reporting.
Item 9B.
Other Information
None.
54
PART III
Item 10.
Directors and Executive Officers and Corporate Governance
Information regarding members of our Board of Directors is contained in our Proxy Statement for the 2014 Annual
Meeting of the Shareholders under the caption "Directors and Executive Officers" and is incorporated herein by reference.
Information regarding our executive officers is contained in our Proxy Statement for the 2014 Annual Meeting of the
Shareholders under the caption "Executive Officers" and is incorporated herein by reference. Information regarding Section 16
(a) compliance is contained in our Proxy Statement for the 2014 Annual Meeting of Shareholders under the caption "Security
Ownership of Certain Beneficial Owners and Management" and is incorporated herein by reference. Information regarding
our Audit Committee and our Audit Committee Financial Expert is contained in our Proxy Statement for the 2014 Annual
Meeting of the Shareholders under the caption "Report of the Audit Committee of our Board of Directors" and is incorporated
herein by reference.
Item 11.
Executive Compensation
The information required by this item is contained in our Proxy Statement for the 2014 Annual Meeting of Shareholders
under the captions "Compensation Discussion and Analysis," "Director Compensation," "Report of the Compensation
Committee of our Board of Directors," and "Compensation Committee Interlocks and Insider Participation," which is
incorporated by reference in this report.
Item 12.
Security Ownership of Certain Beneficial Owners and Management and Related Shareholder Matters
The following table provides information about the securities authorized for issuance under our share-based
compensation plans, including our Amended and Restated 1998 Stock Option Plan, Amended and Restated 2002 Stock Plan
and Amended and Restated 2002 Non-Employee Director Stock Plan, as of December 31, 2013:
Number of securities to
be issued upon exercise
of outstanding options
warrants and rights
Plan category
Share-based compensation plans approved by security
holders...................................................................................
Share-based compensation plans not approved by security
holders...................................................................................
4,412,352
Weighted-average
exercise price of
outstanding options
warrants and rights
$
—
Number of securities
remaining available
for future issuance
under the stock-based
compensation plans(1)
3.58
2,375,605
—
—
_______________________________________________________________________________
(1)
Includes 1,027,267 shares available for future issuance under the Amended and Restated 2002 Stock Plan, and excludes 1,552,983 shares
under plans in effect prior to 2002 from which we do not intend to re-grant and consider unavailable for future grant, and 1,348,338
shares available for future issuance under the Amended and Restated 2002 Non-Employee Director Stock Plan. Both the Amended and
Restated 2002 Stock Plan and the Amended and Restated 2002 Non-Employee Director Stock Plan, in addition to the future grant of
share options, permit the grant of "share awards" that may take the form of restricted or unrestricted shares, with or without payment for
such share awards.
All other information required by this item is contained in our Proxy Statement for the 2014 Annual Meeting of
Shareholders under the caption "Security Ownership of Certain Beneficial Owners and Management", which is incorporated
by reference in this report.
Item 13.
Certain Relationships and Related Transactions and Director Independence
The response to this item is contained in our Proxy Statement for the 2014 Annual Meeting of Shareholders under the
caption "Certain Relationships and Related Transactions", which is incorporated by reference in this report.
55
Item 14.
Principal Accounting Fees and Services
The response to this item is contained in our Proxy Statement for the 2014 Annual Meeting of Shareholders under the
caption "Independent Registered Public Accounting Firm Fees and Other Matters", which is incorporated by reference in this
report.
56
PART IV
Item 15.
Exhibits and Financial Statement Schedules
(a) See Index to Financial Statements on page F-1.
(b) Exhibits.
No.
Description
2.1
3.1
3.2
3.3
3.4
3.5
4.1
4.2
4.3
4.4
Agreement and Plan of Merger, dated as of February 12, 2013, among LIN TV Corp. and LIN Media LLC (filed
as Exhibit 2.2 to LIN TV Corp.'s and LIN Television Corporation's Current Report on Form 8-K on February
15, 2013 and incorporated herein by reference).
Certificate of Formation of LIN Media LLC, dated as of February 11, 2013 (filed as Exhibit 3.1 Annex B to the
proxy statement/prospectus that is part of the Registration Statement on Form S-4 of LIN Media LLC (File No.
333-188297))and incorporated by reference herein).
Amended and Restated Limited Liability Company Agreement, dated July 30, 2013 (filed as Exhibit 3.1 to LIN
Media LLC's Current Report on Form 8-K on July 31, 2013 and incorporated herein by reference).
Form of specimen share certificate for class A common shares representing limited liability company interests
in LIN Media LLC (included as Exhibit A to Annex B to the proxy statement/prospectus that is part of the
Registration Statement on Form S-4 of LIN Media LLC (File No. 333-188297)) and incorporated by reference
herein.
Restated Certificate of Incorporation of LIN Television Corporation (filed as Exhibit 3.1 to the Quarterly Report
on Form 10-Q of LIN TV Corp. and LIN Television Corporation for the fiscal quarter ended June 30, 2003 and
incorporated herein by reference).
Restated Bylaws of LIN Television Corporation (filed as Exhibit 3.4 to the Registration Statement on Form S-1
of LIN Television Corporation and LIN Holding Corp. (Registration No. 333-54003 and incorporated herein by
reference))
Indenture, dated as of April 12, 2010, among LIN Television Corporation, the guarantors named therein and The
Bank of New York Mellon Trust Company, N.A., as Trustee, for the 83/8% Senior Notes due 2018 (filed as
Exhibit 4.1 to LIN TV Corp.'s Current Report on Form 8-K filed on April 15, 2010 and incorporated herein by
reference)
Supplemental Indenture, dated as of July 30, 2013, among LIN Media LLC, LIN Digital Media LLC, LIN Digital
LLC, LIN Television Corporation and The Bank of New York Mellon Trust Company, N.A., as Trustee, amending
the Indenture, dated as of April 12, 2010 (filed as Exhibit 4.2 to LIN Media LLC's Current Report on Form 8-K
filed July 31, 2013 and incorporated herein by reference).
Supplemental Indenture, dated as of January 15, 2013, among LIN Mobile, LLC, LIN Television Corporation
and The Bank of New York Mellon Trust Company, N.A., as Trustee amending the Indenture, dated as of April
12, 2010 (filed as Exhibit 4.3 to LIN TV Corp.'s Annual Report on Form 10-K filed on March 15, 2013 and
incorporated herein by reference).
Indenture, dated as of October 12, 2012, among LIN Television Corporation, the guarantors named therein and
The Bank of New York Mellon Trust Company, N.A., as Trustee, for the 6.375% Senior Notes due 2021 (filed
as Exhibit 4.1 to LIN TV Corp.'s Current Report on Form 8-K filed as of October 17, 2012 and incorporated
herein by reference).
4.5
Supplemental Indenture, dated as of July 30, 2013, among LIN Media LLC, LIN Digital Media LLC, LIN Digital
LLC, LIN Television Corporation and The Bank of New York Mellon Trust Company, N.A., as Trustee, amending
the Indenture, dated as of October 12, 2012 (filed as Exhibit 4.4 to LIN Media LLC's Current Report on Form
8-K filed July 31, 2013 and incorporated herein by reference).
4.6
Supplemental Indenture, dated as of January 15, 2013, among LIN Mobile, LLC, LIN Television Corporation
and The Bank of New York Mellon Trust Company, N.A., as Trustee amending the Indenture, dated as of October
12, 2012 (filed as Exhibit 4.5 to LIN TV Corp.'s Annual Report on Form 10-K filed on March 15, 2013 and
incorporated herein by reference).
LIN Media LLC 1998 Stock Option Plan (as amended and restated effective as of July 30, 2013) (filed as
Exhibit 99.2 to the Registration Statement on Form S-8 filed on July 31, 2013 and incorporated herein by
reference).
10.1 *
57
No.
Description
10.2 *
LIN Media LLC 2002 Stock Plan (as amended and restated effective as of July 30, 2013) (filed as Exhibit 99.3
to the Registration Statement on Form S-8 filed on July 31, 2013 and incorporated herein by reference).
10.3 *
LIN Media LLC amended and restated 2002 Non-Employee Director Stock Plan (as amended and restated
effective as of July 30, 2013) (filed as Exhibit 99.4 to the Registration Statement on Form S-8 filed on July 31,
2013 and incorporated herein by reference).
10.4 *
Supplemental Benefit Retirement Plan of LIN Television Corporation and Subsidiary Companies (as amended
and restated effective December 21, 2004) (filed as Exhibit 10.38 to the LIN TV Corp. Annual Report on Form 10K for the fiscal year ended December 31, 2004 and incorporated herein by reference) filed March 16, 2005.
10.5 *
Second Amendment to the Supplemental Benefit Retirement Plan of LIN Television Corporation and Subsidiary
Companies, dated as of December 23, 2008 (filed as Exhibit 10.8 to the LIN TV Corp. Annual Report on Form 10K for the fiscal year ended December 31, 2008 and incorporated herein by reference).
10.6 *
LIN Television Corporation Supplemental Income Deferral Plan Effective July 1, 2010 (filed as Exhibit 10.7 to
the LIN TV Corp. Form 10-Q filed as of July 29, 2010 and incorporated herein by reference herein).
10.7 *
Form of Employee Grant Option Agreement (filed as Exhibit 10.19 to LIN TV Corp.'s Annual Report on Form 10K filed on March 15, 2007 and incorporated herein by reference).
Form of Non-Employee Director Grant Option Agreement (filed as Exhibit 10.23 to LIN TV Corp.'s Annual
Report on Form 10-K filed as of March 15, 2007 and incorporated herein by reference).
Form of a Non-Qualified Stock Option Letter Agreement (filed as Exhibit 10.6 to LIN TV Corp.'s Current Report
on Form 8-K filed as of July 6, 2005 and incorporated herein by reference).
Form of Restricted Stock Agreement (Filed as Exhibit 10.1 to the Current Report on Form 8-K filed as of
August 16, 2005 and incorporated herein by reference).
Clarification of the Supplemental Benefit Retirement Plan of LIN Television Corporation and Subsidiary
Companies, dated October 29, 2009. (Filed as Exhibit 10.7 to LIN Television Corporation's Form 10-Q filed as
of November 3, 2009 and incorporated herein by reference).
Amended and Restated Employment Agreement, dated September 27, 2013, among LIN Media LLC, LIN
Television Corporation and Vincent L. Sadusky (Filed as Exhibit 10.1 to LIN Television Corporation's Form 8K filed on September 27, 2013 and incorporated herein by reference).
Amended and Restated Employment Agreement, dated September 27, 2013, among LIN Media LLC, LIN
Television Corporation and Richard J. Schmaeling (Filed as Exhibit 10.2 to LIN Television Corporation's Form
8-K filed on September 27, 2013 and incorporated herein by reference).
Amended and Restated Employment Agreement, dated September 27, 2013, among LIN Media LLC, LIN
Television Corporation and Robert Richter (Filed as Exhibit 10.3 to LIN Television Corporation's Form 8-K filed
on September 27, 2013 and incorporated herein by reference).
Amended and Restated Employment Agreement, dated September 27, 2013, among LIN Media LLC, LIN
Television Corporation and Denise M. Parent (Filed as Exhibit 10.4 to LIN Television Corporation's Form 8-K
filed on September 27, 2013 and incorporated herein by reference).
Amended and Restated Employment Agreement, dated January 6, 2014, among LIN Media LLC, LIN Television
Corporation and John A. Howell IV (Filed as Exhibit 10.1 to LIN Media LLC's Form 8-K filed on January 7,
2014 and incorporated herein by reference).
10.8 *
10.9 *
10.10 *
10.11 *
10.12 *
10.13 *
10.14 *
10.15 *
10.16 *
10.17
10.18
Credit Agreement dated as of October 26, 2011, among LIN Television Corporation, as the Borrower, the Lenders
Party therein, JPMorgan Chase Bank, N.A., as Administrative Agent, as an Issuing Lender and as Swingline
Lender, Deutsche Bank Securities, Inc. and Wells Fargo Bank, N.A., as Co-Syndication Agents, Suntrust Bank,
Bank of America, N.A., and U.S. Bank, N.A., as Co-Documentation Agents, and the other parties thereto (the
"Credit Agreement") (Filed as Exhibit 10.1 to LIN Television Corporation's Form 10-Q filed as of November 8,
2011 and incorporated herein by reference).
First Amendment, dated as of December 19, 2011, to Credit Agreement, dated as of October 26, 2011, among
LIN Television Corporation, the several Lenders party thereto, JPMorgan Chase Bank, N.A., as Administrative
Agent, an Issuing Lender and Swingline Lender, Deutsche Bank Securities Inc., and Wells Fargo Bank, N.A., as
Co-Syndication Agents, Suntrust Bank, Bank of America, N.A. and U.S. Bank, N.A., as Co-Documentation
Agents, and the other parties thereto (Filed as Exhibit 99.2 to LIN Television Corporation's Current Report on
Form 8-K filed as of December 22, 2011 and incorporated herein by reference).
58
No.
Description
10.19
10.20
10.21
10.22
10.23
21
23.1
23.2
31.1
31.2
31.3
31.4
32.1
32.2
101.INS
101.SCH
101.CAL
101.LAB
101.PRE
101.DEF
**
**
**
**
**
**
Second Amendment, dated as of December 24, 2012, to Credit Agreement, Exhibit 99.1 dated as of October 26,
2011, among LIN Television Corporation, the several Lenders party thereto, JPMorgan Chase Bank N.A., as
Administrative Agent, an Issuing Lender and Swingline Lender, Deutsche Bank Securities Inc. and Wells Fargo
Bank, N.A. as Co-Syndication Agents, Suntrust Bank, Bank of America, N.A. and U.S. Bank, N.A., as CoDocumentation Agents, and the other parties thereto (Filed as Exhibit 99.2 to our Form 8-K filed as of
December 27, 2012 and incorporated herein by reference).
Incremental Term Loan Activation Notice, Tranche B Term Facility, dated December 21, 2011, by and among
LIN Television Corporation, the several Lenders party thereto, JPMorgan Chase Bank N.A. as Administrative
Agent, and the Incremental Lenders signatory thereto. (Filed as Exhibit 99.1 to LIN Television Corporation's
Current Report on Form 8-K filed as of December 22, 2011 and incorporated herein by reference).
Incremental Term Loan Activation Notice Tranche B-2 Term Facility, dated as of February 12, 2013, by and
between LIN Television Corporation and Deutsche Bank Trust Company Americas (Filed as Exhibit 10.1 to LIN
Television Corporation's Form 8-K filed as of February 15, 2013 and incorporated herein by reference).
Transaction Agreement, dated as of February 12, 2013, by and among LIN TV Corp., LIN Television Corporation,
LIN Television of Texas, L.P., NBC Telemundo License LLC, NBCU New LLC I, NBCU New LLC II, General
Electric Company, General Electric Capital Corporation, National Broadcasting Company Holding, Inc. Comcast
Corporation, Lone Star SPV, LLC, Station Venture Holdings, LLC and NBCUniversal Media,LLC (Filed as
Exhibit 2.1 to LIN Television Corporation's Form 8-K filed as of February 15, 2013 and incorporated herein by
reference).
Stock Purchase Agreement, dated January 27, 2014, between LIN Digital Media LLC and FMPL Holdings, Inc.,
the sole stockholder of Federated Media Publishing, Inc. filed as Exhibit 10.23 herein.
Subsidiaries of the Registrant
Consent of PricewaterhouseCoopers LLP
Consent of PricewaterhouseCoopers LLP
Certification pursuant to Section 302 of the Sarbanes-Oxley Act of 2002 of the Chief Executive Officer of LIN
Media LLC
Certification pursuant to Section 302 of the Sarbanes-Oxley Act of 2002 of the Chief Financial Officer of LIN
Media LLC
Certification pursuant to Section 302 of the Sarbanes-Oxley Act of 2002 of the Chief Executive Officer of LIN
Television Corporation
Certification pursuant to Section 302 of the Sarbanes-Oxley Act of 2002 of the Chief Financial Officer of LIN
Television Corporation
Certification pursuant to Section 906 of the Sarbanes-Oxley Act of 2002 of the Chief Executive Officer and Chief
Financial Officer of LIN Media LLC
Certification pursuant to Section 906 of the Sarbanes-Oxley Act of 2002 of the Chief Executive Officer and Chief
Financial Officer of LIN Television Corporation
XBRL Instance Document
XBRL Taxonomy Extension Schema Document
XBRL Taxonomy Extension Calculation Linkbase Document
XBRL Taxonomy Extension Label Linkbase Document
XBRL Taxonomy Extension Presentation Linkbase Document
XBRL Taxonomy Extension Definition Linkbase Document
_______________________________________________________________________________
*
Management contracts and compensatory plans or arrangements required to be filed as an exhibit pursuant
to Item 15(b) of Form 10-K.
**
Pursuant to Rule 406T of Regulation S-T, these interactive data files are deemed not filed or part of a
registration statement or prospectus for purposes of Sections 11 or 12 of the Securities Act of 1933 or
Section 18 of the Securities Exchange Act of 1934 and otherwise are not subject to liability.
(c) Financial Statement Schedule
The following financial statement schedule is filed herewith:
Schedule I—Condensed Financial Information of the Registrant
59
SIGNATURES
Pursuant to the requirements of Section 13 or 15(d) of the Securities Exchange Act of 1934, each of LIN Media LLC
and LIN Television Corporation, has duly caused this report to be signed on its behalf by the undersigned, thereunto duly
authorized.
LIN Media LLC
LIN Television Corporation
Date: March 3, 2014
/s/ VINCENT L. SADUSKY
Vincent L. Sadusky
Pursuant to the requirements of the Securities Exchange Act of 1934, this report has been signed by the following
persons on behalf of each of LIN Media LLC and LIN Television Corporation in the capacities and on the dates indicated.
Signature
/s/ VINCENT L. SADUSKY
Vincent L. Sadusky
Title
Date
President, Chief Executive Officer and
Director (Principal Executive Officer)
March 3, 2014
/s/ RICHARD J. SCHMAELING
Richard J. Schmaeling
Senior Vice President,
Chief Financial Officer
(Principal Financial Officer)
March 3, 2014
/s/ NICHOLAS N. MOHAMED
Nicholas N. Mohamed
Vice President, Controller
(Principal Accounting Officer)
March 3, 2014
/s/ WILLIAM S. BANOWSKY, JR.
William S. Banowsky, Jr.
Director
March 3, 2014
/s/ PETER S. BRODSKY
Peter S. Brodsky
Director
March 3, 2014
/s/ ROYAL W. CARSON, III
Royal W. Carson, III
Director
March 3, 2014
/s/ DR. WILLIAM H. CUNNINGHAM
Dr. William H. Cunningham
Director
March 3, 2014
Chairman of the Board
March 3, 2014
/s/ JOHN R. MUSE
John R. Muse
Director
March 3, 2014
/s/ MICHAEL A. PAUSIC
Michael A. Pausic
Director
March 3, 2014
/s/ DOUGLAS W. MCCORMICK
Douglas W. McCormick
60
Index to Financial Statements
LIN Media LLC
Report of Independent Registered Public Accounting Firm ..........................................................................................
F-2
Consolidated Balance Sheets .........................................................................................................................................
F-4
Consolidated Statements of Operations .........................................................................................................................
F-5
Consolidated Statement of Comprehensive Income (Loss) ...........................................................................................
F-6
Consolidated Statements of Shareholders' Equity (Deficit)...........................................................................................
F-7
Consolidated Statements of Cash Flows ........................................................................................................................
F-10
Notes to Consolidated Financial Statements..................................................................................................................
LIN Television Corporation
F-11
Report of Independent Registered Public Accounting Firm ..........................................................................................
F-56
Consolidated Balance Sheets .........................................................................................................................................
F-57
Consolidated Statements of Operations .........................................................................................................................
F-58
Consolidated Statements of Comprehensive Income (Loss)..........................................................................................
F-59
Consolidated Statements of Stockholder's Equity (Deficit)...........................................................................................
F-60
Consolidated Statements of Cash Flows ........................................................................................................................
F-63
Notes to Consolidated Financial Statements..................................................................................................................
Financial Statement Schedule
F-64
Schedule I—Condensed Financial Information of the Registrant .................................................................................
F-95
F-1
Report of Independent Registered Public Accounting Firm
To the Board of Directors and Shareholders of LIN Media LLC:
In our opinion, the consolidated financial statements listed in the accompanying index present fairly, in all material respects,
the financial position of LIN Media LLC and its subsidiaries at December 31, 2013 and December 31, 2012, and the results
of their operations and their cash flows for each of the three years in the period ended December 31, 2013 in conformity with
accounting principles generally accepted in the United States of America. In addition, in our opinion, the financial statement
schedule listed in the accompanying index presents fairly, in all material respects, the information set forth therein when read
in conjunction with the related consolidated financial statements. Also in our opinion, the Company maintained, in all material
respects, effective internal control over financial reporting as of December 31, 2013 based on criteria established in Internal
issued by the Committee of Sponsoring Organizations of the Treadway Commission
(COSO). The Company's management is responsible for these financial statements and financial statement schedule, for
maintaining effective internal control over financial reporting and for its assessment of the effectiveness of internal control
over financial reporting, included in Management's Report on Internal Control over Financial Reporting appearing under Item
9A. Our responsibility is to express opinions on these financial statements, on the financial statement schedule, and on the
Company's internal control over financial reporting based on our integrated audits. We conducted our audits in accordance
with the standards of the Public Company Accounting Oversight Board (United States). Those standards require that we plan
and perform the audits to obtain reasonable assurance about whether the financial statements are free of material misstatement
and whether effective internal control over financial reporting was maintained in all material respects. Our audits of the
financial statements included examining, on a test basis, evidence supporting the amounts and disclosures in the financial
statements, assessing the accounting principles used and significant estimates made by management, and evaluating the overall
financial statement presentation. Our audit of internal control over financial reporting included obtaining an understanding
of internal control over financial reporting, assessing the risk that a material weakness exists, and testing and evaluating the
design and operating effectiveness of internal control based on the assessed risk. Our audits also included performing such
other procedures as we considered necessary in the circumstances. We believe that our audits provide a reasonable basis for
our opinions.
A company’s internal control over financial reporting is a process designed to provide reasonable assurance regarding the
reliability of financial reporting and the preparation of financial statements for external purposes in accordance with generally
accepted accounting principles. A company’s internal control over financial reporting includes those policies and procedures
that (i) pertain to the maintenance of records that, in reasonable detail, accurately and fairly reflect the transactions and
permit preparation of financial statements in accordance with generally accepted accounting principles, and that receipts and
expenditures of the company are being made only in accordance with authorizations of management and directors of the
or disposition of the company’s assets that could have a material effect on the financial statements.
Because of its inherent limitations, internal control over financial reporting may not prevent or detect misstatements. Also,
projections of any evaluation of effectiveness to future periods are subject to the risk that controls may become inadequate
because of changes in conditions, or that the degree of compliance with the policies or procedures may deteriorate.
As described in Management's Report on Internal Control over Financial Reporting, management has excluded Dedicated
Media, Inc. (“Dedicated Media”) and HYFN, Inc. (“HYFN”) from its assessment of internal control over financial reporting
as of December 31, 2013 because they were acquired by the Company in purchase business combinations in April 2013. We
have also excluded Dedicated Media and HYFN from our audit of internal control over financial reporting. Dedicated Media
and HYFN’s assets each represent 1% of consolidated total assets as of December 31, 2013 and net revenues from Dedicated
Media and HYFN represent 3% and less than 1%, respectively, of consolidated net revenue for the year ended December 31,
2013.
/s/PricewaterhouseCoopers LLP
Hartford, Connecticut
March 3, 2014
F-2
Part I. Financial Information
Item 1. Consolidated Financial Statements
F-3
LIN Media LLC
Consolidated Balance Sheets
December 31,
2013
2012
(in thousands, except
share data)
ASSETS
Current assets: ..................................................................................................................................................................
Cash and cash equivalents............................................................................................................................................. $
Deferred income tax assets............................................................................................................................................
Other current assets .......................................................................................................................................................
Total current assets.....................................................................................................................................................
Property and equipment, net.............................................................................................................................................
Deferred financing costs...................................................................................................................................................
Goodwill...........................................................................................................................................................................
Broadcast licenses ............................................................................................................................................................
Other intangible assets, net...............................................................................................................................................
Other assets.......................................................................................................................................................................
Total assets (a)....................................................................................................................................................... $
LIABILITIES, REDEEMABLE NONCONTROLLING INTEREST AND SHAREHOLDERS' EQUITY
(DEFICIT)
Current liabilities:.............................................................................................................................................................
Current portion of long-term debt ................................................................................................................................. $
Accounts payable ..........................................................................................................................................................
Income taxes payable ....................................................................................................................................................
Accrued expenses ..........................................................................................................................................................
Deferred income tax liabilities ......................................................................................................................................
Program obligations ......................................................................................................................................................
Total current liabilities................................................................................................................................................
Long-term debt, excluding current portion ......................................................................................................................
Deferred income tax liabilities .........................................................................................................................................
Program obligations .........................................................................................................................................................
Other liabilities .................................................................................................................................................................
Total liabilities (a)..................................................................................................................................................
Commitments and Contingencies (Note 13)
Redeemable noncontrolling interest.................................................................................................................................
LIN Media LLC shareholders' equity (deficit):................................................................................................................
Class A common shares, 100,000,000 shares authorized, Issued: 39,013,005 and 35,672,528 shares as of
December 31, 2013 and 2012, respectively, Outstanding: 34,065,346 and 30,724,869 shares as of December 31,
2013 and 2012, respectively (b) .......................................................................................................................................
12,525
09
6,898
15,201
179,933
221,078
16,448
203,528
536,515
47,049
12,299
1,216,850
$
17,364
14,002
1,420
51,696
—
7,027
91,509
927,328
64,686
4,146
27,209
1,114,878
$
$
46,307
126,150
—
6,863
179,320
241,491
19,135
192,514
536,515
59,554
12,885
1,241,414
10,756
18,955
766
153,246
168,219
10,770
362,712
879,471
40,556
4,281
42,716
1,329,736
12,845
3,242
624,564
313
518,395
235
—
—
Class B common shares, 50,000,000 shares authorized, 20,901,726 and 23,401,726 shares as of December 31, 2013
common shares (b) ...........................................................................................................................................................
Class C common shares, 50,000,000 shares authorized, 2 shares as of December 31, 2013 and 2012, issued and
.......
Treasury shares, 4,947,659 of class A common shares as of December 31, 2013 and 2012, at cost (b)..........................
Additional paid-in capital (b) ...........................................................................................................................................
Accumulated deficit .........................................................................................................................................................
Accumulated other comprehensive loss ...........................................................................................................................
Total shareholders' equity (deficit)................................................................................................................................
Total liabilities, redeemable noncontrolling interest and shareholders' equity (deficit).......................................... $
(21,984)
—
(1,006,322)
(25,526)
89,127
1,216,850 $
(21,984)
1,129,691
(1,164,435)
(35,384)
(91,564)
1,241,414
_____________________________________________________________________
(a)
(b)
Our consolidated assets as of December 31, 2013 and 2012 include total assets of $56,056 and $60,380, respectively, of variable interest
entities ("VIEs") that can only be used to settle the obligations of the VIEs. These assets include broadcast licenses and other intangible
assets of $44,677 and $46,604 and program rights of $2,186 and $2,060 as of December 31, 2013 and 2012, respectively. Our
consolidated liabilities as of December 31, 2013 and 2012 include $4,126 and $4,577, respectively, of total liabilities of the VIEs for
which the VIE's creditors have no recourse to the Company, including $2,727 and $4,152, respectively, of program obligations. See
further description in Note 1—"Basis of Presentation and Summary of Significant Accounting Policies."
In conjunction with the Merger of LIN TV with and into LIN LLC on July 30, 2013, LIN LLC was deemed the successor reporting entity
to LIN TV. As such, the additional paid-in capital amount within LIN LLC's shareholders' equity as of December 31, 2013 has been
allocated to the Class A and B share balances to conform to LIN LLC's basis of presentation as a limited liability company. For purposes
of LIN TV's shareholders' deficit balance as of December 31, 2012, LIN TV's class A, B and C common shares had a par value of $0.01
per share that is not reflected as of December 31, 2013, as each share represents a limited liability interest in LIN LLC.
The accompanying notes are an integral part of the consolidated financial statements.
F-4
LIN Media LLC
Consolidated Statements of Operations
Year Ended December 31,
2013
2012
2011
(in thousands, except per share data)
Net revenues ................................................................................................................. $
Operating expenses:
Direct operating .........................................................................................................
Selling, general and administrative............................................................................
Amortization of program rights .................................................................................
Corporate....................................................................................................................
Depreciation...............................................................................................................
Amortization of intangible assets...............................................................................
Restructuring..............................................................................................................
Contract termination costs (Note 12).........................................................................
Loss from asset dispositions ......................................................................................
Operating income .........................................................................................................
Other expense:
Interest expense, net...................................................................................................
Share of loss in equity investments............................................................................
Gain on derivative instruments ..................................................................................
Loss on extinguishment of debt .................................................................................
Other expense, net......................................................................................................
Total other expense, net................................................................................................
Income before (benefit from) provision for income taxes............................................
(Benefit from) provision for income taxes ...................................................................
Income (loss) from continuing operations....................................................................
Discontinued operations:
Loss from discontinued operations, net of a benefit from income taxes of $541
and $595 for the years ended December 31, 2012 and 2011, respectively................
Gain on sale of discontinued operations, net of a provision for income taxes of
$6,223 for the year ended December 31, 2012 ..........................................................
Net income (loss)..........................................................................................................
Net (loss) income attributable to noncontrolling interests.........................................
Net income (loss) attributable to LIN Media LLC ....................................................... $
Basic income (loss) per common share attributable to LIN Media LLC:
Income (loss) from continuing operations attributable to LIN Media LLC ................. $
Loss from discontinued operations, net of tax..............................................................
Gain on sale of discontinued operations, net of tax......................................................
Net income (loss) attributable to LIN Media LLC ....................................................... $
Weighted-average number of common shares outstanding used in calculating basic
income (loss) per common share ..................................................................................
Diluted income (loss) per common share attributable to LIN Media LLC:
Income (loss) from continuing operations attributable to LIN Media LLC ................. $
Loss from discontinued operations, net of tax..............................................................
Gain on sale of discontinued operations, net of tax......................................................
Net income (loss) attributable to LIN Media LLC ....................................................... $
Weighted-average number of common shares outstanding used in calculating
diluted income (loss) per common share......................................................................
652,363
$
553,462
400,003
251,078
162,550
29,242
41,377
46,854
22,826
3,895
3,887
710
89,944
160,222
125,267
23,048
34,246
32,149
6,364
1,009
—
96
171,061
130,618
103,770
21,406
26,481
26,246
1,199
707
—
472
89,104
56,607
56
—
—
2,100
58,763
31,181
(125,420)
156,601
46,683
98,309
—
3,341
237
148,570
22,491
40,463
(17,972)
50,706
4,957
(1,960)
1,694
51
55,448
33,656
(16,045)
49,701
(1,018)
(920)
—
—
156,601
(1,512)
158,113 $
3.02
—
—
3.02
$
$
52,439
2.84
—
—
2.84
55,639
11,389
(7,601)
(556)
(7,045) $
(0.32) $
(0.02)
0.21
(0.13) $
54,130
$
$
(0.32) $
(0.02)
0.21
(0.13) $
54,130
The accompanying notes are an integral part of the consolidated financial statements.
F-5
$
—
48,781
204
48,577
0.89
(0.02)
—
0.87
55,768
0.87
(0.02)
—
0.85
57,079
LIN Media LLC
Consolidated Statements of Comprehensive Income (Loss)
Year Ended December 31,
2013
2012
2011
(in thousands)
Net income (loss) ............................................................................................ $
Pension net gain (loss), net of tax of $5,705, $1,523 and $(7,291) for the
years ended December 31, 2013, 2012 and 2011, respectively ......................
Amortization of pension net losses, net of tax of $734, $609 and $379 for
the years ended December 31, 2013, 2012 and 2011, respectively,
reclassified ......................................................................................................
Comprehensive income (loss) .........................................................................
Comprehensive (loss) income attributable to noncontrolling interest ............
Comprehensive income (loss) attributable to LIN Media LLC ...................... $
156,601
$
8,738
2,424
1,120
166,459
(1,512)
167,971
(7,601) $
$
969
(4,208)
(556)
(3,652) $
The accompanying notes are an integral part of the consolidated financial statements.
F-6
48,781
(11,212)
374
37,943
204
37,739
F-7
35,672,528
—
840,477
2,500,000
—
—
—
—
39,013,005
Balance at December 31, 2012 .......
Pension liability adjustment, net
of tax of $6,439 ............................
Issuance of class A common
shares............................................
Conversion of class B common
shares to class A common shares.
Tax benefit from exercise of
share options ................................
Share-based compensation...........
Net income ...................................
Effect of the Merger.....................
Balance at December 31, 2013 .......
Shares
$
$
Class A
20,901,726
—
—
—
—
(2,500,000)
—
—
23,401,726
Shares
$
$
518,395
518,185
—
—
—
(25)
—
—
235
Amount
Shares
2
—
—
—
—
—
—
—
2
$
$
Class C
Amount
—
—
—
—
—
—
—
—
—
$
$
(21,984) $
—
—
—
—
—
—
—
(21,984) $
Treasury
Shares
(at cost)
$ (1,006,322) $
—
—
158,113
—
—
—
—
—
—
(25,526) $
—
—
—
—
—
—
9,858
89,127
—
158,113
9,284
1,591
—
1,845
9,858
(91,564)
Total
Shareholders'
Equity
(35,384) $
Accumulated
Other
Comprehensive
Loss
$ (1,164,435) $
Accumulated
Deficit
(1,139,423)
6,691
1,591
1,450
—
1,129,691
Additional
Paid-In
Capital
The accompanying notes are an integral part of the consolidated financial statements.
624,564
621,238
—
2,593
—
25
395
—
313
Amount
Class B
Common Stock
(in thousands, except share data)
LIN Media LLC
Consolidated Statement of Shareholders' Equity
F-8
34,650,169
—
1,022,359
—
—
—
35,672,528
Pension liability
adjustment, net of tax of
$2,132..................................
Issuance of class A
common stock .....................
Stock-based compensation..
Purchase of LIN TV class A
common stock .....................
Net loss................................
Balance at December 31,
2012........................................
Shares
Balance at December 31,
2011........................................
$
$
Class A
23,401,726
—
—
—
—
—
23,401,726
Shares
$
$
235
—
—
—
—
—
235
Amount
Shares
2
—
—
—
—
—
2
$
$
Class C
Amount
—
—
—
—
—
—
—
$
$
(21,984) $
—
(11,386)
—
—
—
(10,598) $
Treasury
Shares
(at cost)
1,129,691
—
—
6,792
1,310
—
1,121,589
Additional
Paid-In
Capital
The accompanying notes are an integral part of the consolidated financial statements.
313
—
—
—
4
—
309
Amount
Class B
Common Shares
(in thousands, except share data)
LIN Media LLC
Consolidated Statement of Stockholders' Deficit
(35,384) $
—
$ (1,164,435) $
—
—
—
—
3,393
(91,564)
(7,045)
(11,386)
6,792
1,314
3,393
(84,632)
Total
Stockholders'
Deficit
(38,777) $
(7,045)
—
—
—
$ (1,157,390) $
Accumulated
Deficit
Accumulated
Other
Comprehensive
Loss
F-9
$
23,401,726
$
235
—
2
—
$
—
—
$
(10,598) $
—
1,121,589
—
7,014
4,761
—
1,109,814
Additional
Paid-In
Capital
The accompanying notes are an integral part of the consolidated financial statements.
309
—
(100,333)
34,650,169
—
—
(7,869) $
Balance at December 31,
2011........................................
—
—
—
$
—
—
—
—
—
100,333
—
$
Net income ..........................
—
—
—
2
—
3
—
—
235
Amount
890,077
—
$
Shares
Conversion of class B
common stock to class A
common stock .....................
12
—
23,502,059
Amount
Treasury
Stock
(at cost)
Stock-based compensation..
1,150,000
—
294
Shares
Class C
(2,729)
—
Issuance of LIN TV Corp.
class A common stock.........
$
Amount
Class B
Purchase of LIN TV Corp.
class A common stock.........
32,509,759
Pension liability
adjustment, net of tax of
$(6,912)...............................
Shares
Balance at December 31,
2010........................................
Class A
Common Stock
(in thousands, except share data)
LIN Media LLC
Consolidated Statement of Stockholders' Deficit
$ (1,157,390) $
48,577
—
—
—
$ (1,205,967) $
Accumulated
Deficit
(38,777) $
—
—
—
(10,838)
(84,632)
48,577
7,017
(2,729)
4,773
(10,838)
(131,432)
Total
Stockholders'
Deficit
(27,939) $
Accumulated
Other
Comprehensive
Loss
LIN Media LLC
Consolidated Statements of Cash Flows
2013
Year ended December 31,
2012
(in thousands)
2011
OPERATING ACTIVITIES:
Net income (loss)........................................................................................................................... $
Loss from discontinued operations................................................................................................
Gain on sale of discontinued operations........................................................................................
Adjustment to reconcile net income to net cash provided by operating activities: .......................
Depreciation ...............................................................................................................................
Amortization of intangible assets ...............................................................................................
Amortization of financing costs and note discounts ..................................................................
Amortization of program rights..................................................................................................
Cash payments for programming ...............................................................................................
Loss on extinguishment of debt..................................................................................................
Gain on derivative instruments...................................................................................................
Share of loss in equity investments ............................................................................................
Deferred income taxes, net .........................................................................................................
156,601
—
—
$
(7,601) $
1,018
(11,389)
48,781
920
—
46,854
22,826
3,638
29,242
(31,677)
—
—
56
(27,222)
32,149
6,364
2,589
23,048
(24,258)
1,830
—
98,309
38,263
26,246
1,199
3,755
21,406
(24,622)
1,694
(1,960)
4,957
(16,586)
Extinguishment of income tax liability related to the Merger....................................................
Share-based compensation .........................................................................................................
Loss from asset dispositions.......................................................................................................
Other, net ....................................................................................................................................
Changes in operating assets and liabilities, net of acquisitions:
Accounts receivable ...................................................................................................................
Other assets.................................................................................................................................
Accounts payable .......................................................................................................................
Income taxes payable .................................................................................................................
Accrued interest expense............................................................................................................
Other liabilities and accrued expenses .......................................................................................
Net cash provided by operating activities, continuing operations ..........................................
Net cash used in operating activities, discontinued operations ...............................................
Net cash provided by operating activities .................................................................................
INVESTING ACTIVITIES:
(131,481)
9,374
710
(1,155)
—
6,857
96
1,724
—
6,176
472
754
(10,958)
(4,254)
(8,679)
654
4,327
(9,889)
48,967
—
48,967
(33,403)
(2,146)
7,983
—
1,746
6,256
149,435
(2,736)
146,699
(8,825)
(138)
3,318
—
(851)
(3,634)
63,062
(402)
62,660
Capital expenditures ...................................................................................................................
Change in restricted cash............................................................................................................
Payments for business combinations, net of cash acquired........................................................
Proceeds from the sale of assets .................................................................................................
Payments on derivative instruments...........................................................................................
Shortfall loans to joint venture with NBCUniversal ..................................................................
(29,374)
—
(10,082)
86
—
—
(28,230)
255,159
(358,495)
79
—
(2,292)
(20,069)
(255,159)
(9,033)
74
(2,020)
(2,483)
Capital contribution to joint venture with NBCUniversal..........................................................
Other investments, net................................................................................................................
Net cash used in investing activities, continuing operations....................................................
Net cash provided by (used in) investing activities, discontinued operations........................
Net cash used in investing activities...........................................................................................
FINANCING ACTIVITIES:
(100,000)
—
(139,370)
—
(139,370)
—
—
(133,779)
29,520
(104,259)
—
(375)
(289,065)
(115)
(289,180)
1,314
—
328,333
(322,179)
(10,272)
(11,386)
(14,190)
28,250
18,057
46,307 $
841
—
417,695
(175,216)
(7,662)
(2,729)
232,929
6,409
11,648
18,057
Net proceeds on exercises of employee and director share-based compensation ......................
Tax benefit from exercises of share options...............................................................................
Proceeds from borrowings on long-term debt ............................................................................
Principal payments on long-term debt........................................................................................
Payment of long-term debt issue costs .......................................................................................
Treasury shares purchased..........................................................................................................
Net cash provided by (used in) financing activities ..................................................................
Net (decrease) increase in cash and cash equivalents ...................................................................
Cash and cash equivalents at the beginning of the period.............................................................
Cash and cash equivalents at the end of the period ....................................................................... $
1,845
1,591
139,000
(85,160)
(655)
—
56,621
(33,782)
46,307
12,525 $
The accompanying notes are an integral part of the consolidated financial statements.
F-10
LIN Media LLC
Notes to Consolidated Financial Statements
Note 1—Basis of Presentation and Summary of Significant Accounting Policies
LIN Media LLC ("LIN LLC"), together with its subsidiaries, including LIN Television Corporation ("LIN Television"),
Co. Partners, L.P. ("HMC"). In these notes, the terms "Company," "we," "us" or "our" mean LIN LLC and all subsidiaries
included in our consolidated financial statements.
On July 30, 2013, LIN TV Corp., a Delaware corporation (“LIN TV”), completed its merger with and into LIN LLC, a
Delaware limited liability company and wholly owned subsidiary of LIN TV, with LIN LLC as the surviving entity (the
“Merger”) pursuant to the Agreement and Plan of Merger, dated February 12, 2013, by and between LIN TV and LIN LLC
(the “Merger Agreement”). Entry into the Merger Agreement had previously been announced by LIN TV on its Current Report
on Form 8-K filed with the U.S. Securities and Exchange Commission on February 15, 2013.
LIN LLC filed a Current Report on Form 8-K on July 31, 2013 (the “Form 8-K”) for the purpose of establishing LIN
LLC as the successor registrant to LIN TV pursuant to Rule 12g-3(a) under the Securities Exchange Act of 1934, as amended
(the “Exchange Act”), and to disclose certain related matters, including the consummation of the Merger. Pursuant to Rule
12g-3(a) under the Exchange Act and in accordance with the filing of the Form 8-K, the class A common shares representing
limited liability interests in LIN LLC, as the successor registrant to LIN TV, were deemed registered under Section 12(b) of
the Exchange Act. References to "LIN LLC," "we," "us," or the "Company" in this Annual Report on Form 10-K that include
any period at and before the effectiveness of the Merger shall be deemed to refer to LIN TV as the predecessor registrant to
LIN LLC. For more information concerning the effects of the Merger and the succession of LIN LLC to LIN TV upon its
effectiveness, please see the Form 8-K.
We conduct our business through LIN Television and its subsidiaries. Prior to the Merger, LIN TV had no operations or
assets other than its investments in its subsidiaries. Subsequent to the Merger and consistent with its classification as a
partnership for federal income tax purposes, LIN LLC has separate operations relating to the administration of the partnership.
The consolidated financial statements of LIN LLC represent its own operations and the consolidated operations of LIN
Television, which remains a corporation after the Merger.
We guarantee all of LIN Television's debt. All of the consolidated wholly-owned subsidiaries of LIN Television fully
and unconditionally guarantee LIN Television's Senior Secured Credit Facility, 83/8% Senior Notes due 2018 (the "83/8%
Senior Notes") and 63/8% Senior Notes due 2021 (the "63/8% Senior Notes") on a joint-and-several basis, subject to customary
release provisions.
Our consolidated financial statements reflect the operations of WWHO-TV in Columbus, OH and WUPW-TV in Toledo,
OH as discontinued for all periods presented. See Note 3—"Discontinued Operations" for further discussion of our discontinued
operations.
The consolidated financial statements have been prepared in conformity with accounting principles generally accepted
in the United States of America ("U.S. GAAP"). Certain changes in classifications have been made to the prior period financial
statements to conform to the current financial statement presentation. Our significant accounting policies are described below.
The accompanying consolidated financial statements include the accounts of our Company, our wholly-owned and
majority-owned and controlled subsidiaries, and variable interest entities ("VIEs") for which we are the primary beneficiary.
We review all local marketing agreements ("LMAs"), shared services agreements ("SSAs") or joint sales agreements ("JSAs"),
to evaluate whether consolidation of entities party to such arrangements is required. All intercompany accounts and transactions
have been eliminated. We conduct our business through our subsidiaries and have no operations or assets other than our
investment in our subsidiaries and equity-method investments. We operate in one reportable segment.
Joint Venture Sale Transaction
On February 12, 2013, we, along with our wholly-owned subsidiaries LIN Television and LIN Television of Texas, L.P.,
a Delaware limited partnership (“LIN Texas”), entered into and closed the transactions contemplated by a transaction agreement
(the “Transaction Agreement”) with NBC Telemundo License LLC, a Delaware limited liability company (“NBC”), NBCU
New LLC I, a Delaware limited liability company, NBCU New LLC II, a Delaware limited liability company, General Electric
F-11
LIN Media LLC
Notes to Consolidated Financial Statements (Continued)
Company, a New York corporation (“GE”), General Electric Capital Corporation, a Delaware corporation (“GECC” and
together with GE, the “GE Parties”), National Broadcasting Company Holding, Inc., a Delaware corporation, Comcast
Corporation, a Pennsylvania corporation (“Comcast”), NBCUniversal Media, LLC, a Delaware limited liability company
(“NBCUniversal”), Lone Star SPV, LLC, a Delaware limited liability company and Station Venture Holdings, LLC, a Delaware
limited liability company (“SVH”). SVH held a 99.75% interest in Station Venture Operations, LP (“SVO”), which is the
operating company that managed KXAS-TV and KNSD-TV, the television stations that comprised the joint venture. The
Transaction Agreement effected a series of transactions related to the ownership and sale of LIN Texas's 20.38% equity interest
in SVH, a joint venture in which NBC, an affiliate of NBCUniversal, held the remaining 79.62% equity interest (collectively,
the “JV Sale Transaction”).
SVH was a limited partner in a business that operated an NBC affiliate in Dallas and an NBC affiliate in San Diego
pursuant to a management agreement. At the time of LIN Texas’s acquisition of its interest in SVH in 1998, GECC provided
secured debt financing to SVH in the form of a $815.5 million non-amortizing senior secured note due 2023 to GECC (the
“GECC Note”), and, in connection with SVH’s assumption of the GECC Note, LIN TV guaranteed the payment of the full
amount of principal and interest on the GECC Note (the “GECC Guarantee”).
In addition, during 2009, 2010, 2011 and 2012, LIN Television entered into agreements with SVH, the GE Parties and
NBCUniversal pursuant to which LIN Television, the GE Parties and NBCUniversal caused to be provided to SVH certain
unsecured shortfall funding loans (the “Shortfall Funding Loans”) on the basis of each party’s percentage of equity interest
in SVH in order to fund interest payments on the GECC Note.
Pursuant to the JV Sale Transaction, in exchange for LIN Television causing a $100 million capital contribution to be
made to SVH (which was used to prepay a portion of the GECC Note), LIN TV was released from the GECC Guarantee and
any further obligations related to any shortfall funding agreements. Further, LIN Texas sold its 20.38% equity interest in SVH
to affiliates of NBCUniversal, and the LIN parties transferred their rights to receivables related to the Shortfall Funding Loans
for $1.00. As a result of the JV Sale Transaction, neither we nor any of our direct or indirect subsidiaries have any further
investment in or obligations (funding or otherwise) related to SVH, including, without limitation, to make any other unsecured
shortfall loans or payments under the GECC Note or the GECC Guarantee.
We accrued for and expensed the $100 million capital contribution to SVH to secure the release of the GECC Guarantee
and recorded the related tax effects of the JV Sale Transaction and the capital contribution in our consolidated financial
statements as of December 31, 2012 because it represented a probable and estimable obligation of the Company. In February
2013, we entered into a $60 million incremental term loan facility and utilized $40 million of cash on hand and borrowings
under our revolving credit facility to fund the $100 million capital contribution. As a result of the JV Sale Transaction, after
utilizing all of our available federal net operating loss carryforwards to offset the taxable gain recognized in such transaction,
we had a $162.8 million income tax payable associated with this transaction remaining, $131.5 million of which was
extinguished as a result of the closing of the transactions contemplated by the Merger Agreement further described below.
Concurrent with the closing of the JV Sale Transaction, LIN TV entered into the Merger Agreement with LIN LLC as
described above. The Merger enabled the surviving entity to be classified as a partnership for federal income tax purposes
and the change in classification was treated as a liquidation of LIN TV for federal income tax purposes, and LIN TV realized
a capital loss in its 100% equity interest in LIN Television.
Based on an average of the opening and closing trading prices of LIN TV's class A common stock on the day of the
Merger, LIN TV realized a capital loss in the amount of approximately $343 million, which represented the difference between
its tax basis in the stock of LIN Television, and the fair market value of such stock as of July 30, 2013. The capital loss realized
and existing net operating losses were used to offset a portion of the capital gain recognized in the JV Sale Transaction and,
we realized cash savings of $131.5 million, resulting in a remaining tax liability of $31.3 million associated with the JV Sale
Transaction. We made state and federal tax payments to settle this tax liability during the fourth quarter of 2013.
In determining whether we are the primary beneficiary of a VIE for financial reporting purposes, we consider whether
we have the power to direct the activities of the VIE that most significantly impact the economic performance of the VIE and
whether we have the obligation to absorb losses or the right to receive returns that would be significant to the VIE. We
consolidate VIEs when we are the primary beneficiary.
We have a JSA and an SSA with WBDT Television, LLC (“WBDT”), a third party licensee, for WBDT-TV in the Dayton,
OH market. We also have JSAs and SSAs with affiliates of Vaughan Acquisition LLC (“Vaughan”), a third party licensee, for
F-12
LIN Media LLC
Notes to Consolidated Financial Statements (Continued)
WTGS-TV in the Savannah, GA market, WYTV-TV in the Youngstown, OH market and KTKA-TV in the Topeka, KS market
and SSAs with KASY-TV Licensee, LLC (“KASY”), a third-party licensee, for KWBQ-TV in the Santa Fe, NM market,
KRWB-TV in the Roswell, NM market and KASY-TV in the Albuquerque, NM market. Under these agreements, we provide
administrative services to these stations, have an obligation to reimburse certain of the stations' expenses, and we are
compensated through a performance-based fee structure that provides us the benefit of certain returns from the operation of
these stations.
We determined that WBDT, Vaughan and KASY are VIEs and as a result of the JSAs and/or SSAs, we have variable
interests in these entities. We are the primary beneficiary of these entities, and therefore, we consolidate these entities within
our consolidated financial statements.
The carrying amounts and classifications of the assets and liabilities of the variable interest entities described above,
which have been included in our consolidating balance sheets as of December 31, 2013 and 2012 were as follows (in thousands):
December 31,
2013
ASSETS
Current assets:
Cash and cash equivalents ........................................................................................................
Accounts receivable, net...........................................................................................................
Other assets...............................................................................................................................
Total current assets...............................................................................................................
Property and equipment, net .......................................................................................................
Broadcast licenses and other intangible assets, net.....................................................................
Other assets .................................................................................................................................
Total assets ......................................................................................................................
LIABILITIES
Current liabilities:
Current portion of long-term debt.............................................................................................
Accounts payable......................................................................................................................
Accrued expenses .....................................................................................................................
Program obligations..................................................................................................................
Total current liabilities.........................................................................................................
Long-term debt, excluding current portion .................................................................................
Program obligations ....................................................................................................................
Other liabilities............................................................................................................................
Total liabilities ..............................................................................................................
$
$
$
$
2012
278
6,345
927
7,550
2,469
44,677
1,360
56,056
$
1,162
63
1,336
1,303
3,864
3,005
1,424
47,763
56,056
$
$
$
418
6,021
2,092
8,531
3,190
46,604
2,055
60,380
1,451
—
425
2,185
4,061
3,950
1,967
50,402
60,380
The assets of our consolidated VIEs can only be used to settle the obligations of the VIEs, and may not be sold, or
otherwise disposed of, except for assets sold or replaced with others of like kind or value. Other liabilities of $47.8 million
and $50.4 million as of December 31, 2013 and 2012, respectively, serve to reduce the carrying value of the entities, and are
eliminated in our consolidated financial statements. This reflects the fact that as of December 31, 2013 and 2012, LIN Television
has an option that it may exercise if the Federal Communications Commission ("FCC") attribution rules change. The option
would allow LIN Television to acquire the assets or member's interest of the VIE entities for a nominal exercise price, which
is significantly less than the carrying value of their tangible and intangible net assets.
The preparation of financial statements in conformity with U.S. GAAP requires our management to make estimates and
assumptions that affect the amounts reported in the consolidated financial statements and the notes thereto. Our actual results
could differ from these estimates. Estimates are used for the allowance for doubtful accounts in receivables, valuation of
goodwill and intangible assets, assumptions used to determine fair value of financial instruments, amortization and impairment
F-13
LIN Media LLC
Notes to Consolidated Financial Statements (Continued)
of program rights and intangible assets, share-based compensation and other long-term incentive compensation arrangements,
pension costs, barter transactions, income taxes, employee medical insurance claims, useful lives of property and equipment,
contingencies, litigation and net assets of businesses acquired.
Cash and cash equivalents
Cash equivalents consist of highly liquid, short-term investments that have an original maturity of three months or less
when purchased. All of our available cash is on deposit with banking institutions that we believe to be financially sound. We
had no material losses on our cash or cash equivalents during 2013.
Property and equipment is recorded at cost and is depreciated using the straight-line method over the estimated useful
lives of the assets, which are an average of 30 to 40 years for buildings and fixtures, and 3 to 15 years for broadcast and other
equipment. Upon retirement or other disposition, the cost and related accumulated depreciation of the assets are removed from
the accounts and the resulting gain or loss is included in consolidated net income or loss. Expenditures for maintenance and
repairs, including expenditures for planned major maintenance activities, are expensed as incurred. We review our property
and equipment for impairment whenever events or changes in circumstances indicate that the carrying amount may not be
recoverable.
Equity investments that we do not have a controlling interest in are accounted for using the equity method. Our share
of the net income or loss for these investments, including any equity investment impairments or payments under related
guarantees, is included in share of loss from equity investments on our consolidated statement of operations. We review our
interest in our equity investments for impairment if there is a series of operating losses or other factors that may indicate that
there is a decrease in the value of our investment that is other than temporary.
Revenue recognition
We recognize local, national and political advertising sales, net of agency commissions, during the period in which the
advertisements or programs are aired on our television stations, and when payment is reasonably assured. Internet and mobile
advertisement sales are recognized when the advertisement is displayed on our websites or the websites of our advertising
network. We recognize retransmission consent fees in the period in which our service is delivered. Revenue generated by our
digital companies is recognized over the service delivery period when necessary provisions of the contracts have been met.
In addition, for the sale of third-party products and services by our digital companies, we evaluate whether it is appropriate
to recognize revenue based on the gross amount billed to the customer or the net amount retained by us.
Barter transactions
We account for barter transactions at the fair value of the goods or services we receive from our customers, or the
advertising time provided, whichever is more clearly indicative of fair value based on the judgment of our management. We
record barter advertising revenue at the time the advertisement is aired and barter expense at the time the goods or services
are used. We account for barter programs at fair value based on a calculation using the actual cash advertisements we sell
within barter programs multiplied by one minus the program profit margin for similar syndicated programs where we pay
cash to acquire the program rights. We record barter program revenue and expense when we air the barter program. We do
not record barter revenue or expenses related to network programs. Barter revenue and expense included in the consolidated
statements of operations are as follows (in thousands):
Year Ended December 31,
2013
Barter revenue ................................................................................................. $
Barter expense .................................................................................................
F-14
5,552 $
(5,455)
2012
4,220 $
(4,176)
2011
4,071
(3,967)
LIN Media LLC
Notes to Consolidated Financial Statements (Continued)
Advertising expense
Advertising costs are expensed as incurred. We incurred advertising costs in the amounts of $3.9 million, $3.1 million
and $2.6 million for the years ended December 31, 2013, 2012 and 2011, respectively.
Intangible assets primarily include broadcast licenses, network affiliations, customer relationships, completed
technology, non-compete agreements and goodwill.
We consider our broadcast licenses to be indefinite-lived intangible assets and as a result, we test the impairment of our
broadcast licenses annually or whenever events or changes in circumstances indicate that such assets might be impaired. The
use of an indefinite life for our broadcast licenses is based on our ability to renew the licenses and that such renewals generally
may be obtained indefinitely and at little cost and that the technology used in broadcasting is not expected to be replaced in
the foreseeable future. Therefore, cash flows derived from the broadcast licenses are expected to continue indefinitely. We
proceed directly to the first step of the impairment test without attempting to qualitatively assess whether an impairment was
more likely than not. The impairment test consists of a comparison of the fair value of broadcast licenses with their carrying
amount on a station-by-station basis using a discounted cash-flow valuation method, assuming a hypothetical start-up scenario.
The future value of our broadcast licenses could be significantly impaired by the loss of the corresponding network affiliation
agreements. Accordingly, such an event could trigger an assessment of the carrying value of a broadcast license.
We test the impairment of goodwill annually or whenever events or changes in circumstances indicate that goodwill
might be impaired. We proceed directly to the first step of the impairment test without attempting to qualitatively assess
whether an impairment was more likely than not. Our reporting units are comprised of each of the markets in which our
television stations operate, LIN Digital, Nami Media, Dedicated Media, Inc. ("Dedicated Media") and HYFN, Inc. ("HYFN").
The first step of the goodwill impairment test compares the fair value of a reporting unit with its carrying amount, including
goodwill. The fair value of a reporting unit is determined through the use of a discounted cash flow analysis. The valuation
assumptions used in the discounted cash flow model reflect historical and projected performance of the reporting unit and
prevailing values in the markets for similar assets. If the fair value of the reporting unit exceeds its carrying amount, goodwill
is not considered impaired. If the carrying amount of the reporting unit exceeds its fair value, the second step of the goodwill
impairment test is performed to measure the amount of impairment loss, if any. The second step of the goodwill impairment
test compares the implied fair value of goodwill with the carrying amount of that goodwill. The implied fair value of goodwill
is determined by performing a hypothetical purchase price allocation, using the reporting unit's fair value (as determined in
step one) as the purchase price. If the carrying amount of goodwill exceeds the implied fair value, an impairment charge is
recognized in an amount equal to that excess, but not more than the carrying value of the goodwill. An impairment assessment
could be triggered by a significant reduction, or a forecast of such reductions, in operating results or cash flows at one or more
of our reporting units, a significant adverse change in the national or local advertising marketplaces in which our television
stations operate, or by adverse changes to FCC ownership rules, among other factors. We recorded an impairment charge
during 2011, which is more fully described in Note 6—"Intangible Assets."
Long-lived assets
We periodically evaluate the net realizable value of long-lived assets, including tangible and intangible assets, relying
on a number of factors including operating results, business plans, economic projections and anticipated future cash flows.
When evaluating assets for potential impairment, we first compare the carrying amount of the asset group to the estimated
future cash flows associated with the asset group (undiscounted and without interest charges). If the estimated future cash
flows used in this analysis are less than the carrying amount of the asset group, an impairment loss calculation is prepared.
The impairment loss calculation compares the carrying amount of the asset group to the asset group's estimated future cash
flows (discounted and with interest charges). If required, an impairment loss is recorded for the portion of the asset group's
carrying value that exceeds the asset group's estimated future cash flows.
Program rights are recorded as assets when the license period begins and the programs are delivered to our stations for
broadcasting, at the gross amount of the related obligations. Costs incurred in connection with the purchase of programs to
be broadcast within one year are classified as other current assets, while costs of those programs to be broadcast subsequently
F-15
LIN Media LLC
Notes to Consolidated Financial Statements (Continued)
are considered non-current. Program costs are charged to operations over their estimated broadcast periods in a manner
consistent with actual usage.
If the estimated net realizable value of acquired programming rights is less than unamortized cost (i.e. due to poor
ratings), we would recognize an impairment charge to reduce the carrying value of the program rights to their net realizable
value.
Program obligations are classified as current or non-current in accordance with the payment terms of the license
agreement.
As of December 31, 2013, we have several share-based employee compensation plans, which are described more fully
in Note 9—"Share-Based Compensation." We estimate the fair value of share option awards using a Black-Scholes valuation
model. The Black-Scholes valuation model requires us to make assumptions and judgments about the variables used in the
calculation, including the option's expected term, the expected volatility of the underlying shares and the number of share
option awards that are expected to be forfeited. The expected term represents the weighted-average period of time that options
granted are expected to be outstanding giving consideration to vesting schedules and our historical exercise patterns. Expected
volatility is based on historical trends for our class A common shares over the expected term. Expected forfeitures are estimated
using our historical experience. If future changes in estimates differ significantly from our current estimates, our future sharebased compensation expense and results of operations could be materially impacted.
The following table presents the share-based compensation expense included in our consolidated statements of operations
(in thousands):
Year Ended December 31,
2013
Direct operating ............................................................................................... $
Selling, general and administrative .................................................................
Corporate .........................................................................................................
Total share-based compensation...................................................................... $
320
1,460
7,594
9,374
2012
$
$
270
1,019
5,568
6,857
2011
$
$
256
1,266
4,654
6,176
Our accounting policy is to follow the tax law ordering approach regarding net operating losses and determining when
tax benefits are realized related to excess share option deductions and credited to equity.
Deferred income taxes are recognized based on temporary differences between the financial statement and the tax basis
of assets and liabilities using statutory tax rates in effect in the years in which the temporary differences are expected to reverse.
We consider future taxable income and feasible tax planning strategies in assessing the need for establishing or removing a
valuation allowance. We record or subsequently remove a valuation allowance to reflect our deferred tax assets to an amount
that is more likely than not to be realized. In the event that our determination changes regarding the realization of all or part
of our deferred tax assets in the future, an adjustment to the deferred tax asset is recorded to our consolidated statement of
operations in the period in which such a determination is made. Due to the change in tax structure as a result of the Merger,
we reversed an $18.2 million valuation allowance and recognized a corresponding tax benefit during 2013. For further
discussion regarding this reversal, see Note 14 - "Income Taxes."
When accounting for uncertainty in income taxes, we follow the prescribed recognition threshold and measurement
methodology for the financial statement recognition and measurement of a tax position taken or expected to be taken in a tax
return. For benefits to be recognized, a tax position must be more likely than not to be sustained upon examination by taxing
authorities. We recognize interest and penalties related to uncertain tax positions as a component of income tax expense.
Concentration of credit risk
Financial instruments that potentially subject us to concentrations of credit risk consist principally of cash and cash
equivalents and trade receivables. Concentration of credit risk with respect to cash and cash equivalents and investments are
F-16
LIN Media LLC
Notes to Consolidated Financial Statements (Continued)
limited as we maintain primary banking relationships with only large nationally recognized institutions. We evaluated the
viability of these institutions as of December 31, 2013 and we believe our risk is minimal. Credit risk with respect to trade
receivables is limited, as our trade receivables are primarily related to advertising revenues generated from a large diversified
group of local and nationally recognized advertisers and advertising agencies. We do not require collateral or other security
against trade receivable balances, however, we do maintain reserves for potential bad debt losses, which are based on historical
bad debt experience and an assessment of specific risks, and such reserves and bad debts have been within management's
expectations for all years presented.
Earnings per share
Basic earnings per share ("EPS") is computed by dividing income attributable to common shareholders by the number
of weighted-average outstanding common shares. Diluted EPS reflects the effect of the assumed exercise of share options and
vesting of restricted shares only in the periods in which such effect would have been dilutive.
The following is a reconciliation of the weighted-average common shares outstanding for purposes of calculating basic
and diluted income (loss) per common share (in thousands):
Year Ended December 31,
2013
2012
2011
Numerator for earnings per common share calculation:
Income (loss) from continuing operations....................................................... $
Net (loss) income attributable to noncontrolling interest included in
continuing operations ......................................................................................
Income (loss) from continuing operations attributable to LIN LLC ...............
Income (loss) from discontinued operations, including gain on sale ..............
Net income (loss) attributable to LIN LLC ..................................................... $
Denominator for earnings per common share calculation:
Weighted-average common shares, basic........................................................
Effect of dilutive securities:.............................................................................
Share options and restricted shares ...............................................................
Weighted-average common shares, diluted.....................................................
156,601
$
(1,512)
158,113
—
158,113
$
(17,972) $
49,701
(556)
(17,416)
204
49,497
(920)
10,371
(7,045) $
48,577
52,439
54,130
55,768
3,200
55,639
—
54,130
1,311
57,079
We apply the treasury stock method to measure the dilutive effect of our outstanding share options and restricted share
awards and include the respective common share equivalents in the denominator of our diluted income per common share
calculation. Potentially dilutive securities representing 0.1 million, 1.2 million, and 0.4 million weighted shares of common
shares issuable for share options and restricted shares for the years ended December 31, 2013, 2012 and 2011, respectively,
were excluded from the computation of diluted income (loss) per common share for these periods because their effect would
have been anti-dilutive. The net income (loss) per share amounts are the same for our class A, class B and class C common
shares because the holders of each class are legally entitled to equal per share amounts whether through distributions or in
liquidation.
Certain financial instruments, including cash and cash equivalents, investments, accounts receivable and accounts payable
are carried in the consolidated financial statements at amounts that approximate fair value. For certain financial assets and
liabilities recorded at fair value on a recurring basis we maximize the use of observable inputs and minimize the use of
unobservable inputs when measuring fair value.
Derivatives are required to be recorded as assets or liabilities and measured at fair value. Gains or losses resulting from
changes in the fair values of derivatives are recognized immediately or deferred, depending on the use of the derivative and
whether or not it qualifies as a hedge. We have historically used derivative financial instruments in the management of our
F-17
LIN Media LLC
Notes to Consolidated Financial Statements (Continued)
interest rate exposure for our long-term debt. In accordance with our interest rate risk management policy, we do not enter
into derivative financial instruments unless there is an underlying exposure, and we do not enter into derivative financial
instruments for speculative trading purposes.
We have a defined benefit retirement plan covering certain of our employees. Our pension benefit obligations and related
costs are calculated using prescribed actuarial concepts. Additionally, we record the unfunded status of our plan on our
consolidated balance sheets. Effective April 1, 2009, this plan was frozen and we do not expect to make additional benefit
accruals to this plan, however, we continue to fund our existing vested obligations.
The following table presents the activity of the redeemable noncontrolling interest included in our consolidated balance
sheets related to Nami Media, HYFN and Dedicated Media, which represents third parties’ proportionate share of our
consolidated net assets (in thousands):
Redeemable
Noncontrolling
Interest
Acquisition of redeemable noncontrolling interest................................................................................................. $
Net loss ...................................................................................................................................................................
Share-based compensation......................................................................................................................................
Balance as of December 31, 2012 ..........................................................................................................................
Acquisition of redeemable noncontrolling interest.................................................................................................
Net loss ...................................................................................................................................................................
Share-based compensation......................................................................................................................................
Balance as of December 31, 2013 .......................................................................................................................... $
3,503
(556)
295
3,242
11,025
(1,512)
90
12,845
In July 2013 the Financial Accounting Standards Board ("FASB") issued Accounting Standards Update ("ASU") 2013-11,
“Presentation of an Unrecognized Tax Benefit When a Net Operating Loss Carryforward, a Similar Tax Loss, or a Tax Credit
Carryforward Exists” to eliminate diversity in practice. This ASU requires that companies net their unrecognized tax benefits
against all same-jurisdiction net operating losses or tax credit carryforwards that would be used to settle the position with a
tax authority. This new guidance is effective prospectively for annual reporting periods beginning on or after December 15,
2013 and interim periods therein. We prospectively adopted this guidance effective January 1, 2013 and it did not have a
material impact on our financial statements.
In February 2013, the Financial Accounting Standards Board issued Accounting Standards Update No. 2013-2,
“Reporting of Amounts Reclassified out of Accumulated Other Comprehensive Income,” which amends Accounting Standards
Codification 220, “Comprehensive Income.” The amendments require an entity to disclose the impact of amounts reclassified
out of accumulated other comprehensive income and into net income, by the respective line items of net income, if the amounts
reclassified are reclassified to net income in their entirety in the same reporting period. The disclosure is required either on
the face of the statement where net income is presented or in the notes. For amounts that are not reclassified in their entirety
to net income, an entity is required to cross-reference to other disclosures required under U.S. GAAP that provide additional
detail about those amounts. We prospectively adopted this guidance effective January 1, 2013 and it did not have a material
impact on our financial statements.
In July 2012, there were revisions to the accounting standard for impairment tests of indefinite-lived intangible assets
other than goodwill. Under the revised standard a company can first perform a qualitative assessment to determine whether
further impairment testing of indefinite-lived intangible assets is necessary. A company can choose to perform the qualitative
assessment on none, some, or all of its indefinite-lived intangible assets, and can also bypass the qualitative assessment and
perform the quantitative impairment test for any indefinite-lived intangible in any period. The revised standard is effective
for annual and interim impairment tests performed for fiscal years beginning after September 15, 2012. We adopted this
F-18
LIN Media LLC
Notes to Consolidated Financial Statements (Continued)
guidance effective January 1, 2013 and do not expect it to have a material impact on our impairment tests of indefinite-lived
intangible assets.
Note 2—Acquisitions
On February 3, 2014, LIN Digital Media LLC, a wholly owned subsidiary of LIN Television, acquired 100% of the
capital stock of Federated Media Publishing, Inc. ("Federated Media"), which we subsequently converted into a Delaware
limited liability company. Federated Media is a digital content and conversational marketing company that leverages the
relationships and content from its publishing network to deliver contextually relevant advertising and conversational and
engagement tools that reach agencies’ and brands’ targeted audiences across digital and social media platforms. The purchase
price totaled $22.4 million plus an adjustment for working capital delivered at closing and was funded from cash on hand and
amounts drawn on our revolving credit facility.
We are in the process of making preliminary estimates of the fair value of the assets acquired and liabilities assumed of
Federated Media, utilizing information available at the time of this report and these estimates are subject to refinement until
all pertinent information has been obtained. We expect to complete the process of finalizing the purchase accounting and final
estimates of fair value of assets and liabilities during the twelve months following the acquisition.
Dedicated Media, Inc.
On April 9, 2013, LIN Television acquired a 60% interest (calculated on a fully diluted basis) in Dedicated Media, a
multi-channel advertisement buying and optimization company. Dedicated Media employs new technologies to create, plan
and execute digital marketing campaigns on behalf of its clients. The purchase price totaled $5.8 million, which was funded
from cash on hand at the time of the acquisition.
Under the terms of our agreement with Dedicated Media, we agreed to purchase the remaining outstanding shares of
Dedicated Media by no later than February 15, 2015 if Dedicated Media achieves both (i) a target earnings before interest,
taxes, depreciation and amortization (“EBITDA”) and (ii) a target gross profit in 2014, as outlined in the purchase agreement.
The purchase price of these shares is based on multiples of Dedicated Media’s 2014 EBITDA and gross profit. Our maximum
potential obligation under the purchase agreement is $26 million. If Dedicated Media does not meet the target EBITDA or
target gross profit in 2014, we have the option to purchase the remaining outstanding shares using the same purchase price
multiple.
The following table summarizes the allocation of the purchase price to the estimated fair values of the assets acquired
and liabilities assumed by us in the acquisition (in thousands):
Current assets.......................................................................................................................................................... $
Equipment...............................................................................................................................................................
Definite-lived intangible assets...............................................................................................................................
Goodwill .................................................................................................................................................................
Current liabilities ....................................................................................................................................................
Noncontrolling interest ...........................................................................................................................................
Total........................................................................................................................................................................ $
7,315
99
4,620
1,854
(4,302)
(3,834)
5,752
The amount allocated to definite-lived intangible assets represents the estimated fair values of customer relationships
of $3.9 million, completed technology of $0.5 million, and trademarks of $0.2 million. These intangible assets will be amortized
over the estimated remaining useful lives of approximately 8 years for customer relationships, 4 years for completed technology
and 2 years for trademarks.
On April 4, 2013, LIN Television acquired a 50.1% interest (calculated on a fully diluted basis) in HYFN, a full service
digital advertising agency specializing in the planning, development, deployment and support for websites, mobile sites,
interactive banners, games and various applications for multiple devices. The purchase price totaled $7.2 million, $6.9 million
F-19
LIN Media LLC
Notes to Consolidated Financial Statements (Continued)
of which was funded from cash on hand and $0.3 million was accrued at the time of the acquisition and was subsequently
paid in accordance with the provisions of the purchase agreement during the first quarter of 2014.
Under the terms of our agreement with HYFN, we agreed to purchase the remaining outstanding shares of HYFN by
no later than February 15, 2016 if HYFN achieves both (i) a target EBITDA and (ii) target net revenues in 2015, as outlined
in the transaction agreements. The purchase price of these shares is based on multiples of HYFN’s 2015 net revenue and
EBITDA. Our maximum potential obligation under the terms of our agreement is approximately $62.4 million. If HYFN does
not meet the target EBITDA or target net revenues in 2015, we have the option to purchase the remaining outstanding shares
using the same purchase price multiple.
The following table summarizes the allocation of the purchase price to the estimated fair values of the assets acquired
and liabilities assumed by us in the acquisition (in thousands):
Current assets.......................................................................................................................................................... $
Non-current assets ..................................................................................................................................................
Equipment...............................................................................................................................................................
Definite-lived intangible assets...............................................................................................................................
Goodwill .................................................................................................................................................................
Current liabilities ....................................................................................................................................................
Non-current liabilities.............................................................................................................................................
Noncontrolling interest ...........................................................................................................................................
Total........................................................................................................................................................................ $
3,759
13
179
3,580
9,160
(920)
(1,361)
(7,191)
7,219
The amount allocated to definite-lived intangible assets represents the estimated fair values of customer relationships
of $2.4 million, completed technology of $1.1 million, and trademarks of $0.1 million. These intangible assets will be amortized
over the estimated remaining useful lives of approximately 8 years for customer relationships, 3 years for completed technology
and 3 years for trademarks.
Goodwill of $1.9 million and $9.2 million is the excess of the aggregate purchase price over the fair value of the
identifiable net assets acquired, and primarily represents the benefits of the incremental revenue we expect to generate from
the acquisitions of Dedicated Media and HYFN, respectively. None of the goodwill recognized in connection with the
acquisitions of Dedicated Media and HYFN is deductible for tax purposes.
Our obligations to purchase the noncontrolling interest holders’ shares of both Dedicated Media and HYFN are outside
of our control, because they are based on the achievement of certain financial targets described above. Therefore, the
noncontrolling interest related to Dedicated Media and HYFN as of December 31, 2013 has been reported as redeemable
noncontrolling interest and classified as temporary equity on our consolidated balance sheets. As of the acquisition dates, the
fair values of the noncontrolling interests were $3.8 million and $7.2 million for Dedicated Media and HYFN, respectively,
and were measured based on the purchase prices for our 60% and 50.1% ownership interest in Dedicated Media and HYFN,
respectively, and the net assets acquired as of the acquisition dates. As of December 31, 2013, we believe that achievement
of the financial targets is not yet probable and therefore, have not reflected these obligations in our consolidated financial
statements.
If we do not purchase the remaining outstanding shares of Dedicated Media or HYFN by the dates set forth in the
respective purchase agreements, the noncontrolling interest holders have the right to purchase our interest. The purchase price
of these shares is based on the same purchase price multiple described above and is exercisable only if the applicable financial
targets are not met and we do not elect to purchase the remaining interest. The fair value of our elective purchase options, and
the fair value of the options held by the noncontrolling interest holders is zero and no amounts related to these options are
included in our consolidated financial statements as of December 31, 2013.
Net revenues and operating loss of HYFN and Dedicated Media included in our consolidated statements of operations
for the year ended December 31, 2013 were $24.2 million and $(2.8) million, respectively.
New Vision Acquisition
On October 12, 2012, LIN Television completed its acquisition of television stations in eight markets that were previously
owned by affiliates of New Vision Television, LLC ("New Vision") for $334.9 million, subject to certain post-closing
F-20
LIN Media LLC
Notes to Consolidated Financial Statements (Continued)
adjustments, and including the assumption of $14.3 million of finance lease obligations. Concurrent with the acquisition,
Vaughan, a third-party licensee, completed its acquisition of separately owned television stations (the "Vaughan Acquired
Stations") in three markets for $4.6 million from PBC Broadcasting, LLC ("PBC").
LIN Television also agreed to provide certain services to the Vaughan Acquired Stations pursuant to SSAs with Vaughan.
Under the SSAs with Vaughan, we provide sales, administrative and technical services, supporting the business and operation
of the Vaughan Acquired Stations in exchange for commissions and fees that provide us the benefit of certain returns from
the business of the Vaughan Acquired Stations.
The following table summarizes the allocation of the purchase price to the estimated fair values of the assets acquired
and liabilities assumed by both us and Vaughan in the acquisition (in thousands):
Program rights assets ..................................................................................................................................... $
Property and equipment .................................................................................................................................
Broadcast licenses..........................................................................................................................................
Definite-lived intangible assets......................................................................................................................
Goodwill ........................................................................................................................................................
Current liabilities ...........................................................................................................................................
Non-current liabilities ....................................................................................................................................
Long-term debt assumed................................................................................................................................
Total ............................................................................................................................................................... $
2,040
100,124
133,120
55,837
65,024
(417)
(2,239)
(13,989)
339,500
The amount allocated to definite-lived intangible assets represents the estimated fair values of network affiliations of
$30.8 million, favorable leases of $8.6 million, advertiser relationships of $6.1 million, retransmission consent agreements
of $7 million, and other intangible assets of $3.3 million. These intangible assets will be amortized over the estimated remaining
useful lives of approximately 2 years for network affiliations, 32 years for favorable leases, 10 years for advertiser relationships,
5 years for retransmission consent agreements, and a weighted average life of 6 years for other intangible assets.
The results of operations for the year ended December 31, 2012 include the results of the New Vision stations since
October 12, 2012. Net revenues and operating income of the television stations acquired during 2012 included in our
consolidated statements of operations for the year ended December 31, 2012 were $40 million and $11.2 million, respectively.
The following table sets forth unaudited pro forma results of operations, assuming that the acquisition of the television
stations from New Vision, along with transactions necessary to finance the acquisition, occurred on January 1, 2011 (in
thousands):
2012
Net revenue .................................................................................................................................
Net (loss) income ........................................................................................................................
Basic (loss) income per common share attributable to LIN LLC ...............................................
Diluted (loss) income per common share attributable to LIN LLC ............................................
$
$
$
$
658,163
(11,720)
(0.22)
(0.22)
2011
$
$
$
$
514,340
23,950
0.43
0.42
This pro forma financial information is based on historical results of operations, adjusted for the allocation of the purchase
price and other acquisition accounting adjustments, and is not necessarily indicative of what our results would have been had
we operated the businesses since January 1, 2011. The pro forma adjustments reflect depreciation expense, amortization of
intangibles and amortization of program contract costs related to the fair value adjustments of the assets acquired, additional
interest expense related to the financing of the transactions, exclusion of nonrecurring financing and transaction related costs
and the related tax effects of the adjustments.
In connection with the acquisition of television stations from New Vision, we and New Vision incurred a combined total
of $7.3 million of transaction related costs primarily related to legal and other professional services. These costs were not
F-21
LIN Media LLC
Notes to Consolidated Financial Statements (Continued)
included in the 2012 pro forma amounts. The 2011 pro forma net income was adjusted to include these costs, as they are
directly attributable to the acquisition.
ACME Television Acquisition
On December 10, 2012, LIN Television acquired certain assets of the ACME Television, LLC ("ACME") television
stations KWBQ-TV, KRWB-TV and KASY-TV (collectively the "Acquired Stations"), each of which serves the AlbuquerqueSanta Fe, NM market. KASY-TV Licensee, LLC ("KASY"), an unrelated third party, acquired the remaining assets of the
Acquired Stations, including the FCC license. The aggregate purchase price for the Acquired Stations was $19 million, of
which we paid approximately $17.3 million and KASY paid approximately $1.7 million.
LIN Television also agreed to provide certain services to the Acquired Stations pursuant to shared services arrangements
with KASY. Under the shared services arrangements with KASY, we provide sales, administrative and technical services,
supporting the business and operation of the Acquired Stations in exchange for commissions and fees that provide us the
benefit of certain returns from the business of the Acquired Stations.
The following table summarizes the allocation of the purchase price to the estimated fair values of the assets acquired
and liabilities assumed by both us and KASY in the acquisitions (in thousands):
Current assets.......................................................................................................................................................... $
Non-current assets ..................................................................................................................................................
Other intangible assets............................................................................................................................................
Goodwill .................................................................................................................................................................
Non-current liabilities.............................................................................................................................................
Total........................................................................................................................................................................ $
1,656
1,968
12,898
5,331
(2,858)
18,995
Goodwill of $65 million and $5.3 million is the excess of the aggregate purchase price over the fair value of the identifiable
net assets acquired, and primarily represents the benefits of synergies and economies of scale we expect to realize from the
acquisitions of the television stations from New Vision and ACME, respectively. All of the goodwill recognized in connection
with the acquisitions of New Vision and ACME is deductible for tax purposes.
During the year ended December 31, 2013, certain measurement period adjustments were made to the initial
allocation performed in the fourth quarter of 2012 for the New Vision and ACME acquisitions, which were not material to
the consolidated financial statements.
On November 22, 2011, LIN Television acquired a 57.6% interest (a 50.1% interest calculated on a fully diluted basis)
in Nami Media Inc. ("Nami Media"), a digital advertising management and technology company. During 2013, Nami Media
did not achieve the minimum threshold of earnings before interest, taxes, depreciation and amortization ("EBITDA") required
to obligate LIN LLC to acquire the remaining outstanding shares. As of the date of this report, we have not exercised our
option to acquire the remaining outstanding shares.
Note 3—Discontinued Operations
On February 16, 2012, we completed the sale of substantially all of the assets of WWHO-TV, our CW affiliate serving
Columbus, OH. During the year ended December 31, 2012, we recorded a loss on the sale of WWHO-TV of $0.4 million
($0.3 million, net of tax).
On April 21, 2012, we completed the sale of substantially all of the assets of WUPW-TV to WUPW, LLC. During the
year ended December 31, 2012, we recorded a gain on the sale of WUPW-TV of $18 million ($11.7 million, net of tax).
The following presents summarized information for the discontinued operations as follows (in thousands):
F-22
2012
WWHOTV
Net revenues ........................
Operating (loss) income ......
Net (loss) income.................
$
WUPWTV
2011
WWHOTV
Total
WUPWTV
440 $ 2,193 $ 2,633 $ 4,236 $ 7,585
(1,559)
(699)
(393)
(1,166)
1,079
(1,018)
(1,427)
(252)
(766)
507
Total
$ 11,821
380
(920)
Note 4—Investments
Joint Venture with NBCUniversal
As of December 31, 2012, we held a 20.38% interest in SVH, a joint venture with NBCUniversal, and accounted for
our interest using the equity method, as we did not have a controlling interest. SVH held a 99.75% interest in SVO, which is
the operating company that managed KXAS-TV and KNSD-TV, the television stations that comprised the joint venture.
As further described in Note 1 - "Basis of Presentation and Summary of Significant Accounting Policies" and Note 13
—"Commitments and Contingencies," on February 12, 2013, LIN TV, LIN Television, and LIN Texas entered into and
simultaneously closed the transactions contemplated by the Transaction Agreement among subsidiaries of NBCUniversal,
Comcast, the GE Parties, and SVH.
Pursuant to the JV Sale Transaction, in exchange for LIN Television causing a $100 million capital contribution to be
made to SVH (which was used to prepay a portion of the GECC Note), LIN TV was released from the GECC Guarantee and
any further obligations related to any shortfall funding agreements. Further, LIN Texas sold its 20.38% equity interest in SVH
to affiliates of NBCUniversal, and the LIN parties transferred their rights to receivables related to the Shortfall Funding Loans
for $1.00. As a result of the JV Sale Transaction, neither we nor any of our direct or indirect subsidiaries have any further
investment in or obligations (funding or otherwise) related to SVH, including, without limitation, to make any other unsecured
shortfall loans or payments under the GECC Note or the GECC Guarantee.
The following table presents summarized financial information of SVH and SVO for the period from January 1, 2013
through February 12, 2013 and the years ending December 31, 2012 and 2011 (in thousands):
January 1 February 12
Year Ended December 31,
2013
2012
2011
SVO:
Net revenues................................................................... $
Operating expenses ........................................................
Net income before taxes.................................................
Net income after taxes ...................................................
SVH:
Equity in income from limited partnership in SVO....... $
Interest and other expense..............................................
Net loss...........................................................................
Cash distributions to SVH from SVO............................
Shortfall loans from LIN Television to SVH.................
Shortfall loans from General Electric Company
("GE") to SVH ...............................................................
F-23
11,951 $
(9,148)
143,474 $
(79,124)
118,833
(71,350)
2,805
64,653
47,791
2,793
64,515
47,743
2,786 $
(8,039)
(5,253)
64,354 $
(69,365)
(5,011)
47,624
(68,003)
(20,379)
6,905
—
55,025
2,292
53,846
2,483
—
8,954
9,701
LIN Media LLC
Notes to Consolidated Financial Statements (Continued)
February 12,
December 31,
2013 (2)
2012
SVH:
Cash and cash equivalents ............................................................................... $
Non-current assets ...........................................................................................
Current liabilities .............................................................................................
Non-current liabilities(1) ........................................................................................................
Shortfall loans outstanding and accrued interest payable to LIN Television
from SVH ........................................................................................................
Shortfall loans outstanding and accrued interest payable to NBCUniversal
and General Electric from SVH ......................................................................
6,905
205,433
8,155
865,354
$
—
209,552
544
864,927
10,159
10,080
39,695
39,382
_______________________________________________________________________________
(1)
See Note 13—"Commitments and Contingencies" for further description of the GECC Note. Non-current liabilities includes shortfall
loans outstanding and accrued interest payable to the joint venture partners.
(2)
Represents balances prior to the effect of the JV Sale Transaction.
In 2008, we recorded an impairment charge that reduced the carrying value of our investment in SVH to $0. Subsequent
to the reduction of the SVH carrying value to $0, and as a result of our guarantee of the GECC Note as further described in
Note 13—"Commitments and Contingencies", we suspended recognition of equity method losses in our consolidated financial
statements.
During the years ended December 31, 2012 and 2011, based on our estimate of our probable shortfall obligations to the
joint venture, we recognized contingent liabilities of $4.2 million and $4.7 million, respectively, for the amounts that LIN
Television expected to loan to SVH pursuant to the shortfall funding agreements with the GE Parties and NBCUniversal, as
further described in Note 13—"Commitments and Contingencies." Because of uncertainty surrounding the joint venture's
ability to repay shortfall loans, we concluded that it was more likely than not that the amounts recognized for accrued shortfall
loans would not be recovered within a reasonable period of time, and concurrently recognized charges of $4.2 million and
$4.7 million in 2012 and 2011, respectively, to reflect the impairment of the shortfall loans, which were classified within Share
of loss in equity investments in our consolidated statement of operations. As a result of the JV Sale Transaction, as of
February 12, 2013, we had no further shortfall funding obligations. Therefore, as of December 31, 2012, the remaining accrued
shortfall funding liability of $6 million was also reversed and reflected in the Share of loss in equity investments line of our
consolidated statement of operations.
Note 5—Property and Equipment
Property and equipment consisted of the following (in thousands):
December 31,
Land and land improvements...................................................................................................... $
Buildings and fixtures.................................................................................................................
Broadcast equipment and other ..................................................................................................
Total property and equipment.....................................................................................................
Less accumulated depreciation ...................................................................................................
Property and equipment, net ....................................................................................................... $
2013
2012
21,152 $
179,209
319,912
520,273
(299,195)
21,147
176,940
311,907
509,994
(268,503)
221,078
$
241,491
We recorded depreciation expense of $46.9 million, $32.1 million and $26.2 million for the years ended December 31,
2013, 2012 and 2011, respectively.
F-24
LIN Media LLC
Notes to Consolidated Financial Statements (Continued)
Note 6—Intangible Assets
The following table summarizes the carrying amount of each major class of intangible assets (in thousands):
Weighted-Average
Remaining Useful
Life (in years)
December 31,
2013
2012
Finite-Lived Intangible Assets:
Network affiliations......................................................................................
Customer relationships.................................................................................
Non-compete agreements .............................................................................
Completed technology..................................................................................
Favorable leases ...........................................................................................
Retransmission consent agreements.............................................................
Other intangible assets .................................................................................
Accumulated amortization ...........................................................................
Net finite-lived intangible assets ..................................................................
Indefinite-Lived Intangible Assets:
1
9
1
3
31
4
19
$
32,996 $
14,941
1,588
10,191
8,573
7,860
9,817
(38,917)
32,996
8,631
1,588
6,370
8,573
7,859
9,609
(16,072)
$
47,049
$
59,554
Broadcast licenses ........................................................................................
Summary:
$
536,515
$
536,515
Goodwill.......................................................................................................
Broadcast licenses and finite-lived intangible assets, net ............................
Total intangible assets ..................................................................................
$
203,528
583,564
787,092
$
192,514
596,069
788,583
$
$
We recorded amortization expense of $22.8 million, $6.4 million and $1.2 million for the years ended December 31,
2013, 2012 and 2011, respectively.
The following table summarizes the projected aggregate amortization expense for the next five years and thereafter (in
thousands):
Projected Aggregate
Amortization Expense
For the years ended December 31,
2014................................................................................................................................................................ $
2015................................................................................................................................................................
2016................................................................................................................................................................
2017................................................................................................................................................................
2018................................................................................................................................................................
Thereafter .......................................................................................................................................................
Total................................................................................................................................................................ $
15,971
5,783
4,980
3,266
2,042
15,007
47,049
There were no events during 2013, 2012 and 2011 to warrant the performance of an interim impairment test of our
indefinite-lived intangible assets. We recorded a $1.6 million impairment charge related to discontinued operations for the
year ended December 31, 2011.
F-25
LIN Media LLC
Notes to Consolidated Financial Statements (Continued)
The changes in the carrying amount of goodwill for the years ended December 31, 2013 and 2012, respectively, are as
follows (in thousands):
Year Ended December 31,
2013
Balance as of January 1, 2013 and 2012, respectively................................................................ $
Acquisitions ................................................................................................................................
Balance as of December 31, 2013 and 2012, respectively.......................................................... $
2012
192,514
11,014
203,528
$
$
122,069
70,445
192,514
Note 7—Debt
Debt consisted of the following (in thousands):
December 31,
2013
Senior Secured Credit Facility:
Revolving credit loans.............................................................................................................. $
$118,750 and $125,000 Term loans, net of discount of $345 and $435 as of December 31,
2013 and December 31, 2012, respectively .............................................................................
$314,200 and $257,400 Incremental term loans, net of discount of $1,684 and $2,020 as of
December 31, 2013 and December 31, 2012, respectively ......................................................
3
8 /8% Senior Notes due 2018......................................................................................................
63/8% Senior Notes due 2021......................................................................................................
Capital lease obligations .............................................................................................................
Other debt ...................................................................................................................................
Total debt ....................................................................................................................................
Less current portion ....................................................................................................................
Total long-term debt ................................................................................................................... $
5,000
2012
$
—
118,405
124,565
312,516
200,000
290,000
14,604
4,167
944,692
17,364
927,328
255,380
200,000
290,000
14,881
5,401
890,227
10,756
879,471
$
Senior Secured Credit Facility
Our senior secured credit facility is comprised of a six-year, $125 million tranche A term loan and a five-year, $75
million revolving credit facility, and bears interest at a rate based on, at our option, either a) the LIBOR interest rate, or b) the
ABR rate, which is an interest rate that is equal to the greatest of (i) the Prime Rate, (ii) the Federal Funds Effective Rate plus
1/2 of 1 percent, and (iii) the one-month LIBOR rate plus 1%. In addition, the rate we select also bears an applicable margin
based upon our Consolidated Senior Secured Leverage Ratio, currently set at 2.75% and 1.75% for LIBOR based loans and
ABR rate loans, respectively. Following the issuance of this report during the first quarter of 2014, these rates will be 3% and
2% for LIBOR based loans and ABR rate loans, respectively. Lastly, the unused portion of the revolving credit facility is
subject to a commitment fee based upon our Consolidated Senior Secured Leverage Ratio, currently set at 0.375% for both
LIBOR based loans and ABR rate loans and will increase to 0.5% following the issuance of this report during the first quarter
of 2014 for both LIBOR based loans and ABR rate loans.
Our senior secured credit facility also includes a seven-year, $260 million tranche B incremental term loan facility and
a $60 million tranche B-2 incremental term facility that was funded on February 12, 2013 in connection with the JV Sale
Transaction, each of which is subject to the terms of our Credit Agreement. Borrowings under the incremental term loan
facility were used (i) to pay the call price for our redemption of all of our remaining 61/2% Senior Subordinated Notes, as
described below, and (ii) to pay accrued interest, fees and expenses associated with the redemption. Borrowings under the
incremental term loan facility bear interest at a rate based, at our option, on an adjusted LIBOR rate, plus an applicable margin
Base Rate shall at no time be less than 1% and 2%, respectively.
F-26
LIN Media LLC
Notes to Consolidated Financial Statements (Continued)
On December 24, 2012, we entered into an amendment to our Credit Agreement (the "Credit Agreement"), dated as of
October 26, 2011, as amended on December 19, 2011, by and among LIN Television, JPMorgan Chase Bank, N.A., as
Administrative Agent, and the banks and other financial institutions party thereto, which (1) replaced our $257.4 million
tranche B term loan maturing in December 2018 with a new tranche B term loan of the same maturity which bears interest at
a reduced rate and (2) made certain other changes to the Credit Agreement, including changes to the financial covenants therein
that are favorable to LIN Television and its affiliates and (3) extended the maturity for a $60 million tranche of our revolving
credit facility to October 2017 and on May 9, 2013, we extended the maturity date of the remaining $15 million tranche of
our revolving credit facility to October 2017. We paid customary fees and expenses in connection with the closing of these
amendments of $1.7 million. As a result of these amendments, we recorded a loss on extinguishment of debt of $1.2 million
associated with a write-down of deferred financing fees and unamortized discount to our consolidated statement of operations
during the year ended December 31, 2012.
The terms of the Credit Agreement provide for customary representations and warranties, affirmative and negative
covenants (including financial covenants), and events of default. The Credit Agreement also provides for the payment of
customary fees and expenses by us. The senior secured credit facility can be accelerated upon events of default and require
the term loans to be prepaid under certain circumstances with amounts determined by reference to the proceeds from certain
asset sales (subject to reinvestment rights), the incurrence of certain indebtedness and a percentage of annual excess cash flow.
The senior secured credit facility ranks senior in right of payment to our existing and future subordinated indebtedness.
LIN LLC and certain of our existing, or hereafter created or acquired, domestic subsidiaries guarantee the credit facilities on
a senior basis. LIN Television and each of our subsidiary guarantors have granted a security interest in all or substantially all
of our assets to secure the obligations under senior secured credit facility, and LIN LLC has granted a security interest in its
capital stock of LIN Television to secure such obligations.
Our senior secured credit facility permits us to prepay loans and to permanently reduce the revolving credit commitments,
in whole or in part, at any time. We are also obligated to make mandatory quarterly principal payments. In addition, our senior
secured credit facility restricts the use of proceeds from asset sales not reinvested in our business and the use of proceeds from
the issuance of debt (subject to certain exceptions), which must be used for mandatory prepayments of principal of the term
loans.
The Credit Agreement governing our senior secured credit facility also requires on an annual basis, following the delivery
of our year-end financial statements, and commencing after the year ended December 31, 2012, mandatory prepayments of
principal of the term loans based on a computation of excess cash flow for the preceding fiscal year, as more fully described
in the Credit Agreement. However, based on the excess cash flow computation for the year ended December 31, 2013, we
will not be required to make such prepayments during the year ending December 31, 2014.
The incremental term loan facility is a senior secured obligation and ranks senior in right of payment to our existing
and future subordinated indebtedness. The incremental term loan facility is guaranteed and secured on the same basis as the
other credit facilities under the Credit Agreement. If we do not refinance, redeem or discharge our 83/8% Senior Notes on or
prior to January 15, 2018, then, in such event, the maturity of the incremental term loan facility will be accelerated from
December 21, 2018 to January 15, 2018.
The following table summarizes certain key terms including the LIBOR-based borrowing rates of our senior secured
credit facility as of December 31, 2013 (in thousands):
Credit Facility
Revolving
Facility
Final maturity date
10/26/2017
Available balance as of December 31, 2013.................................................... $
70,000
Interest rate ......................................................................................................
Applicable margin ...........................................................................................
Total.................................................................................................................
F-27
0.17%
2.75%
2.92%
Term Loans
Incremental
Term Loans
10/26/2017
$
—
12/21/2018
$
—
0.17%
2.75%
2.92%
1.00%
3.00%
4.00%
LIN Media LLC
Notes to Consolidated Financial Statements (Continued)
During the year ended December 31, 2011, we recorded a loss on extinguishment of debt of $0.2 million consisting of
a write-down of deferred financing fees related to the revolving credit facility and term loans under our 2009 senior secured
credit facility.
8 /8% Senior Notes
83/8% Senior Notes
Final maturity date .............................................................................................................................................
Annual interest rate ............................................................................................................................................
Payable semi-annually in arrears .......................................................................................................................
4/15/2018
8.375%
April 15th
October 15th
Our 83/8% Senior Notes are unsecured but rank equally in right of payment with all senior secured indebtedness and
senior to all subordinated indebtedness.
The indenture governing our 83/8% Senior Notes contains covenants limiting our ability and the ability of our restricted
ricted
r
into certain transactions with affiliates. These covenants are subject to certain exceptions and qualifications. The indenture
also has change of control provisions which may require our Company to purchase our 83/8% Senior Notes at a price equal to
101% of the principal amount thereof, together with accrued and unpaid interest. Additionally, if we sell assets under certain
circumstances, we will be required to make an offer to purchase our 83/8% Senior Notes at their face amount, plus accrued and
unpaid interest, if any, through the purchase date.
6 /8% Senior Notes
63/8% Senior Notes
Final maturity date............................................................................................................................................
Annual interest rate...........................................................................................................................................
Payable semi-annually in arrears ......................................................................................................................
1/15/2021
6.375%
January 15th
July 15th
On October 12, 2012, we completed the issuance and sale of $290 million in aggregate principal amount of our 63/8%
Senior Notes. The net proceeds of our 63/8% Senior Notes were used to fund the remaining purchase price for the Acquisition
as further described in Note 2—"Acquisitions."
Our 63/8% Senior Notes are unsecured but rank equally in right of payment with all senior secured indebtedness and
senior to all subordinated indebtedness.
The indenture governing our 63/8% Senior Notes contains covenants limiting our ability and the ability of our restricted
ricted
r
into certain transactions with affiliates. These covenants are subject to certain exceptions and qualifications. The indenture
also has change of control provisions which may require our Company to purchase our 63/8% Senior Notes at a price equal to
101% of the principal amount thereof, together with accrued and unpaid interest. Additionally, if we sell assets under certain
circumstances, we will be required to make an offer to purchase our 63/8% Senior Notes at their face amount, plus accrued
and unpaid interest, if any, through the purchase date.
F-28
LIN Media LLC
Notes to Consolidated Financial Statements (Continued)
6/
/
During the years ended December 31, 2012 and 2011, we redeemed $252 million and $165 million, respectively, of our
61/2% Senior Subordinated Notes. The redemption of these notes, at par, was funded in part by proceeds from the term loan,
incremental term loan, the revolving credit facility and cash on hand. As a result of these redemptions, during the years ended
December 31, 2012 and 2011, we recorded a loss on extinguishment of debt of $2.1 million and $1.5 million, respectively,
associated with a write-down of deferred financing fees and unamortized discount to our consolidated statement of operations.
As part of the transactions further described in Note 2—"Acquisitions," we assumed $15.1 million in capital lease
obligations related to buildings and equipment. These leases mature over a period of 4 to 19 years and are payable in monthly
installments. The total outstanding balance of these capital lease obligations was $14.6 million as of December 31, 2013. LIN
Television fully and unconditionally guarantees these lease obligations.
During the year ended December 31, 2012, Vaughan, a consolidated VIE, entered into a term loan with an unrelated
third party in an original principal amount of $4.6 million to fund a portion of the purchase price for the acquisition of certain
assets of PBC. This term loan matures in equal quarterly installments through October 2017. LIN Television fully and
unconditionally guarantees this loan.
During the year ended December 31, 2012, KASY, a consolidated VIE, entered into a term loan with an unrelated third
party in an original principal amount of $1.7 million to fund a portion of the purchase price for the acquisition of certain assets
of ACME. This term loan matures in equal quarterly installments through December 2017. LIN Television fully and
unconditionally guarantees this loan.
During the year ended December 31, 2011, WBDT, a consolidated VIE, entered into a term loan with an unrelated third
party in an original principal amount of $0.9 million to fund a portion of the purchase price for the acquisition of certain assets
of WBDT-TV. This term loan matures in equal quarterly installments through May 2016. LIN Television fully and
unconditionally guarantees this loan.
The following table summarizes scheduled future principal repayments on our debt agreements and capital leases (in
thousands):
Revolving
Facilities
Final maturity date .... 10/26/2017
2014........................... $
—
2015...........................
—
2016...........................
—
Term Loans
Incremental
Term Loans
10/26/2017
12/21/2018
$
(1)
12,500
$
3,200
83/8%
Senior
Notes
63/8%
Senior
Notes
4/15/2018
$
—
Capital
Leases
1/15/2021
$
—
Other
Debt
Various
$
502
Total
Various
$
1,162
$
17,364
18,750
3,200
—
—
528
1,162
23,640
25,000
3,200
—
—
620
1,024
29,844
62,500
3,200
—
—
577
819
72,096
2017...........................
5,000
2018...........................
—
—
301,400
200,000
—
609
—
502,009
2019 and thereafter....
—
—
—
—
290,000
11,768
—
301,768
200,000
$ 290,000
$ 14,604
4,167
$ 946,721
Total .......................... $
5,000
$
118,750
$
314,200
$
$
_______________________________________________________________________________
(1)
An additional $25 million was outstanding on our revolving credit facility as of the date of this report and is not reflected in our balance
sheet as of December 31, 2013.
F-29
LIN Media LLC
Notes to Consolidated Financial Statements (Continued)
The fair values of our long-term debt are estimated based on quoted market prices for the same or similar issues (Level 2
inputs of the three-level fair value hierarchy). The carrying amounts and fair values of our long-term debt were as follows (in
thousands):
December 31, 2013
Carrying
Amount
December 31, 2012
Estimated
Fair Value
Carrying
Amount
Estimated
Fair Value
(in thousands)
Revolving credit loans ......................................................... $
Term loans............................................................................
Senior notes..........................................................................
Other debt.............................................................................
Total ..................................................................................... $
5,000
430,921
490,000
4,167
930,088
$
$
5,000
432,105
512,983
4,167
954,255
$
$
—
379,945
490,000
5,401
875,346
$
$
—
380,599
524,500
5,401
910,500
Note 8—Derivative Financial Instruments
We have historically used derivative financial instruments in the management of our interest rate exposure for our longterm debt. In accordance with our interest rate risk management policy, we do not enter into derivative instruments unless
there is an underlying exposure, and we do not enter into derivative financial instruments for speculative trading purposes.
During the second quarter of 2006, we entered into a contract to hedge a notional amount of the declining balances of
our term loans under our prior senior secured credit facility (the "2006 interest rate hedge") to mitigate changes in our cash
flows resulting from fluctuations in interest rates. The 2006 interest rate hedge was historically designated as a cash flow
hedge, however, as a result of a repayment of $45.9 million of principal on our term loans under our 2009 senior secured
credit facility during 2010, the 2006 interest rate hedge ceased to be highly effective in hedging the variable rate cash flows.
As a result, all changes in fair value were recorded in our consolidated statement of operations, including a gain of approximately
$2 million for the year ended December 31, 2011.
The 2006 interest rate hedge expired on November 4, 2011. Accordingly, there are no amounts related to the 2006
interest rate hedge included in our consolidated balance sheets as of December 31, 2013 and 2012.
As of December 31, 2013, we have no derivative contracts outstanding.
Note 9—Share-Based Compensation
We have several share-based compensation plans, including our 1998 Option Plan, the Amended and Restated 2002
Stock Plan and the Amended and Restated 2002 Non-Employee Director Stock Plan (collectively, the "Stock Plans"), that
permit us to grant non-qualified options in our class A common shares or restricted share awards, to certain directors, officers
and key employees of our Company.
Options granted under the Stock Plans vest over a four-year service period, unless otherwise designated by the
Compensation Committee upon grant. Options expire ten years from the date of grant. We issue new shares of our class A
common shares when options are exercised or from shares that we repurchased pursuant to our Board authorized share
repurchase program as further described in Note 11—"Shareholders' Equity." Restricted share awards vest over a service
period designated by the Compensation Committee upon grant. There were 6,787,940 shares authorized for grant under the
various Stock Plans and 2,375,605 shares available for future grant as of December 31, 2013. Both the shares authorized and
shares available exclude 1,552,983 shares under plans in effect prior to 2002 from which we do not intend to re-grant and
consider unavailable for future grants.
The following table presents the share-based compensation expense included in our consolidated statements of operations
as follows (in thousands):
F-30
LIN Media LLC
Notes to Consolidated Financial Statements (Continued)
Year Ended December 31,
2013
Employee share options................................................................................... $
Restricted share awards ...................................................................................
Modifications to share option agreements.......................................................
Total share-based compensation...................................................................... $
2012
2,933
6,348
93
9,374
$
$
1,868
4,896
93
6,857
2011
$
1,492
4,320
364
6,176
$
We did not capitalize any share-based compensation expense for the years ended December 31, 2013, 2012 and 2011.
We have not yet recognized compensation expense relating to unvested employee share options and restricted share
awards of $2.6 million and $14 million, respectively, which will be recognized over a weighted-average future period of
approximately 1.3 years and 1.7 years, respectively.
During the year ended December 31, 2013, we received $1.4 million from the exercise of share options and $0.4 million
from the purchase of our class A common stock pursuant to our employee stock purchase plan ("ESPP"), which terminated
upon consummation of the Merger.
Share Options
The following table provides additional information regarding our share options for the year ended December 31, 2013
as follows (in thousands, except per share data):
WeightedAverage
Exercise Price
Per Share
Shares
Outstanding at the beginning of the year ....................................................................................
Granted during the year...............................................................................................................
Exercised or converted during the year.......................................................................................
Forfeited during the year.............................................................................................................
Expired during the year...............................................................................................................
Outstanding at the end of the year ..............................................................................................
Exercisable or convertible at the end of the year ........................................................................
4,894 $
110
(420)
(163)
(9)
4,412
3,304
3.42
12.29
3.23
5.43
3.57
3.58
2.79
As of December 31, 2013, the weighted-average remaining contractual life of the options outstanding and the options
exercisable was 6.1 years and 5.3 years, respectively. Additionally, as of December 31, 2013, the aggregate intrinsic value of
the options outstanding and the options exercisable was $110.7 million and $85.5 million, respectively. The intrinsic value in
the table above represents the total pre-tax intrinsic value based on our closing price as of December 31, 2013, which would
have been received by the option holders had all option holders exercised their options and immediately sold their shares on
that date.
The fair value of each share option grant or modification is estimated on the date of grant or modification using a BlackScholes valuation model, which incorporates the following assumptions:
Year Ended December 31,
2013
Expected term
5 to 6 years
Expected volatility(2)............................................................................................................... 95% to 96%
Expected dividends..........................................................................................
$—
Risk-free rate(3) ......................................................................................................................... 0.8% to 1.2%
(1)
.......................................................................................................................
_______________________________________________________________________________
(1)
The expected term was estimated using our historical experience.
F-31
2012
2011
5 to 6 years
98% to 99%
$—
0.6% to 1.1%
5 to 6 years
97% to 99%
$—
0.9% to 2.6%
LIN Media LLC
Notes to Consolidated Financial Statements (Continued)
(2)
Expected volatility is based on historical trends for our class A common shares over the expected term.
(3)
The risk-free interest rate for each grant is equal to the U.S. Treasury yield curve in effect at the time of grant for instruments with a
similar expected life.
During the years ended December 31, 2013, 2012 and 2011, we recognized share-based compensation expense for a
modification to our share option agreements of $0.1 million, $0.1 million and $0.4 million, respectively, as a result of an
exchange offer we completed in 2009.
Restricted Share Awards
The following table provides additional information regarding the restricted share awards for the year ended
December 31, 2013 (in thousands, except per share data):
WeightedAverage
Price Per
Share
Shares
Unvested at the beginning of the year.........................................................................................
Granted during the year...............................................................................................................
Vested during the year.................................................................................................................
Forfeited during the year.............................................................................................................
Unvested at the end of the year ...................................................................................................
2,294 $
582
(960)
(205)
1,711
5.98
18.89
6.00
5.87
10.37
The following table provides further information for both our restricted share awards and share option awards (in
thousands):
Year Ended December 31,
2013
Total fair value of options and awards granted................................................ $
Total intrinsic value of options exercised........................................................
Total fair value of awards vested.....................................................................
12,349
5,136
18,050
2012
$
10,347
865
7,718
2011
$
4,983
225
7,522
As a result of the Merger, the ESPP was terminated, effective July 30, 2013. Prior to this, under the terms of our ESPP,
our eligible employees could elect to have up to 10% of eligible compensation deducted from their pay to purchase our class A
common stock. The purchase price of each share was 85% of the average of the high and low per share trading price of our
class A common stock on the NYSE on the last trading day of each month during the offering period. During the year ended
December 31, 2013, 2012 and 2011, employees purchased 42,734, 173,244 and 187,350 shares, respectively, at a weightedaverage price of $10.05, $3.55 and $3.38, respectively.
Note 10—Retirement Plans
We provide a defined contribution plan ("401(k) Plan") for eligible employees. Effective January 1, 2010, we began
making a 3% non-elective contribution for all eligible employees, which vests 100% after two years of service. We contributed
$4.8 million, $3.9 million and $3.6 million to the 401(k) Plan in the years ended December 31, 2013, 2012 and 2011,
respectively.
Effective July 1, 2010, we also made available to certain employees, including our executive officers, the LIN Television
Corporation Supplemental Income Deferral Plan ("SIDP"). This plan provides benefits to highly compensated employees in
circumstances in which the maximum limits established under the Employee Retirement Income Security Act of 1974
F-32
LIN Media LLC
Notes to Consolidated Financial Statements (Continued)
("ERISA") and the Internal Revenue Code prevent them from receiving Company contributions. We contributed $0.5 million,
$0.5 million and $0.2 million to this plan during the years ended December 31, 2013, 2012 and 2011, respectively.
The SIDP also allows eligible executive officers to defer 5%- 80% of their base salaries and 5%- 100% of their annual
non-equity incentive awards on a tax-deferred basis and receive tax-deferred market-based growth. During 2013, the Company
made contributions to the SIDP for each of the named executive officers in amounts equal to 5% of their base salary and nonequity incentive plan compensation.
We have historically provided defined benefit retirement plans to our employees who did not receive matching
contributions from our Company to their 401(k) Plan accounts. Our defined benefit plans were non-contributory plans under
which we made contributions either to: a) traditional plan participants based on periodic actuarial valuations, which are
expensed over the expected average remaining service lives of current employees through the LIN Television Corporation
compensation through the Supplemental Benefit Retirement Plan of LIN Television Corporation ("SERP").
Effective April 1, 2009, these plan were frozen and we do not expect to make additional benefit accruals to these plans,
however we continue to fund our existing vested obligations. We contributed $5.4 million, $7.4 million and $5.4 million to
our pension plans during the years ended December 31, 2013, 2012 and 2011, respectively. We anticipate contributing $5.7
million to the plans in 2014.
We record the unfunded status of our defined benefit plans as a liability. For the years ended December 31, 2013 and
December 31, 2012, each plan was underfunded. The plan assets and benefit obligations of our defined benefit plans are
recorded at fair value. Information regarding the change in the projected benefit obligation, the accumulated benefit obligation
and the change in the fair value of plan assets for our traditional defined benefit plan and our cash balance plan are as follows
(in thousands):
Year Ended
December 31,
2013
Change in projected benefit obligation
Projected benefit obligation, beginning of period.......................................................................
Service cost...............................................................................................................................
Interest cost...............................................................................................................................
Actuarial (gain) loss..................................................................................................................
Benefits paid .............................................................................................................................
Curtailment ...............................................................................................................................
Projected benefit obligation, end of period .................................................................................
Accumulated benefit obligation ..................................................................................................
Change in plan assets
Fair value of plan assets, beginning of period ............................................................................
Actual return on plan assets ........................................................................................................
Employer contributions...............................................................................................................
Benefits paid ...............................................................................................................................
Fair value of plan assets, end of period.......................................................................................
Unfunded status of the plan ........................................................................................................
Total amount recognized as accrued benefit liability..................................................................
$
$
$
$
$
$
$
2012
134,969 $
—
5,259
(10,282)
(4,943)
—
125,003 $
125,003 $
133,047
—
5,379
1,485
(4,942)
—
134,969
134,969
96,412
10,611
5,359
(4,943)
107,439
(17,564)
(17,564)
82,314
11,621
7,419
(4,942)
96,412
(38,557)
(38,557)
$
$
$
$
The following table includes the pension related accounts recognized on our consolidated balance sheets and the
components of accumulated other comprehensive loss related to the net periodic pension benefit costs (in thousands):
F-33
LIN Media LLC
Notes to Consolidated Financial Statements (Continued)
December 31,
2013
Other accrued expenses (current)................................................................................................
Other liabilities (long-term) ........................................................................................................
Total amount recognized as accrued pension benefit liability ....................................................
Accumulated other comprehensive loss:.....................................................................................
Net loss .....................................................................................................................................
Tax benefit ................................................................................................................................
Net loss, net of tax benefit ........................................................................................................
Pension tax liability ..................................................................................................................
Accumulated other comprehensive loss related to net periodic pension benefit cost.................
$
$
$
$
2012
(695) $
(16,869)
(17,564) $
32,681
12,915
19,766
5,760
25,526
$
$
(373)
(38,184)
(38,557)
48,978
19,354
29,624
5,760
35,384
The total net loss of $32.7 million for the year ending December 31, 2013 relates to deferred actuarial losses from
changes in discount rates, differences between actual and assumed asset returns, and differences between actual and assumed
demographic experience (rates of turnover, retirement rates, mortality rates and prior to the plan freeze, rates of compensation
increases). During 2014, we expect to amortize net losses of $1.3 million, which are included in accumulated other
comprehensive loss as of December 31, 2013.
The following table includes other changes in plan assets and benefit obligations that were recognized in other
comprehensive income (loss) (in thousands):
December 31,
2013
Net gain (loss) ............................................................................................. $
Amortization of net actuarial loss ...............................................................
Net gain (loss) ............................................................................................. $
Tax benefit (provision)................................................................................
Total amount recognized in other comprehensive income (loss)................ $
2012
14,443
1,854
16,297
6,439
9,858
$
$
$
2011
3,947
1,578
5,525
2,132
3,393
$
$
$
(18,503)
753
(17,750)
(6,912)
(10,838)
Components of net periodic pension benefit cost were (in thousands):
Year Ended December 31,
2013
Service cost...................................................................................................... $
Interest cost......................................................................................................
Expected return on plan assets ........................................................................
Amortization of prior service cost...................................................................
Amortization of net loss ..................................................................................
Net periodic benefit cost (gain) ....................................................................... $
— $
5,259
(6,450)
—
1,854
663 $
2012
— $
5,379
(6,190)
—
1,579
768 $
Our expected future pension benefit payments for the next 10 years are as follows (in thousands):
F-34
2011
—
5,872
(6,824)
—
754
(198)
LIN Media LLC
Notes to Consolidated Financial Statements (Continued)
Expected Future Pension
Benefit Payments
For Years Ended December 31,
2014 ............................................................................................................................................................ $
2015 ............................................................................................................................................................
2016 ............................................................................................................................................................
2017 ............................................................................................................................................................
2018 ............................................................................................................................................................
2019 through 2023......................................................................................................................................
7,914
5,879
5,955
5,966
6,281
38,156
Weighted-average assumptions used to estimate our pension benefit obligations and to determine our net periodic pension
benefit cost are as follows:
Year Ended December 31,
2013
Discount rate used to estimate our pension
benefit obligation ........................................
Discount rate used to determine net
periodic pension benefit..............................
Rate of compensation increase ...................
Expected long-term rate-of-return on plan
assets ...........................................................
2012
2011
SERP
Retirement
Plan
SERP
Retirement
Plan
4.70%
5.00%
3.60%
4.00%
3.90%
4.20%
3.60%
N/A
4.00%
N/A
3.90%
N/A
4.20%
N/A
5.25%
N/A
5.25%
N/A
N/A
7.00%
N/A
7.00%
N/A
7.00%
SERP
Retirement
Plan
For the discount rate for the years ended December 31, 2013 and 2012, we used a custom bond modeler that develops
to settle the obligations of the plan. The yield on this hypothetical portfolio represents a reasonable rate to value our plan
liability.
We considered the current levels of expected returns on a risk-free investment, the historical levels of risk premium
associated with each of our pension asset classes, the expected future returns for each of our pension asset classes and then
weighted each asset class based on our pension plan asset allocation to derive an expected long-term return on pension plan
assets. During the years ended December 31, 2013, 2012 and 2011, our actual rate of return on plan assets was 12.0%, 15.4%
and 4.0%.
Our investment objective is to achieve a consistent total rate-of-return that will equal or exceed our actuarial assumptions
and to equal or exceed the benchmarks that we use for each of our pension plan asset classes. The following asset allocation
is designed to create a diversified portfolio of pension plan assets that is consistent with our target asset allocation and risk
policy:
Target Allocation
Asset Category
2013
Equity securities ............................................................................................
Debt securities...............................................................................................
60%
40%
100%
Percentage of Plan Assets
as of December 31,
2013
2012
60%
40%
100%
55%
45%
100%
The following table summarizes our pension plan assets measured at fair value using the prescribed three-level fair
value hierarchy as of December 31, 2013 and 2012 (in thousands):
F-35
LIN Media LLC
Notes to Consolidated Financial Statements (Continued)
Quoted Prices
in Active
Markets for
Identical
Assets
Significant
Observable
Inputs
(Level 1)
(Level 2)
Total
December 31, 2013:
Cash and cash equivalents................................................................... $
Money market fund .............................................................................
Commingled pools:
690
—
U.S. equity ........................................................................................
International equity...........................................................................
REIT .................................................................................................
High yield bond ................................................................................
Emerging markets.............................................................................
Investment grade fixed income.........................................................
Total..................................................................................................... $
December 31, 2012:
—
—
—
—
—
—
690
Cash and cash equivalents................................................................... $
Money market fund .............................................................................
Commingled pools:
573
—
U.S. equity ........................................................................................
International equity...........................................................................
REIT .................................................................................................
High yield bond ................................................................................
Emerging markets.............................................................................
Investment grade fixed income.........................................................
Total..................................................................................................... $
—
—
—
—
—
—
573
$
$
$
$
—
762
37,645
18,884
3,213
4,101
5,994
36,150
106,749
—
519
30,034
15,241
3,875
2,916
6,374
36,880
95,839
$
$
$
$
690
762
37,645
18,884
3,213
4,101
5,994
36,150
107,439
573
519
30,034
15,241
3,875
2,916
6,374
36,880
96,412
The commingled pools, U.S. and International stock funds and U.S. bond funds consist of various funds that are valued
at the net asset value of units held by the plan at year-end as determined by the custodian, based on fair value of the underlying
securities. These methods may produce a fair value calculation that may not be indicative of net realizable value or reflective
of future values. Furthermore, while we believe these valuation methods are appropriate and consistent with other market
participants, the use of different methodologies or assumptions to determine fair value of certain financial instruments could
result in different fair value measurement as of the reporting date.
Note 11—Shareholders' Equity
During the year ended December 31, 2011, our Board of Directors approved a stock repurchase program that authorized
us to repurchase up to $25 million of our class A common shares over a 12 month period. This program was extended by our
Board of Directors in November 2012 and was scheduled to expire on the earlier of the completion of all purchases contemplated
terminated the share repurchase program. Prior to the termination, during the year ended December 31, 2012, we repurchased
approximately 3.3 million shares of our class A common shares on the open market for an aggregate purchase price of $11.4
million. We did not repurchase any shares during the year ended December 31, 2013.
Our class B common shares are convertible into an equal number of shares of our class A or class C common shares in
various circumstances. During the year ended December 31, 2013, 2.5 million shares of our class B common shares were
converted into class A common shares. During the year ended December 31, 2012, none of our class B common shares were
converted into class A common shares.
F-36
Note 12—Restructuring and Contract Termination Costs
During the year ended December 31, 2013, we recorded restructuring charges of $3.9 million primarily related to
severance and related costs associated with the integration of the television stations acquired during 2012. During the years
ended December 31, 2012 and 2011, we recorded restructuring charges of $1.0 million and $0.7 million, respectively, as a
result of severance and related costs as well as the consolidation of certain activities at our stations and our corporate
headquarters. During the years ended December 31, 2013, 2012 and 2011, we made cash payments of $4.2 million, $0.8
million and $1.1 million related to these restructuring actions. We expect to make cash payments of $0.4 million related to
these restructuring actions during 2014.
The activity for these restructuring charges relating to severance and related costs is as follows (in thousands):
Severance and
Related
Balance as of December 31, 2011................................................................... $
Charges............................................................................................................
Payments .........................................................................................................
Balance as of December 31, 2012................................................................... $
Charges............................................................................................................
Payments .........................................................................................................
Balance as of December 31, 2013................................................................... $
515
1,009
(807)
717
3,895
(4,189)
423
In December 2013, we terminated an agreement with a service provider that provided national sales representation and
made a payment of $5.4 million to exit our agreement prior to its expiration. Concurrent with the termination of the agreement,
we released $1.5 million of deferred credits associated with the terminated contract. The amount of the one-time termination
payment, offset by the release of the deferred credits, has been reflected as Contract termination costs in our consolidated
statement of operations for 2013.
Note 13—Commitments and Contingencies
Commitments
We lease land, buildings, vehicles and equipment pursuant to non-cancelable operating lease agreements and we contract
for general services pursuant to non-cancelable operating agreements that expire at various dates through 2036. In addition,
we have entered into commitments for future syndicated entertainment and sports programming. Future payments for these
non-cancelable operating leases and agreements, and future payments associated with syndicated television programs as of
December 31, 2013 are as follows (in thousands):
Operating Leases
and Agreements
Syndicated
Television
Programming(1)
Total
Year
2014 ........................................................................................................................ $
2015 ........................................................................................................................
2016 ........................................................................................................................
2017 ........................................................................................................................
2018 ........................................................................................................................
Thereafter ..................................................................................................
Total obligations........................................................................................ $
45,076
33,930
16,140
12,146
1,611
7,139
116,042
$
$
27,119
26,675
17,387
3,133
153
214
74,681
$
$
_____________________________________________
(1)
Includes $6.3 million of program obligations recorded on our consolidated balance sheet as of December 31, 2013.
F-37
72,195
60,605
33,527
15,279
1,764
7,353
190,723
LIN Media LLC
Notes to Consolidated Financial Statements (Continued)
Rent expense, resulting from operating leases, was $5.8 million, $2.5 million and $1.5 million for the years ended
December 31, 2013, 2012 and 2011, respectively.
Contingencies
GECC Guarantee and the Merger
GECC provided secured debt financing for the joint venture between NBCUniversal and us, in the form of an $815.5
million non-amortizing senior secured note due 2023 bearing interest at an initial rate of 8% per annum until March 1, 2013
and 9% per annum thereafter. The GECC Note was an obligation of the joint venture. As of December 31, 2012, we had a
20.38% equity interest in the joint venture and NBCUniversal had the remaining 79.62% equity interest, in which we and
NBCUniversal each had a 50% voting interest. NBCUniversal operated two television stations, KXAS-TV, an NBC affiliate
in Dallas, and KNSD-TV, an NBC affiliate in San Diego, pursuant to a management agreement. LIN TV had previously
guaranteed the payment of principal and interest on the GECC Note.
On February 12, 2013, we, along with our wholly-owned subsidiaries, LIN Television and LIN Texas, entered into, and
simultaneously closed the JV Sale Transaction with subsidiaries of NBCUniversal, the GE Parties, Comcast, and SVH whereby
in exchange for LIN Television causing a $100 million capital contribution to be made to SVH (which was used to prepay a
portion of the GECC Note), LIN TV was released from the GECC Guarantee and any further obligations relating to the shortfall
funding agreements. Further, LIN Texas sold its 20.38% equity interest in SVH to affiliates of NBCUniversal, and the LIN
parties transferred their rights to receivables related to the Shortfall Funding Loans for $1.00.
We accrued for and expensed the $100 million capital contribution to SVH to secure the release of the guarantee and
recorded the related tax effects in our consolidated financial statements as of December 31, 2012, because it represented a
probable and estimable obligation of the Company. In February 2013, we entered into a $60 million Incremental Facility and
utilized $40 million of cash on hand and borrowings under our revolving credit facility to fund the $100 million payment. As
a result of the JV Sale Transaction, after utilizing all of our available Federal net operating loss (“NOL”) carryforwards, we
had an approximate $162.8 million income tax payable remaining, $131.5 million of which was extinguished as a result of
the Merger described below.
On July 30, 2013, LIN TV was merged with and into LIN LLC with LIN LLC continuing as the surviving entity. The
Merger enabled the surviving entity to be classified as a partnership for federal income tax purposes and that change in
classification was treated as a liquidation of LIN TV for federal income tax purposes with the result that LIN TV realized a
capital loss in its 100% equity interest in LIN Television.
Based on an average of the opening and closing trading prices of LIN TV's class A common stock on the day of the
Merger, LIN TV realized a capital loss of approximately $343 million, which represents the difference between its tax basis
in the stock of LIN Television, and the fair market value of this stock as of July 30, 2013. The capital loss realized and existing
net operating losses were used to offset a portion of the capital gain recognized in the JV Sale Transaction and as a result, we
realized tax savings of $131.5 million, resulting in a remaining tax liability of $31.3 million associated with the JV Sale
Transaction. We made state and federal tax payments to settle this tax liability during the fourth quarter of 2013.
As a result of the JV Sale Transaction, neither we nor any of our direct or indirect subsidiaries have any further investment
in or obligations (funding or otherwise) related to SVH, including, without limitation, to make any other unsecured shortfall
loans or payments under the GECC Note or the GECC Guarantee.
Litigation
We are involved in various claims and lawsuits that are generally incidental to our business. We are vigorously contesting
all of these matters. The outcome of any current or future litigation cannot be accurately predicted. We record accruals for
such contingencies to the extent that we conclude it is probable that a liability has been incurred and the amount of the loss
can be reasonably estimated. No estimate of the possible loss or range of loss can be made at this time because the inherently
unpredictable nature of legal proceedings may be exacerbated by various factors, including: (i) the damages sought in the
ntial
F-38
LIN Media LLC
Notes to Consolidated Financial Statements (Continued)
outcomes. Although the outcome of these and other legal proceedings cannot be predicted, we believe that their ultimate
resolution will not have a material adverse effect on us.
Note 14—Income Taxes
Our income before income taxes is solely from domestic operations. The (benefit from) provision for income taxes
consists of the following (in thousands):
Year Ended December 31,
2013
Current:
Federal .............................................................................................................
State .................................................................................................................
Foreign.............................................................................................................
Total current.....................................................................................................
Deferred:
Federal .............................................................................................................
State .................................................................................................................
Total deferred...................................................................................................
Total current and deferred................................................................................
$
$
$
$
2012
26,056
5,636
—
31,692
$
2011
$
$
21
1,571
633
2,225
(124,201) $
(32,911)
(157,112)
(125,420) $
33,865
4,373
38,238
40,463
$
$
$
543
652
—
1,195
(25,907)
8,667
(17,240)
(16,045)
The following table reconciles the amount that would be calculated by applying the 35% federal statutory rate to income
before income taxes to the actual (benefit from) provision for income taxes (in thousands):
Year Ended December 31,
2013
Provision assuming federal statutory rate........................................................ $
10,913
$
State taxes, net of federal tax benefit...............................................................
3,863
State tax law/rate changes, net of federal tax benefit ......................................
—
Change in valuation allowance........................................................................
(18,157)
Share compensation.........................................................................................
(53)
Reserve for tax contingencies..........................................................................
124
Impact of JV Sale Transaction.........................................................................
—
Impact of the Merger .......................................................................................
(124,306)
Non-deductible acquisition and Merger related transaction costs...................
1,645
Other ................................................................................................................
551
$ (125,420)
$
Effective income tax rate on continuing operations ........................................
(402.2)%
2012
7,871
$
5,723
1,883
(4,622)
(17)
633
28,435
—
—
557
40,463
$
179.9%
2011
11,780
1,790
5,703
(36,541)
601
—
—
—
—
622
(16,045)
(47.7)%
During the year ended December 31, 2013, we recognized a $124.3 million tax benefit as a result of the Merger as well
as an $18.2 million tax benefit as a result of the reversal of state valuation allowances. These valuation allowances were
reversed after evaluating our ability to recover certain net operating loss carryforwards due to the change in tax structure as
a result of the Merger, as we concluded the Company will more likely than not be able to realize these deferred tax assets.
The impact of the JV Sale Transaction is a result of entering into and consummating the transactions contemplated by
the JV Transaction Agreement on February 12, 2013, as described further in Note 1—"Basis of Presentation and Summary
of Significant Accounting Policies" and in Note 13—"Commitments and Contingencies." The JV Sale Transaction resulted
in the recognition of $27.5 million and $0.9 million of incremental short-term deferred federal and state tax liabilities,
respectively, in excess of those which were previously established. The financial impact of the JV Sale Transaction and
corresponding tax expense of $28.4 million are reflected in our consolidated financial statements for the year ended
F-39
LIN Media LLC
Notes to Consolidated Financial Statements (Continued)
December 31, 2012. During the first quarter of 2013, approximately $162.8 million of short term deferred liabilities were
reclassified to income taxes payable upon the consummation of the JV Sale Transaction. As a result of the close of the Merger
on July 30, 2013, $131.5 million of this tax liability was extinguished, resulting in a remaining tax liability of approximately
$31.3 million associated with the JV Sale Transaction. We made state and federal tax payments to settle this tax liability
during the fourth quarter of 2013.
The 2011 state tax law/rate change, net of federal tax benefit, of $5.7 million is primarily a result of state tax legislation
enacted in Michigan in May 2011, which repealed the Michigan business tax ("MBT"), and implemented a corporate income
tax instead, effective January 2012. As a result of the elimination of the MBT, certain future tax deductions that were available
to be utilized beginning in 2015, and had been recognized as deferred tax assets in our financial statements, will not be
deductible. Therefore, during the year ended December 31, 2011, we recognized incremental deferred income tax expense of
$5.1 million, net of federal benefit, for the reversal of these previously established deferred tax assets. In addition, the 2012
state tax law/rate change, net of federal tax benefit, of $1.9 million is a result of a change in the effective tax rate used to value
our deferred tax assets/liabilities.
The components of the net deferred tax liability are as follows (in thousands):
December 31,
2013
Deferred gain related to equity investment in NBC joint venture ............................................ $
Property and equipment............................................................................................................
Intangible assets........................................................................................................................
Deferred gain on debt repurchase .............................................................................................
Noncontrolling interest .............................................................................................................
Other .........................................................................................................................................
Total ..................................................................................................................................... $
Net operating loss carryforwards.............................................................................................. $
Equity investments....................................................................................................................
Other .........................................................................................................................................
Valuation allowance..................................................................................................................
Total .....................................................................................................................................
Net deferred tax liabilities........................................................................................................... $
—
11,816
54,859
18,140
849
7,629
93,293
2012
$
$
259,049
12,822
36,761
18,309
549
7,476
334,966
(17,707) $
(2,372)
(15,426)
(110,169)
(1,554)
(32,625)
—
(35,505)
18,157
(126,191)
57,788
$
208,775
We maintain a valuation allowance related to our deferred tax asset position when management believes it is more likely
than not that the deferred tax assets will not be realized in the future. As of December 31, 2012, we had a valuation allowance
of $18.2 million offsetting certain state net operating loss carryforwards and other state deferred tax assets. During the third
quarter of 2013, after evaluating our ability to recover certain net operating loss carryforwards due to the change in tax structure
as a result of the Merger, we determined that we will more likely than not be able to realize these deferred tax assets. As a
result, we reversed the valuation allowance and recognized a corresponding tax benefit of $18.2 million.
As of December 31, 2013, we had federal net operating loss carryforwards (tax effected) of approximately $4.6 million
that begin to expire in 2034. Additionally, we had state net operating loss carryforwards that vary by jurisdiction (tax effected,
net of federal benefit) of $13.1 million, expiring through 2033. Included in the total federal and state net operating loss
carryforwards (tax effected) is $4.9 million that would be recorded in equity when realized.
Unrecognized Tax Benefits.
The Company's uncertain tax positions for the years ended December 31, 2013, 2012, and 2011 are limited to certain
unrecognized state and foreign benefits totaling $24.5 million, $26.6 million and $26.4 million, respectively. As of
F-40
LIN Media LLC
Notes to Consolidated Financial Statements (Continued)
December 31, 2013, 2012 and 2011, there are $0.9 million, $0.8 million and $0 million of unrecognized tax benefits,
respectively, that if recognized would reduce the effective tax rate from continuing operations.
We recognize interest and penalties related to uncertain tax positions as a component of income tax expense. During the
years ended December 31, 2013, 2012 and 2011, we did not recognize or accrue any amounts related to interest and penalties.
A reconciliation of the beginning and ending amounts of unrecognized tax benefits is as follows (in thousands):
Year Ended December 31,
2013
Balance at beginning of year ........................................................................... $
Additions for tax positions of current year......................................................
Additions for tax positions of prior years........................................................
Reductions for tax positions of prior years......................................................
Reductions related to settlements with taxing authorities ...............................
Reductions related to expiration of the statute of limitations..........................
Balance at end of year ..................................................................................... $
26,559 $
733
—
(2,084)
—
(730)
24,478 $
2012
2011
26,381 $
1,798
—
(1,133)
—
(487)
26,559 $
26,610
2,386
—
(2,128)
—
(487)
26,381
We file a consolidated federal income tax return and we file numerous other consolidated and separate income tax returns
in U.S. state jurisdictions. Tax years 2009-2012 remain open to examination by major taxing jurisdictions.
Note 15—Accrued Expenses
Accrued expenses consisted of the following (in thousands):
December 31,
2013
Accrued compensation................................................................................................................ $
Accrued contract costs................................................................................................................
Accrued interest ..........................................................................................................................
Accrued capital contribution to joint venture .............................................................................
Other accrued expenses ..............................................................................................................
Total............................................................................................................................................ $
11,817
3,394
12,168
—
24,317
51,696
2012
$
$
11,275
4,163
7,841
100,000
29,967
153,246
Note 16—Subsequent Events
On February 3, 2014, LIN Digital Media LLC, a wholly owned subsidiary, completed its acquisition of Federated Media
Publishing, Inc. ("Federated Media"), which was subsequently converted into a Delaware limited liability company. Federated
Media is an industry-leading digital content and conversational marketing company. For further information on this acquisition,
see Note 2 — “Acquisitions.”
Note 17—Condensed Consolidating Financial Statements
LIN Television, a 100% owned subsidiary of LIN LLC, is the primary obligor of our senior secured credit facility, our
83/8% Senior Notes and our 63/8% Senior Notes, which are further described in Note 7 — “ Debt”. LIN LLC fully and
unconditionally guarantees all of LIN Television’s debt on a joint-and-several basis. Additionally, all of the consolidated 100%
owned subsidiaries of LIN Television fully and unconditionally guarantee LIN Television’s senior secured credit facility, our
83/8% Senior Notes and our 63/8% Senior Notes on a joint-and-several basis, subject to customary release provisions. There
are certain contractual restrictions on LIN Television’s ability to obtain funds in the form of dividends or loans from the nonguarantor subsidiaries.
F-41
LIN Media LLC
Notes to Consolidated Financial Statements (Continued)
The following condensed consolidating financial statements present the consolidated balance sheets, consolidated
statements of operations, consolidated statements of comprehensive income and consolidated statements of cash flows of LIN
LLC, LIN Television, as the issuer, the guarantor subsidiaries, and the non-guarantor subsidiaries of LIN Television and the
elimination entries necessary to consolidate or combine the issuer with the guarantor and non-guarantor subsidiaries. These
statements are presented in accordance with the disclosure requirements under SEC Regulation S-X Rule 3-10.
The condensed consolidating balance sheet as of December 31, 2012, has been revised to correct certain immaterial
errors relating to intercompany balances. The revisions comprise a $4.3 million decrease in advances to subsidiaries lines in
the LIN Television and the Guarantor Subsidiaries columns, a $4.3 million decrease in intercompany liabilities in the LIN
Television and Non-Guarantor Subsidiaries columns, a $4.3 million decrease in the Total Shareholders’ (deficit) equity line
of the Guarantor column, and a $4.3 million increase in the Total Shareholders’ (deficit) equity line of the Non-Guarantor
column.
F-42
LIN Media LLC
Notes to Consolidated Financial Statements (Continued)
Condensed Consolidating Balance Sheet
As of December 31, 2013
(in thousands)
LIN Media
LLC
LIN Television
Corporation
NonGuarantor
Subsidiaries
Guarantor
Subsidiaries
Consolidating/
Eliminating
Adjustments
LIN Media
LLC
Consolidated
ASSETS
Current assets:
Cash and cash equivalents..................... $
—
Accounts receivable, net .......................
—
Deferred income tax assets ...................
Other current assets...............................
$
10,313
$
3
88,905
39,416
—
5,818
—
12,264
$
2,209
$
—
$
12,525
16,988
—
145,309
1,080
—
—
6,898
1,049
1,888
—
15,201
Total current assets.............................
—
117,300
41,548
21,085
—
179,933
Property and equipment, net ....................
—
180,480
35,752
4,846
—
221,078
Deferred financing costs ..........................
—
16,357
—
91
—
16,448
Goodwill ..................................................
—
169,492
18,518
15,518
—
203,528
Broadcast licenses, net.............................
—
—
493,814
42,701
—
536,515
Other intangible assets, net ......................
—
31,303
1,840
13,906
—
47,049
Advances to consolidated subsidiaries ....
1,900
7,764
968,728
—
(978,392)
—
Investment in consolidated subsidiaries ..
87,227
1,534,600
—
—
(1,621,827)
—
Other assets..............................................
Total assets ......................................... $
—
52,778
2,688
1,276
(44,443)
12,299
89,127
$
2,110,074
$
1,562,888
$
99,423
$ (2,644,662) $
1,216,850
Current portion of long-term debt......... $
—
$
16,112
$
—
$
1,252
Accounts payable ..................................
—
4,185
5,339
4,478
—
14,002
Income taxes payable ............................
—
749
671
—
—
1,420
Accrued expenses..................................
—
42,570
6,254
2,872
—
51,696
Program obligations ..............................
—
4,711
1,013
1,303
—
7,027
13,277
9,905
—
91,509
LIABILITIES, REDEEMABLE
NONCONTROLLING INTEREST
AND SHAREHOLDERS' EQUITY
Current liabilities:
$
—
$
17,364
Total current liabilities........................
—
68,327
Long-term debt, excluding current
portion......................................................
—
924,223
—
3,105
—
927,328
Deferred income tax liabilities.................
—
30,013
33,824
849
—
64,686
Program obligations.................................
—
2,505
217
1,424
—
4,146
Intercompany liabilities ...........................
—
970,628
—
7,764
Other liabilities ........................................
—
27,151
58
44,443
(44,443)
27,209
Total liabilities....................................
—
2,022,847
47,376
67,490
(1,022,835)
1,114,878
(978,392)
Redeemable noncontrolling interest ........
—
—
—
12,845
Total shareholders' equity (deficit) ..........
89,127
87,227
1,515,512
19,088
(1,621,827)
99,423
$ (2,644,662) $
Total liabilities, redeemable
noncontrolling interest and
shareholders' equity (deficit) .............. $
89,127
$
2,110,074
F-43
$
1,562,888
$
—
—
12,845
89,127
1,216,850
LIN Media LLC
Notes to Consolidated Financial Statements (Continued)
Condensed Consolidating Balance Sheet
As of December 31, 2012
(in thousands)
LIN Media
LLC
LIN Television
Corporation
NonGuarantor
Subsidiaries
Guarantor
Subsidiaries
Consolidating/
Eliminating
Adjustments
LIN Media
LLC
Consolidated
ASSETS
Current assets:
Cash and cash equivalents....................... $
—
Accounts receivable, net .........................
—
$
87,103
44,625
$
573
$
31,144
1,109
$
7,903
Deferred income tax assets......................
—
67,412
—
97
Other current assets .................................
—
4,850
554
1,459
—
$
—
46,307
126,150
(67,509)
—
—
6,863
Total current assets ...............................
—
203,990
32,271
10,568
Property and equipment, net ......................
—
197,125
39,534
4,832
(67,509)
—
179,320
Deferred financing costs ............................
—
19,020
—
115
—
19,135
Goodwill ....................................................
—
169,492
18,518
4,504
—
192,514
Broadcast licenses, net ...............................
—
—
493,814
42,701
—
536,515
Other intangible assets, net ........................
—
48,897
2,775
7,882
—
59,554
241,491
Advances to consolidated subsidiaries.......
—
6,746
1,345,971
—
(1,352,717)
—
Investment in consolidated subsidiaries.....
—
1,554,903
—
—
(1,554,903)
—
Other assets ................................................
—
Total assets............................................ $
53,987
2,552
1,626
(45,280)
12,885
—
$
2,254,160
$
1,935,435
$
72,228
$ (3,020,409) $
1,241,414
Current portion of long-term debt ........... $
—
$
9,243
$
—
$
1,513
Accounts payable ....................................
—
14,335
3,385
1,235
—
18,955
Income taxes payable ..............................
—
372
394
—
—
766
Accrued expenses....................................
—
37,020
115,605
621
—
153,246
Deferred income tax liabilities ................
—
—
235,728
—
Program obligations ................................
—
7,479
1,106
2,185
Total current liabilities..........................
—
68,449
356,218
5,554
LIABILITIES, REDEEMABLE
NONCONTROLLING INTEREST
AND SHAREHOLDERS' DEFICIT
Current liabilities:
$
—
$
(67,509)
—
(67,509)
10,756
168,219
10,770
362,712
Long-term debt, excluding current portion
—
875,512
—
3,959
—
879,471
Deferred income tax liabilities...................
—
10,910
29,000
646
—
40,556
Program obligations ...................................
—
2,222
92
1,967
—
4,281
Intercompany liabilities .............................
—
1,345,971
3,842
2,904
(1,352,717)
—
Accumulated losses in excess of
investment in consolidated subsidiaries.....
91,564
—
—
—
(91,564)
—
Other liabilities...........................................
—
42,660
56
45,280
(45,280)
42,716
Total liabilities......................................
91,564
2,345,724
389,208
60,310
(1,557,070)
1,329,736
—
3,242
1,546,227
8,676
(1,463,339)
72,228
$ (3,020,409) $
Redeemable noncontrolling interest ..........
Total shareholders' (deficit) equity.............
Total liabilities, redeemable
noncontrolling interest and
shareholders' equity (deficit) ................ $
—
—
(91,564)
—
(91,564)
$
2,254,160
F-44
$
1,935,435
$
—
3,242
(91,564)
1,241,414
LIN Media LLC
Notes to Consolidated Financial Statements (Continued)
Condensed Consolidating Statement of Operations
For the Year Ended December 31, 2013
(in thousands)
LIN Media
LLC
Net revenues ............................................ $
—
LIN Television
Corporation
$
428,806
NonGuarantor
Subsidiaries
Guarantor
Subsidiaries
$
181,678
$
Consolidating/
Eliminating
Adjustments
55,850
$
LIN Media
LLC
Consolidated
(13,971) $
652,363
Operating expenses:
Direct operating .......................................
—
145,176
76,275
37,295
(7,668)
251,078
Selling, general and administrative..........
—
109,679
40,934
12,516
(579)
162,550
Amortization of program rights ...............
—
21,452
5,690
2,100
—
29,242
Corporate .................................................
709
40,668
—
—
—
41,377
Depreciation.............................................
—
38,306
7,256
1,292
—
46,854
Amortization of intangible assets ............
—
17,594
935
4,297
—
22,826
Restructuring............................................
—
3,633
—
262
—
3,895
Contract termination costs .......................
—
3,887
—
—
—
3,887
Loss from asset dispositions ....................
—
705
5
—
—
710
Operating (loss) income...........................
(709)
47,706
50,583
Interest expense, net.................................
—
56,386
—
221
—
56,607
Share of loss in equity investments .........
—
56
—
—
—
56
Intercompany (income) expense..............
(20)
316
—
—
3
—
2,100
540
—
58,763
(1,912)
(5,724)
89,944
Other (income) expense:
27,947
Other, net .................................................
(28,243)
2,097
—
Total other (income) expense, net............
(20)
86,486
(28,243)
(Loss) income from continuing
operations before taxes and equity in
(loss) income from operations of
consolidated subsidiaries .........................
(689)
(38,780)
78,826
(2,452)
(Benefit from) provision for income
taxes .........................................................
—
(155,975)
31,530
(975)
Net (loss) income from continuing
operations.................................................
(689)
117,195
47,296
(1,477)
Equity in income (loss) from operations
of consolidated subsidiaries.....................
158,802
41,607
—
Net income (loss).....................................
158,113
158,802
47,296
(1,477)
Net loss attributable to noncontrolling
interests ....................................................
—
—
—
(1,512)
Net income (loss) attributable to LIN
Media LLC............................................... $
158,113
$
158,802
F-45
$
47,296
(5,724)
—
—
$
35
(125,420)
(5,724)
156,601
(200,409)
—
(206,133)
156,601
—
$
31,181
(206,133) $
(1,512)
158,113
LIN Media LLC
Notes to Consolidated Financial Statements (Continued)
Condensed Consolidating Statement of Comprehensive Income
For the Year Ended December 31, 2013
(in thousands)
LIN Media
LLC
Net income (loss)................................... $
(1,477) $
(206,133) $
—
—
(8,738)
8,738
Amortization of pension net losses, net
of tax of $734.........................................
1,120
1,120
—
—
(1,120)
1,120
Comprehensive income (loss) ...............
167,971
168,660
47,296
(1,477)
(215,991)
166,459
Comprehensive loss attributable to
noncontrolling interest...........................
—
—
—
(1,512)
168,660
F-46
$
$
47,296
47,296
$
LIN Media
LLC
Consolidated
8,738
$
158,802
Consolidating/
Eliminating
Adjustments
8,738
167,971
$
NonGuarantor
Subsidiaries
Guarantor
Subsidiaries
Pension net gain, net of tax of $5,705 ...
Comprehensive income (loss)
attributable to LIN Media LLC ............. $
158,113
LIN Television
Corporation
$
35
—
$
(215,991) $
156,601
(1,512)
167,971
LIN Media LLC
Notes to Consolidated Financial Statements (Continued)
Condensed Consolidating Statement of Operations
For the Year Ended December 31, 2012
(in thousands)
LIN Media
LLC
Net revenues............................................. $
—
LIN Television
Corporation
$
369,779
Guarantor
Subsidiaries
$
181,458
NonGuarantor
Subsidiaries
$
9,571
Consolidating/
Eliminating
Adjustments
$
LIN Media
LLC
Consolidated
(7,346) $
553,462
Operating expenses:
Direct operating........................................
—
96,504
62,352
5,201
(3,835)
160,222
Selling, general and administrative ..........
—
85,638
37,917
2,152
(440)
125,267
Amortization of program rights ...............
—
16,644
5,437
967
—
23,048
Corporate..................................................
—
30,357
3,889
—
—
34,246
Depreciation .............................................
—
24,061
7,635
453
—
32,149
Amortization of intangible assets.............
—
4,139
935
1,290
—
6,364
Restructuring ............................................
—
1,009
—
—
—
1,009
Loss (gain) from asset dispositions ..........
—
111
(15)
—
—
96
Operating income (loss) ...........................
—
111,316
Interest expense, net .................................
—
46,625
—
Share of loss in equity investments..........
—
153
98,156
Loss on extinguishment of debt ...............
—
3,341
—
Intercompany fees and expenses..............
—
26,549
Other, net..................................................
—
237
—
—
—
Total other expense (income), net............
—
76,905
71,608
155
(98)
148,570
Income (loss) from continuing
operations before taxes and equity in
(loss) income from operations of
consolidated subsidiaries..........................
—
34,411
(8,300)
(647)
(2,973)
22,491
Provision for (benefit from) income
taxes..........................................................
—
44,298
(3,320)
(515)
Net loss from continuing operations ........
—
(9,887)
(4,980)
(132)
Loss from discontinued operations, net ...
—
(251)
(744)
(Loss) gain on the sale of discontinued
operations, net ..........................................
—
(289)
63,308
(492)
(3,071)
171,061
156
(98)
46,683
—
—
98,309
—
—
3,341
(1)
—
—
Other expense (income):
Equity in (loss) income from operations
of consolidated subsidiaries .....................
(7,045)
3,382
Net (loss) income .....................................
(7,045)
(7,045)
Net loss attributable to noncontrolling
interests ....................................................
Net (loss) income attributable to LIN
Media LLC ............................................... $
—
—
(7,045) $
(7,045) $
F-47
(26,548)
11,678
—
237
—
40,463
(2,973)
(17,972)
—
(23)
(1,018)
—
—
11,389
—
3,663
—
5,954
(132)
667
(7,601)
—
(556)
—
(556)
5,954
$
424
$
667
$
(7,045)
LIN Media LLC
Notes to Consolidated Financial Statements (Continued)
Condensed Consolidating Statement of Comprehensive Loss
For the Year Ended December 31, 2012
(in thousands)
LIN Media
LLC
Net (loss) income..................................... $
Pension net gain, net of tax of $1,523 .....
Amortization of pension net losses, net
of tax of $609...........................................
Comprehensive (loss) income..................
Comprehensive loss attributable to
noncontrolling interest .............................
Comprehensive (loss) income
attributable to LIN Media LLC................ $
LIN Television
Corporation
(7,045) $
2,424
969
(3,652)
(7,045) $
2,424
969
(3,652)
—
—
(3,652) $
(3,652) $
F-48
NonGuarantor
Subsidiaries
Guarantor
Subsidiaries
5,954
$
—
(132) $
—
—
(132)
—
(556)
$
424
667
LIN Media
LLC
Consolidated
$
(2,424)
—
5,954
5,954
Consolidating/
Eliminating
Adjustments
(969)
(2,726)
—
$
(2,726) $
(7,601)
2,424
969
(4,208)
(556)
(3,652)
LIN Media LLC
Notes to Consolidated Financial Statements (Continued)
Condensed Consolidating Statement of Operations
For the Year Ended December 31, 2011
(in thousands)
LIN Media
LLC
Net revenues ............................................ $
—
LIN Television
Corporation
$
263,958
NonGuarantor
Subsidiaries
Guarantor
Subsidiaries
$
136,891
$
1,745
Consolidating/
Eliminating
Adjustments
$
LIN Media
LLC
Consolidated
(2,591) $
400,003
Operating expenses:
Direct operating .......................................
—
78,492
53,877
604
(2,355)
130,618
Selling, general and administrative..........
—
69,018
34,825
491
(564)
103,770
Amortization of program rights ...............
—
15,535
5,438
433
—
21,406
Corporate .................................................
—
24,838
1,643
—
—
26,481
Depreciation.............................................
—
19,169
7,030
47
—
26,246
Amortization of intangible assets ............
—
264
868
67
—
1,199
Restructuring............................................
—
707
—
—
—
707
Loss from asset dispositions ....................
—
351
121
—
—
472
Operating income.....................................
—
55,584
33,089
103
328
89,104
Interest expense, net.................................
—
50,688
—
21
(3)
50,706
Share of loss in equity investments .........
—
260
4,697
—
—
4,957
Gain on derivative instruments................
—
(1,960)
—
—
—
(1,960)
Loss on extinguishment of debt...............
—
1,694
—
—
—
1,694
Intercompany fees and expenses .............
—
57,931
(57,945)
Other, net .................................................
—
68
(4)
Other expense (income):
14
—
—
(13)
—
51
(3)
Total other expense (income), net............
—
108,681
(53,252)
22
(Loss) income from continuing
operations before taxes and equity in
income (loss) from operations of
consolidated subsidiaries .........................
—
(53,097)
86,341
81
331
33,656
(Benefit from) provision for income
taxes .........................................................
—
(50,521)
34,536
(60)
—
(16,045)
Net (loss) income from continuing
operations.................................................
—
(2,576)
51,805
141
331
49,701
(Loss) income from discontinued
operations, net..........................................
—
(1,316)
544
—
(148)
Equity in income (loss) from operations
of consolidated subsidiaries.....................
48,577
52,469
—
—
(101,046)
—
Net income (loss).....................................
48,577
48,577
52,349
141
(100,863)
48,781
Net loss attributable to noncontrolling
interests ....................................................
—
—
—
204
Net income (loss) attributable to LIN
Media LLC............................................... $
48,577
$
48,577
F-49
$
52,349
$
(63) $
—
(100,863) $
55,448
(920)
204
48,577
LIN Media LLC
Notes to Consolidated Financial Statements (Continued)
Condensed Consolidating Statement of Comprehensive Income
For the Year Ended December 31, 2011
(in thousands)
LIN Media
LLC
Net income (loss)..................................... $
Pension net loss, net of tax of $(7,291) ...
48,577
LIN Television
Corporation
$
(11,212)
48,577
NonGuarantor
Subsidiaries
Guarantor
Subsidiaries
$
(11,212)
52,349
$
—
141
Consolidating/
Eliminating
Adjustments
$
—
LIN Media
LLC
Consolidated
(100,863) $
11,212
48,781
(11,212)
Amortization of pension net loss, net of
tax of $379 ...............................................
374
374
—
—
(374)
374
Comprehensive income (loss)..................
37,739
37,739
52,349
141
(90,025)
37,943
Comprehensive income attributable to
noncontrolling interest .............................
—
—
—
—
Comprehensive income (loss)
attributable to LIN Media LLC................ $
37,739
$
37,739
F-50
$
52,349
$
141
204
$
(90,229) $
204
37,739
LIN Media LLC
Notes to Consolidated Financial Statements (Continued)
Condensed Consolidating Statement of Cash Flows
For the Year Ended December 31, 2013
(in thousands)
LIN Media
LLC
LIN Television
Corporation
NonGuarantor
Subsidiaries
Guarantor
Subsidiaries
Consolidating/
Eliminating
Adjustments
LIN Media
LLC
Consolidated
OPERATING ACTIVITIES:
Net cash (used in) provided by operating
activities, continuing operations .................... $
(589) $
(1,986) $
50,612
$
930
$
—
$
48,967
INVESTING ACTIVITIES:
Capital expenditures .......................................
—
(22,768)
(3,540)
(3,066)
—
(29,374)
Payments for business combinations, net of
cash acquired ..................................................
—
(10,082)
(10,082)
Proceeds from the sale of assets .....................
—
66
Capital contribution to joint venture with
NBCUniversal ................................................
—
—
Receipt of dividend ........................................
2,000
78,011
—
—
(80,011)
—
Advances on intercompany borrowings .........
(2,000)
(4,550)
—
—
6,550
—
—
—
—
—
20
—
—
—
—
(100,000)
86
(100,000)
Payments from intercompany borrowings .....
—
15,009
145,358
Net cash (used in) provided by investing
activities, continuing operations ....................
(160,367)
—
55,686
41,838
Net proceeds on exercises of employee and
director stock-based compensation ................
589
1,256
—
—
—
1,845
Tax benefit from exercises of share options...
—
1,591
—
—
—
1,591
Proceeds from borrowings on long-term debt
—
139,000
—
Principal payments on long-term debt............
—
(83,846)
—
Payment of long-term debt issue costs ...........
—
(655)
Payment of dividend.......................................
—
(2,000)
Proceeds from intercompany borrowings.......
—
Payments on intercompany borrowings .........
—
(145,358)
(15,009)
—
160,367
—
Net cash provided by (used in) financing
activities............................................................
589
(88,012)
(93,020)
3,236
233,828
56,621
Net (decrease) increase in cash and cash
equivalents ........................................................
—
(34,312)
(570)
1,100
—
(33,782)
Cash and cash equivalents at the beginning of
the period...........................................................
—
44,625
573
1,109
—
46,307
Cash and cash equivalents at the end of the
period ................................................................ $
—
(3,066)
—
(233,828)
(139,370)
FINANCING ACTIVITIES:
—
(78,011)
2,000
$
10,313
F-51
—
—
$
3
—
139,000
—
(85,160)
—
—
(655)
—
80,011
(1,314)
4,550
$
2,209
—
(6,550)
$
—
—
$
12,525
LIN Media LLC
Notes to Consolidated Financial Statements (Continued)
Condensed Consolidating Statement of Cash Flows
For the Year Ended December 31, 2012
(in thousands)
LIN Media
LLC
LIN Television
Corporation
NonGuarantor
Subsidiaries
Guarantor
Subsidiaries
Consolidating/
Eliminating
Adjustments
LIN Media
LLC
Consolidated
OPERATING ACTIVITIES:
Net cash provided by operating activities,
continuing operations ..................................... $
—
Net cash used in operating activities,
discontinued operations..................................
—
Net cash provided by operating activities .....
—
$
142,255
$
(471)
4,998
$
(2,242)
2,159
$
—
23
$
(23)
149,435
(2,736)
141,784
2,756
2,159
—
146,699
(5,709)
(2,363)
—
(28,230)
—
255,159
—
(358,495)
INVESTING ACTIVITIES:
Capital expenditures .......................................
—
(20,158)
Change in restricted cash................................
—
255,159
Payments for business combinations, net of
cash acquired ..................................................
—
(352,162)
Proceeds from the sale of assets .....................
—
Shortfall loan to joint venture with
NBCUniversal ................................................
—
—
—
—
30
(6,333)
49
—
—
(2,292)
—
—
—
79
(2,292)
Advances on intercompany borrowings .........
—
(2,400)
—
—
2,400
—
Payments from intercompany borrowings .....
—
20,382
—
—
(20,382)
—
Net cash used in investing activities,
continuing operations .....................................
—
(101,441)
Net cash provided by investing activities,
discontinued operations..................................
—
6,314
23,206
Net cash (used in) provided by investing
activities............................................................
—
(95,127)
17,546
(5,660)
(8,696)
(17,982)
—
(133,779)
—
(8,696)
29,520
(17,982)
(104,259)
FINANCING ACTIVITIES:
Net proceeds on exercises of employee and
director stock-based compensation ................
—
1,314
—
—
—
1,314
Proceeds from borrowings on long-term debt
—
322,000
—
6,333
—
328,333
Principal payments on long-term debt............
—
(320,374)
—
(1,805)
—
(322,179)
Payment of long-term debt issue costs ...........
—
(10,157)
—
(115)
—
(10,272)
(11,386)
—
—
—
(11,386)
—
2,400
Treasury stock purchased ...............................
—
Proceeds from intercompany borrowings.......
—
—
—
Payments on intercompany borrowings .........
—
Net cash (used in) provided by financing
activities............................................................
—
(18,603)
Net increase (decrease) in cash and cash
equivalents .......................................................
—
Cash and cash equivalents at the beginning
of the period.....................................................
—
Cash and cash equivalents at the end of the
period ............................................................... $
—
$
(2,400)
—
—
(20,382)
—
20,382
(20,382)
6,813
17,982
28,054
(80)
276
—
28,250
16,571
653
833
—
18,057
44,625
F-52
$
573
$
1,109
$
—
(14,190)
$
46,307
LIN Media LLC
Notes to Consolidated Financial Statements (Continued)
Condensed Consolidating Statement of Cash Flows
For the Year Ended December 31, 2011
(in thousands)
LIN Media
LLC
LIN Television
Corporation
NonGuarantor
Subsidiaries
Guarantor
Subsidiaries
Consolidating/
Eliminating
Adjustments
LIN Media
LLC
Consolidated
OPERATING ACTIVITIES:
Net cash provided by operating activities,
continuing operations ..................................... $
—
Net cash (used in) provided by operating
activities, discontinued operations.................
—
(1,180)
Net cash provided by operating activities .....
—
$
52,012
$
10,799
$
103
$
148
926
—
(148)
50,832
11,725
103
—
(7,763)
$
63,062
(402)
62,660
INVESTING ACTIVITIES:
Capital expenditures .......................................
—
(12,266)
(40)
—
(20,069)
Change in restricted cash................................
—
(255,159)
—
—
—
(255,159)
Payments for business combinations, net of
cash acquired ..................................................
—
(10,046)
—
1,013
—
(9,033)
Proceeds from the sale of assets .....................
—
2
—
—
Payments on derivative instruments...............
—
(2,020)
—
—
—
(2,020)
Shortfall loan to joint venture with
NBCUniversal ................................................
—
(2,483)
—
—
—
(2,483)
Other investments, net....................................
—
(375)
—
—
—
(375)
Advances to consolidated subsidiaries ...........
—
(400)
—
—
400
—
Payments from consolidated subsidiaries.......
—
—
—
(3,750)
Net cash (used in) provided by investing
activities, continuing operations ....................
—
(278,927)
(7,761)
973
(3,350)
Net cash used in investing activities,
discontinued operations..................................
—
(106)
(9)
—
Net cash (used in) provided by investing
activities............................................................
—
(279,033)
(7,770)
973
72
3,750
74
—
(289,065)
—
(115)
(3,350)
(289,180)
FINANCING ACTIVITIES:
Net proceeds on exercises of employee and
director stock-based compensation ................
—
841
—
—
—
841
Proceeds from borrowings on long-term debt
—
417,695
—
—
—
417,695
Principal payments on long-term debt............
—
(174,573)
—
(643)
—
(175,216)
Payment of long-term debt issue costs ...........
—
(7,662)
—
—
—
(7,662)
Treasury stock purchased ...............................
—
(2,729)
—
—
—
(2,729)
Proceeds from intercompany borrowings.......
—
—
—
400
(400)
—
Payments on intercompany borrowings .........
—
—
(3,750)
—
3,750
—
Net cash provided by (used in) financing
activities, continuing operations ....................
—
233,572
(3,750)
(243)
3,350
232,929
Net cash provided by (used in) financing
activities............................................................
—
233,572
(3,750)
(243)
3,350
232,929
Net increase in cash and cash equivalents ....
—
5,371
205
833
—
6,409
Cash and cash equivalents at the beginning
of the period.....................................................
—
11,200
448
—
—
11,648
Cash and cash equivalents at the end of the
period ............................................................... $
—
$
16,571
F-53
$
653
$
833
$
—
$
18,057
LIN Media LLC
Notes to Consolidated Financial Statements (Continued)
Note 18—Unaudited Quarterly Data
Quarter Ended
March 31,
2013
June 30,
2013
September 30,
2013
December 31,
2013
(in thousands, except per share data)
Net revenues.........................................................................
Operating income.................................................................
(Loss) income from continuing operations ..........................
Net (loss) income attributable to LIN Media LLC ..............
Basic (loss) earnings per common share from continuing
operations attributable to LIN Media LLC ..........................
Basic (loss) earnings per common share attributable to
LIN Media LLC ...................................................................
Diluted (loss) earnings per common share from continuing
operations attributable to LIN Media LLC ..........................
Diluted (loss) earnings per common share attributable to
LIN Media LLC ...................................................................
Weighted-average number of common shares
outstanding used in calculating income per common
share:
$
$
$
$
140,992
11,776
(1,020)
(856)
$
$
$
$
164,346
26,916
7,169
7,475
$
$
$
$
163,110
23,226
146,508
146,938
$
(0.02) $
0.14
$
$
(0.02) $
0.14
$
(0.02) $
$
(0.02) $
Basic ..................................................................................
Diluted ...............................................................................
51,910
51,910
$
$
$
$
183,915
28,026
3,944
4,556
2.78
$
0.09
$
2.78
$
0.09
0.13
$
2.63
$
0.08
0.13
$
2.63
$
0.08
52,278
55,595
(1)
52,791
55,855
52,879
56,240
________________________________________
(1)
During the year ended December 31, 2013, we recognized a $124.3 million tax benefit as a result of the Merger as well as an $18.2 million tax benefit
as a result of the reversal of state valuation allowances. For further discussion, see Note 14 - "Income Taxes."
Quarter Ended
March 31,
2012
June 30,
2012
September 30,
2012
December 31,
2012
(in thousands, except per share data)
Net revenues.........................................................................
Operating income.................................................................
Income (loss) from continuing operations ...........................
(Loss) income from discontinued operations.......................
Net income (loss) attributable to LIN Media LLC ..............
Basic earnings (loss) per common share from continuing
operations attributable to LIN Media LLC ..........................
Basic earnings (loss) per common share attributable to
LIN Media LLC ...................................................................
Diluted earnings (loss) per common share from continuing
operations attributable to LIN Media LLC ..........................
Diluted earnings (loss) per common share attributable to
LIN Media LLC ...................................................................
Weighted-average number of common shares
outstanding used in calculating income per common
share:
$
$
$
$
$
121,016
34,995
15,457
11,602
27,118
$
$
$
$
$
133,076
44,367
19,619
—
19,659
$
$
$
$
$
196,170
71,239
(58,163)
4,266
$
$
$
$
$
$
0.10
$
0.28
$
0.37
$
(1.09)
$
0.08
$
0.49
$
0.37
$
(1.09)
$
0.10
$
0.27
$
0.36
$
(1.09)
$
0.08
$
0.48
$
0.36
$
(1.09)
Basic ..................................................................................
Diluted ...............................................................................
103,200
20,460
5,115
(1,231)
56,184
57,512
F-54
55,174
56,300
53,066
54,353
—
(58,088)
53,169
53,169
LIN Media LLC
Notes to Consolidated Financial Statements (Continued)
Note 19—Supplemental Disclosure of Cash Flow Information
Year Ended December 31,
2013
Cash paid for interest expense ........................................................................
Cash paid for income taxes—continuing operations ......................................
Non-cash investing activities:
Accrual for estimated shortfall loans to SVH .................................................
Non-cash financing activities:
Capital leases assumed in acquisitions............................................................
2012
(in thousands)
2011
$
$
48,646
32,937
$
$
42,348
1,103
$
$
47,801
559
$
—
$
—
$
4,697
$
179
$
14,896
$
—
Note 20—Valuation and Qualifying Accounts
Balance at
Beginning of
Period
Charged
(Released) to
Operations
Balance at
End of
Period
Deductions
(in thousands)
Allowance for doubtful accounts as of December 31,
2013 .....................................................................................
2012 .....................................................................................
2011 .....................................................................................
Valuation allowance for state and federal deferred tax
assets as of December 31,
2013 .....................................................................................
2012 .....................................................................................
2011 .....................................................................................
$
$
$
3,599
2,310
2,194
$
$
$
$
$
$
18,157
23,422
59,990
$
$
$
F-55
1,608
2,047
760
$
$
$
(18,157) $
(5,265) $
(36,568) $
(2,019) $
(758) $
(644) $
3,188
3,599
2,310
—
—
—
—
18,157
23,422
$
$
$
Report of Independent Registered Public Accounting Firm
To the Board of Directors and Shareholder of LIN Television Corporation:
In our opinion, the consolidated financial statements listed in the accompanying index present fairly, in all material respects,
the financial position of LIN Television Corporation and its subsidiaries at December 31, 2013 and December 31, 2012, and
the results of their operations and their cash flows for each of the three years in the period ended December 31, 2013 in
conformity with accounting principles generally accepted in the United States of America. Also in our opinion, the Company
maintained, in all material respects, effective internal control over financial reporting as of December 31, 2013 based on
criteria established in
issued by the Committee of Sponsoring Organizations
of the Treadway Commission (COSO). The Company's management is responsible for these financial statements, for
maintaining effective internal control over financial reporting and for its assessment of the effectiveness of internal control
over financial reporting, included in Management's Report on Internal Control over Financial Reporting appearing under Item
9A. Our responsibility is to express opinions on these financial statements and on the Company's internal control over financial
reporting based on our integrated audits. We conducted our audits in accordance with the standards of the Public Company
Accounting Oversight Board (United States). Those standards require that we plan and perform the audits to obtain reasonable
assurance about whether the financial statements are free of material misstatement and whether effective internal control over
financial reporting was maintained in all material respects. Our audits of the financial statements included examining, on a
test basis, evidence supporting the amounts and disclosures in the financial statements, assessing the accounting principles
used and significant estimates made by management, and evaluating the overall financial statement presentation. Our audit
of internal control over financial reporting included obtaining an understanding of internal control over financial reporting,
assessing the risk that a material weakness exists, and testing and evaluating the design and operating effectiveness of internal
control based on the assessed risk. Our audits also included performing such other procedures as we considered necessary
in the circumstances. We believe that our audits provide a reasonable basis for our opinions.
A company’s internal control over financial reporting is a process designed to provide reasonable assurance regarding the
reliability of financial reporting and the preparation of financial statements for external purposes in accordance with generally
accepted accounting principles. A company’s internal control over financial reporting includes those policies and procedures
that (i) pertain to the maintenance of records that, in reasonable detail, accurately and fairly reflect the transactions and
permit preparation of financial statements in accordance with generally accepted accounting principles, and that receipts and
expenditures of the company are being made only in accordance with authorizations of management and directors of the
or disposition of the company’s assets that could have a material effect on the financial statements.
Because of its inherent limitations, internal control over financial reporting may not prevent or detect misstatements. Also,
projections of any evaluation of effectiveness to future periods are subject to the risk that controls may become inadequate
because of changes in conditions, or that the degree of compliance with the policies or procedures may deteriorate.
As described in Management's Report on Internal Control over Financial Reporting, management has excluded Dedicated
Media, Inc. (“Dedicated Media”) and HYFN, Inc. (“HYFN”) from its assessment of internal control over financial reporting
as of December 31, 2013 because they were acquired by the Company in purchase business combinations in April 2013. We
have also excluded Dedicated Media and HYFN from our audit of internal control over financial reporting. Dedicated Media
and HYFN’s assets each represent 1% of consolidated total assets as of December 31, 2013, and net revenues from Dedicated
Media and HYFN represent 3% and less than 1%, respectively, of consolidated net revenue for the year ended December 31,
2013.
/s/PricewaterhouseCoopers LLP
Hartford, Connecticut
March 3, 2014
F-56
LIN Television Corporation
Consolidated Balance Sheets
December 31,
2013
2012
(in thousands, except share data)
ASSETS
Current assets:
Cash and cash equivalents ............................................................................................................................................ $
Deferred income tax assets ...........................................................................................................................................
Other current assets.......................................................................................................................................................
Total current assets.....................................................................................................................................................
Property and equipment, net ............................................................................................................................................
Deferred financing costs ..................................................................................................................................................
Goodwill ..........................................................................................................................................................................
Broadcast licenses............................................................................................................................................................
Other intangible assets, net ..............................................................................................................................................
Other assets ......................................................................................................................................................................
Total assets (a)...................................................................................................................................................... $
LIABILITIES AND EQUITY (DEFICIT)
Current liabilities:
Current portion of long-term debt................................................................................................................................. $
Accounts payable ..........................................................................................................................................................
Income taxes payable....................................................................................................................................................
Accrued expenses..........................................................................................................................................................
Deferred income tax liabilities......................................................................................................................................
Program obligations ......................................................................................................................................................
Total current liabilities.....................................................................................................................................................
Long-term debt, excluding current portion......................................................................................................................
Deferred income tax liabilities.........................................................................................................................................
Program obligations .........................................................................................................................................................
Other liabilities.................................................................................................................................................................
Total liabilities (a).................................................................................................................................................
Commitments and Contingencies (Note 13)
Redeemable noncontrolling interest ................................................................................................................................
LIN Television Corporation stockholder's deficit:
Common Stock, $0.01 par value, 1,000 shares................................................................................................................
Investment in parent company's stock, at cost .................................................................................................................
Additional paid-in capital ................................................................................................................................................
Accumulated deficit .........................................................................................................................................................
Accumulated other comprehensive loss...........................................................................................................................
Total stockholder's equity (deficit)................................................................................................................................
Total liabilities and deficit ...................................................................................................................................... $
12,525
09
6,898
15,201
180,033
221,078
16,448
203,528
536,515
47,049
12,299
1,216,950
$
17,364
14,002
1,420
51,696
—
7,027
91,509
929,328
64,686
4,146
27,209
1,116,878
$
$
12,845
—
(21,984)
1,140,370
(1,005,633)
(25,526)
87,227
1,216,950 $
46,307
126,150
—
6,863
179,320
241,491
19,135
192,514
536,515
59,554
12,885
1,241,414
10,756
18,955
766
153,246
168,219
10,770
362,712
879,471
40,556
4,281
42,716
1,329,736
3,242
—
(21,984)
1,130,239
(1,164,435)
(35,384)
(91,564)
1,241,414
_______________________________________________________________________________
(a)
Our consolidated assets as of December 31, 2013 and 2012 include total assets of $56,056 and $60,380, respectively, of variable interest
entities ("VIEs") that can only be used to settle the obligations of the VIEs. These assets include broadcast licenses and other intangible
assets of $44,677 and $46,604 and program rights of $2,186 and $2,060 as of December 31, 2013 and 2012, respectively. Our
consolidated liabilities as of December 31, 2013 and 2012 include $4,126 and $4,577, respectively, of total liabilities of the VIEs for
which the VIE's creditors have no recourse to the Company, including $2,727 and $4,152, respectively, of program obligations. See
further description in Note 1—"Basis of Presentation and Summary of Significant Accounting Policies."
The accompanying notes are an integral part of the consolidated financial statements.
F-57
LIN Television Corporation
Consolidated Statements of Operations
Year Ended December 31,
2013
2012
2011
(in thousands, except
per share data)
Net revenues.................................................................................................... $
Operating expenses:
Direct operating ............................................................................................
Selling, general and administrative...............................................................
Amortization of program rights ....................................................................
Corporate ......................................................................................................
Depreciation..................................................................................................
Amortization of intangible assets .................................................................
Restructuring.................................................................................................
Contract termination costs (Note 12)............................................................
Loss from asset dispositions .........................................................................
Operating income ............................................................................................
Other expense:
Interest expense, net......................................................................................
Share of loss in equity investments ..............................................................
Gain on derivative instruments.....................................................................
Loss on extinguishment of debt....................................................................
Other expense, net ........................................................................................
Total other expense, net...................................................................................
Income before (benefit from) provision for income taxes
652,363
(Benefit from) provision for income taxes......................................................
Income (loss) from continuing operations ......................................................
Discontinued operations:
Loss from discontinued operations, net of a benefit from income taxes of
$541 and $595 for the years ended December 31, 2012 and 2011,
respectively ...................................................................................................
Gain on sale of discontinued operations, net of a provision for income
taxes of $6,223 for the year ended December 31, 2012 ...............................
Net income (loss) ............................................................................................
Net (loss) income attributable to noncontrolling interests............................
Net income (loss) attributable to LIN Television Corporation ....................... $
$
553,462
400,003
251,078
162,550
29,242
40,668
46,854
22,826
3,895
3,887
710
90,653
160,222
125,267
23,048
34,246
32,149
6,364
1,009
—
96
171,061
56,627
56
—
—
2,100
58,783
31,870
46,683
98,309
—
3,341
237
148,570
22,491
50,706
4,957
(1,960)
(125,420)
(16,045)
157,290
40,463
(17,972)
—
(1,018)
(920)
—
157,290
(1,512)
158,802
$
11,389
(7,601)
(556)
(7,045) $
The accompanying notes are an integral part of the consolidated financial statements.
F-58
$
130,618
103,770
21,406
26,481
26,246
1,199
707
—
472
89,104
1,694
51
55,448
33,656
49,701
—
48,781
204
48,577
LIN Television Corporation
Consolidated Statements of Comprehensive Income (Loss)
Year Ended December 31,
2013
2012
2011
(in thousands)
Net income (loss) ............................................................................................ $
Pension net gain (loss), net of tax of $5,705, $1,523 and $(7,291) for the
years ended December 31, 2013, 2012 and 2011, respectively ......................
Amortization of pension net losses, net of tax of $734, $609 and $379 for
the years ended December 31, 2013, 2012 and 2011, respectively,
reclassified ......................................................................................................
Comprehensive income (loss) .........................................................................
Comprehensive (loss) income attributable to noncontrolling interest ............
Comprehensive income (loss) attributable to LIN Television Corporation.... $
157,290
$
8,738
2,424
1,120
167,148
(1,512)
168,660
(7,601) $
$
969
(4,208)
(556)
(3,652) $
The accompanying notes are an integral part of the consolidated financial statements.
F-59
48,781
(11,212)
374
37,943
204
37,739
F-60
—
—
—
—
—
—
1,000
Pension liability adjustment, net of tax of
$6,439 ...............................................................
Issuance of LIN Media LLC class A common
shares ................................................................
Tax benefit from exercise of share options.......
Share-based compensation ...............................
Dividend declared.............................................
Net income .......................................................
Balance at December 31, 2013............................
$
$
Amount
—
—
—
—
—
—
—
—
$
$
(21,984) $
—
—
—
—
—
—
(21,984) $
Investment in
Parent
Company's
Common
Shares
(at cost)
1,140,370
—
(2,000)
9,284
1,591
1,256
—
1,130,239
Additional
Paid-In
Capital
$
$
(1,005,633) $
158,802
—
—
—
—
—
158,802
87,227
(25,526) $
(2,000)
9,284
1,591
1,256
9,858
—
—
—
—
—
9,858
(91,564)
Total
Stockholder's
Equity
(35,384) $
Accumulated
Other
Comprehensive
Loss
(1,164,435) $
Accumulated
Deficit
The accompanying notes are an integral part of the consolidated financial statements.
1,000
Balance at December 31, 2012............................
Shares
Common Stock
(in thousands, except share data)
Consolidated Statement of Stockholder's Equity
LIN Television Corporation
F-61
—
—
—
—
1,000
Pension liability adjustment, net of tax of
$2,132 ...............................................................
Stock-based compensation ...............................
Purchase of LIN TV Corp. class A common
shares ................................................................
Net loss .............................................................
Balance at December 31, 2012............................
$
$
Amount
—
—
—
—
—
—
$
$
(21,984) $
—
(11,386)
—
—
(10,598) $
Investment in
Parent
Company's
Common
Stock
(at cost)
1,130,239
—
—
8,106
—
1,122,133
Additional
Paid-In
Capital
$
$
(1,164,435) $
(7,045)
—
—
—
(7,045)
(91,564)
(35,384) $
(11,386)
8,106
3,393
—
—
—
3,393
(84,632)
Total
Stockholder's
Deficit
(38,777) $
Accumulated
Other
Comprehensive
Loss
(1,157,390) $
Accumulated
Deficit
The accompanying notes are an integral part of the consolidated financial statements.
1,000
Balance at December 31, 2011............................
Shares
Common Stock
(in thousands, except share data)
Consolidated Statement of Stockholder's Deficit
LIN Television Corporation
F-62
$
—
(10,598) $
—
1,122,133
—
—
4,773
7,017
$
$
(1,157,390) $
48,577
—
—
—
(1,205,967) $
Accumulated
Deficit
48,577
(84,632)
—
(2,729)
4,773
7,017
(10,838)
(38,777) $
—
—
(10,838)
Total
Stockholder's
Deficit
(27,939) $
(131,432)
Accumulated
Other
Comprehensive
Loss
The accompanying notes are an integral part of the consolidated financial statements.
—
—
—
1,000
Net income .......................................................
Balance at December 31, 2011............................
$
(2,729)
—
—
—
—
—
—
$
—
—
Stock-based compensation ...............................
—
Purchase of LIN TV Corp. class A common
stock..................................................................
—
Pension liability adjustment, net of tax of
$(6,912) ............................................................
Amount
$
Additional
Paid-In
Capital
(7,869) $
1,110,343
Investment in Parent
Company's Common
Stock
(at cost)
Issuance of LIN TV Corp. class A common
stock..................................................................
1,000
Balance at December 31, 2010............................
Shares
Common Stock
(in thousands, except share data)
Consolidated Statements of Stockholder's Deficit
LIN Television Corporation
LIN Television Corporation
Consolidated Statements of Cash Flows
2013
Year ended December 31,
2012
(in thousands)
2011
OPERATING ACTIVITIES:
Net income (loss)........................................................................................................................... $
Loss from discontinued operations................................................................................................
Gain on sale of discontinued operations........................................................................................
Adjustment to reconcile net income to net cash provided by operating activities: .......................
Depreciation ...............................................................................................................................
Amortization of intangible assets ...............................................................................................
Amortization of financing costs and note discounts ..................................................................
Amortization of program rights..................................................................................................
Cash payments for programming ...............................................................................................
Loss on extinguishment of debt..................................................................................................
Gain on derivative instruments...................................................................................................
Share of loss in equity investments ............................................................................................
Deferred income taxes, net .........................................................................................................
157,290
—
—
$
(7,601) $
1,018
(11,389)
48,781
920
—
46,854
22,826
3,638
29,242
(31,677)
—
—
56
(27,222)
32,149
6,364
2,589
23,048
(24,258)
1,830
—
98,309
38,263
26,246
1,199
3,755
21,406
(24,622)
1,694
(1,960)
4,957
(16,586)
Extinguishment of income tax liability related to the Merger....................................................
Share-based compensation .........................................................................................................
Loss from asset dispositions.......................................................................................................
Other, net ....................................................................................................................................
Changes in operating assets and liabilities, net of acquisitions:
Accounts receivable ...................................................................................................................
Other assets.................................................................................................................................
Accounts payable .......................................................................................................................
Income taxes payable .................................................................................................................
Accrued interest expense............................................................................................................
Other liabilities and accrued expenses .......................................................................................
Net cash provided by operating activities, continuing operations ..........................................
Net cash used in operating activities, discontinued operations ...............................................
Net cash provided by operating activities .................................................................................
INVESTING ACTIVITIES:
(131,481)
9,374
710
(1,155)
—
6,857
96
1,724
—
6,176
472
754
(11,058)
(4,254)
(8,679)
654
4,327
(9,889)
49,556
—
49,556
(33,403)
(2,146)
7,983
—
1,746
6,256
149,435
(2,736)
146,699
(8,825)
(138)
3,318
—
(851)
(3,634)
63,062
(402)
62,660
Capital expenditures ...................................................................................................................
Change in restricted cash............................................................................................................
Payments for business combinations, net of cash acquired........................................................
Proceeds from the sale of assets .................................................................................................
Payments on derivative instruments...........................................................................................
Shortfall loans to joint venture with NBCUniversal ..................................................................
(29,374)
—
(10,082)
86
—
—
(28,230)
255,159
(358,495)
79
—
(2,292)
(20,069)
(255,159)
(9,033)
74
(2,020)
(2,483)
Capital contribution to joint venture with NBCUniversal..........................................................
Other investments, net................................................................................................................
Net cash used in investing activities, continuing operations....................................................
Net cash provided by (used in) investing activities, discontinued operations........................
Net cash used in investing activities...........................................................................................
FINANCING ACTIVITIES:
(100,000)
—
(139,370)
—
(139,370)
—
—
(133,779)
29,520
(104,259)
—
(375)
(289,065)
(115)
(289,180)
1,314
—
328,333
—
(322,179)
(10,272)
(11,386)
(14,190)
28,250
18,057
46,307 $
841
—
417,695
—
(175,216)
(7,662)
(2,729)
232,929
6,409
11,648
18,057
Net proceeds on exercises of employee and director share-based compensation ......................
Tax benefit from exercises of share options...............................................................................
Proceeds from borrowings on long-term debt ............................................................................
Payment of dividend...................................................................................................................
Principal payments on long-term debt........................................................................................
Payment of long-term debt issue costs .......................................................................................
Treasury shares purchased..........................................................................................................
Net cash provided by (used in) financing activities ..................................................................
Net (decrease) increase in cash and cash equivalents ...................................................................
Cash and cash equivalents at the beginning of the period.............................................................
Cash and cash equivalents at the end of the period ....................................................................... $
1,256
1,591
141,000
(2,000)
(85,160)
(655)
—
56,032
(33,782)
46,307
12,525 $
The accompanying notes are an integral part of the consolidated financial statements.
F-63
LIN Television Corporation
Notes to Consolidated Financial Statements
Note 1—Basis of Presentation and Summary of Significant Accounting Policies
LIN Television Corporation, a Delaware corporation (“LIN Television”), together with its subsidiaries, is a local
Partners, L.P. (“HMC”). In these notes, the terms “Company,” “we,” “us” or “our” mean LIN Television and all subsidiaries
included in our consolidated financial statements. LIN Television is a wholly-owned subsidiary of LIN Media LLC, a Delaware
limited liability company (“LIN LLC”).
On July 30, 2013, LIN TV Corp., a Delaware corporation (“LIN TV”), completed its merger with and into LIN LLC, a
Delaware limited liability company and wholly owned subsidiary of LIN TV, with LIN LLC as the surviving entity (the
“Merger”) pursuant to the Agreement and Plan of Merger, dated February 12, 2013, by and between LIN TV and LIN LLC
(the “Merger Agreement”). Entry into the Merger Agreement had previously been announced by LIN TV on its Current Report
on Form 8-K filed with the U.S. Securities and Exchange Commission on February 15, 2013.
LIN LLC filed a Current Report on Form 8-K on July 31, 2013 (the “Form 8-K”) for the purpose of establishing LIN
LLC as the successor registrant to LIN TV pursuant to Rule 12g-3(a) under the Securities Exchange Act of 1934, as amended
(the “Exchange Act”), and to disclose certain related matters, including the consummation of the Merger. Pursuant to Rule
12g-3(a) under the Exchange Act and in accordance with the filing of the Form 8-K, the class A common shares representing
limited liability interests in LIN LLC, as the successor registrant to LIN TV, were deemed registered under Section 12(b) of
the Exchange Act. References to "LIN LLC," "we," "us," or the "Company" in this Annual Report on Form 10-K that include
any period at and before the effectiveness of the Merger shall be deemed to refer to LIN TV as the predecessor registrant to
LIN LLC. For more information concerning the effects of the Merger and the succession of LIN LLC to LIN TV upon its
effectiveness, please see the Form 8-K.
LIN LLC's assets, liabilities, and operations relate solely to the administration of the LIN LLC partnership. LIN LLC
guarantees all of our debt. All of the consolidated wholly-owned subsidiaries of LIN Television fully and unconditionally
guarantee our Senior Secured Credit Facility, 83/8% Senior Notes due 2018 (the “83/8% Senior Notes”) and 63/8% Senior Notes
due 2021 (the “63/8% Senior Notes”) on a joint-and-several basis, subject to customary release provisions.
Our consolidated financial statements reflect the operations of WWHO-TV in Columbus, OH and WUPW-TV in Toledo,
OH as discontinued for all periods presented. See Note 3—“Discontinued Operations” for further discussion of our discontinued
operations.
The consolidated financial statements have been prepared in conformity with accounting principles generally accepted
in the United States of America (“U.S. GAAP”). Certain changes in classifications have been made to the prior period financial
statements to conform to the current financial statement presentation. Our significant accounting policies are described below.
The accompanying consolidated financial statements include the accounts of our Company, our wholly-owned and
majority-owned and controlled subsidiaries, and variable interest entities ("VIEs") for which we are the primary beneficiary.
We review all local marketing agreements (“LMAs”), shared services agreements (“SSAs”) or joint sales agreements (“JSAs”),
to evaluate whether consolidation of entities party to such arrangements is required. All intercompany accounts and transactions
have been eliminated. We conduct our business through our subsidiaries and have no operations or assets other than our
investment in our subsidiaries and equity-method investments. We operate in one reportable segment.
Joint Venture Sale Transaction
On February 12, 2013, we, along with LIN TV and our wholly-owned subsidiary, LIN Television of Texas, L.P., a
Delaware limited partnership (“LIN Texas”) entered into and closed the transactions contemplated by a transaction agreement
(the “Transaction Agreement”) with NBC Telemundo License LLC, a Delaware limited liability company (“NBC”), NBCU
New LLC I, a Delaware limited liability company, NBCU New LLC II, a Delaware limited liability company, General Electric
Company, a New York corporation (“GE”), General Electric Capital Corporation, a Delaware corporation (“GECC” and
together with GE, the “GE Parties”), National Broadcasting Company Holding, Inc., a Delaware corporation, Comcast
Corporation, a Pennsylvania corporation (“Comcast”), NBCUniversal Media, LLC, a Delaware limited liability company
(“NBCUniversal”), Lone Star SPV, LLC, a Delaware limited liability company and Station Venture Holdings, LLC, a Delaware
limited liability company (“SVH”). SVH held a 99.75% interest in Station Venture Operations, LP (“SVO”), which is the
F-64
LIN Television Corporation
Notes to Consolidated Financial Statements (Continued)
operating company that managed KXAS-TV and KNSD-TV, the television stations that comprised the joint venture. The
Transaction Agreement effected a series of transactions related to the ownership and sale of LIN Texas’s 20.38% equity interest
in SVH, a joint venture in which NBC, an affiliate of NBCUniversal, held the remaining 79.62% equity interest (collectively,
the “JV Sale Transaction”).
SVH was a limited partner in a business that operated an NBC affiliate in Dallas and an NBC affiliate in San Diego
pursuant to a management agreement. At the time of LIN Texas’s acquisition of its interest in SVH in 1998, GECC provided
secured debt financing to SVH in the form of a $815.5 million non-amortizing senior secured note due 2023 to GECC (the
“GECC Note”), and, in connection with SVH’s assumption of the GECC Note, LIN TV guaranteed the payment of the full
amount of principal and interest on the GECC Note (the “GECC Guarantee”).
In addition, during 2009, 2010, 2011 and 2012, we entered into agreements with SVH, the GE Parties and NBCUniversal
pursuant to which LIN Television, the GE Parties and NBCUniversal caused to be provided to SVH certain unsecured shortfall
funding loans (the “Shortfall Funding Loans”) on the basis of each party’s percentage of equity interest in SVH in order to
fund interest payments on the GECC Note.
Pursuant to the JV Sale Transaction, in exchange for LIN Television causing a $100 million capital contribution to be
made to SVH (which was used to prepay a portion of the GECC Note), LIN TV was released from the GECC Guarantee and
any further obligations related to any shortfall funding agreements. Further, LIN Texas sold its 20.38% equity interest in SVH
to affiliates of NBCUniversal, and the LIN parties transferred their rights to receivables related to the Shortfall Funding Loans
for $1.00. As a result of the JV Sale Transaction, neither we nor any of our direct or indirect subsidiaries have any further
investment in or obligations (funding or otherwise) related to SVH, including, without limitation, to make any other unsecured
shortfall loans or payments under the GECC Note or the GECC Guarantee.
We accrued for and expensed the $100 million capital contribution to SVH to secure the release of the GECC Guarantee
and recorded the related tax effects of the JV Sale Transaction and the capital contribution in our consolidated financial
statements as of December 31, 2012 because it represented a probable and estimable obligation of the Company. In February
2013, we entered into a $60 million incremental term loan facility and utilized $40 million of cash on hand and borrowings
under our revolving credit facility to fund the $100 million capital contribution. As a result of the JV Sale Transaction, LIN
TV, after utilizing all of its available federal net operating loss carryforwards to offset the taxable gain recognized in such
transaction, we had a $162.8 million income tax payable associated with this transaction remaining, $131.5 million of which
was extinguished as a result of the closing of the transactions contemplated by the Merger Agreement further described below.
Concurrent with the closing of the JV Sale Transaction, LIN TV entered into the Merger Agreement with LIN LLC as
described above. The Merger enabled the surviving entity to be classified as a partnership for federal income tax purposes,
and the change in classification was treated as a liquidation of LIN TV for federal income tax purposes, and LIN TV realized
a capital loss in its 100% equity interest in LIN Television.
Based on an average of the opening and closing trading prices of LIN TV's class A common stock on the day of the
Merger, LIN TV realized a capital loss in the amount of approximately $343 million, which represented the difference between
its tax basis in the stock of LIN Television, and the fair market value of such stock as of July 30, 2013. The capital loss realized
and existing net operating losses were used to offset a portion of the capital gain recognized in the JV Sale Transaction and,
we realized cash savings of $131.5 million, resulting in a remaining tax liability of $31.3 million associated with the JV Sale
Transaction. We made state and federal tax payments to settle this tax liability during the fourth quarter of 2013.
In determining whether we are the primary beneficiary of a VIE for financial reporting purposes, we consider whether
we have the power to direct the activities of the VIE that most significantly impact the economic performance of the VIE and
whether we have the obligation to absorb losses or the right to receive returns that would be significant to the VIE. We
consolidate VIEs when we are the primary beneficiary.
We have a JSA and an SSA with WBDT Television, LLC ("WBDT"), a third party licensee, for WBDT-TV in the Dayton,
OH market. We also have JSAs and SSAs with affiliates of Vaughan Acquisition LLC ("Vaughan"), a third party licensee, for
WTGS-TV in the Savannah, GA market, WYTV-TV in the Youngstown, OH market and KTKA-TV in the Topeka, KS market
and SSAs with KASY-TV Licensee, LLC ("KASY"), a third-party licensee, for KWBQ-TV in the Santa Fe, NM market,
KRWB-TV in the Roswell, NM market and KASY-TV in the Albuquerque, NM market. Under these agreements, we provide
administrative services to these stations, have an obligation to reimburse certain of the stations' expenses, and we are
F-65
LIN Television Corporation
Notes to Consolidated Financial Statements (Continued)
compensated through a performance-based fee structure that provides us the benefit of certain returns from the operation of
these stations.
We determined that WBDT, Vaughan and KASY are VIEs and as a result of the JSAs and/or SSAs, we have variable
interests in these entities. We are the primary beneficiary of these entities, and therefore, we consolidate these entities within
our consolidated financial statements.
The carrying amounts and classifications of the assets and liabilities of the variable interest entities described above,
which have been included in our consolidating balance sheets as of December 31, 2013 and 2012 were as follows (in thousands):
December 31,
2013
2012
ASSETS
Current assets:
Cash and cash equivalents ........................................................................................................ $
Accounts receivable, net...........................................................................................................
Other assets...............................................................................................................................
Total current assets...............................................................................................................
Property and equipment, net .......................................................................................................
Broadcast licenses and other intangible assets, net.....................................................................
Other assets .................................................................................................................................
Total assets ...................................................................................................................... $
LIABILITIES
Current liabilities:
Current portion of long-term debt............................................................................................. $
Accounts payable......................................................................................................................
Accrued expenses .....................................................................................................................
Program obligations..................................................................................................................
Total current liabilities.........................................................................................................
Long-term debt, excluding current portion .................................................................................
Program obligations ....................................................................................................................
Other liabilities............................................................................................................................
Total liabilities .............................................................................................................. $
278
6,345
927
7,550
2,469
44,677
1,360
56,056
1,162
63
1,336
1,303
3,864
3,005
1,424
47,763
56,056
$
418
$
6,021
2,092
8,531
3,190
46,604
2,055
60,380
$
$
1,451
—
425
2,185
4,061
3,950
1,967
50,402
60,380
The assets of our consolidated VIEs can only be used to settle the obligations of the VIEs, and may not be sold, or
otherwise disposed of, except for assets sold or replaced with others of like kind or value. Other liabilities of $47.8 million
and $50.4 million as of December 31, 2013 and 2012, respectively, serve to reduce the carrying value of the entities and are
eliminated in our consolidated financial statements. This reflects the fact that as of December 31, 2013 and 2012, LIN Television
has an option that it may exercise if the Federal Communications Commission ("FCC") attribution rules change. The option
would allow LIN Television to acquire the assets or member's interest of the VIE entities for a nominal exercise price, which
is significantly less than the carrying value of their tangible and intangible net assets.
The preparation of financial statements in conformity with U.S. GAAP requires our management to make estimates and
assumptions that affect the amounts reported in the consolidated financial statements and the notes thereto. Our actual results
could differ from these estimates. Estimates are used for the allowance for doubtful accounts in receivables, valuation of
goodwill and intangible assets, assumptions used to determine fair value of financial instruments, amortization and impairment
of program rights and intangible assets, share-based compensation and other long-term incentive compensation arrangements,
F-66
LIN Television Corporation
Notes to Consolidated Financial Statements (Continued)
pension costs, barter transactions, income taxes, employee medical insurance claims, useful lives of property and equipment,
contingencies, litigation and net assets of businesses acquired.
Cash and cash equivalents
Cash equivalents consist of highly liquid, short-term investments that have an original maturity of three months or less
when purchased. All of our available cash is on deposit with banking institutions that we believe to be financially sound. We
had no material losses on our cash or cash equivalents during 2013.
Property and equipment is recorded at cost and is depreciated using the straight-line method over the estimated useful
lives of the assets, which are an average of 30 to 40 years for buildings and fixtures, and 3 to 15 years for broadcast and other
equipment. Upon retirement or other disposition, the cost and related accumulated depreciation of the assets are removed from
the accounts and the resulting gain or loss is included in consolidated net income or loss. Expenditures for maintenance and
repairs, including expenditures for planned major maintenance activities, are expensed as incurred. We review our property
and equipment for impairment whenever events or changes in circumstances indicate that the carrying amount may not be
recoverable.
Equity investments that we do not have a controlling interest in are accounted for using the equity method. Our share
of the net income or loss for these investments, including any equity investment impairments or payments under related
guarantees, is included in share of loss from equity investments on our consolidated statement of operations. We review our
interest in our equity investments for impairment if there is a series of operating losses or other factors that may indicate that
there is a decrease in the value of our investment that is other than temporary.
Revenue recognition
We recognize local, national and political advertising sales, net of agency commissions, during the period in which the
advertisements or programs are aired on our television stations, and when payment is reasonably assured. Internet and mobile
advertisement sales are recognized when the advertisement is displayed on our websites or the websites of our advertising
network. We recognize retransmission consent fees in the period in which our service is delivered. Revenue generated by our
digital companies is recognized over the service delivery period when necessary provisions of the contracts have been met.
In addition, for the sale of third-party products and services by our digital companies, we evaluate whether it is appropriate
to recognize revenue based on the gross amount billed to the customer or the net amount retained by us.
Barter transactions
We account for barter transactions at the fair value of the goods or services we receive from our customers, or the
advertising time provided, whichever is more clearly indicative of fair value based on the judgment of our management. We
record barter advertising revenue at the time the advertisement is aired and barter expense at the time the goods or services
are used. We account for barter programs at fair value based on a calculation using the actual cash advertisements we sell
within barter programs multiplied by one minus the program profit margin for similar syndicated programs where we pay
cash to acquire the program rights. We record barter program revenue and expense when we air the barter program. We do
not record barter revenue or expenses related to network programs. Barter revenue and expense included in the consolidated
statements of operations are as follows (in thousands):
Year Ended December 31,
2013
Barter revenue ................................................................................................. $
Barter expense .................................................................................................
5,552 $
(5,455)
2012
4,220 $
(4,176)
2011
4,071
(3,967)
Advertising expense
Advertising costs are expensed as incurred. We incurred advertising costs in the amounts of $3.9 million, $3.1 million
and $2.6 million for the years ended December 31, 2013, 2012 and 2011, respectively.
F-67
LIN Television Corporation
Notes to Consolidated Financial Statements (Continued)
Intangible assets primarily include broadcast licenses, network affiliations, customer relationships, completed
technology, non-compete agreements and goodwill.
We consider our broadcast licenses to be indefinite-lived intangible assets and as a result, we test the impairment of our
broadcast licenses annually or whenever events or changes in circumstances indicate that such assets might be impaired. The
use of an indefinite life for our broadcast licenses is based on our ability to renew the licenses and that such renewals generally
may be obtained indefinitely and at little cost and that the technology used in broadcasting is not expected to be replaced in
the foreseeable future. Therefore, cash flows derived from the broadcast licenses are expected to continue indefinitely. We
proceed directly to the first step of the impairment test without attempting to qualitatively assess whether an impairment was
more likely than not. The impairment test consists of a comparison of the fair value of broadcast licenses with their carrying
amount on a station-by-station basis using a discounted cash-flow valuation method, assuming a hypothetical start-up scenario.
The future value of our broadcast licenses could be significantly impaired by the loss of the corresponding network affiliation
agreements. Accordingly, such an event could trigger an assessment of the carrying value of a broadcast license.
We test the impairment of goodwill annually or whenever events or changes in circumstances indicate that goodwill
might be impaired. We proceed directly to the first step of the impairment test without attempting to qualitatively assess
whether an impairment was more likely than not. Our reporting units are comprised of each of the markets in which our
television stations operate, LIN Digital, Nami Media, Dedicated Media, Inc. ("Dedicated Media") and HYFN, Inc. ("HYFN").
The first step of the goodwill impairment test compares the fair value of a reporting unit with its carrying amount, including
goodwill. The fair value of a reporting unit is determined through the use of a discounted cash flow analysis. The valuation
assumptions used in the discounted cash flow model reflect historical and projected performance of the reporting unit and
prevailing values in the markets for similar assets. If the fair value of the reporting unit exceeds its carrying amount, goodwill
is not considered impaired. If the carrying amount of the reporting unit exceeds its fair value, the second step of the goodwill
impairment test is performed to measure the amount of impairment loss, if any. The second step of the goodwill impairment
test compares the implied fair value of goodwill with the carrying amount of that goodwill. The implied fair value of goodwill
is determined by performing a hypothetical purchase price allocation, using the reporting unit's fair value (as determined in
step one) as the purchase price. If the carrying amount of goodwill exceeds the implied fair value, an impairment charge is
recognized in an amount equal to that excess, but not more than the carrying value of the goodwill. An impairment assessment
could be triggered by a significant reduction, or a forecast of such reductions, in operating results or cash flows at one or more
of our reporting units, a significant adverse change in the national or local advertising marketplaces in which our television
stations operate, or by adverse changes to FCC ownership rules, among other factors. We recorded an impairment charge
during 2011, which is more fully described in Note 6 -"Intangible Assets."
Long-lived assets
We periodically evaluate the net realizable value of long-lived assets, including tangible and intangible assets, relying
on a number of factors including operating results, business plans, economic projections and anticipated future cash flows.
When evaluating assets for potential impairment, we first compare the carrying amount of the asset group to the estimated
future cash flows associated with the asset group (undiscounted and without interest charges). If the estimated future cash
flows used in this analysis are less than the carrying amount of the asset group, an impairment loss calculation is prepared.
The impairment loss calculation compares the carrying amount of the asset group to the asset group's estimated future cash
flows (discounted and with interest charges). If required, an impairment loss is recorded for the portion of the asset group's
carrying value that exceeds the asset group's estimated future cash flows.
Program rights are recorded as assets when the license period begins and the programs are delivered to our stations for
broadcasting, at the gross amount of the related obligations. Costs incurred in connection with the purchase of programs to
be broadcast within one year are classified as other current assets, while costs of those programs to be broadcast subsequently
are considered non-current. Program costs are charged to operations over their estimated broadcast periods in a manner
consistent with actual usage.
If the estimated net realizable value of acquired programming rights is less than unamortized cost (i.e. due to poor
ratings), we would recognize an impairment charge to reduce the carrying value of the program rights to their net realizable
value.
F-68
LIN Television Corporation
Notes to Consolidated Financial Statements (Continued)
Program obligations are classified as current or non-current in accordance with the payment terms of the license
agreement.
As of December 31, 2013, we have several share-based employee compensation plans, which are described more fully
in Note 9—"Share-Based Compensation." We estimate the fair value of share option awards using a Black-Scholes valuation
model. The Black-Scholes valuation model requires us to make assumptions and judgments about the variables used in the
calculation, including the option's expected term, the expected volatility of the underlying shares and the number of share
option awards that are expected to be forfeited. The expected term represents the weighted-average period of time that options
granted are expected to be outstanding giving consideration to vesting schedules and our historical exercise patterns. Expected
volatility is based on historical trends for LIN LLC's class A common shares over the expected term. Expected forfeitures
are estimated using our historical experience. If future changes in estimates differ significantly from our current estimates,
our future share-based compensation expense and results of operations could be materially impacted.
The following table presents the share-based compensation expense included in our consolidated statements of operations
(in thousands):
Year Ended December 31,
2013
Direct operating ............................................................................................... $
Selling, general and administrative .................................................................
Corporate .........................................................................................................
Total share-based compensation...................................................................... $
320
1,460
7,594
9,374
2012
$
$
270
1,019
5,568
6,857
2011
$
$
256
1,266
4,654
6,176
Our accounting policy is to follow the tax law ordering approach regarding net operating losses and determining when
tax benefits are realized related to excess share option deductions and credited to paid-in capital.
Deferred income taxes are recognized based on temporary differences between the financial statement and the tax basis
of assets and liabilities using statutory tax rates in effect in the years in which the temporary differences are expected to reverse.
We consider future taxable income and feasible tax planning strategies in assessing the need for establishing or removing a
valuation allowance. We record or subsequently remove a valuation allowance to reflect our deferred tax assets to an amount
that is more likely than not to be realized. In the event that our determination changes regarding the realization of all or part
of our deferred tax assets in the future, an adjustment to the deferred tax asset is recorded to our consolidated statement of
operations in the period in which such a determination is made. Due to the change in tax structure as a result of the Merger,
we reversed an$18.2 million valuation allowance and recognized a corresponding tax benefit during 2013. For further
discussion regarding this reversal, see Note 14 - "Income Taxes."
When accounting for uncertainty in income taxes, we follow the prescribed recognition threshold and measurement
methodology for the financial statement recognition and measurement of a tax position taken or expected to be taken in a tax
return. For benefits to be recognized, a tax position must be more likely than not to be sustained upon examination by taxing
authorities. We recognize interest and penalties related to uncertain tax positions as a component of income tax expense.
Concentration of credit risk
Financial instruments that potentially subject us to concentrations of credit risk consist principally of cash and cash
equivalents and trade receivables. Concentration of credit risk with respect to cash and cash equivalents and investments are
limited as we maintain primary banking relationships with only large nationally recognized institutions. We evaluated the
viability of these institutions as of December 31, 2013 and we believe our risk is minimal. Credit risk with respect to trade
receivables is limited, as our trade receivables are primarily related to advertising revenues generated from a large diversified
group of local and nationally recognized advertisers and advertising agencies. We do not require collateral or other security
against trade receivable balances, however, we do maintain reserves for potential bad debt losses, which are based on historical
bad debt experience and an assessment of specific risks, and such reserves and bad debts have been within management's
expectations for all years presented.
F-69
LIN Television Corporation
Notes to Consolidated Financial Statements (Continued)
Certain financial instruments, including cash and cash equivalents, investments, accounts receivable and accounts
payable are carried in the consolidated financial statements at amounts that approximate fair value. For certain financial assets
and liabilities recorded at fair value on a recurring basis we maximize the use of observable inputs and minimize the use of
unobservable inputs when measuring fair value.
Derivatives are required to be recorded as assets or liabilities and measured at fair value. Gains or losses resulting from
changes in the fair values of derivatives are recognized immediately or deferred, depending on the use of the derivative and
whether or not it qualifies as a hedge. We have historically used derivative financial instruments in the management of our
interest rate exposure for our long-term debt. In accordance with our interest rate risk management policy, we do not enter
into derivative financial instruments unless there is an underlying exposure, and we do not enter into derivative financial
instruments for speculative trading purposes.
We have a defined benefit retirement plan covering certain of our employees. Our pension benefit obligations and related
costs are calculated using prescribed actuarial concepts. Additionally, we record the unfunded status of our plan on our
consolidated balance sheets. Effective April 1, 2009, this plan was frozen and we do not expect to make additional benefit
accruals to this plan, however, we continue to fund our existing vested obligations.
The following table presents the activity of the redeemable noncontrolling interest included in our consolidated balance
sheets related to Nami Media, HYFN and Dedicated Media, which represents third parties’ proportionate share of our
consolidated net assets (in thousands):
Redeemable
Noncontrolling
Interest
Acquisition of redeemable noncontrolling interest................................................................................................. $
Net loss ...................................................................................................................................................................
Share-based compensation......................................................................................................................................
Balance as of December 31, 2012 ..........................................................................................................................
Acquisition of redeemable noncontrolling interest.................................................................................................
Net loss ...................................................................................................................................................................
Share-based compensation......................................................................................................................................
Balance as of December 31, 2013 .......................................................................................................................... $
3,503
(556)
295
3,242
11,025
(1,512)
90
12,845
In July 2013 the Financial Accounting Standards Board ("FASB") issued Accounting Standards Update ("ASU") 2013-11,
“Presentation of an Unrecognized Tax Benefit When a Net Operating Loss Carryforward, a Similar Tax Loss, or a Tax Credit
Carryforward Exists” to eliminate diversity in practice. This ASU requires that companies net their unrecognized tax benefits
against all same-jurisdiction net operating losses or tax credit carryforwards that would be used to settle the position with a
tax authority. This new guidance is effective prospectively for annual reporting periods beginning on or after December 15,
2013 and interim periods therein. We prospectively adopted this guidance effective January 1, 2013 and it did not have a
material impact on our financial statements.
In February 2013, the Financial Accounting Standards Board issued Accounting Standards Update No. 2013-2,
“Reporting of Amounts Reclassified out of Accumulated Other Comprehensive Income,” which amends Accounting Standards
Codification 220, “Comprehensive Income.” The amendments require an entity to disclose the impact of amounts reclassified
out of accumulated other comprehensive income and into net income, by the respective line items of net income, if the amounts
reclassified are reclassified to net income in their entirety in the same reporting period. The disclosure is required either on
the face of the statement where net income is presented or in the notes. For amounts that are not reclassified in their entirety
F-70
LIN Television Corporation
Notes to Consolidated Financial Statements (Continued)
to net income, an entity is required to cross-reference to other disclosures required under U.S. GAAP that provide additional
detail about those amounts. We prospectively adopted this guidance effective January 1, 2013 and it did not have a material
impact on our financial statements.
In July 2012, there were revisions to the accounting standard for impairment tests of indefinite-lived intangible assets
other than goodwill. Under the revised standard a company can first perform a qualitative assessment to determine whether
further impairment testing of indefinite-lived intangible assets is necessary. A company can choose to perform the qualitative
assessment on none, some, or all of its indefinite-lived intangible assets, and can also bypass the qualitative assessment and
perform the quantitative impairment test for any indefinite-lived intangible in any period. The revised standard is effective
for annual and interim impairment tests performed for fiscal years beginning after September 15, 2012. We adopted this
guidance effective January 1, 2013 and do not expect it to have a material impact on our impairment tests of indefinite-lived
intangible assets.
Note 2—Acquisitions
On February 3, 2014, LIN Digital Media LLC, a wholly owned subsidiary of LIN Television, acquired 100% of the
capital stock of Federated Media Publishing, Inc. ("Federated Media"). Federated Media is a digital content and conversational
marketing company that leverages the relationships and content from its publishing network to deliver contextually relevant
advertising and conversational and engagement tools that reach agencies’ and brands’ targeted audiences across digital and
social media platforms. The purchase price totaled $22.4 million plus an adjustment for working capital delivered at closing
and was funded from cash on hand and amounts drawn on our revolving credit facility.
We are in the process of making preliminary estimates of the fair value of the assets acquired and liabilities assumed of
Federated Media, utilizing information available at the time of this report and these estimates are subject to refinement until
all pertinent information has been obtained. We expect to complete the process of finalizing the purchase accounting and final
estimates of fair value of assets and liabilities during the twelve months following the acquisition.
Dedicated Media, Inc.
On April 9, 2013, we acquired a 60% interest (calculated on a fully diluted basis) in Dedicated Media, a multi-channel
advertisement buying and optimization company. Dedicated Media employs new technologies to create, plan and execute
digital marketing campaigns on behalf of its clients. The purchase price totaled $5.8 million, which was funded from cash on
hand at the time of the acquisition.
Under the terms of our agreement with Dedicated Media, we agreed to purchase the remaining outstanding shares of
Dedicated Media by no later than February 15, 2015 if Dedicated Media achieves both (i) a target earnings before interest,
taxes, depreciation and amortization (“EBITDA”) and (ii) a target gross profit in 2014, as outlined in the purchase agreement.
The purchase price of these shares is based on multiples of Dedicated Media’s 2014 EBITDA and gross profit. Our maximum
potential obligation under the purchase agreement is $26 million. If Dedicated Media does not meet the target EBITDA or
target gross profit in 2014, we have the option to purchase the remaining outstanding shares using the same purchase price
multiple.
The following table summarizes the allocation of the purchase price to the estimated fair values of the assets acquired
and liabilities assumed by us in the acquisition (in thousands):
Current assets.......................................................................................................................................................... $
Equipment...............................................................................................................................................................
Definite-lived intangible assets...............................................................................................................................
Goodwill .................................................................................................................................................................
Current liabilities ....................................................................................................................................................
Noncontrolling interest ...........................................................................................................................................
Total........................................................................................................................................................................ $
7,315
99
4,620
1,854
(4,302)
(3,834)
5,752
The amount allocated to definite-lived intangible assets represents the estimated fair values of customer relationships
of $3.9 million, completed technology of $0.5 million, and trademarks of $0.2 million. These intangible assets will be amortized
F-71
LIN Television Corporation
Notes to Consolidated Financial Statements (Continued)
over the estimated remaining useful lives of approximately 8 years for customer relationships, 4 years for completed technology
and 2 years for trademarks.
On April 4, 2013, we acquired a 50.1% interest (calculated on a fully diluted basis) in HYFN, a full service digital
advertising agency specializing in the planning, development, deployment and support for websites, mobile sites, interactive
banners, games and various applications for multiple devices. The purchase price totaled $7.2 million, $6.9 million of which
was funded from cash on hand and $0.3 million was accrued at the time of the acquisition and was subsequently paid in
accordance with the provisions of the purchase agreement during the first quarter of 2014.
Under the terms of our agreement with HYFN, we agreed to purchase the remaining outstanding shares of HYFN by
no later than February 15, 2016 if HYFN achieves both (i) a target EBITDA and (ii) target net revenues in 2015, as outlined
in the transaction agreements. The purchase price of these shares is based on multiples of HYFN’s 2015 net revenue and
EBITDA. Our maximum potential obligation under the terms of our agreement is approximately $62.4 million. If HYFN does
not meet the target EBITDA or target net revenues in 2015, we have the option to purchase the remaining outstanding shares
using the same purchase price multiple.
The following table summarizes the allocation of the purchase price to the estimated fair values of the assets acquired
and liabilities assumed by us in the acquisition (in thousands):
Current assets.......................................................................................................................................................... $
Non-current assets ..................................................................................................................................................
Equipment...............................................................................................................................................................
Definite-lived intangible assets...............................................................................................................................
Goodwill .................................................................................................................................................................
Current liabilities ....................................................................................................................................................
Non-current liabilities.............................................................................................................................................
Noncontrolling interest ...........................................................................................................................................
Total........................................................................................................................................................................ $
3,759
13
179
3,580
9,160
(920)
(1,361)
(7,191)
7,219
The amount allocated to definite-lived intangible assets represents the estimated fair values of customer relationships
of $2.4 million, completed technology of $1.1 million, and trademarks of $0.1 million. These intangible assets will be amortized
over the estimated remaining useful lives of approximately 8 years for customer relationships, 3 years for completed technology
and 3 years for trademarks.
Goodwill of $1.9 million and $9.2 million is the excess of the aggregate purchase price over the fair value of the
identifiable net assets acquired, and primarily represents the benefits of the incremental revenue we expect to generate from
the acquisitions of Dedicated Media and HYFN, respectively. None of the goodwill recognized in connection with the
acquisitions of Dedicated Media and HYFN is deductible for tax purposes.
Our obligations to purchase the noncontrolling interest holders’ shares of both Dedicated Media and HYFN are outside
of our control, because they are based on the achievement of certain financial targets described above. Therefore, the
noncontrolling interest related to Dedicated Media and HYFN as of December 31, 2013 has been reported as redeemable
noncontrolling interest and classified as temporary equity on our consolidated balance sheets. As of the acquisition dates, the
fair values of the noncontrolling interests were $3.8 million and $7.2 million for Dedicated Media and HYFN, respectively,
and were measured based on the purchase prices for our 60% and 50.1% ownership interest in Dedicated Media and HYFN,
respectively, and the net assets acquired as of the acquisition dates. As of December 31, 2013, we believe that achievement
of the financial targets is not yet probable and therefore, have not reflected these obligations in our consolidated financial
statements.
If we do not purchase the remaining outstanding shares of Dedicated Media or HYFN by the dates set forth in the
respective purchase agreements, the noncontrolling interest holders have the right to purchase our interest. The purchase price
of these shares is based on the same purchase price multiple described above and is exercisable only if the applicable financial
targets are not met and we do not elect to purchase the remaining interest. The fair value of our elective purchase options, and
the fair value of the options held by the noncontrolling interest holders is zero and no amounts related to these options are
included in our consolidated financial statements as of December 31, 2013.
F-72
LIN Television Corporation
Notes to Consolidated Financial Statements (Continued)
Net revenues and operating loss of HYFN and Dedicated Media included in our consolidated statements of operations
for the year ended December 31, 2013 were $24.2 million and $(2.8) million, respectively.
New Vision Acquisition
On October 12, 2012, we completed our acquisition of television stations in eight markets that were previously owned
by affiliates of New Vision Television, LLC ("New Vision") for $334.9 million, subject to certain post-closing adjustments,
and including the assumption of $14.3 million of finance lease obligations. Concurrent with the acquisition, Vaughan, a thirdparty licensee, completed its acquisition of separately owned television stations (the "Vaughan Acquired Stations") in three
markets for $4.6 million from PBC Broadcasting, LLC ("PBC").
We also agreed to provide certain services to the Vaughan Acquired Stations pursuant to SSAs with Vaughan. Under
the SSAs with Vaughan, we provide sales, administrative and technical services, supporting the business and operation of the
Vaughan Acquired Stations in exchange for commissions and fees that provide us the benefit of certain returns from the
business of the Vaughan Acquired Stations.
The following table summarizes the allocation of the purchase price to the estimated fair values of the assets acquired
and liabilities assumed by both us and Vaughan in the acquisition (in thousands):
Program rights assets.............................................................................................................................................. $
Property and equipment .........................................................................................................................................
Broadcast licenses ..................................................................................................................................................
Definite-lived intangible assets ..............................................................................................................................
Goodwill.................................................................................................................................................................
Current liabilities....................................................................................................................................................
Non-current liabilities ............................................................................................................................................
Long-term debt assumed ........................................................................................................................................
Total........................................................................................................................................................................ $
2,040
100,124
133,120
55,837
65,024
(417)
(2,239)
(13,989)
339,500
The amount allocated to definite-lived intangible assets represents the estimated fair values of network affiliations of
$30.8 million, favorable leases of $8.6 million, advertiser relationships of $6.1 million, retransmission consent agreements
of $7 million, and other intangible assets of $3.3 million. These intangible assets will be amortized over the estimated remaining
useful lives of approximately 2 years for network affiliations, 32 years for favorable leases, 10 years for advertiser relationships,
5 years for retransmission consent agreements, and a weighted average life of 6 years for other intangible assets.
The results of operations for the year ended December 31, 2012 include the results of the New Vision stations since
October 12, 2012. Net revenues and operating income of the television stations acquired during 2012 included in our
consolidated statements of operations for the year ended December 31, 2012 were $40 million and $11.2 million, respectively.
The following table sets forth unaudited pro forma results of operations, assuming that the acquisition of the television
stations from New Vision, along with transactions necessary to finance the acquisition, occurred on January 1, 2011 (in
thousands):
2012
Net revenue .................................................................................................................................
Net (loss) income ........................................................................................................................
Basic (loss) income per common share attributable to LIN LLC ...............................................
Diluted (loss) income per common share attributable to LIN LLC ............................................
$
$
$
$
658,163
(11,720)
(0.22)
(0.22)
2011
$
$
$
$
514,340
23,950
0.43
0.42
This pro forma financial information is based on historical results of operations, adjusted for the allocation of the purchase
price and other acquisition accounting adjustments, and is not necessarily indicative of what our results would have been had
we operated the businesses since January 1, 2011. The pro forma adjustments reflect depreciation expense, amortization of
F-73
LIN Television Corporation
Notes to Consolidated Financial Statements (Continued)
intangibles and amortization of program contract costs related to the fair value adjustments of the assets acquired, additional
interest expense related to the financing of the transactions, exclusion of nonrecurring financing and transaction related costs
and the related tax effects of the adjustments.
In connection with the acquisition of television stations from New Vision, we and New Vision incurred a combined total
of $7.3 million of transaction related costs primarily related to legal and other professional services. These costs were not
included in the 2012 pro forma amounts. The 2011 pro forma net income was adjusted to include these costs, as they are
directly attributable to the acquisition.
ACME Television Acquisition
On December 10, 2012, we acquired certain assets of the ACME Television, LLC ("ACME") television stations KWBQTV, KRWB-TV and KASY-TV (collectively the "Acquired Stations"), each of which serves the Albuquerque-Santa Fe, NM
market. KASY-TV Licensee, LLC ("KASY"), an unrelated third party, acquired the remaining assets of the Acquired Stations,
including the FCC license. The aggregate purchase price for the Acquired Stations was $19 million, of which we paid
approximately $17.3 million and KASY paid approximately $1.7 million.
We also agreed to provide certain services to the Acquired Stations pursuant to shared services arrangements with KASY.
Under the shared services arrangements with KASY, we provide sales, administrative and technical services, supporting the
business and operation of the Acquired Stations in exchange for commissions and fees that provide us the benefit of certain
returns from the business of the Acquired Stations.
The following table summarizes the allocation of the purchase price to the estimated fair values of the assets acquired
and liabilities assumed by both us and KASY in the acquisitions (in thousands):
Current assets.......................................................................................................................................................... $
Non-current assets ..................................................................................................................................................
Other intangible assets............................................................................................................................................
Goodwill .................................................................................................................................................................
Non-current liabilities.............................................................................................................................................
Total........................................................................................................................................................................ $
1,656
1,968
12,898
5,331
(2,858)
18,995
Goodwill of $65 million and $5.3 million is the excess of the aggregate purchase price over the fair value of the identifiable
net assets acquired, and primarily represents the benefits of synergies and economies of scale we expect to realize from the
acquisitions of the television stations from New Vision and ACME, respectively. All of the goodwill recognized in connection
with the acquisitions of New Vision and ACME is deductible for tax purposes.
During the year ended December 31, 2013, certain measurement period adjustments were made to the initial allocation
performed in the fourth quarter of 2012 for the New Vision and ACME acquisitions, which were not material to the consolidated
financial statements.
On November 22, 2011, we acquired a 57.6% interest (a 50.1% interest calculated on a fully diluted basis) in Nami
Media Inc. ("Nami Media"), a digital advertising management and technology company. During 2013, Nami Media did not
achieve the minimum threshold of earnings before interest, taxes, depreciation and amortization ("EBITDA") required to
obligate us to acquire the remaining outstanding shares. As of the date of this report, we have not exercised our option to
acquire the remaining outstanding shares.
Note 3—Discontinued Operations
On February 16, 2012, we completed the sale of substantially all of the assets of WWHO-TV, our CW affiliate serving
Columbus, OH. During the year ended December 31, 2012, we recorded a loss on the sale of WWHO-TV of $0.4 million
($0.3 million, net of tax).
F-74
LIN Television Corporation
Notes to Consolidated Financial Statements (Continued)
On April 21, 2012, we completed the sale of substantially all of the assets of WUPW-TV to WUPW, LLC. During the
year ended December 31, 2012, we recorded a gain on the sale of WUPW-TV of $18 million ($11.7 million, net of tax).
The following presents summarized information for the discontinued operations as follows (in thousands):
2012
WWHOTV
Net revenues ................................ $
Operating (loss) income ..............
Net (loss) income.........................
WUPWTV
2011
Total
WWHOTV
WUPWTV
Total
440 $ 2,193 $ 2,633 $ 4,236 $ 7,585
(1,559)
(699)
(393)
(1,166)
1,079
(1,018)
(1,427)
(252)
(766)
507
$ 11,821
380
(920)
Note 4—Investments
Joint Venture with NBCUniversal
As of December 31, 2012, we held a 20.38% interest in SVH, a joint venture with NBCUniversal, and accounted for
our interest using the equity method, as we did not have a controlling interest. SVH held a 99.75% interest in SVO, which is
the operating company that managed KXAS-TV and KNSD-TV, the television stations that comprised the joint venture.
As further described in Note 1 - "Basis of Presentation and Summary of Significant Accounting Policies" and Note 13
—"Commitments and Contingencies," on February 12, 2013, LIN TV, LIN Television, and LIN Texas entered into and
simultaneously closed the transactions contemplated by the Transaction Agreement among subsidiaries of NBCUniversal,
Comcast, the GE Parties, and SVH.
Pursuant to the JV Sale Transaction, in exchange for LIN Television causing a $100 million capital contribution to be
made to SVH (which was used to prepay a portion of the GECC Note), LIN TV was released from the GECC Guarantee and
any further obligations related to any shortfall funding agreements. Further, LIN Texas sold its 20.38% equity interest in SVH
to affiliates of NBCUniversal , and the LIN parties transferred their rights to receivables related to the Shortfall Funding Loans
for $1.00. As a result of the JV Sale Transaction, neither we nor any of our direct or indirect subsidiaries have any further
investment in or obligations (funding or otherwise) related to SVH, including, without limitation, to make any other unsecured
shortfall loans or payments under the GECC Note or the GECC Guarantee.
The following table presents summarized financial information of SVH and SVO for the period from January 1, 2013
through February 12, 2013 and the years ending December 31, 2012 and 2011 (in thousands):
January1 February 12,
2013
Year Ended December 31,
2012
2011
SVO:
Net revenues.................................................................................................... $
Operating expenses .........................................................................................
Net income before taxes..................................................................................
Net income after taxes.....................................................................................
SVH:
11,951 $
(9,148)
Equity in income from limited partnership in SVO ........................................ $
Interest and other expense...............................................................................
Net loss............................................................................................................
2,786 $
(8,039)
Cash distributions to SVH from SVO.............................................................
Shortfall loans from LIN Television to SVH..................................................
Shortfall loans from General Electric Company ("GE") to SVH ...................
F-75
2,805
2,793
143,474 $
(79,124)
64,653
64,515
64,354 $
(69,365)
118,833
(71,350)
47,791
47,743
47,624
(68,003)
(5,253)
(5,011)
(20,379)
6,905
—
—
55,025
2,292
8,954
53,846
2,483
9,701
LIN Television Corporation
Notes to Consolidated Financial Statements (Continued)
February 12,
December 31,
2013 (2)
2012
SVH:
Cash and cash equivalents .......................................................................................................... $
Non-current assets ......................................................................................................................
Current liabilities ........................................................................................................................
Non-current liabilities(1) ..........................................................................................................................................
Shortfall loans outstanding and accrued interest payable to LIN Television from SVH............
Shortfall loans outstanding and accrued interest payable to NBCUniversal and General
Electric from SVH ......................................................................................................................
6,905
205,433
8,155
865,354
10,159
$
39,695
—
209,552
544
864,927
10,080
39,382
_______________________________________________________________________________
(1)
(2)
See Note 13—"Commitments and Contingencies" for further description of the GECC Note. Non-current liabilities includes shortfall
loans outstanding and accrued interest payable to the joint venture partners.
Represents balances prior to the effect of the JV Sale Transaction.
In 2008, we recorded an impairment charge that reduced the carrying value of our investment in SVH to $0. Subsequent
to the reduction of the SVH carrying value to $0, and as a result of our guarantee of the GECC Note as further described in
Note 13—"Commitments and Contingencies", we suspended recognition of equity method losses in our consolidated financial
statements.
During the years ended December 31, 2012 and 2011, based on our estimate of our probable shortfall obligations to the
joint venture, we recognized contingent liabilities of $4.2 million and $4.7 million, respectively, for the amounts that we
expected to loan to SVH pursuant to the shortfall funding agreements with the GE Parties and NBCUniversal, as further
described in Note 13—"Commitments and Contingencies." Because of uncertainty surrounding the joint venture's ability to
repay shortfall loans, we concluded that it was more likely than not that the amounts recognized for accrued shortfall loans
would not be recovered within a reasonable period of time, and concurrently recognized charges of $4.2 million and $4.7
million in 2012 and 2011, respectively, to reflect the impairment of the shortfall loans, which were classified within Share of
loss in equity investments in our consolidated statement of operations. As a result of the JV Sale Transaction, as of February 12,
2013, we had no further shortfall funding obligations. Therefore, as of December 31, 2012, the remaining accrued shortfall
funding liability of $6 million was also reversed and reflected in the Share of loss in equity investments line of our consolidated
statement of operations.
Note 5—Property and Equipment
Property and equipment consisted of the following (in thousands):
December 31,
Land and land improvements ...................................................................................................... $
Buildings and fixtures .................................................................................................................
Broadcast equipment and other...................................................................................................
Total property and equipment .....................................................................................................
Less accumulated depreciation ...................................................................................................
Property and equipment, net ....................................................................................................... $
2013
2012
21,152 $
179,209
319,912
520,273
(299,195)
221,078 $
21,147
176,940
311,907
509,994
(268,503)
241,491
We recorded depreciation expense of $46.9 million, $32.1 million and $26.2 million for the years ended December 31,
2013, 2012 and 2011, respectively.
F-76
LIN Television Corporation
Notes to Consolidated Financial Statements (Continued)
Note 6—Intangible Assets
The following table summarizes the carrying amount of each major class of intangible assets (in thousands):
December 31,
Weighted-Average
Remaining Useful
Life (in years)
Finite-Lived Intangible Assets:
Network affiliations....................................................................................
Customer relationships...............................................................................
Non-compete agreements ...........................................................................
Completed technology................................................................................
Favorable leases .........................................................................................
Retransmission consent agreements...........................................................
Other intangible assets ...............................................................................
Accumulated amortization .........................................................................
Net finite-lived intangible assets ................................................................
Indefinite-Lived Intangible Assets:
Broadcast licenses ......................................................................................
Summary:
Goodwill.....................................................................................................
Broadcast licenses and finite-lived intangible assets, net ..........................
Total intangible assets ................................................................................
1
9
1
3
31
4
19
2013
$
2012
$
32,996 $
14,941
1,588
10,191
8,573
7,860
9,817
(38,917)
47,049 $
32,996
8,631
1,588
6,370
8,573
7,859
9,609
(16,072)
59,554
$
536,515
$
536,515
$
203,528
583,564
787,092
$
192,514
596,069
788,583
$
$
We recorded amortization expense of $22.8 million , $6.4 million and $1.2 million for the years ended December 31,
2013, 2012 and 2011, respectively.
The following table summarizes the projected aggregate amortization expense for the next five years and thereafter (in
thousands):
Projected Aggregate
Amortization Expense
For the years ended December 31,
2014 .................................................................................................................................................................................. $
2015 ..................................................................................................................................................................................
2016 ..................................................................................................................................................................................
2017 ..................................................................................................................................................................................
2018 ..................................................................................................................................................................................
Thereafter.......................................................................................................................................................
Total ............................................................................................................................................................... $
15,971
5,783
4,980
3,266
2,042
15,007
47,049
There were no events during 2013, 2012 and 2011 to warrant the performance of an interim impairment test of our
indefinite-lived intangible assets. We recorded a $1.6 million impairment charge related to discontinued operations for the
year ended December 31, 2011.
F-77
LIN Television Corporation
Notes to Consolidated Financial Statements (Continued)
The changes in the carrying amount of goodwill for the years ended December 31, 2013 and 2012, respectively, are as
follows (in thousands):
Year Ended December 31,
2013
Balance as of January 1, 2013 and 2012, respectively................................................................ $
Acquisitions ................................................................................................................................
Balance as of December 31, 2013 and 2012, respectively.......................................................... $
2012
192,514
11,014
203,528
$
$
122,069
70,445
192,514
Note 7—Debt
Debt consisted of the following (in thousands):
December 31,
2013
Senior Secured Credit Facility:
Revolving credit loans.............................................................................................................. $
$118,750 and $125,000 Term loans, net of discount of $345 and $435 as of December 31,
2013 and December 31, 2012, respectively .............................................................................
$314,200 and $257,400 Incremental term loans, net of discount of $1,684 and $2,020 as of
December 31, 2013 and December 31, 2012, respectively ......................................................
83/8% Senior Notes due 2018 ......................................................................................................
63/8% Senior Notes due 2021 ......................................................................................................
Capital lease obligations .............................................................................................................
Other debt ...................................................................................................................................
Total debt ....................................................................................................................................
Less current portion ....................................................................................................................
Total long-term debt ................................................................................................................... $
5,000
2012
$
—
118,405
124,565
312,516
200,000
290,000
14,604
6,167
946,692
17,364
929,328
255,380
200,000
290,000
14,881
5,401
890,227
10,756
879,471
$
Senior Secured Credit Facility
Our senior secured credit facility is comprised of a six-year, $125 million tranche A term loan and a five-year, $75
million revolving credit facility, and bears interest at a rate based on, at our option, either a) the LIBOR interest rate, or b) the
ABR rate, which is an interest rate that is equal to the greatest of (i) the Prime Rate, (ii) the Federal Funds Effective Rate plus
1/2 of 1 percent, and (iii) the one-month LIBOR rate plus 1%. In addition, the rate we select also bears an applicable margin
based upon our Consolidated Senior Secured Leverage Ratio, currently set at 2.75% and 1.75% for LIBOR based loans and
ABR rate loans, respectively. Following the issuance of this report during the first quarter of 2014, these rates will be 3% and
2% for LIBOR based loans and ABR rate loans, respectively. Lastly, the unused portion of the revolving credit facility is
subject to a commitment fee based upon our Consolidated Senior Secured Leverage Ratio, currently set at 0.375% for both
LIBOR based loans and ABR rate loans and will increase to 0.5% following the issuance of this report during the first quarter
of 2014 for both LIBOR based loans and ABR rate loans.
Our senior secured credit facility also includes a seven-year, $260 million tranche B incremental term loan facility and
a $60 million tranche B-2 incremental term facility that was funded on February 12, 2013 in connection with the JV Sale
Transaction, each of which is subject to the terms of our Credit Agreement. Borrowings under the incremental term loan
facility were used (i) to pay the call price for our redemption of all of our remaining 61/2% Senior Subordinated Notes, as
described below, and (ii) to pay accrued interest, fees and expenses associated with the redemption. Borrowings under the
incremental term loan facility bear interest at a rate based, at our option, on an adjusted LIBOR rate, plus an applicable margin
Base Rate shall at no time be less than 1% and 2%, respectively.
F-78
LIN Television Corporation
Notes to Consolidated Financial Statements (Continued)
On December 24, 2012, we entered into an amendment to our Credit Agreement (the "Credit Agreement"), dated as of
October 26, 2011, as amended on December 19, 2011, by and among LIN Television, JPMorgan Chase Bank, N.A., as
Administrative Agent, and the banks and other financial institutions party thereto, which (1) replaced our $257.4 million
tranche B term loan maturing in December 2018 with a new tranche B term loan of the same maturity which bears interest at
a reduced rate and (2) made certain other changes to the Credit Agreement, including changes to the financial covenants therein
that are favorable to LIN Television and its affiliates and (3) extended the maturity for a $60 million tranche of our revolving
credit facility to October 2017 and on May 9, 2013, we extended the maturity date of the remaining $15 million tranche of
our revolving credit facility to October 2017. We paid customary fees and expenses in connection with the closing of these
amendments of $1.7 million. As a result of these amendments, we recorded a loss on extinguishment of debt of $1.2 million
associated with a write-down of deferred financing fees and unamortized discount to our consolidated statement of operations
during the year ended December 31, 2012.
The terms of the Credit Agreement provide for customary representations and warranties, affirmative and negative
covenants (including financial covenants), and events of default. The Credit Agreement also provides for the payment of
customary fees and expenses by us. The senior secured credit facility can be accelerated upon events of default and require
the term loans to be prepaid under certain circumstances with amounts determined by reference to the proceeds from certain
asset sales (subject to reinvestment rights), the incurrence of certain indebtedness and a percentage of annual excess cash flow.
The senior secured credit facility ranks senior in right of payment to our existing and future subordinated indebtedness.
LIN LLC and certain of our existing, or hereafter created or acquired, domestic subsidiaries guarantee the credit facilities on
a senior basis. We and each of our subsidiary guarantors have granted a security interest in all or substantially all of our assets
to secure the obligations under senior secured credit facility, and LIN LLC has granted a security interest in its capital stock
of LIN Television to secure such obligations.
Our senior secured credit facility permits us to prepay loans and to permanently reduce the revolving credit commitments,
in whole or in part, at any time. We are also obligated to make mandatory quarterly principal payments. In addition, our senior
secured credit facility restricts the use of proceeds from asset sales not reinvested in our business and the use of proceeds from
the issuance of debt (subject to certain exceptions), which must be used for mandatory prepayments of principal of the term
loans.
The Credit Agreement governing our senior secured credit facility also requires on an annual basis, following the delivery
of our year-end financial statements, and commencing after the year ended December 31, 2012, mandatory prepayments of
principal of the term loans based on a computation of excess cash flow for the preceding fiscal year, as more fully described
in the Credit Agreement. However, based on the excess cash flow computation for the year ended December 31, 2013, we
will not be required to make such prepayments during the year ending December 31, 2014.
The incremental term loan facility is a senior secured obligation and ranks senior in right of payment to our existing
and future subordinated indebtedness. The incremental term loan facility is guaranteed and secured on the same basis as the
other credit facilities under the Credit Agreement. If we do not refinance, redeem or discharge our 83/8% Senior Notes on or
prior to January 15, 2018, then, in such event, the maturity of the incremental term loan facility will be accelerated from
December 21, 2018 to January 15, 2018.
The following table summarizes certain key terms including the LIBOR-based borrowing rates of our senior secured
credit facility as of December 31, 2013 (in thousands):
Credit Facility
Revolving
Facility
Final maturity date...........................................................................................
10/26/2017
Available balance as of December 31, 2013.................................................... $
70,000
Interest rate ......................................................................................................
Applicable margin ...........................................................................................
Total.................................................................................................................
F-79
0.17%
2.75%
2.92%
Term Loans
Incremental
Term Loans
10/26/2017
$
—
12/21/2018
$
—
0.17%
2.75%
2.92%
1.00%
3.00%
4.00%
LIN Television Corporation
Notes to Consolidated Financial Statements (Continued)
During the year ended December 31, 2011, we recorded a loss on extinguishment of debt of $0.2 million consisting of
a write-down of deferred financing fees related to the revolving credit facility and term loans under our 2009 senior secured
credit facility.
83/8% Senior Notes
83/8% Senior Notes
Final maturity date ...........................................................................................................................................
Annual interest rate ..........................................................................................................................................
Payable semi-annually in arrears .....................................................................................................................
4/15/2018
8.375%
April 15th
October 15th
Our 83/8% Senior Notes are unsecured but rank equally in right of payment with all senior secured indebtedness and
senior to all subordinated indebtedness.
The indenture governing our 83/8% Senior Notes contains covenants limiting our ability and the ability of our restricted
ricted
r
into certain transactions with affiliates. These covenants are subject to certain exceptions and qualifications. The indenture
also has change of control provisions which may require our Company to purchase our 83/8% Senior Notes at a price equal to
101% of the principal amount thereof, together with accrued and unpaid interest. Additionally, if we sell assets under certain
circumstances, we will be required to make an offer to purchase our 83/8% Senior Notes at their face amount, plus accrued
and unpaid interest, if any, through the purchase date.
63/8% Senior Notes
63/8% Senior Notes
Final maturity date ...........................................................................................................................................
Annual interest rate ..........................................................................................................................................
Payable semi-annually in arrears .....................................................................................................................
1/15/2021
6.375%
January 15th
July 15th
On October 12, 2012, we completed the issuance and sale of $290 million in aggregate principal amount of our 63/8%
Senior Notes. The net proceeds of our 63/8% Senior Notes were used to fund the remaining purchase price for the Acquisition
as further described in Note 2—"Acquisitions."
Our 63/8% Senior Notes are unsecured but rank equally in right of payment with all senior secured indebtedness and
senior to all subordinated indebtedness.
The indenture governing our 63/8% Senior Notes contains covenants limiting our ability and the ability of our restricted
ricted
r
into certain transactions with affiliates. These covenants are subject to certain exceptions and qualifications. The indenture
also has change of control provisions which may require our Company to purchase our 63/8% Senior Notes at a price equal to
101% of the principal amount thereof, together with accrued and unpaid interest. Additionally, if we sell assets under certain
circumstances, we will be required to make an offer to purchase our 63/8% Senior Notes at their face amount, plus accrued
and unpaid interest, if any, through the purchase date.
F-80
LIN Television Corporation
Notes to Consolidated Financial Statements (Continued)
6/
/
During the years ended December 31, 2012 and 2011, we redeemed $252 million and $165 million, respectively, of our
61/2% Senior Subordinated Notes. The redemption of these notes, at par, was funded in part by proceeds from the term loan,
incremental term loan, the revolving credit facility and cash on hand. As a result of these redemptions, during the years ended
December 31, 2012 and 2011, we recorded a loss on extinguishment of debt of $2.1 million and $1.5 million, respectively,
associated with a write-down of deferred financing fees and unamortized discount to our consolidated statement of operations.
As part of the transactions further described in Note 2—"Acquisitions," we assumed $15.1 million in capital lease
obligations related to buildings and equipment. These leases mature over a period of 4 to 19 years and are payable in monthly
installments. The total outstanding balance of these capital lease obligations was $14.6 million as of December 31, 2013.
LIN Television fully and unconditionally guarantees these lease obligations.
During the year ended December 31, 2012, Vaughan, a consolidated VIE, entered into a term loan with an unrelated
third party in an original principal amount of $4.6 million to fund a portion of the purchase price for the acquisition of certain
assets of PBC. This term loan matures in equal quarterly installments through October 2017. We fully and unconditionally
guarantee this loan.
During the year ended December 31, 2012, KASY, a consolidated VIE, entered into a term loan with an unrelated third
party in an original principal amount of $1.7 million to fund a portion of the purchase price for the acquisition of certain assets
of ACME. This term loan matures in equal quarterly installments through December 2017. We fully and unconditionally
guarantee this loan.
During the year ended December 31, 2011, WBDT, a consolidated VIE, entered into a term loan with an unrelated third
party in an original principal amount of $0.9 million to fund a portion of the purchase price for the acquisition of certain assets
of WBDT-TV. This term loan matures in equal quarterly installments through May 2016. We fully and unconditionally guarantee
this loan.
The following table summarizes scheduled future principal repayments on our debt agreements and capital leases (in
thousands):
Revolving
Facilities
Final maturity
date ..................... 10/26/2017
2014.................... $
—
2015....................
—
2016....................
—
2017....................
5,000
2018....................
—
2019 and
thereafter.............
—
Total.................... $
5,000
(1)
Term Loans
Incremental
Term Loans
83/8%
Senior Notes
63/8%
Senior Notes
10/26/2017
$ 12,500
18,750
25,000
62,500
—
12/21/2018
$
3,200
3,200
3,200
3,200
301,400
4/15/2018
$
—
—
—
—
200,000
1/15/2021
$
—
—
—
—
—
Various Various
$ 502 $ 1,162 $ 17,364
528
1,162
23,640
620
1,024
29,844
577
819
72,096
609
2,000
504,009
—
$ 118,750
—
$ 314,200
—
$ 200,000
290,000
$ 290,000
11,768
$ 14,604
Capital
Leases
Other
Debt
—
$ 6,167
Total
301,768
$ 948,721
_______________________________________________________________________________
(1)
An additional $25 million was outstanding on our revolving credit facility as of the date of this report and is not reflected in our balance
sheet as of December 31, 2013.
F-81
LIN Television Corporation
Notes to Consolidated Financial Statements (Continued)
The fair values of our long-term debt are estimated based on quoted market prices for the same or similar issues (Level 2
inputs of the three-level fair value hierarchy). The carrying amounts and fair values of our long-term debt were as follows (in
thousands):
December 31, 2013
Carrying
Amount
Revolving credit loans ......................................................... $
Term loans............................................................................
Senior notes..........................................................................
Other debt.............................................................................
Total ..................................................................................... $
5,000
430,921
490,000
6,167
932,088
December 31, 2012
Estimated
Carrying
Fair Value
Amount
(in thousands)
$
$
5,000
432,105
512,983
6,167
956,255
$
$
—
379,945
490,000
5,401
875,346
Estimated
Fair Value
$
$
—
380,599
524,500
5,401
910,500
Note 8—Derivative Financial Instruments
We have historically used derivative financial instruments in the management of our interest rate exposure for our longterm debt. In accordance with our interest rate risk management policy, we do not enter into derivative instruments unless
there is an underlying exposure, and we do not enter into derivative financial instruments for speculative trading purposes.
During the second quarter of 2006, we entered into a contract to hedge a notional amount of the declining balances of
our term loans under our prior senior secured credit facility (the "2006 interest rate hedge") to mitigate changes in our cash
flows resulting from fluctuations in interest rates. The 2006 interest rate hedge was historically designated as a cash flow
hedge, however, as a result of a repayment of $45.9 million of principal on our term loans under our 2009 senior secured
credit facility during 2010, the 2006 interest rate hedge ceased to be highly effective in hedging the variable rate cash flows.
As a result, all changes in fair value were recorded in our consolidated statement of operations, including a gain of approximately
$2 million for the year ended December 31, 2011.
The 2006 interest rate hedge expired on November 4, 2011. Accordingly, there are no amounts related to the 2006 interest
rate hedge included in our consolidated balance sheets as of December 31, 2013 and 2012.
As of December 31, 2013, we have no derivative contracts outstanding.
Note 9—Share-Based Compensation
We have several share-based compensation plans, including the 1998 Option Plan, the Amended and Restated 2002
Stock Plan and the Amended and Restated 2002 Non-Employee Director Stock Plan (collectively, the "Stock Plans"), that
permit us to grant non-qualified options in LIN LLC's class A common shares or restricted share awards, to certain directors,
officers and key employees of our Company.
Options granted under the Stock Plans vest over a four-year service period, unless otherwise designated by the
Compensation Committee upon grant. Options expire ten years from the date of grant. We issue new shares of LIN LLC's
class A common shares when options are exercised or from shares that we repurchased pursuant to our Board authorized share
repurchase program as further described in Note 11—"Shareholders' Equity." Restricted share awards vest over a service
period designated by the Compensation Committee upon grant. There were 6,787,940 shares authorized for grant under the
various Stock Plans and 2,375,605 shares available for future grant as of December 31, 2013. Both the shares authorized and
shares available exclude 1,552,983 shares under plans in effect prior to 2002 from which we do not intend to re-grant and
consider unavailable for future grants.
The following table presents the share-based compensation expense included in our consolidated statements of
operations as follows (in thousands):
F-82
LIN Television Corporation
Notes to Consolidated Financial Statements (Continued)
Year Ended December 31,
2013
Employee share options .................................................................................. $
Restricted share awards...................................................................................
Modifications to share option agreements ......................................................
Total share-based compensation ..................................................................... $
2012
2,933
6,348
93
9,374
$
$
1,868
4,896
93
6,857
2011
$
1,492
4,320
364
6,176
$
We did not capitalize any share-based compensation expense for the years ended December 31, 2013, 2012 and 2011.
We have not yet recognized compensation expense relating to unvested employee share options and restricted share
awards of $2.6 million and $14 million, respectively, which will be recognized over a weighted-average future period of
approximately 1.3 years and 1.7 years, respectively.
During the year ended December 31, 2013, we received $1.4 million from the exercise of share options and $0.4 million
from the purchase of LIN TV's class A common stock pursuant to the employee stock purchase plan ("ESPP"), which terminated
upon consummation of the Merger.
Share Options
The following table provides additional information regarding our share options for the year ended December 31, 2013
as follows (in thousands, except per share data):
WeightedAverage
Exercise Price
Per Share
Shares
Outstanding at the beginning of the year....................................................................................
Granted during the year ..............................................................................................................
Exercised or converted during the year ......................................................................................
Forfeited during the year ............................................................................................................
Expired during the year ..............................................................................................................
Outstanding at the end of the year ..............................................................................................
Exercisable or convertible at the end of the year........................................................................
4,894 $
110
(420)
(163)
(9)
4,412
3,304
3.42
12.29
3.23
5.43
3.57
3.58
2.79
As of December 31, 2013, the weighted-average remaining contractual life of the options outstanding and the options
exercisable was 6.1 years and 5.3 years, respectively. Additionally, as of December 31, 2013, the aggregate intrinsic value of
the options outstanding and the options exercisable was $110.7 million and $85.5 million, respectively. The intrinsic value in
the table above represents the total pre-tax intrinsic value based on our closing price as of December 31, 2013, which would
have been received by the option holders had all option holders exercised their options and immediately sold their shares on
that date.
The fair value of each share option grant or modification is estimated on the date of grant or modification using a BlackScholes valuation model, which incorporates the following assumptions:
Year Ended December 31,
2013
Expected term(1) ....................................................................................................................... 5 to 6 years
Expected volatility(2)............................................................................................................... 95% to 96%
Expected dividends..........................................................................................
$—
Risk-free rate(3) ......................................................................................................................... 0.8% to 1.2%
_______________________________________________________________________________
(1)
The expected term was estimated using our historical experience.
F-83
2012
2011
5 to 6 years
98% to 99%
$—
0.6% to 1.1%
5 to 6 years
97% to 99%
$—
0.9% to 2.6%
LIN Television Corporation
Notes to Consolidated Financial Statements (Continued)
(2)
Expected volatility is based on historical trends for LIN LLC class A common shares over the expected term.
(3)
The risk-free interest rate for each grant is equal to the U.S. Treasury yield curve in effect at the time of grant for instruments with a
similar expected life.
During the years ended December 31, 2013, 2012 and 2011, we recognized share-based compensation expense for a
modification to our share option agreements of $0.1 million, $0.1 million and $0.4 million, respectively, as a result of an
exchange offer we completed in 2009.
Restricted Share Awards
The following table provides additional information regarding the restricted share awards for the year ended
December 31, 2013 (in thousands, except per share data):
WeightedAverage Price
Per Share
Shares
Unvested at the beginning of the year.........................................................................................
Granted during the year...............................................................................................................
Vested during the year.................................................................................................................
Forfeited during the year.............................................................................................................
Unvested at the end of the year ...................................................................................................
2,294 $
582
(960)
(205)
1,711
5.98
18.89
6.00
5.87
10.37
The following table provides further information for both our restricted share awards and share option awards (in
thousands):
Year Ended December 31,
2013
Total fair value of options and awards granted................................................ $
Total intrinsic value of options exercised........................................................
Total fair value of awards vested.....................................................................
12,349
5,136
18,050
2012
$
10,347
865
7,718
2011
$
4,983
225
7,522
As a result of the Merger, the ESPP was terminated, effective July 30, 2013. Prior to this, under the terms of our ESPP,
our eligible employees could elect to have up to 10% of eligible compensation deducted from their pay to purchase shares of
LIN TV's class A common stock. The purchase price of each share was 85% of the average of the high and low per share
trading price of LIN TV's class A common stock on the NYSE on the last trading day of each month during the offering period.
During the year ended December 31, 2013, 2012 and 2011, employees purchased 42,734, 173,244 and 187,350 shares,
respectively, at a weighted-average price of $10.05, $3.55 and $3.38, respectively.
Note 10—Retirement Plans
We provide a defined contribution plan ("401(k) Plan") for eligible employees. Effective January 1, 2010, we began
making a 3% non-elective contribution for all eligible employees, which vests 100% after two years of service. We contributed
$4.8 million, $3.9 million and $3.6 million to the 401(k) Plan in the years ended December 31, 2013, 2012 and 2011,
respectively.
Effective July 1, 2010, we also made available to certain employees, including our executive officers, the LIN Television
Corporation Supplemental Income Deferral Plan ("SIDP"). This plan provides benefits to highly compensated employees in
circumstances in which the maximum limits established under the Employee Retirement Income Security Act of 1974
F-84
LIN Television Corporation
Notes to Consolidated Financial Statements (Continued)
("ERISA") and the Internal Revenue Code prevent them from receiving Company contributions. We contributed $0.5 million,
$0.5 million and $0.2 million to this plan during the years ended December 31, 2013, 2012 and 2011, respectively.
The SIDP also allows eligible executive officers to defer 5% - 80% of their base salaries and 5% - 100% of their annual
non-equity incentive awards on a tax-deferred basis and receive tax-deferred market-based growth. During 2013, the Company
made contributions to the SIDP for each of the named executive officers in amounts equal to 5% of their base salary and nonequity incentive plan compensation.
We have historically provided defined benefit retirement plans to our employees who did not receive matching
contributions from our Company to their 401(k) Plan accounts. Our defined benefit plans were non-contributory plans under
which we made contributions either to: a) traditional plan participants based on periodic actuarial valuations, which are
expensed over the expected average remaining service lives of current employees through the LIN Television Corporation
compensation through the Supplemental Benefit Retirement Plan of LIN Television Corporation ("SERP").
Effective April 1, 2009, these plans were frozen and we do not expect to make additional benefit accruals to these plans,
however we continue to fund our existing vested obligations. We contributed $5.4 million, $7.4 million and $5.4 million to
our pension plans during the years ended December 31, 2013, 2012 and 2011, respectively. We anticipate contributing $5.7
million to the plans in 2014.
We record the unfunded status of our defined benefit plans as a liability. For the years ended December 31, 2013 and
December 31, 2012, each plan was underfunded. The plan assets and benefit obligations of our defined benefit plans are
recorded at fair value. Information regarding the change in the projected benefit obligation, the accumulated benefit obligation
and the change in the fair value of plan assets for our traditional defined benefit plan and our cash balance plan are as follows
(in thousands):
Year Ended
December 31,
2013
2012
Change in projected benefit obligation
Projected benefit obligation, beginning of period....................................................................... $
Service cost...............................................................................................................................
Interest cost...............................................................................................................................
Actuarial (gain) loss..................................................................................................................
Benefits paid .............................................................................................................................
Curtailment ...............................................................................................................................
Projected benefit obligation, end of period ................................................................................. $
Accumulated benefit obligation .................................................................................................. $
Change in plan assets
Fair value of plan assets, beginning of period ............................................................................
Actual return on plan assets ........................................................................................................
Employer contributions...............................................................................................................
Benefits paid ...............................................................................................................................
Fair value of plan assets, end of period.......................................................................................
Unfunded status of the plan ........................................................................................................
Total amount recognized as accrued benefit liability..................................................................
134,969 $
—
5,259
(10,282)
(4,943)
133,047
—
5,379
1,485
(4,942)
—
125,003
125,003
—
134,969
134,969
$
$
$
96,412 $
10,611
5,359
(4,943)
82,314
11,621
7,419
(4,942)
$
$
$
107,439 $
(17,564) $
(17,564) $
96,412
(38,557)
(38,557)
The following table includes the pension related accounts recognized on our consolidated balance sheets and the
components of accumulated other comprehensive loss related to the net periodic pension benefit costs (in thousands):
F-85
LIN Television Corporation
Notes to Consolidated Financial Statements (Continued)
December 31,
2013
Other accrued expenses (current)................................................................................................
Other liabilities (long-term) ........................................................................................................
Total amount recognized as accrued pension benefit liability ....................................................
Accumulated other comprehensive loss:
Net loss .....................................................................................................................................
Tax benefit ................................................................................................................................
Net loss, net of tax benefit ........................................................................................................
Pension tax liability ..................................................................................................................
Accumulated other comprehensive loss related to net periodic pension benefit cost.................
$
$
$
$
2012
(695) $
(16,869)
(17,564) $
32,681
12,915
19,766
5,760
25,526
(373)
(38,184)
(38,557)
$
48,978
19,354
29,624
5,760
35,384
$
The total net loss of $32.7 million for the year ending December 31, 2013 relates to deferred actuarial losses from
changes in discount rates, differences between actual and assumed asset returns, and differences between actual and assumed
demographic experience (rates of turnover, retirement rates, mortality rates and prior to the plan freeze, rates of compensation
increases). During 2014, we expect to amortize net losses of $1.3 million, which are included in accumulated other
comprehensive loss as of December 31, 2013.
The following table includes other changes in plan assets and benefit obligations that were recognized in other
comprehensive income (loss) (in thousands):
December 31,
2013
Net gain (loss) ............................................................................................. $
Amortization of net actuarial loss ...............................................................
Net gain (loss) ............................................................................................. $
Tax benefit (provision)................................................................................
Total amount recognized in other comprehensive income (loss)................ $
2012
14,443
1,854
16,297
6,439
9,858
$
$
$
3,947
1,578
5,525
2,132
3,393
2011
$
$
$
(18,503)
753
(17,750)
(6,912)
(10,838)
Components of net periodic pension benefit cost were (in thousands):
Year Ended December 31,
2013
Service cost ................................................................................................. $
Interest cost .................................................................................................
Expected return on plan assets ....................................................................
Amortization of prior service cost ..............................................................
Amortization of net loss ..............................................................................
Net periodic benefit cost (gain)................................................................... $
— $
5,259
(6,450)
—
1,854
663 $
2012
— $
5,379
(6,190)
—
1,579
768 $
Our expected future pension benefit payments for the next 10 years are as follows (in thousands):
F-86
2011
—
5,872
(6,824)
—
754
(198)
LIN Television Corporation
Notes to Consolidated Financial Statements (Continued)
Expected Future Pension
Benefit Payments
For Years Ended December 31,
2014 ............................................................................................................................................................ $
2015 ............................................................................................................................................................
2016 ............................................................................................................................................................
2017 ............................................................................................................................................................
2018 ............................................................................................................................................................
2019 through 2023......................................................................................................................................
7,914
5,879
5,955
5,966
6,281
38,156
Weighted-average assumptions used to estimate our pension benefit obligations and to determine our net periodic pension
benefit cost are as follows:
Year Ended December 31,
2013
Discount rate used to estimate our
pension benefit obligation......................
Discount rate used to determine net
periodic pension benefit.........................
Rate of compensation increase...............
Expected long-term rate-of-return on
plan assets ..............................................
2012
2011
SERP
Retirement
Plan
SERP
Retirement
Plan
SERP
Retirement
Plan
4.70%
5.00%
3.60%
4.00%
3.90%
4.20%
3.60%
N/A
4.00%
N/A
3.90%
N/A
4.20%
N/A
5.25%
N/A
5.25%
N/A
N/A
7.00%
N/A
7.00%
N/A
7.00%
For the discount rate for the years ended December 31, 2013 and 2012, we used a custom bond modeler that develops
to settle the obligations of the plan. The yield on this hypothetical portfolio represents a reasonable rate to value our plan
liability.
We considered the current levels of expected returns on a risk-free investment, the historical levels of risk premium
associated with each of our pension asset classes, the expected future returns for each of our pension asset classes and then
weighted each asset class based on our pension plan asset allocation to derive an expected long-term return on pension plan
assets. During the years ended December 31, 2013, 2012 and 2011, our actual rate of return on plan assets was 12.0%, 15.4%
and 4.0%.
Our investment objective is to achieve a consistent total rate-of-return that will equal or exceed our actuarial assumptions
and to equal or exceed the benchmarks that we use for each of our pension plan asset classes. The following asset allocation
is designed to create a diversified portfolio of pension plan assets that is consistent with our target asset allocation and risk
policy:
Target
Allocation
2013
Asset Category
Equity securities ..............................................................................................
Debt securities .................................................................................................
60%
40%
100%
Percentage of Plan Assets
as of December 31,
2013
2012
60%
40%
100%
55%
45%
100%
The following table summarizes our pension plan assets measured at fair value using the prescribed three-level fair
value hierarchy as of December 31, 2013 and 2012 (in thousands):
F-87
LIN Television Corporation
Notes to Consolidated Financial Statements (Continued)
Quoted Prices
in Active
Markets for
Identical
Assets
Significant
Observable
Inputs
(Level 1)
(Level 2)
Total
December 31, 2013:
Cash and cash equivalents .............................................................. $
Money market fund.........................................................................
Commingled pools: .......................................................................
690
—
U.S. equity....................................................................................
International equity ......................................................................
REIT .............................................................................................
High yield bond............................................................................
Emerging markets.........................................................................
Investment grade fixed income ....................................................
Total................................................................................................ $
December 31, 2012:
—
—
—
—
—
—
690
Cash and cash equivalents .............................................................. $
Money market fund.........................................................................
Commingled pools: .......................................................................
573
—
U.S. equity....................................................................................
International equity ......................................................................
REIT .............................................................................................
High yield bond............................................................................
Emerging markets.........................................................................
Investment grade fixed income ....................................................
Total................................................................................................ $
—
—
—
—
—
—
573
$
$
$
$
—
762
37,645
18,884
3,213
4,101
5,994
36,150
106,749
—
519
30,034
15,241
3,875
2,916
6,374
36,880
95,839
$
$
$
$
690
762
—
37,645
18,884
3,213
4,101
5,994
36,150
107,439
573
519
—
30,034
15,241
3,875
2,916
6,374
36,880
96,412
The commingled pools, U.S. and International stock funds and U.S. bond funds consist of various funds that are valued
at the net asset value of units held by the plan at year-end as determined by the custodian, based on fair value of the underlying
securities. These methods may produce a fair value calculation that may not be indicative of net realizable value or reflective
of future values. Furthermore, while we believe these valuation methods are appropriate and consistent with other market
participants, the use of different methodologies or assumptions to determine fair value of certain financial instruments could
result in different fair value measurement as of the reporting date.
Note 11—Shareholders' Equity
During the year ended December 31, 2011, LIN TV's Board of Directors approved a stock repurchase program that
authorized LIN TV to repurchase up to $25 million of LIN TV's class A common stock over a 12 month period. This program
was extended by LIN TV's Board of Directors in November 2012 and was scheduled to expire on the earlier of the completion
the Merger Agreement, LIN TV terminated the share repurchase program. Prior to the termination, during the year ended
December 31, 2012, LIN TV repurchased approximately 3.3 million shares of LIN TV's class A common stock on the open
market for an aggregate purchase price of $11.4 million. There were no shares repurchased during the year ended December
31, 2013.
LIN LLC's class B common shares are convertible into an equal number of shares of LIN LLC's class A or class C
common shares in various circumstances. During the year ended December 31, 2013, prior to the Merger, 2.5 million shares
F-88
LIN Television Corporation
Notes to Consolidated Financial Statements (Continued)
of LIN TV's class B common stock were converted into shares of class A common stock. During the year ended December
31, 2012, none of LIN TV's class B common stock was converted into class A common stock.
Note 12—Restructuring and Contract Termination Costs
During the year ended December 31, 2013, we recorded restructuring charges of $3.9 million primarily related to
severance and related costs associated with the integration of the television stations acquired during 2012. During the years
ended December 31, 2012 and 2011, we recorded restructuring charges of $1.0 million and $0.7 million, respectively, as a
result of severance and related costs as well as the consolidation of certain activities at our stations and our corporate
headquarters. During the years ended December 31, 2013, 2012 and 2011, we made cash payments of $4.2 million, $0.8
million and $1.1 million related to these restructuring actions. We expect to make cash payments of $0.4 million related to
these restructuring actions during 2014.
The activity for these restructuring charges relating to severance and related costs is as follows (in thousands):
Severance and
Related
Balance as of December 31, 2011................................................................... $
Charges............................................................................................................
Payments .........................................................................................................
Balance as of December 31, 2012................................................................... $
Charges............................................................................................................
Payments .........................................................................................................
Balance as of December 31, 2013................................................................... $
515
1,009
(807)
717
3,895
(4,189)
423
In December 2013, we terminated an agreement with a service provider that provided national sales representation and
made a payment of $5.4 million to exit our agreement prior to its expiration. Concurrent with the termination of the agreement,
we released $1.5 million of deferred credits associated with the terminated contract. The amount of the one-time termination
payment, offset by the release of the deferred credits, has been reflected as Contract termination costs in our consolidated
statement of operations for 2013.
Note 13—Commitments and Contingencies
Commitments
We lease land, buildings, vehicles and equipment pursuant to non-cancelable operating lease agreements and we contract
for general services pursuant to non-cancelable operating agreements that expire at various dates through 2036. In addition,
we have entered into commitments for future syndicated entertainment and sports programming. Future payments for these
non-cancelable operating leases and agreements, and future payments associated with syndicated television programs as of
December 31, 2013 are as follows (in thousands):
Operating Leases
and Agreements
Year
2014 ............................................................................................................... $
2015 ...............................................................................................................
2016 ...............................................................................................................
2017 ...............................................................................................................
2018 ...............................................................................................................
Thereafter ......................................................................................................
Total obligations............................................................................................ $
45,076
33,930
16,140
12,146
1,611
7,139
116,042
_____________________________________________________
(1)
Includes $6.3 million of program obligations recorded on our consolidated balance sheet as of December 31, 2013
F-89
Syndicated
Television
Programming(1)
$
$
27,119
26,675
17,387
3,133
153
214
74,681
Total
$
$
72,195
60,605
33,527
15,279
1,764
7,353
190,723
LIN Television Corporation
Notes to Consolidated Financial Statements (Continued)
Rent expense, resulting from operating leases, was $5.8 million, $2.5 million and $1.5 million for the years ended
December 31, 2013, 2012 and 2011, respectively.
Contingencies
GECC Guarantee and the Merger
GECC provided secured debt financing for the joint venture between NBCUniversal and us, in the form of an $815.5
million non-amortizing senior secured note due 2023 bearing interest at an initial rate of 8% per annum until March 1, 2013
and 9% per annum thereafter. The GECC Note was an obligation of the joint venture. As of December 31, 2012, we had a
20.38% equity interest in the joint venture and NBCUniversal had the remaining 79.62% equity interest, in which we and
NBCUniversal each had a 50% voting interest. NBCUniversal operated two television stations, KXAS-TV, an NBC affiliate
in Dallas, and KNSD-TV, an NBC affiliate in San Diego, pursuant to a management agreement. LIN TV had previously
guaranteed the payment of principal and interest on the GECC Note.
On February 12, 2013, we, along with our wholly-owned subsidiaries, LIN Television and LIN Texas, entered into, and
simultaneously closed the JV Sale Transaction with subsidiaries of NBCUniversal, the GE Parties, Comcast and SVH whereby
in exchange for LIN Television causing a $100 million capital contribution to be made to SVH (which was used to prepay a
portion of the GECC Note), LIN TV was released from the GECC Guarantee and any further obligations relating to the shortfall
funding agreements. Further, LIN Texas sold its 20.38% equity interest in SVH to affiliates of NBCUniversal, and the LIN
parties transferred their rights to receivables related to the Shortfall Funding Loans for $1.00.
We accrued for and expensed the $100 million capital contribution to SVH to secure the release of the guarantee and
recorded the related tax effects in our consolidated financial statements as of December 31, 2012, because it represented a
probable and estimable obligation of the Company. In February 2013, we entered into a $60 million Incremental Facility and
utilized $40 million of cash on hand and borrowings under our revolving credit facility to fund the $100 million payment. As
a result of the JV Sale Transaction, after utilizing all of our available Federal net operating loss (“NOL”) carryforwards, we
had an approximate $162.8 million income tax payable remaining, $131.5 million of which was extinguished as a result of
the Merger described below.
On July 30, 2013, LIN TV was merged with and into LIN LLC with LIN LLC continuing as the surviving entity. The
Merger enabled the surviving entity to be classified as a partnership for federal income tax purposes and that change in
classification was treated as a liquidation of LIN TV for federal income tax purposes with the result that LIN TV realized a
capital loss in its 100% equity interest in LIN Television.
Based on an average of the opening and closing trading prices of LIN TV's class A common stock on the day of the
Merger, LIN TV realized a capital loss of approximately $343 million, which represents the difference between its tax basis
in the stock of LIN Television, and the fair market value of this stock as of July 30, 2013. The capital loss realized and existing
net operating losses were used to offset a portion of the capital gain recognized in the JV Sale Transaction and as a result, we
realized tax savings of $131.5 million, resulting in a remaining tax liability of $31.3 million associated with the JV Sale
Transaction. We made state and federal tax payments to settle this tax liability during the fourth quarter of 2013.
As a result of the JV Sale Transaction, neither we nor any of our direct or indirect subsidiaries have any further investment
in or obligations (funding or otherwise) related to SVH, including, without limitation, to make any other unsecured shortfall
loans or payments under the GECC Note or the GECC Guarantee.
Litigation
We are involved in various claims and lawsuits that are generally incidental to our business. We are vigorously contesting
all of these matters. The outcome of any current or future litigation cannot be accurately predicted. We record accruals for
such contingencies to the extent that we conclude it is probable that a liability has been incurred and the amount of the loss
can be reasonably estimated. No estimate of the possible loss or range of loss can be made at this time because the inherently
unpredictable nature of legal proceedings may be exacerbated by various factors, including: (i) the damages sought in the
ntial
F-90
LIN Television Corporation
Notes to Consolidated Financial Statements (Continued)
outcomes. Although the outcome of these and other legal proceedings cannot be predicted, we believe that their ultimate
resolution will not have a material adverse effect on us.
Note 14—Income Taxes
Our income before income taxes is solely from domestic operations. The (benefit from) provision for income taxes
consists of the following (in thousands):
Year Ended December 31,
2013
Current:
Federal .............................................................................................................
State .................................................................................................................
Foreign.............................................................................................................
Total current.....................................................................................................
Deferred:
Federal .............................................................................................................
State .................................................................................................................
Total deferred...................................................................................................
Total current and deferred................................................................................
$
$
$
$
2012
26,056
5,636
—
31,692
$
2011
$
$
21
1,571
633
2,225
(124,201) $
(32,911)
(157,112)
(125,420) $
33,865
4,373
38,238
40,463
$
$
$
543
652
—
1,195
(25,907)
8,667
(17,240)
(16,045)
The following table reconciles the amount that would be calculated by applying the 35% federal statutory rate to income
before income taxes to the actual (benefit from) provision for income taxes (in thousands):
Year Ended December 31,
2013
Provision assuming federal statutory rate........................................................ $
10,913
$
State taxes, net of federal tax benefit...............................................................
3,863
State tax law/rate changes, net of federal tax benefit ......................................
—
Change in valuation allowance........................................................................
(18,157)
Share compensation.........................................................................................
(53)
Reserve for tax contingencies..........................................................................
124
Impact of JV Sale Transaction.........................................................................
—
Impact of the Merger .......................................................................................
(124,306)
Non-deductible acquisition and Merger related transaction costs...................
1,645
Other ................................................................................................................
551
$ (125,420)
$
Effective income tax rate on continuing operations ........................................
(402.2)%
2012
7,871
$
5,723
1,883
(4,622)
(17)
633
28,435
—
—
557
40,463
$
179.9%
2011
11,780
1,790
5,703
(36,541)
601
—
—
—
—
622
(16,045)
(47.7)%
During the year ended December 31, 2013, we recognized a $124.3 million tax benefit as a result of the Merger as well
as an $18.2 million tax benefit as a result of the reversal of state valuation allowances. These valuation allowances were
reversed after evaluating our ability to recover certain net operating loss carryforwards due to the change in tax structure as
a result of the Merger, as we concluded the Company will more likely than not be able to realize these deferred tax assets.
The impact of the JV Sale Transaction is a result of entering into and consummating the transactions contemplated by
the JV Transaction Agreement on February 12, 2013, as described further in Note 1—"Basis of Presentation and Summary
of Significant Accounting Policies" and in Note 13—"Commitments and Contingencies." The JV Sale Transaction resulted
in the recognition of $27.5 million and $0.9 million of incremental short-term deferred federal and state tax liabilities,
respectively, in excess of those which were previously established. The financial impact of the JV Sale Transaction and
corresponding tax expense of $28.4 million are reflected in our consolidated financial statements for the year ended
F-91
LIN Television Corporation
Notes to Consolidated Financial Statements (Continued)
December 31, 2012. During the first quarter of 2013, approximately $162.8 million of short term deferred liabilities were
reclassified to income taxes payable upon the consummation of the JV Sale Transaction. As a result of the close of the Merger
on July 30, 2013, $131.5 million of this tax liability was extinguished, resulting in a remaining tax liability of approximately
$31.3 million associated with the JV Sale Transaction. We made state and federal tax payments to settle this tax liability during
the fourth quarter of 2013.
The 2011 state tax law/rate change, net of federal tax benefit, of $5.7 million is primarily a result of state tax legislation
enacted in Michigan in May 2011, which repealed the Michigan business tax ("MBT"), and implemented a corporate income
tax instead, effective January 2012. As a result of the elimination of the MBT, certain future tax deductions that were available
to be utilized beginning in 2015, and had been recognized as deferred tax assets in our financial statements, will not be
deductible. Therefore, during the year ended December 31, 2011, we recognized incremental deferred income tax expense of
$5.1 million, net of federal benefit, for the reversal of these previously established deferred tax assets. In addition, the 2012
state tax law/rate change, net of federal tax benefit, of $1.9 million is a result of a change in the effective tax rate used to value
our deferred tax assets/liabilities.
The components of the net deferred tax liability are as follows (in thousands):
December 31,
2013
Deferred gain related to equity investment in NBC joint venture ............................................ $
Property and equipment............................................................................................................
Intangible assets........................................................................................................................
Deferred gain on debt repurchase .............................................................................................
Noncontrolling interest .............................................................................................................
Other .........................................................................................................................................
Total ..................................................................................................................................... $
Net operating loss carryforwards.............................................................................................. $
Equity investments....................................................................................................................
Other .........................................................................................................................................
Valuation allowance..................................................................................................................
Total .....................................................................................................................................
Net deferred tax liabilities........................................................................................................... $
—
11,816
54,859
18,140
849
7,629
93,293
2012
$
$
259,049
12,822
36,761
18,309
549
7,476
334,966
(17,707) $
(2,372)
(15,426)
(110,169)
(1,554)
(32,625)
—
(35,505)
18,157
(126,191)
57,788
$
208,775
We maintain a valuation allowance related to our deferred tax asset position when management believes it is more likely
than not that the deferred tax assets will not be realized in the future. As of December 31, 2012, we had a valuation allowance
of $18.2 million offsetting certain state net operating loss carryforwards and other state deferred tax assets. During the third
quarter of 2013, after evaluating our ability to recover certain net operating loss carryforwards due to the change in tax structure
as a result of the Merger, we determined that we will more likely than not be able to realize these deferred tax assets. As a
result, we reversed the valuation allowance and recognized a corresponding tax benefit of $18.2 million.
As of December 31, 2013, we had federal net operating loss carryforwards (tax effected) of approximately $4.6 million
that begin to expire in 2034. Additionally, we had state net operating loss carryforwards that vary by jurisdiction (tax effected,
net of federal benefit) of $13.1 million, expiring through 2033. Included in the total federal and state net operating loss
carryforwards (tax effected) is $4.9 million that would be recorded in additional paid-in capital when realized.
Unrecognized Tax Benefits.
The Company's uncertain tax positions for the years ended December 31, 2013, 2012, and 2011 are limited to certain
unrecognized state and foreign benefits totaling $24.5 million, $26.6 million and $26.4 million, respectively. As of
F-92
LIN Television Corporation
Notes to Consolidated Financial Statements (Continued)
December 31, 2013, 2012 and 2011, there are $0.9 million, $0.8 million and $0 million of unrecognized tax benefits,
respectively, that if recognized would reduce the effective tax rate from continuing operations.
We recognize interest and penalties related to uncertain tax positions as a component of income tax expense. During
the years ended December 31, 2013, 2012 and 2011, we did not recognize or accrue any amounts related to interest and
penalties.
A reconciliation of the beginning and ending amounts of unrecognized tax benefits is as follows (in thousands):
Year Ended December 31,
2013
Balance at beginning of year ........................................................................... $
Additions for tax positions of current year......................................................
Additions for tax positions of prior years........................................................
Reductions for tax positions of prior years......................................................
Reductions related to settlements with taxing authorities ...............................
Reductions related to expiration of the statute of limitations..........................
Balance at end of year ..................................................................................... $
2012
26,559 $
733
—
(2,084)
—
(730)
24,478 $
2011
26,381 $
1,798
—
(1,133)
—
(487)
26,559 $
26,610
2,386
—
(2,128)
—
(487)
26,381
We file a consolidated federal income tax return and we file numerous other consolidated and separate income tax returns
in U.S. state jurisdictions. Tax years 2009-2012 remain open to examination by major taxing jurisdictions.
Note 15—Accrued Expenses
Accrued expenses consisted of the following (in thousands):
December 31,
2013
Accrued compensation................................................................................................................ $
Accrued contract costs................................................................................................................
Accrued interest ..........................................................................................................................
Accrued capital contribution to joint venture .............................................................................
Other accrued expenses ..............................................................................................................
Total............................................................................................................................................ $
2012
11,817
3,394
12,168
—
24,317
51,696
$
$
11,275
4,163
7,841
100,000
29,967
153,246
Note 16—Subsequent Events
On February 3, 2014, LIN Digital Media LLC, a wholly owned subsidiary, completed its acquisition of Federated Media
Publishing, Inc. ("Federated Media"). Federated Media is an industry-leading digital content and conversational marketing
company. For further information on this acquisition, see Note 2 — “Acquisitions.”
Note 17—Supplemental Disclosure of Cash Flow Information
Year Ended December 31,
2013
Cash paid for interest expense ........................................................................
Cash paid for income taxes—continuing operations ......................................
Non-cash investing activities:
Accrual for estimated shortfall loans to SVH .................................................
Non-cash financing activities:
Capital leases assumed in acquisitions............................................................
F-93
2012
(in thousands)
2011
$
$
48,646
32,937
$
$
42,348
1,103
$
$
47,801
559
$
—
$
—
$
4,697
$
179
$
14,896
$
—
LIN Television Corporation
Notes to Consolidated Financial Statements (Continued)
Note 18—Valuation and Qualifying Accounts
Balance at
Beginning of
Period
Charged
(Released) to
Operations
Balance at
End of
Period
Deductions
(in thousands)
Allowance for doubtful accounts as of December 31,
2013......................................................................................
2012......................................................................................
2011......................................................................................
Valuation allowance for state and federal deferred tax
assets as of December 31,
2013......................................................................................
2012......................................................................................
2011......................................................................................
$
$
$
3,599
2,310
2,194
$
$
$
$
$
$
18,157
23,422
59,990
$
$
$
F-94
1,608
2,047
760
$
$
$
(18,157) $
(5,265) $
(36,568) $
(2,019) $
(758) $
(644) $
3,188
3,599
2,310
—
—
—
—
18,157
23,422
$
$
$
Schedule I—Condensed Financial Information of the Registrant
LIN Media LLC
Condensed Balance Sheets
Year Ended December 31,
2013
2012
(in thousands,
except share data)
ASSETS
Advances to consolidated subsidiaries ....................................................................................... $
Investment in consolidated subsidiaries .....................................................................................
Total assets
$
LIABILITIES AND SHAREHOLDERS' EQUITY (DEFICIT)
Liabilities:
1,900
87,227
89,127
$
—
$
—
—
Accumulated losses in excess of investment in consolidated subsidiaries................................. $
Shareholders' equity (deficit):
—
$
91,564
Class A common shares, 100,000,000 shares authorized, Issued: 39,013,005 and 35,672,528
shares as of December 31, 2013 and 2012, respectively, Outstanding: 34,065,346 and
30,724,869 shares as of December 31, 2013 and 2012, respectively (a) .....................................
Class B common shares, 50,000,000 shares authorized, 20,901,726 and 23,401,726 shares as
624,564
313
equal number of shares of class A or class C common shares (a) ................................................
Class C common shares, 50,000,000 shares authorized, 2 shares as of December 31, 2013
518,395
235
common shares ...........................................................................................................................
Treasury shares, 4,947,659 of class A common shares as of December 31, 2013 and 2012, at
cost..............................................................................................................................................
Additional paid-in capital (a) .......................................................................................................
Accumulated deficit....................................................................................................................
Accumulated other comprehensive loss .....................................................................................
Total shareholders' equity (deficit)...........................................................................................
—
—
Total liabilities and LIN Media LLC shareholders' equity................................................... $
(21,984)
(21,984)
—
(1,006,322)
(25,526)
1,129,691
(1,164,435)
(35,384)
(91,564)
89,127
89,127
$
—
____________________________________________________
(a)
In conjunction with the Merger of LIN TV with and into LIN LLC on July 30, 2013, LIN Media LLC was deemed the successor reporting entity to LIN
TV. As such, the additional paid-in capital amount within LIN LLC's shareholders' equity as of December 31, 2013 has been allocated to the Class A and
B share balances to conform to LIN LLC's basis of presentation as a limited liability company. For purposes of LIN TV's shareholders' deficit balance as
of December 31, 2012, LIN TV's class A, B and C common shares had a par value of $0.01 per share that is not reflected as of December 31, 2013, as each
share represents a limited liability interest in LIN Media LLC.
F-95
LIN Media LLC
Condensed Statements of Operations
Year Ended December 31,
2013
2012
2011
(in thousands, except per share data)
Net Revenues .................................................................................................. $
Operating expenses:
Corporate.........................................................................................................
Operating loss .................................................................................................
Other income:
Intercompany income......................................................................................
Total other income...........................................................................................
Loss from continuing operations before taxes and equity in income (loss)
from operations of consolidated subsidiaries..................................................
Net loss from continuing operations ...............................................................
Equity in income (loss) from operations of consolidated subsidiaries ...........
Net income (loss) attributable to LIN Media LLC ......................................... $
Basic income (loss) per common share attributable to LIN Media LLC........ $
Diluted income (loss) per common share attributable to LIN Media LLC..... $
Weighted-average number of common shares outstanding used in
calculating basic income per common share...................................................
Weighted-average number of common shares outstanding used in
calculating diluted income per common share................................................
F-96
—
$
—
$
—
709
(709)
—
—
—
—
(20)
(20)
—
—
—
—
(689)
(689)
—
—
(7,045)
(7,045) $
(0.13) $
(0.13) $
—
—
48,577
48,577
0.87
0.85
52,439
54,130
55,768
55,639
54,130
57,079
158,802
158,113
3.02
2.84
$
$
$
LIN Media LLC
Condensed Statements of Comprehensive Income (Loss)
Year Ended December 31,
2013
2012
2011
(in thousands)
Net income (loss) attributable to LIN Media LLC ......................................... $
Pension net gain, net of tax of $5,705, $1,523 and $(7,291) for the years
ended December 31, 2013, 2012 and 2011, respectively................................
Amortization of pension net losses, net of tax of $734, $609 and $379 for
the years ended December 31, 2013, 2012 and 2011, respectively ................
Comprehensive income (loss) attributable to LIN Media LLC ...................... $
F-97
158,113
$
8,738
1,120
167,971
(7,045) $
2,424
$
969
(3,652) $
48,577
(11,212)
374
37,739
LIN Media LLC
Condensed Statements of Cash Flows
Year Ended December 31,
2013
OPERATING ACTIVITIES:
Net cash used in operating activities ........................................................... $
INVESTING ACTIVITIES:
Receipt of dividend ......................................................................................
Advances to consolidated subsidiaries.........................................................
Net cash provided by investing activities ....................................................
FINANCING ACTIVITIES:
Net proceeds from exercises of employee and director stock-based
compensation ................................................................................................
Net cash provided by financing activities....................................................
Net change in cash and cash equivalents ........................................................
Cash and cash equivalents at the beginning of the period ..............................
Cash and cash equivalents at the end of the period......................................... $
F-98
2012
(in thousands)
(589) $
2,000
(2,000)
—
589
589
—
—
—
$
—
2011
$
—
—
—
—
—
—
—
—
—
—
—
—
—
—
—
—
—
$
1. Background and Basis of Presentation
LIN Media LLC (“LIN LLC”) has no material assets or operations other than its ownership in LIN Television Corporation
(“LIN Television”) and its subsidiaries. Certain covenants within LIN Television's Senior Secured Credit Facility limit its
ability to distribute funds to LIN LLC in the form of dividends, loans or advances. Accordingly, these condensed financial
statements of LIN LLC have been presented on a "Parent Only" basis. The condensed parent company financial statements
should be read in conjunction with the consolidated financial statements and notes of LIN LLC included in this Annual Report
on Form 10-K.
F-99
(This page has been left blank intentionally.)
F-100
Senior Management Team
John A. Howell IV
Vice President Television
Brett E. Jenkins
Vice President
Denise M. Parent
Senior Vice President
V incent L. Sadusky
President
Rober t S. Richter
Senior Vice President
Digital
Kimber ly S. Davis
Vice President
Human Resources
Richard J. Schmaeling
Senior Vice President
Rebecca F. Duke
Vice President Distribution
Board of Directors
Royal W. Carson, III
Compensation Committee
Douglas W. McCormick
Chairman of the Board
Compensation, Nominating and
Governance Committees
Dr. William H. Cunningham
Audit Committee
William S. Banowsky, Jr.
Audit, Nominating and
Governance Committees
John R. Muse
Michael A. Pausic
Audit, Nominating and
Governance Committees
Peter S. Brodsky
Compensation, Nominating and
Governance Committees
V incent L. Sadusky
Annual Meeting
Share Register and Transfer Agent
Shareholders are invited to attend LIN Media LLC’s
Annual Meeting on Tuesday, May 6, 2014 at 10:00 AM
local time. The meeting will be held at the Omni Austin
Hotel Downtown, 700 San Jacinto Blvd, Austin, TX 78701.
Computershare
P.O. BOX 30170
College Station, TX 77842-3170
Phone: 1-877-295-8652
TDD for Hearing Impaired: 1-800-231-5469
www.computershare.com/investor
Email: [email protected]
Shareholder Information
Shareholders are encouraged to visit
www.linmedia.com for a wide range of Company
information including share quotes and charts, news
code of conduct and governance policies, investor
presentations and links to the Company’s owned,
operated and/or serviced stations’ websites.
Company Headquarters
LIN Media LLC
701 Brazos Street, Suite 800
Mailbox #90
Austin, TX 78701
512-774-6110
www.linmedia.com
Listing and Symbol
LIN Media LLC’s shares are traded on the New York Stock Exchange under the symbol LIN.
3/4/14 11:44 AM
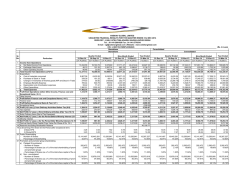
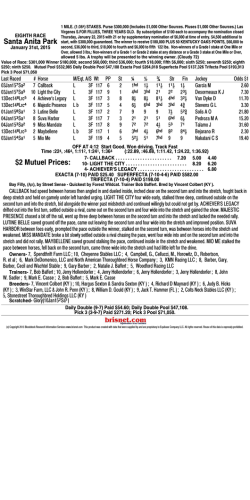

© Copyright 2026