
China Consumer
EQUITIES RESEARCH
CHINA CONSUMER
2015 Outlook: A phoenix in the fire
n Economic restructuring in China will continue to weigh on the Chinese consumer market in 2015. We
believe traditional consumer companies will face more slow revenue growth and margin squeeze, and
see most share price risk in companies trading at high valuation multiples, such as consumer staples.
n
We suggest investors focus on new industries such as travel & leisure and specialty F&B where high
growth should continue in the near term. We also think SOE reform could be a trigger for related
shares to outperform significantly. We adjust target prices and estimates for Gome, Biostime and Tingyi.
n
We initiate A-share coverage with a BUY rating on Kweichow Moutai for its attractive valuation and an
SOE reform angle. We also recommend investors BUY Haichang on the travel & leisure theme and
Gome for its visible earnings growth and e-commerce expansion.
Charlie Y Chen
[email protected]
+852 2825 1109
Our research is available on Thomson One, Bloomberg, TheMarkets.com, Factset and on http://eqresearch.bnpparibas.com/index. Please contact your salesperson for authorisation.
Please see the important notice on the inside back cover.
PREPARED AND PUBLISHED BY NON-US BROKER-DEALER(S): BNP PARIBAS SECURITIES (ASIA) LTD
THIS MATERIAL HAS BEEN APPROVED FOR U.S. DISTRIBUTION. ANALYST CERTIFICATION AND IMPORTANT DISCLOSURES CAN BE FOUND AT
APPENDIX ON PAGE 48
28 JANUARY 2015
Charlie Y Chen
China Consumer
To find out more about BNP Paribas Equities Research:
Visit : http://eqresearch.bnpparibas.com/
2
For ipad users : http://appstore.apple.com/BNPP-equities/
BNP PARIBAS
28 JANUARY 2015
28 JANUARY 2015
SECTOR REPORT
CHINA CONSUMER
2015 Outlook: A phoenix in the fire
n
Investment opportunities from the flames of restructuring
We see the China consumer sector in 2015 as a phoenix in the fire of government restructuring:
experiencing the pain of slowing growth, low CPI and interruptions from economic restructuring but
about to be reborn into a new wave of consumer growth. During the transition period, we think the
biggest opportunities are in new industries and products that we expect to drive growth.
n
We focus on travel & leisure, specialty F&B and SOE reform
We see opportunities in travel & leisure, specialty F&B and companies impacted by SOE reform. The
travel & leisure and specialty F&B markets are still relatively small in China, and should continue to
grow as personal income rises. SOE reform should create M&A and turnaround opportunities. In our
coverage, Haichang fits the travel & leisure theme, and Kweichow Moutai in SOE reform. We also like
Gome for its visible earnings growth and e-commerce expansion. We adjust target prices and
estimates for Gome, Biostime and Tingyi.
n
Expanding coverage to A-share listed Kweichow Moutai (600519 CH)
We initiate on A-share listed Kweichow Moutai (600519 CH) with a BUY rating for its attractive
valuation (13x FY15E PE), leading position in a unique market – Chinese baijiu (a traditional spirit) –
and operating efficiency and ROE improvement in the wake of expected SOE reform. There are no
HK-listed companies that give exposure to the baijiu market, so we expect Moutai’s share price to
benefit from international investor interest through the Shanghai-Hong Kong Stock Connect scheme.
BNPP recommendations
Company
Haichang Holdings
GOME Electrical
Kweichow Moutai
Tingyi
Source: BNP Paribas
Charlie Y Chen
[email protected]
+852 2825 1109
3
BBG code
Rating
Share price
Target price
Upside/downside
2255 HK
BUY
1.20
2.30
+91.7%
493 HK
BUY
1.09
1.94
+78.0%
600519 CH
BUY
180.11
232.00
+28.8%
322 HK
REDUCE
18.18
16.10
-11.4%
Charlie Y Chen
China Consumer
Investment thesis
China consumer market remains sluggish
We expect the Chinese government to remain focused on
restructuring, environmentally-friendly initiatives and
increasing efficiency. We expect this to continue to have a
temporarily negative impact on Chinese GDP and personal
disposable income growth. We expect retail sales growth to
deteriorate further in 2015 as a result.
The latest macro data from China all suggests the economy
is continuing to ‘normalise’ and that the 7.4% GDP growth
and 9% disposable income growth in 2014 will be deemed
‘reasonable’. We expect more of the same in 2015 as the
government seems to prefer this slower-but-moresustainable growth. As such, we suggest that investors
underweight Chinese consumer staples due to high
valuations and low growth. The discretionary sector seems
slightly better due to already-low PE multiples, but we do not
see any signs of a rebound in the near term.
Traditional consumer companies are likely to see more slow
growth in 2015 given already-high penetration and ASP
pressure from e-commerce and parallel trading. The shares
of consumer staples companies seem most at risk given
relatively high valuations compared to consumer
discretionary shares. Despite low commodity prices helping
consumer staples companies to boost margins, we expect
their valuations to continue to de-rate over the long term.
For 2015, we recommend focusing on: 1) non-traditional
consumer segments (eg travel & leisure) and niche market
players – we see some strong growth opportunities due to
current low penetration; and 2) companies that should benefit
from SOE reform and from the Shanghai-Hong Kong Stock
Connect scheme.
CONTENTS
A-shares are more interesting: we initiate on Moutai
A-share investors have particular appetites, leaving some
large cap consumer staples companies listed in China with
low valuations but solid fundamentals. We initiate on
Kweichow Moutai with a BUY for its strong brand name,
healthy cash flows and unique investment opportunity in
China’s baijiu (a traditional spirit) industry. It may also benefit
from SOE reform in the future.
2015: China consumer market still challenging
2014
(%)
Finding the phoenix among the ashes....................................... 5
14
Chinese consumption growth set to remain slow................... 7
12
Growth opportunities remain: travel, niche markets and
SOE reform ...................................................................................... 10
10
Discretionaries: Cheap valuations but no rebound in
sight ..................................................................................................15
6
Company reports ........................................................................... 16
2015E
11.8
12.4
9.4
7.9
8
4
2
0
Nominal GDP growth
Retail sales growth
Sources: National Bureau of Statistics of China; BNP Paribas estimates
MSCI China staples’ PE vs MSCI China discretionaries’ PE –
staples are de-rating faster than discretionaries
(%)
250
240
230
220
210
200
190
Jan-15
Dec-14
Nov-14
Oct-14
Sep-14
Aug-14
Jul-14
Jun-14
May-14
Apr-14
Mar-14
Feb-14
Jan-14
180
Source: Bloomberg
4
BNP PARIBAS
28 JANUARY 2015
Charlie Y Chen
China Consumer
Finding the phoenix among the ashes
We expect China to experience slower GDP growth (nominal growth at 7.9% in 2015
vs. 9.4% in 2014), still weak retail sales growth (12.4%) and lower CPI (1.9%) in
2015. There are several reasons for the sluggish consumer market performance
including: 1) a slowdown in personal income growth, partially driven by a
deterioration in corporate profitability; 2) weak global commodity prices putting
pressure on ASP increases, and 3) price competition from e-commerce and logistics
and lower import tariff barriers. As such, we think the Chinese consumption market
outlook in 2015 remains challenging.
Rather than looking at why the market will be slow in 2015 which will only add to the
pessimistic sentiment, we find it more useful to dig out sectors and companies that
should still grow relatively quickly. We suggest investors focus on three areas: 1)
service industries, in particular the travel & leisure industry; 2) niche market F&B
companies (we call them ‘discretionary staples’); and 3) companies likely to be
impacted by SOE reform.
EXHIBIT 1: Nominal GDP growth, retail sales and consumption as a percentage of GDP
(%)
GDP growth
Retail sales growth
60
Consumption as % of GDP
56.5
55.1
49.8
50
44.2
39.0
40.3
50.0
51.2
14.3
13.1
11.8
12.4
9.8
9.5
9.4
7.9
2012
2013
2014
2015E
43.1
39.6
40
30
20
22.7
14.9
18.2
15.8
22.9
10
15.7
17.0
15.5
18.1
18.3
17.8
17.1
17.8
8.6
0
2005
2006
2007
2008
2009
2010
2011
Source: National Bureau of Statistics of PRC
We have BUY ratings on:
§
Kweichow Moutai (600519 CH) – for its solid fundamentals, a baijiu industry
recovery and SOE reform;
§
Haichang (2255 HK) – for the strong growth of travel industry; and
§
Gome (493 HK) – for fundamentals continuing to improve as its new omnichannel strategy likely brings strong growth in e-commerce.
We have REDUCE ratings on:
§
Tingyi (322 HK) – for high penetration, slow growth and high valuation multiples;
In the sections that follow we highlight other companies (listed in Exhibit 3) which fall
into the three categories that we focus on: travel & leisure, niche market players and
SOE reform related companies.
5
BNP PARIBAS
28 JANUARY 2015
Charlie Y Chen
China Consumer
EXHIBIT 2: BNP Paribas investment recommendations
Company
Moutai
BBG code
Reco
TP
Price
Mkt cap
---------- P/E ----------
----- EV/EBITDA -----
------------------ 2015E ------------------
2014E
2015E
2014E
2015E
P/BV
ROE
Div. yield
(LC)
(LC)
(USD m)
(x)
(x)
(x)
(x)
(x)
(%)
(%)
600519 CH
BUY
232.00
180.11
32,939
13.8
13.3
8.1
8.3
3.4
27.4
3.0
2255 HK
BUY
2.30
1.20
619
21.3
16.8
8.1
7.2
1.0
6.2
-
Haichang
GOME
493 HK
BUY
1.94
1.09
2,385
11.6
9.5
4.7
4.0
0.8
9.2
3.2
Ajisen
538 HK
BUY
9.70
4.71
663
14.9
12.6
5.1
4.0
1.4
11.3
4.0
1112 HK
BUY
38.20
21.65
1,695
14.8
12.9
8.5
6.7
3.3
25.9
3.0
291 HK
BUY
30.34
17.62
5,503
42.0
26.2
6.9
5.4
0.9
3.6
1.3
Biostime
CRE
Sun Art
6808 HK
BUY
12.00
7.17
8,823
18.4
16.1
7.7
6.7
2.5
16.5
2.5
Mengniu
2319 HK
HOLD
35.30
34.50
8,716
28.5
22.0
14.6
11.2
2.5
11.9
1.0
Hengan
1044 HK
HOLD
85.00
84.15
13,290
26.9
23.8
17.7
15.5
6.1
25.1
2.5
Tsingtao Brewery
168 HK
HOLD
51.70
52.95
9,202
29.1
25.7
16.6
14.3
3.3
13.6
0.8
UPC
220 HK
HOLD
5.63
6.79
3,783
34.9
28.9
12.1
10.7
1.9
6.6
0.7
Want Want
151 HK
HOLD
10.55
9.11
15,507
22.6
21.2
15.1
14.0
6.6
32.9
3.1
Tingyi
322 HK
REDUCE
15.80
18.18
13,141
30.4
27.0
12.1
10.7
3.8
14.9
1.9
Priced at 27 Jan 2015
Sources: Bloomberg data; BNP Paribas estimates
EXHIBIT 3: Other related companies (all Not Rated)
Company
BBG code
Price
Mkt cap
------------ P/E ------------
-------- EV/EBITDA --------
----------------------- 2015E -----------------------
2014E
2015E
2014E
2015E
P/BV
ROE
Dividend yield
(LC)
(USD m)
(x)
(x)
(x)
(x)
(x)
(%)
(%)
46.78
7,316
30.4
24.3
18.0
14.1
3.8
16.4
1.1
22.3
1,792
25.4
21.2
16.8
14.5
6.2
32.0
2.0
Travel & Leisure theme
CITS
601888 CH
Niche market player theme
Chengde Lolo
000848 CH
Ozner
2014 HK
3.68
831
na
na
na
na
na
na
na
Huiyuan Juice
1886 HK
2.80
915
na
na
27.2
17.1
0.6
2.5
-
756 HK
0.75
130
9.5
na
7.9
na
na
na
na
Shanghai Jahwa
600315 CH
39.27
4,229
27.2
22.3
23.3
18.8
5.3
24.6
1.4
Yanjing Brewery
000729 CH
8.52
3,834
31.2
26.9
13.8
11.8
1.9
6.6
1.1
Tianyi Juice
SOE Reform Theme
Priced at 27 Jan 2015
Source: Bloomberg data and consensus estimate
6
BNP PARIBAS
28 JANUARY 2015
Charlie Y Chen
China Consumer
Chinese consumption growth set to remain slow
Slow income growth
One of the major drivers of the consumer market is income growth. While we heard a
lot of complaints about labour cost increases from companies a few years ago, this
does not seem to be as big an issue now. Actually, the growth of disposable income
per capita in China has been decreasing. As China enters a ‘new normal’ growth
mode, the profit growth of business is also likely to slow, which makes us believe
personal income growth in 2015 will go down further. Exhibits 4 and 5 show that
slowing GDP growth will probably on drag personal income growth, which has a very
high historical correlation with retail sales growth.
EXHIBIT 4: Per capita disposable income growth vs GDP
growth
GDP growth
Per capita disposable income growth
(%)
25
15.7
18.1
17.0
15
17.8 17.8
17.2
12.6
14.5
14.1
8.6
11.4 12.1
11.3
9.5
9.4
9.8
9.7
8.8
Retail sales growth
(%)
22.9
20
10
EXHIBIT 5: Per capita disposable income growth vs retail
sales growth
9.0
5
0
2005 2006 2007 2008 2009 2010 2011 2012 2013 2014
Source: National Bureau of Statistics of PRC
Per capita disposable income growth
22.7
24
22
20
18
16
14
12
10
8
6
4
2
0
18.3
18.2
14.9
15.8
17.1
15.5
14.3
17.2
14.5
13.1
11.8
14.1
12.6
11.4 12.1
11.3
8.8
9.7
9.0
2005 2006 2007 2008 2009 2010 2011 2012 2013 2014
Source: National Bureau of Statistics of PRC
We expect China to cut interest rates to boost liquidity in 2015 just enough to ensure
economic growth remains acceptable (and to avoid a hard landing). Therefore, we’re
not expecting a sharp rebound in the Chinese consumer market in 2015.
Weak commodity prices with potential increases in marketing and promotions
China’s CPI dropped to 2.0% in 2014 and we expect low inflation to continue in
2015. The oil price dropped to USD47 per barrel in Jan (vs USD96 per barrel a year
ago). With this kind of drop, many industrial product prices such as fertilizer and
packaging products are also falling. Our discussions with almost every consumer
company (in particular staples companies) confirm gross margins in 2015 should
improve. However, some are concerned marketing expenses may rise, effectively
driving down ASPs. We expect global deflation in 2015 with all major commodity
prices remaining low or falling further.
EXHIBIT 6: Oil price
EXHIBIT 7: Pulp price
(USD/bbl)
(RMB/mt)
120
4,800
4,700
100
4,600
4,500
80
4,400
4,300
60
4,200
40
4,100
4,000
20
3,900
Source: Bloomberg
7
3,800
May-13
Jun-13
Jul-13
Aug-13
Sep-13
Oct-13
Nov-13
Dec-13
Jan-14
Feb-14
Mar-14
Apr-14
May-14
Jun-14
Jul-14
Aug-14
Sep-14
Oct-14
Nov-14
Dec-14
Jan-15
Nov-14
Sep-14
Jul-14
May-14
Mar-14
Jan-14
Nov-13
Sep-13
Jul-13
May-13
Mar-13
Jan-13
0
Source: Bloomberg
BNP PARIBAS
28 JANUARY 2015
Charlie Y Chen
China Consumer
EXHIBIT 8: Barley price
EXHIBIT 9: Milk powder price
(index)
(USD/mt)
140
6,000
120
5,000
100
4,000
80
3,000
60
Jan-15
Nov-14
Sep-14
Jul-14
May-14
Mar-14
Jan-14
Nov-13
Jan-13
Feb-13
Mar-13
Apr-13
May-13
Jun-13
Jul-13
Aug-13
Sep-13
Oct-13
Nov-13
Dec-13
Jan-14
Feb-14
Mar-14
Apr-14
May-14
Jun-14
Jul-14
Aug-14
Sep-14
Oct-14
Nov-14
Source: Bloomberg
Sep-13
0
Jul-13
0
May-13
1,000
Jan-13
20
Mar-13
2,000
40
Source: Bloomberg
Shortened supply chains and rising price transparency removing excessive profit
Low inflation is also due to a ‘flatter’ world. The development of Internet technology
has enabled consumers to have much easier access to much more information,
which removes price information asymmetry. Low oil prices, more developed global
transportation infrastructure, the gradual removal of global trade barriers (such as
import tariffs) and the increasing power of global sourcing have slashed the logistics
costs of moving merchandise globally. E-commerce platform offerings low priced
products are a result of the above trends, and we expect this to continue in 2015.
The old business model of buying low in some part of the world and selling high in
China no longer works.
EXHIBIT 10: Drivers squeezing out ‘China premium’ in product prices
Excessive profit due to price information
assymetry
- Development of internet increases price
transparency around the world
- Easy overseas traveling (due to lower visa barriers
and increasing income) enables Chinese consumers
to be more knowledgeable and sophisticated
- Emerging of local made copy cat products reduces
foreign products' scarcity value
Distribution cost in China and
distributors' profits
- Online retailing flattens the distribution layer and
lowers distribution cost in China
Shipping cost to China and shippers'
profit
- Lower trade barrier between China and foreign
markets
Product price at local market
More reasonable premium
Product price at local market
Source: BNP Paribas
Implications for the consumer sector: staples face de-rating, discretionary still bottoming
Although these slowing effects would seem to have greater negative impact on the
discretionary sector, we suggest investors underweight staples companies for two
reasons: 1) discretionary companies’ valuations are already low after having de-rated
in the last couple of years, and 2) temporarily low raw material costs may dress up
staples companies earnings in the short term, but the long-term structural problems
of some companies remain unsolved – we would take the opportunity to exit such
stocks before it is gone.
8
BNP PARIBAS
28 JANUARY 2015
Charlie Y Chen
China Consumer
EXHIBIT 11: P/E valuation gap between China staples and discretionary stocks
(x)
MSCI China Consumer Discretionary P/E
MSCI China Consumer Staples P/E
35
30
25
20
15
10
5
0
Jan-10
Jul-10
Jan-11
Jul-11
Jan-12
Jul-12
Jan-13
Jul-13
Jan-14
Jul-14
Jan-15
Source: Bloomberg
9
BNP PARIBAS
28 JANUARY 2015
Charlie Y Chen
China Consumer
Growth opportunities remain: travel, niche markets and SOE reform
Despite the deceleration of the overall Chinese consumer market, we expect some
sectors to maintain very strong growth, in particular in non-traditional consumer
industries such as travel & leisure, and in niche markets such as for specialty food &
beverage products.
Travel & leisure: strong growth driven by income growth
According to China National Tourism Administration data for 2013, the number of
domestic travellers increased 10% and travel revenue increased 16%, the number of
Chinese travellers to foreign countries increased by 18% and total tourism industry
revenue was nearly RMB3t (up a healthy 16% y-y).
EXHIBIT 12: Growth in the number of domestic travellers
(%)
30
EXHIBIT 13: Growth in domestic travellers’ spending
(%)
25
22.2
25.6
25
20
20
15.0
15
15.5
15
11.1
10.0
10
11.7
12.0
10.6
10.3
10
8.0
5.9
6.3
5
5
2.0
2.5
2005
2006
4.8
5.0
4.9
2012
2013
0
0
2005
2006
2007
2008
2009
2010
2011
2012
2013
2007
2008
2009
2010
Source: National Bureau of Statistics of PRC
Source: National Bureau of Statistics of PRC
EXHIBIT 14: Growth in the number of travellers to foreign
countries
EXHIBIT 15: Total tourism receipt growth
(%)
25
(%)
60
22.4
2011
53.5
20.4
18.6
20
18.4
18.0
50
40
15
11.9
11.3
10
30
7.5
24.7
17.9
20
17.6
16.4
15.7
12.6
12.2
4.0
5
23.5
10
0
0
2005
2006
2007
2008
Source: National Bureau of Statistics of PRC
2009
2010
2011
2012
2013
2005
2006
2007
2008
2009
2010
2011
2012
2013
Source: National Bureau of Statistics of PRC
The recently trend of Chinese companies acquiring international travel-related
companies and properties also suggests the travel industry is getting more attention
from investors. We list some such acquisitions in 2014 in exhibit 16.
10
BNP PARIBAS
28 JANUARY 2015
Charlie Y Chen
China Consumer
EXHIBIT 16: Investment and acquisitions in travel industry related to Chinese companies in 2014
Date
Projects
26 Jun 2014
The world’s second largest travel search company Skyscanner announced it would acquire Chinese travel price search engine Youbibi, without giving
details of the total consideration.
6 Oct 2014
Chinese Ambound Insurance announced it would acquire the Waldorf Astoria New York for USD1.95b from the Hilton Group.
12 Nov 2014
Shanghai Jinjiang International announced it would acquire a 100% stake of Louvre Hotels Group from the Starwood Group. Luvre Hotel Group currently
operates over 1,100 hotels with over 80,000 hotels rooms in more than 40 countries.
19 Dec 2014
Fosun International Group offered EUR939m to acquire Club Med.
24 Dec 2014
Chinese private company Xinglida Group acquired Marriot Hotel at LAX Airport for USD165m. Marriot at LAX has a total of 1,004 hotel rooms and 29
conference halls, with an average occupancy rate of 95% in 2014.
06 Jan 2015
Ctrip announced it would acquire a majority stake in British low price flight ticket search website Travelfusion. The total value of Travelfusion is estimated
by the newspaper TheMarker to be around USD160m.
Sources: Various newspapers and websites
Along the value chain of the tourism sector there are many industries that can be
invested in (exhibit 17). We believe travel agent services, especially the flight and
hotel booking services, are getting more competitive because of the development of
online booking, and that duty free shopping and attraction site operators seem
interesting due high entry barriers and their unique value proposition.
EXHIBIT 17: Investment opportunities along the value chain of travel industry
Lodging services providers
- China Lodgeing
- Home Inn
- Jinjiang
Travel Agent Services
Providers
- CITS
- QUNAR
- CTRIP
- TUNIU
Leisure park operators
- Haichang
Travel Infrustracture
Companies
- Airports
Travel destinations
Consumers
Transportation services
providers
- Airlines
Travel payment companies
- Credit card companies
- Online payment platforms
Travel shopping retailers
- CITS
- Hotel Shilla
Source: BNP Paribas
EXHIBIT 18: Strength & weakness analysis along travel & leisure industry value chain
Value chain
Strengths
Flight/hotel booking
services
§
Large companies have bargaining power and
better pricing and profits
§
§
High competition in online market
Airline & hotel companies may cut off the
middleman
-
CTRP US
QUNR US
Travel package
services
§
Secular demand for “worry-free” preferred
travellers
§
Demand may weaken due to travel
preference shifting to more individual, small
group and personalised tours, instead of
standardized tour packages
-
601888 CH
Transportation service
providers
§
Not covered by BNP Paribas consumer
research
§
Not covered by BNP Paribas consumer
research
-
Airlines: not covered by BNPP
consumer research
Travel infrastructure
companies
§
Not covered by BNP Paribas consumer
research
§
Not covered by BNP Paribas consumer
research
-
Airports: not covered by BNPP
consumer research
Lodging services
providers
§
Good potential as number of travelers rise
§
Asset heavy, may suffer big loss due to over
capacity or in a downcycle due to economic
slowdown, disease breaking out, etc
-
HMIN US
HTHT US
Park operators
§
High entry barrier (due to high requirement on
capex, regulations and necessary skills)
Sometimes unique and not replicable (natural
scene, cultural site, etc.)
§
Asset heavy, long return period, high fix
costs, high profit fluctuation due to consumer
traffic change, may have financing need in
expansion cycle
-
2255 HK
§
Weaknesses
Related companies
Travel payment
companies
§
Not covered by BNP Paribas consumer
research
§
Not covered by BNP Paribas consumer
research
-
NA
Travel shopping
retailers
§
High entry barrier due to special location and
licenses (duty free shopping)
§
Licence renewal risks
-
601888 CH
Source: BNP Paribas
11
BNP PARIBAS
28 JANUARY 2015
Charlie Y Chen
China Consumer
Within our coverage, we believe Haichang is a good investment target as it operates
the largest theme park chain in China. Its recent acquisition of a site in Shanghai has
secured the land for its next large theme park near Shanghai Disneyland. With
visitors numbers continuing to ramp up, Haichang’s profitability and cash flow are
poised to improve.
As part of our travel & leisure investigation, we visited China International Travel
Services (CITS) which provides travel services such as travel packages and
operates duty free stores. Although its travel services business is facing some
competition, duty free retailing has become its strongest growth engine, according to
management. The company opened the only duty free store in Sanya in 2014, after
the Chinese government announced its Duty Free Shopping in Hainan Island policy.
Initially, the Chinese government allowed each visitor to Hainan Island to purchase
up to RMB5,000 of duty free items in the shop per year, but the ceiling was lifted to
RMB8,000 last year. We believe the government will make it easier for consumers to
buy duty free goods, while the selection of duty free retailers will remain very strict.
Currently, there are two main duty free retailing operators in China, Sunrise (not
listed) which operates duty free shops in Beijing and Shanghai airports, and CITS
which operates all other duty free shops.
EXHIBIT 19: Travel related companies (all Non Rated)
Name
BBG code
Price
Mkt. cap
---------- P/E ---------2014E
2015E
----- EV/EBITDA ----2014E
2015E
--------- P/BV --------2014E
2015E
ROE
Div. yield
2015E
2015E
(LC)
(USD m)
(x)
(x)
(x)
(x)
(x)
(x)
(%)
(%)
CTRIP
CTRP US
49.52
6409
78.60
63.90
177.70
87.30
4.80
4.60
5.30
-
Qunar
QUNR US
29.88
3652
n.a.
n.a.
n.a.
n.a.
n.a.
n.a.
156.10
-
HMIN US
24.55
1167
14.30
13.10
4.90
4.20
1.50
1.30
10.80
n.a.
Home Inn
China Lodging
HTHT US
21.5
1336
25.50
23.50
8.00
6.80
2.60
2.30
10.80
-
China International Travel
601888 CH
46.78
7311
30.40
24.30
17.30
12.90
4.40
3.80
16.40
1.00
Shenzhen Overseas Chinese
000069 CH
7.88
9173
11.30
9.50
n.a.
n.a.
2.00
1.70
18.90
1.00
Songcheng Performance Deve
300144 CH
30.12
2690
41.50
31.70
22.90
17.40
4.80
4.30
13.90
0.70
China Cyts Tours Hldg
600138 CH
17.81
2064
33.40
25.40
14.70
12.10
3.40
3.00
12.20
1.10
Emei Shan Tourism
000888 CH
22.43
946
29.00
25.30
14.80
12.50
3.50
3.10
11.90
0.80
Beijing Jingxi Culture & Tou
000802 CH
14.62
910
n.a.
n.a.
n.a.
n.a.
n.a.
n.a.
n.a.
n.a.
Yunnan Tourism
002059 CH
12.29
719
n.a.
n.a.
n.a.
n.a.
n.a.
n.a.
n.a.
n.a.
Lijiang Yulong Tourism
002033 CH
16.41
740
26.00
22.10
10.90
9.50
3.20
2.90
14.50
0.90
Huatian Hotel
000428 CH
6.25
719
56.80
44.60
n.a.
n.a.
2.90
3.20
1.70
n.a.
Changbai Mountain Tourism
603099 CH
14.98
640
74.90
55.50
n.a.
n.a.
7.50
6.70
11.40
n.a.
Btg Hotels
600258 CH
17.99
666
n.a.
n.a.
n.a.
n.a.
3.80
3.50
11.30
1.30
Jinling Hotel
601007 CH
13.05
627
45.50
33.50
n.a.
n.a.
2.60
2.50
6.40
1.30
Guilin Tourism
000978 CH
9.63
555
65.10
61.70
n.a.
n.a.
2.50
2.40
2.60
0.50
Guangzhou Dongfang Hotel
000524 CH
12.99
561
99.90
86.60
n.a.
n.a.
5.40
5.10
5.80
n.a.
China United Travel
600358 CH
9.49
656
n.a.
n.a.
n.a.
n.a.
n.a.
n.a.
n.a.
n.a.
Hainan Dadonghai Tourism
200613 CH
6.64
416
n.a.
n.a.
n.a.
n.a.
n.a.
n.a.
n.a.
n.a.
Zhangjiajie Tourism
000430 CH
8.4
431
28.00
23.10
n.a.
n.a.
5.50
4.90
15.60
n.a.
Xi'An Tourism
000610 CH
10.69
337
n.a.
n.a.
n.a.
n.a.
n.a.
n.a.
n.a.
n.a.
Dalian Sunasia Tourism
600593 CH
18.91
278
n.a.
n.a.
n.a.
n.a.
n.a.
n.a.
n.a.
n.a.
Huangshan Tourism Develop
900942 CH
1.703
1113
21.20
16.90
12.90
10.50
2.30
2.00
12.00
3.90
Sh Jinjiang Intl Travel
900929 CH
2.528
335
n.a.
n.a.
n.a.
n.a.
n.a.
n.a.
n.a.
n.a.
Sh Jinjiang Intl Hotels
900934 CH
2.081
3214
19.10
15.30
21.40
17.80
2.00
1.80
11.30
3.10
Priced at 27 Jan 2015
Source: Bloomberg data and consensus estimate
12
BNP PARIBAS
28 JANUARY 2015
Charlie Y Chen
China Consumer
Niche market players in specialty F&B sectors
Most traditional food & beverage sectors are facing penetration saturation and overcapacity issues, hence we still believe the likes of Tingyi, Want Want, UPC and
Mengniu will face a challenging 2015 in terms of top-line growth. Some, such as
Mengniu, may face also ASP pressure due to tumbling global milk prices. Although
some raw material prices are dropping (in particular, crude oil which is widely used in
making packaging material), we do not think temporary margin improvement is
sufficient to sustain the high valuations of these companies.
EXHIBIT 20: Revenue growth of major food & beverage sectors in China
(%)
2010
2011
2012
2013
2014
38
40
30
25
20
20
15 14
17
12 11
12
10
19
5
4 4
23
16
10
9
8
25 26
11 11 12
12 12
6
4
10 9
8 9
12 12 11
0
(10)
(9)
(20)
Instant Noodle
Carbonated drink
RTD Tea
Dairy Beverage
Snack food
Nuts
Energy drink
Source: Euromonitor
We suggest investors switch focus from large cap F&B companies (low growth, high
valuation) to specialty F&B sectors such as niche market players (high growth, small
market cap). In particular, health awareness related concepts are on the rise. The
following companies fall into this category: Ozner Water (2014 HK) leases high end
water purifiers and will launch its “smart mug” to get into the smart equipment
business. Chengde Lolo (000848 CH) is a main player in the fast growing plantbased protein drink market in China. Tianyi Juice (00756 HK) just launched its own
consumer brand Summy to sell pure juice (not from concentrate). Huiyuan Juice
(1886 HK) is the largest high concentrate juice brand in China, which experienced
some management and strategy change last year.
EXHIBIT 21: F&B niche market players
Company
BBG code
Price
(LC)
Ozner
Chengde Lolo
Mkt cap
(USD m)
-------------- P/E --------------
--------- EV/EBITDA ---------
----------------------- 2015E -----------------------
2014E
2015E
2014E
2015E
P/BV
ROE
Div. yield
(x)
(x)
(x)
(x)
(x)
(%)
(%)
2014 HK
3.68
831
na
na
na
na
na
na
na
000848 CH
22.3
1,792
25.4
21.2
16.8
14.5
6.2
32.0
2.0
756 HK
0.75
130
9.5
na
7.9
na
na
na
na
1886 HK
2.80
915
na
na
27.2
17.1
0.6
2.5
-
Tianyi Juice
Huiyuan Juice
Priced at 27 Jan 2015
Source: Bloomberg
SOE reform related
The Chinese government is focused on SOE reform to improve operational
efficiency. We expect two types of reform: for the already-large SOEs, the focus is
likely to be on would operations such as increasing non-SOE shareholders and
management incentive schemes; and for smaller SOEs, the focus is likely to be on
restructuring through M&A.
We recommend investors BUY Kweichow Moutai (600519 CH) which had a couple of
poor years in 2013 and 2014 due to the Chinese government’s anti-graft campaign,
but which we believe is deep in the value due to its strong brand and potential upside
if its management incentive plan is implemented. With a good brand, Moutai’s ROIC
13
BNP PARIBAS
28 JANUARY 2015
Charlie Y Chen
China Consumer
has been decreasing since it is not making good use of its cash. We think its cash
pile can be used more aggressively in marketing, new product innovation as well as
M&A – and we expect this to happen once management is better incentivized.
Yanjing Brewery (000729 CH) is also in this SOE reform category. In the past CRE
has expressed an interest in aquireing Yanjing Brewery if it came up for sale due to
its strong brand and foothold in strategic markets (Beijing and Guangxi). SOE reform
may push consolidation in the beer industry, and Yanjing, as the largest independent
brewery in China outside Tsingtao and global players, is likely to be involved.
EXHIBIT 22: SOE-related companies
Company
BBG code
Rec
Price
Mkt cap
------------ P/E -----------2014E
2015E
-------- EV/EBITDA -------2014E
----------------------- 2015E -----------------------
2015E
P/BV
ROE
Div. yield
(LC)
(USD m)
(x)
(x)
(x)
(x)
(x)
(%)
(%)
180.11
32,944
13.8
13.3
8.1
8.3
3.4
27.4
3.0
Moutai
600519 CH
BUY
Yanjing Brewery
000729 CH
NR
8.52
3,834
31.2
26.9
13.8
11.8
1.9
6.6
1.1
CITS
601888 CH
NR
46.78
7,316
30.4
24.3
18
14.1
3.8
16.4
1.1
Shanghai Jahwa
600315 CH
NR
39.27
4,229
27.2
22.3
23.3
18.8
5.3
24.6
1.4
Priced at close 27 Jan 2015
Source: Bloomberg data, and consensus estimates except BNP Paribas estimates for Moutai
Staples: overall bearish given high valuations
The only positive news on the staple sector in 2015 is cheap raw material costs, and
only for some companies. Low crude oil prices benefit almost all company because
oil is widely used in making packaging material, for example, PET bottles. However,
our opinion is any share price rebound from the trough will be a good time to reduce
holdings in some companies, such as Tingyi and Want Want because visible growth
for these companies can hardly support their valuation.
EXHIBIT 23: Comp table of large cap HK listed staples
Company
Sun Art Retail Group Ltd
BBG code
Reco
Price
Mkt cap
----------- P/E -----------
------ EV/EBITDA ------
------------------- 2015E -------------------
2014E
2015E
2014E
2015E
P/BV
ROE
Div. yield
(LC)
(USD m)
(x)
(x)
(x)
(x)
(x)
(%)
(%)
18.4
16.1
7.7
6.7
2.5
16.5
2.5
6808 HK
BUY
7.17
8,822.58
China Resources Enterprise
291 HK
BUY
17.62
5,503.03
42
26.2
6.9
5.4
0.9
3.6
1.3
Biostime International Holdi
1112 HK
BUY
21.65
1,694.58
14.8
12.9
8.5
6.7
3.3
25.9
3.0
China Mengniu Dairy Co
2319 HK
HOLD
34.50
8,715.74
28.5
22.0
14.6
11.2
2.5
11.87
1.0
220 HK
HOLD
6.79
3,782.93
34.9
28.9
12.1
10.7
1.9
6.6
0.7
1044 HK
HOLD
84.15
13,289.65
26.9
23.8
17.7
15.5
6.1
25.1
2.5
Uni-President China Holdings
Hengan Intl Group Co Ltd
Want Want
151 HK
HOLD
9.11
15,506.11
22.6
21.2
15.1
14.0
6.6
32.9
3.1
Tingyi (Cayman Isln) Hldg Co
322 HK
REDUCE
18.18
13,140.59
30.4
27.0
12.1
10.7
3.8
14.9
1.9
Tsingtao Brewery
168 HK
HOLD
52.95
9202.17
29.1
25.7
16.6
14.3
3.3
13.6
0.8
Priced at 27 Jan 2015
Sources: Bloomberg; BNP Paribas estimates
14
BNP PARIBAS
28 JANUARY 2015
Charlie Y Chen
China Consumer
Discretionaries: Cheap valuations but no rebound in sight
Although many discretionary stocks are cheap, we do not see any signs of a rebound
in the near term given recent weak macro data. We believe the structural change of
the retail channel has not been completed and traditional retailers are still trying to
find a way to regain traffic, but with little success. Before investors have a clearer
picture of how traditional retailers will survive, it is difficult to give earnings forecasts
and valuations. Hence we continue to suggest investors equal weight the
discretionary retailing sector in the near term.
The only retailing stock we think has good earnings growth visibility for 2015 is
Gome, which has already transitioned from a traditional retailer to an omni-channel
operator, enabling it to defend and compete with online peers to a degree. Our other
positive views reflect non-traditional discretionary companies Haichang and Maple
Leaf enjoying decent revenue growth and gold retailers benefiting from last year’s
low base and potential gold appreciation after the EU’s new QE policy and political
uncertainties in Greece. Overall, the situation in the discretionary sector seems a
little better than in the staple sector since discretionary companies’s valuations have
already de-rated.
EXHIBIT 24: Comp table of discretionaries
Company
BBG code
Reco
TP
Price
Mkt cap
--------- P/E --------2014E
Haichang
GOME
Ajisen
Maple leaf
Chow Sang Sang
Chow Tai Fook
2015E
---- EV/EBITDA ---2014E
2015E
------------------ 2015E ----------------P/BV
ROE
Div. yield
(LC)
(LC)
(USD m)
(x)
(x)
(x)
(x)
(x)
(%)
(%)
2255 HK
BUY
2.30
1.20
619
21.3
16.8
8.1
7.2
1.0
6.2
-
493 HK
BUY
1.94
1.09
2,384
11.6
9.5
4.7
4.0
0.8
9.2
3.2
538 HK
BUY
9.70
4.71
663
14.9
12.6
5.1
4.0
1.4
11.3
4.0
1317 HK
BUY
2.91
2.16
372
10.3
15.5
6.9
5.1
1.7
16.4
-
116 HK
BUY
21.60
20.50
1,790
12.3
10.4
9.0
7.6
1.4
14.5
3.6
1929 HK
BUY
11.95
9.91
12,782
13.7
14.7
10.3
11.0
2.3
17.0
3.4
Emperor Watch & Jewellery
887 HK
BUY
0.45
0.36
315
9.8
7.9
5.1
4.4
0.5
6.6
3.8
Bonjour
653 HK
HOLD
0.83
0.73
321
11.5
11.3
7.2
7.9
3.8
38.5
4.6
Luk Fook
590 HK
HOLD
25.40
28.00
2,128
9.0
12.0
6.5
8.5
2.0
17.6
3.3
Sa Sa
178 HK
REDUCE
4.50
4.97
1,824
15.2
17.2
10.2
11.2
5.1
32.4
4.1
Priced at 27 Jan 2015
Sources: Bloomberg; BNP Paribas estimates
15
BNP PARIBAS
28 JANUARY 2015
28 JANUARY 2015
INITIATION
15 HONG
KONG
/ FOOD BEVERAGE
& TOBACCO
CHINA
KWEICHOW MOUTAI
BUY
600519 CH
TARGET PRICE
RMB232.00
CLOSE
RMB182.80
UP/DOWNSIDE
CHANGE IN TP
+26.9%
RMB
%
HOW WE DIFFER FROM CONSENSUS
MARKET RECS
TARGET PRICE (%)
13.8
POSITIVE
24
EPS 2014 (%)
(4.3)
NEUTRAL
1
EPS 2015 (%)
(7.0)
NEGATIVE
0
KEY STOCK DATA
Investing in brand
n
n
n
n
We initiate at BUY with a TP of RMB232
We initiate coverage of Moutai with a BUY rating and TP of RMB232.
We like Moutai’s strong brand name, strong free cash flow and high
dividend payout (30-50%), although we expect top-line growth to be
slow given the weak market environment. At a relatively low 13.5x
2015E P/E, we think Moutai is an attractive investment.
Brand name is everything
In China’s baijiu (traditional Chinese spirits) market, the Moutai brand
is so strong that excess inventory actually appreciates in value. The
super-premium brand name has also helped Moutai maintain an over
90% gross margin and a nearly 50% net profit margin in the past
three years. These brand-driven high margins also ensure strong
cash flows (RMB8.3b in 2013) and earnings that are resilient to minor
movements in various costs.
2013A
2014E
2015E
2016E
Revenue
30,922
30,789
31,667
32,996
Rec. net profit
14,814
14,894
15,456
16,362
14.27
13.04
13.53
14.33
EPS growth (%)
12.3
(8.6)
3.8
5.9
Recurring P/E (x)
12.8
14.0
13.5
12.8
Dividend yield (%)
2.4
2.9
3.0
3.2
EV/EBITDA (x)
7.7
8.3
8.4
7.8
Recurring EPS (RMB)
Price/book (x)
Net debt/Equity (%)
ROE (%)
Jan-14
223.00
103.00
(RMB)
Share price performance
Absolute (%)
[email protected]
+852 2825 1109
Oct-14
Jan-15
Rel to MSCI China
0
(%)
1 Month
3 Month
12 Month
(2.5)
15.1
48.4
(11.6)
2.1
Next results
33.6
March 2015
Mkt cap (USD m)
33,371
3m avg daily turnover (USD m)
173.6
Free float (%)
3m historic vol. (%)
Charlie Y Chen
Jul-14
Kweichow Moutai
ADR ticker
Source: Bloomberg; BNP Paribas estimates
24.8
20
400
0
Dec-10 Jun-11 Dec-11 Jun-12 Dec-12 Jun-13 Dec-13 Jun-14 Dec-14
27.4
123.00
(RMB)
10x
5x
31.6
143.00
12m high/low (RMB)
100
38.6
40
Major shareholder
200
2.9
(46.2)
183.00
Relative to country (%)
20x
15x
3.4
(44.9)
60
DCF-based TP offers 27% upside potential
Our TP of RMB232 assumes 2% terminal growth and a 10.3%
WACC, and translates to 2015E P/E of 17.1x, a discount to global
peers’ trading at 19.2x to 25.9x. We believe the Shanghai-Hong Kong
Stock Trade Scheme will enable foreign investors to invest in Moutai
as its valuation is more attractive than global peers’.
300
4.0
(43.4)
203.00
163.00
25x
4.5
(57.1)
Apr-14
SOE reform and M&A offer more long-term upside potential
We expect Moutai’s new management incentive scheme (scheduled
for launch late 2017, and driven by China’s SOE reform) to increase
profitability and ROIC since its cash is currently underutilised. We
also expect Moutai to benefit from consolidation of China’s baijiu
market, either as a consolidator or an acquisition target.
P/E band
16
YE Dec (RMB m)
0
China Kweichow Moutai Distille (62%)
202.52/120.18
ADR closing price (USD)
Issued shares (m)
Sources: Bloomberg consensus; BNP Paribas estimates
30.7
1,142
Kweichow Moutai
600519 CH
Charlie Y Chen
Investment thesis
Catalyst
We believe Moutai’s share price is at an early stage of
recovery after its P/E de-rated to an all-time low of 8x in early
2014, mainly due to negative sentiment after the
government’s anti-graft campaign and subsequent volume
decline. As volumes start to stabilise and growth resumes
(albeit slowly) in 2015, we believe Moutai’s share price offers
good investment opportunity.
We believe volume growth will return to positive territory in
2015, which should improve investor sentiment and trigger
re-rating.
One of the common concerns about Moutai is inventory. But,
the company is able to store excess inventory for years or
decades and sell them as vintage products, which could bring
even higher returns. In a bull year, the entire excess inventory
could be depleted. Therefore, we are not concerned about
temporary volume growth stagnancy.
Any news related to SOE reform acceleration could also
trigger valuation re-rating.
Risks to our call
More severe negative government actions against Baijiu
consumption.
A significant change in drinking behaviour of the younger
generation, which may make Baijiu a much less favourable
drink.
Moutai’s strong brand name can also help it maintain high
margins (over 90% gross margin and nearly 50% net margin
in the past three years). Given limited production volume,
there is no need for Moutai to lower prices to push volumes,
making its margins defensive. We believe this will ensure
strong free cash flow and high dividend payout of 40% in
2015.
Long term, SOE reform and market consolidation should
benefit Moutai with the potential to increase profitability and
ROIC.
Company background
Key assumptions
Kweichow Moutai is a provincial SOE based in Renhuai,
Guizhou. The company produces traditional Chinese spirits
under Moutai and other brands. Moutai is probably the most
prestigious Chinese spirits brand in China with over 200 years
history. The company was listed in Shanghai Stock Exchange
in 2001. Their products are mainly sold in China.
Moutai volume growth
Moutai ASP growth
2013
2014E
2015E
(%)
(%)
(%)
12.2
-
1.2
7.7
(0.3)
1.7
GP margin
92.9
92.1
92.1
EBIT margin
68.7
67.8
67.7
Recurring net margin
47.9
48.4
48.8
Source: BNP Paribas estimates
Principal activities: 2014 revenue split on our estimate
Earnings sensitivity
------- Base ------- ------- Best ------- ------ Worse -----2014E
Mautai High degree (76.71%)
Moutai ASP growth (%)
Recurring EPS (RMB)
Mautai Low degree (13.56%)
EPS change (%)
2015E
2014E
2015E
2014E
2015E
(0.3)
1.7
4.7
6.7
(5.3)
(3.3)
13.04
13.53
14.32
16.21
11.77
10.99
0
0
9.8
19.8
(9.8)
(18.8)
Others (9.73%)
Key executives
Source: BNP Paribas estimates
Age
Joined
Title
Yuan Renguo
57
2010
Chairman
Liu Zili
58
2010
President
Tan Dinghua
59
2010
Vice President
Du Guangyi
58
2010
Vice President
Heyingzi
45
2011
Finance Controller
Moutai’s earnings are sensitive to prices.
We estimate every 5% change in prices would move 2014
earnings 10% and 2015 earnings 20%, all else being
equal.
http://www.moutaichina.com
17
BNP PARIBAS
28 JANUARY 2015
Kweichow Moutai
600519 CH
Charlie Y Chen
Increasing market share in a tough baijiu market
Beer and wine outperformed Baijiu in the last 25 years
The biggest concern investors seem to have for the baijiu (traditional Chinese spirits)
industry is the declining consumer appetite for baijiu, especially among the younger
generation who in general prefers drinks with a lower alcohol content (such as beer,
wine, mixed drinks). As a result, consumption of spirits with high alcohol content,
including the Chinese baijiu and western spirits, as a percentage of total alcoholic
beverage consumption, dropped from over 80% in 1990 to below 60% in 2010
(Exhibit 2). While the total consumption volume of baijiu continued to increase, beer
and wine outperformed in the alcoholic beverage market in China by volume.
EXHIBIT 1: Pure alcohol consumption trend
EXHIBIT 2: Volume breakdown
(%)
Per Capita GDP (LHS)
Per Capita Alcoholic Consumption, Pure Alcohol in Litres (RHS) %
(litres)
%
90
3,000
6.0
%
80
2,500
5.0
%
70
(USD)
2,000
4.0
%
60
%
50
1,500
3.0
%
40
1,000
2.0
%
30
500
1.0
%
20
0
0.0
%
10
1970
1972
1974
1976
1978
1980
1982
1984
1986
1988
1990
1992
1994
1996
1998
2000
2002
2004
2006
Beer
%
Spirits
60.0
74.3
82.5
8.0
5.6
32.3
7.9
20.3
9.9
0
1990
Source: World Health Organization
Wine
100
2000
2010
Sources: China Industry Information Net; Euromonitor; BNP Paribas
Nonetheless, Moutai’s volume sales increased 60% from 2009 to 2013, significantly
outperforming the entire alcohol beverage market and also the baijiu market in
China, driven by the increasing income of Chinese people, Moutai’s strong brand
name and the drink’s unique flavour. Although the company’s volume growth
declined slightly in 2013 due to the Chinese government’s anti-graft campaign, we
believe this is only temporary and that Moutai’s volumes should continue to
outperform the baijiu market on Chinese baijiu consumers’ upgrading trend. Similarly,
another high-end baijiu brand, Wuliangye, enjoyed 177% volume growth from 2009
to 2013, suggesting a strong upgrading trend.
EXHIBIT 3: Moutai volumes, 2009-2013
EXHIBIT 4: Wuliangye volumes, 2009-2013
(tonnes)
(tonnes)
180,000
30,000
25,716
25,178
25,000
153,091
151,087
2012
2013
133,301
140,000
21,231
20,000
160,000
120,000
17,545
100,000
14,985
15,000
80,000
60,000
10,000
54,414
61,180
40,000
5,000
20,000
0
2009
Source: Moutai
18
2010
2011
2012
2013
0
2009
2010
2011
Sources: Euromonitor; Wuliangye
BNP PARIBAS
28 JANUARY 2015
Kweichow Moutai
600519 CH
Charlie Y Chen
Moutai’s unique competitiveness holds its market share firmly
Chinese baijiu can generally be categorised into five flavours: Mou Flavor, Lu Flavor,
Fen Flavor, Rice Flavor and Other Flavor. Although Lu Flavor is currently the largest
category by value, Mou Flavor has been the fastest growing category in the past 20
years. Mou Flavor was previously a very small category (but the most prestigious
category) due to its complicated production process and high requirement on cellars.
Moutai is one of the very few baijiu brands that are in Mou Flavor. In the last decade
or so, with Chinese baijiu consumers becoming more sophisticated, Mou Flavor’s
market share has increased from around 5% to 15%.
EXHIBIT 5: Major Chinese baijiu flavors and original
Fen Flavor
Er Guo Tou
Fen Flavor
Fenjiu
Lu Flavor
Shuanggou Daqu
Lu Flavor
Yanghe Daqu
Lu Flavor
Wuliangye
Lu Flavor
Luzhou Laojiao
Mou Flavor
Kweichow Moutai
Rice Flavor
Jiujiang Shuangzheng
Rice Flavor
Guilin Sanhuajiu
Source: BNP Paribas
EXHIBIT 6: Flavours of the Chinese baijiu
Flavor
Character
Famous Baijiu Brands
Market share by value 2014E
(%)
Mou Flavor/Souce fragrance
Highly fragrant distilled liquor with bold character, named for its
similarity in flavour to Chinese fermented bean pastes and soy sauces
Moutai, Xijiu, Langjiu
~15
Lu Flavor/Thick fragrance
A class of distilled liquor that is sweet tasting, unctuous in texture, and
mellow, with a gentle lasting fragrance contributed by the high levels of
esters, primarily ethyl acetate.
Wuliangye, Luzhou Laojiao
~70
Fen Flavor/Light fragrance
Delicate, dry and light, with a delectable mellow and clean mouthfeel.
Fenjiu, Er Guo Tou
~10
Rice flavor/Rice fragrance
and others
The character of this class of liquor is exemplified by baijiu distilled from
rice. It has a clean mouthfeel and is slightly aromatic aroma, dominated
by ethyl lactate with lesser flavor contributions by ethyl acetate.
Sanhuajiu, Shuangzhengjiu
~5
Sources: Wikipedia; BNP Paribas estimates
19
BNP PARIBAS
28 JANUARY 2015
Kweichow Moutai
600519 CH
Charlie Y Chen
EXHIBIT 7: Market share trend by value
(%)
100
Lu Flavor
Mou Flavor
70
Other Flavors
Moutai
5.0
5.0
10.0
40.0
15.0
Wuliangye
Fenjiu
National Cellar 1573
70.0
Luzhou Laojiao, Yanghe, Langjiu
90
80
Fen Flavor
EXHIBIT 8: China’s baijiu industry hierarchy
60
50
5.0
40
30
20
50.0
10
Er Guo Tou, Jianzhuang
0
2000
2014
Source: BNP Paribas estimates derived from various companies reports, industry
reports, etc.
Source: BNP Paribas
The main reason for Mou Flavor’s market share gain is the fall of Fen Flavor. The
Fen Flavor category used to have very high market share, because the old
generation preferred high alcohol content drinks with less strong flavor. As people’s
health awareness has increased, the younger generation prefers low alcohol content
drinks. However, because of Fen Flavor’s relatively light taste, when the alcohol
content goes down, the product loses some of the alcohol taste, which has resulted
in loss of some consumers. Lu Flavor and Mou Flavor, on the other hand, do not face
this problem as they have a strong alcoholic taste despite the low alcoholic content,
resulting in market share gains for the two flavors in the past decade or so.
We believe Mou Flavor will continue to outperform the baijiu market, because of
consumers’ increasing appetite for quality (the production process for the Mou Flavor
Baijiu is 3-5 years and only 40-60 days for Lu Flavor Baijiu) and health awareness
(for low alcoholic content drinks). While there are a lot of competitors in Lu Flavor
(due to its relatively simpler process), there are very few competitors in Mou Flavor,
which enables Moutai to benefit more from the category’s growth. With a strong
brand and less competition in the Mou Flavor category, we believe Moutai has the
best growth prospects among all baijiu brands.
Investment highlights: vintage, dividends, SOE reform
With a stabilising baijiu market, we believe Moutai’s value should start to emerge for
three reasons: vintage sales, high dividends and SOE reform.
Invest in vintage: don’t worry about temporary volume stagnation
One of the reasons for the decline in Moutai’s share price since the peak of 2012 is
volume declines, triggered by the government’s anti-graft campaign, which hurts
short-term profitability. However, we are not overly worried about this as the strong
Moutai brand name has protected the value of its inventory. So, even if some of the
company’s products remain unsold in the current year, it can be sold at higher prices
in the future period and there is the potential for inventory value to appreciate, rather
than being written-off in some other industries.
Exhibit 9 shows price per bottle of the Moutai 53° at different vintage. Currently, a
regular Moutai 53° (which started cellaring in 2009) sells at around RMB1,000 per
bottle. Assuming the company does not sell this bottle now and keeps it in the cellar
for another five years, it could be sold for at least RMB3,399 per bottle (plus some
price increase every year, assuming no negative policy such as further anti-graft
campaign, which may force Moutai to keep prices flat). In this case, we calculate IRR
at roughly 30%. In reality, IRR could be slightly different due to the inclusion of
storage cost and price increase. Using this simple calculation, it seems that to store
one bottle of Moutai for future sales can generate higher returns than WACC (which
is usually around 10%).
20
BNP PARIBAS
28 JANUARY 2015
Kweichow Moutai
600519 CH
Charlie Y Chen
EXHIBIT 9: Price of Moutai at different vintage
EXHIBIT 10: IRR for saving regular Moutai for vintage sales
(RMB)
(%)
6,000
5,399
40
4,899
5,000
4,000
3,399
3,999
3,699
4,399
35.8
35
29.9
30
3,000
26.0
23.6
25
2,000
22.0
20.6
20
1000
1,000
15
2000(14-year)
2001(13-year)
2002(12-year)
2003(11-year)
2004(10-year)
2005(9-year)
2009(5-year)
0
Source: www.emoutai.cn, as of 20 Jan. 2015
10
5
0
9-year
10-year
11-year
12-year
13-year
14-year
Source: BNP Paribas
Note that the IRR calculation shown in Exhibit 10 assumes Moutai will invest
RMB1,000 now to save a bottle of 2009 Moutai 53˚ which was cellared in 2009 and
has been cellared for five years. If Moutai sells this product in 2018 as a nine-year
product, the price would be at least RMB3,399 (the retail price of a nine-year product
currently). So, a cash outflow of RMB1,000 now and a cash inflow of RMB3,399 four
years later gives an IRR of 35.8%.
In our opinion, Moutai can be compared with the Remy Martin brand in cognac, or
the wine from the Big Five vineyards in France, to some degree. There is always an
appetite for the Louis XIII products or a 1984 Chateau Latour, although this demand
may vary from year to year. In a year like 2007 or 2012 when the demand for luxury
baijiu had surged, we believe the demand can digest several years of channel
inventory. While 2013-2014 were challenging years and the outlook for 2015 remains
lacklustre, we advise investors to be patient as it would need only one bull year to
realise all the gains from selling vintage products.
Dividend: healthy cash flow and low capex requirement supports high yield
With less than 30 tonnes of volume sales per year, Moutai’s current capacity of 40
tonnes is sufficient to meet demand in the near term, and management sees no large
capex needs over the next few years. Due to its strong brand name and high
margins (over 90% gross margins and nearly 50% net margins in the past three
years), Moutai generates over RMB8.3b free cash flow in 2013, according to our
forecast. With over RMB30b net cash in hand currently and strong cash flow,
Moutai’s dividend payouts have been generous, at 30-50%. The payout ratio dipped
in 2013 as a precautionary measure by management given the market downturn. We
believe once the market stabilises, it is very likely that Moutai will resume paying
higher dividends.
EXHIBIT 11: Free cash flow
(RMB b)
EXHIBIT 12: Dividend payouts
Operating Cashflow
Capex
Free Cash Flow
(%)
20,000
60
15,000
50
50.5
47.3
42.8
10,000
40
5,000
30
0
20
(5,000)
10
40.4
40.4
40.4
31.4
0
(10,000)
2009
2010
2011
Sources: Moutai; BNP Paribas estimates
21
25.8
2012
2013
2009
2014 2015E 2016E
2010
2011
2012
2013
2014E 2015E 2016E
Sources: Moutai; BNP Paribas estimates
BNP PARIBAS
28 JANUARY 2015
Kweichow Moutai
Charlie Y Chen
600519 CH
SOE reform: a bonus taking time to realise
Moutai is a provincial SOE, partly owned by the Guizhou provincial government.
Guizhou is one of the most underdeveloped provinces in China, and we believe the
SOE reform, if implemented in Moutai, could significantly improve the company’s
scale, profitability and share price. We believe the two main areas to focus on in
terms of SOE reform are M&A and management incentives.
M&A angle: the baijiu market remains fragmented
In our opinion, the Chinese baijiu market is similar to the spirits markets of Europe
and the US, where consumers are loyal to their favourite brands, but at the same
time, consumers switch to different brands/products at different occasions, especially
for the high-end products. For example, Bacardi (including different products) had
only 4.6% volume market share in the spirits market in the US in 2013. China is
similar, with the largest spirit brand, Red Star Er Guo Tou, having only 3.7% volume
market share.
EXHIBIT 13: Top 10 spirits brands in the US by volume,
2013
Bacardi
4.6%
Smirnoff
3.4%
EXHIBIT 14: Top 10 spirits companies in the US by volume,
2013
Jack
Daniel's
2.5%
Others
27.7%
Captain
Morgan
2.4%
Crown Royal
2.3%
Absolut
Vodka
2.3%
Others
75.6%
Jim Beam
1.7%
Grey Goose
1.6%
Diageo North
America
19.2%
Svedka
2.0%
E & J Gallo
1.6%
Source: Euromonitor
Campari
America
2.3%
Beam Global
10.6%
Proximo
Spirits
2.7%
Bacardi USA
8.4%
Constellation
Brands
3.9%
Heaven Hill
4.3%
BrownForman Corp
5.6%
Pernod
Ricard USA
7.1%
Sazerac
8.2%
Source: Euromonitor
Exhibits 13 and 14 show that each spirits brand has only a small share of the US
market. But, it worth highlighting that all large companies use a multi-brand strategy
to fulfil consumer demand, making its sales relatively more defensive to consumers’
changing taste in certain years. Diageo, for instance, has nearly 20% market share
by volume in the US. But most of the Chinese liquor companies still use a “single
brand” strategy due to historical reasons (most of the Chinese spirits companies are
local SOEs and it could be a complicated process to merge and restructure across
regions).
EXHIBIT 15: Top 10 spirits brands in China by volume, 2013
Niulanshan
Er Guo Tou
3.3%
Red Star Er
Guo Tou
3.7%
EXHIBIT 16: Top 10 spirits companies in China by volume,
2013
Luzhou
Yanghe
Laojiao Jing Jiu
Daqu
2.1%
Daqu
1.6%
2.4%
Zhijiang
Daqu
1.3%
Jiannanchun
1.1%
Niulanshan Yanghe
Distillery
Distillery
3.9%
3.9%
Jiujiang
% Shuangzheng
0.9%
%Wuliangchun
0.8%
Others
82.0%
Source: Euromonitor
22
Others
74.6%
Jingzhi
Baigan
0.8%
Guangdong
Jiujiang
Distillery
0.9%
Luzhou
Laojiao Co
3.8%
Beijing Red
Star Co
Wuliangye3.7%
Distillery
2.7%
Jing Brand
Co
Hubei
2.1%
Zhijiang
Distillery
1.6%
Anhui
Sichuan
Golden
Jian Nan Seed Winery
Chun
Co
1.3%
1.5%
Source: Euromonitor
BNP PARIBAS
28 JANUARY 2015
Kweichow Moutai
600519 CH
Charlie Y Chen
Exhibits 13 through 16 show similarity and differences between the US and China
spirits markets. While the similarity is that each spirits brand has a very small market
share, the difference is that US spirit companies are much stronger than the Chinese
baijiu companies in terms of volume market share. So far, the top 10 baijiu
companies account for a mere 25% of the market share, which is smaller than the
combined market share of Diageo and Beam in the US.
EXHIBIT 17: Diageo's product portfolio (fiscal year ending June 2013)
Others
RTDs
Scotch
Wine
Beer
Whiskey
Liqueurs
Tequila
Rum
Gin
Vodka
Source: Diageo
Exhibit 17 shows Diageo’s brand/product portfolio. Even in one category such as
scotch or whiskey, Diageo has different products, which allows consumers to switch
tastes for different occasions. On the contrary, Moutai has effectively only one brand,
which mainly has two products: 53 degree (106 proof) and 39 degree (78 proof).
This comparison suggests that China’s baijiu industry is yet to consolidate (and the
timing seems very close). The main obstacle for consolidation, in our opinion, is local
protectionism. Once the SOE reform starts, we believe leading companies, such as
Moutai, will be encouraged by the government to become consolidators and acquire
good brands. It would be no surprise to us if some Chinese conglomerates similar to
Diageo and Pernod Ricard emerge in the Chinese spirits market a few years later.
Management incentive scheme still pending
For many SOEs, management incentive scheme remains a bottleneck to attract
more high-calibre people. The compensation package for Moutai’s management
team remains relatively low (see Exhibit 18). The CEO’s compensation in 2013 was
only 0.008% of Moutai’s net profit. In absolute terms, the CEO was paid RMB1.27m,
also the lowest of the seven companies listed in the exhibit.
23
BNP PARIBAS
28 JANUARY 2015
Kweichow Moutai
600519 CH
Charlie Y Chen
EXHIBIT 18: CEO's compensation as percentage of net profit, 2013
(%)
3.0
2.502
2.5
2.0
1.5
1.0
0.5
0.008
0.064
0.094
Moutai
Hengan
Tsingtao
0.567
0.635
Mengniu
Tingyi
0.243
0.0
CRE
Want Want
Source: Hong Kong Stock Exchange Filings
On 30 July 2014, Moutai received a notice from its parent company, Moutai Group,
that Moutai Group will push forward the management incentive scheme based on the
relevant policy and regulation. The management incentive plan should be proposed
by December 2017.
In our opinion, the management incentive plan should significantly increase
compensation levels, which will be related to Moutai’s profitability and share price
performance.
24
BNP PARIBAS
28 JANUARY 2015
Kweichow Moutai
600519 CH
Charlie Y Chen
Financial analysis
Industry stabilisation to slow revenue recovery
We expect the baijiu industry to stabilise and to start recovering slowly in 2015. We
expect Moutai’s volume to remain flattish in 2015. As a leading SOE in Guizhou
province, we believe the 3% decline in net profit in 3Q14 should be the trough as
usually such large SOEs have some social responsibility to maintain growth and
support the local economy. In the first three quarters of 2014, Moutai’s account and
note receivables increased sharply, especially in 3Q14. This suggests that Moutai
may have started to facilitate its distributors by financing them to buy more Moutai
products. We view this as a sign of deterioration in revenue quality and show the
company’s efforts to smooth out revenue fluctuations during bad times. This situation
may cause some channel inventory issue and slow the pace of recovery. However,
even at the high level, notes receivable days only increased to 3.5 days in 2013,
from 2.8 days at end-2012, which is still manageable.
EXHIBIT 19: Revenue growth trend, y-y
EXHIBIT 20: Receivables trend
Revenue (LHS)
Revenue growth (RHS)
(RMB m)
35,000
30,000
25,000
(%)
Invntory days (LHS)
70
Accounts receivable days (RHS)
(days)
60
2500
50
2000
(days)
Accounts payable days (RHS)
8
7
6
40
20,000
30
5
1500
4
15,000
20
10,000
10
5,000
1000
3
2
500
1
0
0
(10)
0
Sources: Moutai; BNP Paribas estimates
0
2009
2009 2010 2011 2012 2013 2014E 2015E 2016E
2010
2011
2012
2013
1Q14 2Q14 3Q14
Sources: Moutai; BNP Paribas
Another set of data, however, suggests that distributors may already be near the end
of de-stocking. One item on Moutai’s balance sheet (on the liability side) is “Advance
Payment”, which is the advance deposit distributors pay to Moutai, to secure the
volume the distributor will be allocated. If a distributor does not make the “Advance
Payment”, it may risk not receiving as many products as it wants. Obviously, during a
de-stocking period, Moutai’s “Advance Payment” days should on a downtrend, while
in a re-stocking period, on an uptrend.
EXHIBIT 21: Moutai’s “advance payment” by value
EXHIBIT 22: Moutai’s “advance payment” by days
(days)
(RMB m)
160
8,000
7,027
140
7,000
139
133
120
6,000
5,091
4,739
5,000
4,000
149
100
80
3,516
70
3,045
60
3,000
1,621
2,000
544
1,000
36
40
863
20
20
7
10
1H14
3Q14
0
0
2009
Source: Company data
2010
2011
2012
2013
1Q14
1H14
2009
3Q14
2010
2011
2012
2013
1Q14
Source: Company data
Therefore, we are turning cautiously optimistic on Moutai’s volume trend because the
distributors seem to have started to re-stock. We forecast Moutai’s core business
25
BNP PARIBAS
28 JANUARY 2015
Kweichow Moutai
600519 CH
Charlie Y Chen
revenue (excluding interest income from its financing company) to decline around
1% in 2014 and grow 3% in 2015 and 4% in 2016. We expect net margins to remain
relatively stable, and forecast net profit growth of 4% in 2105 and 5% in 2016.
Conservative assumptions on expenses and dividend – potential upside exists
In the first three quarters of 2014, Moutai’s SG&A expenses as percentage of
revenue increased to 4.4%, from 5.3% a year ago. The increase was mainly due to
increased employee costs and office expenses, offsetting some savings in marketing
expenses. We believe 2014 should be a peak year for operating expense ratios, and
these ratios should remain stable or decline slightly. But, given Moutai’s over 90%
gross margin, some small changes in operating expenses will have limited impact on
earnings.
Moutai’s dividend payout ratio dropped to 31% in 2013, as management prefers to
be prudent and keep more cash in hand for the difficult years. We assume the payout
ratio will increase to 40% pa in 2015 and 2016, which meets the minimum dividend
payout requirement stated in Moutai’s annual report. If Moutai raises the payout ratio
to historical levels, we see upside potential to its share price.
SOE reform could improve efficiency and shareholders’ return
Despite its high gross margins (over 90%), high ROE and high dividend payout, we
believe there is room for further improvement if management is properly incentivised.
For instance, the RMB5.4b capex in 2013 seems very high for a company that needs
no immediate capacity boost. Some of the capex has been invested in a hotel within
the distiller’s site to accommodate business visitors, which some investors may have
preferred to be used in other areas. Another example is that Moutai set up a fully
owned financing subsidiary in mid-2013 to provide financial assistance to its sister
companies, suppliers and distributors. This business unit generated interest income
of RMB150m in 2013, and we estimate will generate interest income of RMB700m in
2014. Some investors may prefer to see the company spend the extra cash in
marketing, channel development, new product innovation or even M&A, which could
generate long-term returns, rather than the money being invested in a quasi-banking
business for low, short-term return.
We believe this situation could change as early as in 2016. From Moutai’s latest
quarterly report (3Q14), Moutai has maintained the statement as below:
Implementation of pledges made by the company or shareholders with over 5% stake:
Pledge of stock option incentive scheme: the company pledges to grant share option incentives
to the management team and core technology team according to relevant government policy
and regulations, after the shareholding strucuture reform completes.
Time and deadline of the pledge: Stock option incentive plan to the management team and core
technology team shall be made by the end of December, 2017.
-
26
2014 Third quarter financial report, Kweichow Moutai
BNP PARIBAS
28 JANUARY 2015
Kweichow Moutai
600519 CH
Charlie Y Chen
Initiate at BUY with a TP of RMB232
We believe Moutai is trading at trough valuations, due to negative sentiment after the
Chinese government’s anti-graft campaign. As the owner of the most famous luxury
baijiu brand, we believe Moutai can sustain high margins for its core products, can
generate strong free cash flow and can keep dividend payouts generous. We also
expect Moutai to benefit from SOE reform, which should enable it to enhance
profitability and return. Long term, we believe the Chinese alcoholic beverage market
will consolidate. As a potential consolidator, Moutai should be able to achieve much
larger scale and realise synergies in distribution. If Moutai becomes an acquisition
target, it offers unique value in the brand and products. Being either a consolidator or
an acquisition target, we believe Moutai should benefit from the industry’s
consolidation.
Moutai is trading at a steep P/E discount to its global peers. We believe the valuation
gap should narrow and finally converge as the company’s sales and profit
momentum resumes. However, we believe this will not happen overnight, hence we
choose not to use peer group P/E multiple valuation to derive Moutai’s target price.
Instead, we use a DCF model with 2% terminal growth and 10.3% WACC to derive
our target price of RMB232. This implies 17.1x 2015E P/E. We recognise that Moutai
and the entire Chinese baijiu industry face some policy risk, thus justifying a
valuation discount to global peers in the near term.
EXHIBIT 23: Peer valuation comparison
BBG code
Price
Mkt cap
Div. yield
ROE
(LC)
(USD m)
2014
2015
2015
2014
2015
2015
2015
Moutai
182.8
33,373
14.0
13.5
3.4
8.3
8.4
3.0
27.4
000858 CH
Wuliangye
22.69
13,769
13.6
12.6
1.9
6.3
5.5
2.5
15.4
000568 CH
Luzhou Laojiao
19.53
4,378
14.1
12.5
2.2
7.5
6.5
4.1
18.1
200869 CH
Yantai Changyu
26.13
3,308
15.0
14.2
1.9
n.a.
n.a.
2.0
13.6
600809 CH
Shanxi Xinghuacun
22.1
3,059
26.2
29.9
3.9
21.0
18.7
1.1
13.1
600519 CH
Company
-------------- P/E --------------
P/BV
--------- EV/EBITDA ---------
600059 CH
Zhejiang Guyuelongshan
9.03
1,167
50.7
43.0
1.9
n.a.
n.a.
0.8
3.9
200596 CH
Anhui Gujinggong
23.51
2,388
14.8
13.0
2.0
14.0
11.9
1.8
15.5
600199 CH
Anhui Golden Seeds
11.01
978
54.2
39.3
2.6
n.a.
n.a.
0.9
5.5
600197 CH
Xinjiang Yili
12.14
856
14.1
14.4
2.9
n.a.
n.a.
1.9
13.2
002304 CH
Jiangsu Yanghe
78.78
13,557
17.8
16.1
3.6
11.2
9.9
2.5
22.6
DGE LN
Diageo Plc
1978.5
74,641
20.7
19.3
5.7
16.5
15.5
3.0
29.4
RI FP
Pernod Ricard SA
108.05
32,235
21.8
19.9
2.2
15.2
14.1
1.8
11.2
BF/B US
Brown-Forman -B
92.92
19,635
28.6
25.9
7.6
18.8
17.1
1.4
31.3
110.61
21,390
25.5
22.8
3.2
16.0
14.4
0.2
14.7
STZ US
Constellation-A
Prices as at 26 Jan 2015
Sources: BNP Paribas estimates for Moutai, all others are Bloomberg consensus estimates
27
BNP PARIBAS
28 JANUARY 2015
Kweichow Moutai
600519 CH
Charlie Y Chen
Financial statements
Kweichow Moutai
Profit and Loss (RMB m) Year Ending Dec
2012A
2013A
2014E
2015E
2016E
Revenue
26,455
30,922
30,789
31,667
32,996
Cost of sales ex depreciation
(1,629)
(1,673)
(1,921)
(1,967)
(2,054)
Gross profit ex depreciation
24,826
29,248
28,868
29,700
30,942
0
0
0
0
0
Operating costs
(5,985)
(7,452)
(7,451)
(7,695)
(7,886)
Operating EBITDA
18,841
21,796
21,417
22,005
23,056
(415)
(520)
(523)
(538)
(561)
(16)
(32)
(31)
(32)
(33)
18,410
21,244
20,863
21,435
22,462
1,371
Other operating income
Depreciation
Goodwill amortisation
Operating EBIT
421
542
781
1,057
Associates
Net financing costs
3
3
3
3
3
Recurring non operating income
0
0
0
0
0
Non recurring items
(133)
(357)
(176)
(195)
(215)
Profit before tax
18,700
21,432
21,471
22,300
23,621
Tax
(4,692)
(5,467)
(5,475)
(5,686)
(6,023)
Profit after tax
14,008
15,965
15,996
16,613
17,597
(700)
(828)
(960)
(997)
(1,056)
Preferred dividends
0
0
0
0
0
Other items
0
0
0
0
0
13,308
15,137
15,036
15,616
16,541
Minority interests
Reported net profit
Non recurring items & goodwill (net)
Recurring net profit
(114)
(323)
(142)
(160)
(179)
13,194
14,814
14,894
15,456
16,362
Per share (RMB)
Recurring EPS *
12.71
14.27
13.04
13.53
14.33
Reported EPS
12.82
14.58
13.17
13.67
14.48
6.42
4.47
5.27
5.47
5.79
Revenue (%)
43.8
16.9
(0.4)
2.9
4.2
Operating EBITDA (%)
52.9
15.7
(1.7)
2.7
4.8
Operating EBIT (%)
53.7
15.4
(1.8)
2.7
4.8
Recurring EPS (%)
50.3
12.3
(8.6)
3.8
5.9
Reported EPS (%)
51.9
13.7
(9.7)
3.9
5.9
Gross margin inc depreciation (%)
92.3
92.9
92.1
92.1
92.1
Operating EBITDA margin (%)
71.2
70.5
69.6
69.5
69.9
Operating EBIT margin (%)
69.6
68.7
67.8
67.7
68.1
Net margin (%)
49.9
47.9
48.4
48.8
49.6
Effective tax rate (%)
25.1
25.5
25.5
25.5
25.5
Dividend payout on recurring profit (%)
50.5
31.4
40.4
40.4
40.4
-
-
-
-
-
1,887.6
2,345.0
2,524.4
2,831.2
2,867.0
DPS
Growth
Operating performance
Interest cover (x)
Inventory days
Debtor days
3.3
3.1
3.8
4.0
4.0
Creditor days
58.0
68.7
56.1
56.3
56.2
Operating ROIC (%)
156.7
120.7
77.2
56.2
50.2
ROIC (%)
134.2
97.9
63.2
48.7
44.3
ROE (%)
44.6
38.6
31.6
27.4
24.8
ROA (%)
34.0
30.3
26.1
23.4
21.0
*Pre exceptional, pre-goodwill and fully diluted
Revenue By Division (RMB m)
2012A
2013A
2014E
2015E
2016E
Mautai High degree
1,701
1,987
1,987
2,027
2,068
Mautai Low degree
480
370
351
351
358
Others
250
260
252
252
257
Sources: Kweichow Moutai; BNP Paribas estimates
28
BNP PARIBAS
28 JANUARY 2015
Kweichow Moutai
600519 CH
Charlie Y Chen
Financial statements
Kweichow Moutai
Cash Flow (RMB m) Year Ending Dec
2012A
2013A
2014E
2015E
2016E
Recurring net profit
13,194
14,814
14,894
15,456
16,362
Depreciation
415
520
523
538
561
Associates & minorities
697
825
957
994
1,053
Other non-cash items
431
552
554
570
594
Recurring cash flow
14,737
16,712
16,928
17,558
18,570
Change in working capital
(1,818)
(3,034)
(4,925)
(723)
(698)
0
0
0
0
0
(4,212)
(5,406)
(4,618)
(4,750)
(4,949)
8,707
8,272
7,385
12,085
12,923
0
0
0
0
0
(4,307)
(7,392)
(6,014)
(6,247)
(6,617)
Capex - maintenance
Capex - new investment
Free cash flow to equity
Net acquisitions & disposals
Dividends paid
Non recurring cash flows
Net cash flow
Equity finance
Debt finance
Movement in cash
12
66
82
0
0
4,413
947
1,453
5,839
6,307
1,056
0
0
960
997
392
6
(2,773)
0
0
4,805
953
(360)
6,835
7,362
14.20
16.10
14.82
15.38
16.26
8.39
7.97
6.47
10.58
11.32
Per share (RMB)
Recurring cash flow per share
FCF to equity per share
Balance Sheet (RMB m) Year Ending Dec
2012A
2013A
2014E
2015E
2016E
Working capital assets
14,163
16,747
20,400
21,595
22,880
Working capital liabilities
(9,526)
(11,307)
(7,263)
(7,735)
(8,323)
Net working capital
4,637
5,439
13,137
13,860
14,558
Tangible fixed assets
7,203
8,981
13,018
17,230
21,618
11,839
14,421
26,155
31,090
36,176
0
0
0
0
0
863
3,563
3,533
3,501
3,468
Operating invested capital
Goodwill
Other intangible assets
Investments
54
54
54
54
54
Other assets
654
924
900
900
900
Invested capital
13,410
18,962
30,642
35,545
40,598
(22,062)
(25,185)
(23,487)
(28,950)
(34,878)
Short term debt
0
0
0
0
0
Long term debt *
0
0
0
0
0
(22,062)
(25,185)
(23,487)
(28,950)
(34,878)
Cash & equivalents
Net debt
Deferred tax
Other liabilities
Total equity
0
0
0
0
0
18
18
18
18
18
70,939
34,150
42,622
51,644
61,014
Minority interests
1,304
1,507
2,467
3,463
4,519
Invested capital
13,410
18,962
30,642
35,545
40,598
* includes convertibles and preferred stock which is being treated as debt
Per share (RMB)
Book value per share
32.89
41.05
45.22
53.43
62.12
Tangible book value per share
32.06
37.62
42.13
50.36
59.08
Net debt/equity (%)
(62.2)
(57.1)
(43.4)
(44.9)
(46.2)
Net debt/total assets (%)
(49.0)
(45.4)
(38.3)
(40.1)
(41.6)
3.8
3.7
6.0
6.5
6.9
-
-
-
-
-
2012A
2013A
2014E
2015E
2016E
12.8
Financial strength
Current ratio (x)
CF interest cover (x)
Valuation
Recurring P/E (x) *
14.4
12.8
14.0
13.5
Recurring P/E @ target price (x) *
18.3
16.3
17.8
17.1
16.2
Reported P/E (x)
14.3
12.5
13.9
13.4
12.6
Dividend yield (%)
3.5
2.4
2.9
3.0
3.2
P/CF (x)
12.9
11.4
12.3
11.9
11.2
P/FCF (x)
21.8
22.9
28.3
17.3
16.2
Price/book (x)
5.6
4.5
4.0
3.4
2.9
Price/tangible book (x)
5.7
4.9
4.3
3.6
3.1
EV/EBITDA (x) **
9.0
7.7
8.3
8.4
7.8
11.8
10.0
10.8
11.0
10.3
12.6
8.8
6.1
5.2
4.4
EV/EBITDA @ target price (x) **
EV/invested capital (x)
* Pre exceptional, pre-goodwill and fully diluted
** EBITDA includes associate income and recurring non-operating income
Sources: Kweichow Moutai; BNP Paribas estimates
29
BNP PARIBAS
28 JANUARY 2015
28 JANUARY 2015
NEW
KONG
CHINAINFORMATION
/ FOOD BEVERAGE &5THONG
OBACCO
TINGYI
322 HK
REDUCE
TARGET PRICE
HKD16.10
CLOSE
HKD17.98
UP/DOWNSIDE
UNCHANGED
PRIOR TP
HOW WE DIFFER FROM CONSENSUS
MARKET RECS
TARGET PRICE (%)
(22)
POSITIVE
17
EPS 2014 (%)
(1)
NEUTRAL
13
EPS 2015 (%)
(20)
NEGATIVE
5
-10.5%
HKD15.80
CHANGE IN TP
+1.9
KEY STOCK DATA
2015: exit when margin rebounds
n
n
n
n
Reiterate REDUCE rating for 2015
We believe Tingyi still faces structural problems in fundamentals:
existing products are losing attraction due to competition, new
product R&D is not fast enough to cope with consumer demand, and
the core business lacks growth drivers due to high penetration. We
forecast 1.8% EPS growth on revenue decline of ~4% in 2014.
YE Dec (USD m)
2013A
2014E
2015E
2016E
Revenue
10,941
10,548
10,789
11,111
Rec. net profit
413
421
465
494
Recurring EPS (USD)
0.07
0.07
0.08
0.09
Prior rec. EPS (USD)
0.07
0.07
0.08
0.09
Chg. In EPS est. (%)
0.0
(0.1)
1.9
(3.9)
EPS growth (%)
10.4
1.8
10.6
6.1
2015 margins to expand on low commodity prices
With oil price falling below USD50 per barrel (from nearly USD100
just a year ago), Tingyi’s beverage business unit will be a major
beneficiary as we estimate PET bottle (which is made from oil
products) represents nearly 30% of its total COGS. We estimate
gross margin will improve 1.4ppt in 2015, driving EPS growth of 11%.
Recurring P/E (x)
31.5
31.0
28.0
26.4
De-rating to continue without successful new product launches
Tingyi’s P/E multiple has been on a downtrend since 2011 on slowing
growth, and we believe the trend would continue if there are no new
growth drivers in the form of successful product launches. Tingyi’s
40% P/E premium to global peers average of 20x (on 2015 BBG
estimates) suggests further downside potential to the multiple.
Jan-14
26.00
Raise P/E-based TP to HKD16.10 on earnings revision
We raise our 2015E EPS 2% to reflect favourable raw material cost
impact. This lifts our TP to HKD16.10 (from HKD15.80), based on an
unchanged FY15E target P/E of 25x. Our new TP implies ~11%
downside potential. The main risk is steeper-than-expected decline in
commodity price, causing net profit to surprise on the upside.
Dividend yield (%)
EV/EBITDA (x)
1.6
1.6
1.8
1.9
12.5
12.2
10.9
10.1
Price/book (x)
4.5
4.2
3.9
3.6
Net debt/Equity (%)
11.3
29.8
24.5
21.1
ROE (%)
15.2
14.1
14.4
14.2
Apr-14
Jul-14
Oct-14
Jan-15
24.00
(3)
22.00
(13)
20.00
18.00
(23)
16.00
14.00
(HKD)
Tingyi
Share price performance
Absolute (%)
Relative to country (%)
Rel to MSCI China
1 Month
3 Month
12 Month
3.8
(5.2)
(17.1)
(3.5)
(16.6)
(31.3)
Next results
March 2015
Mkt cap (USD m)
12,986
3m avg daily turnover (USD m)
P/E band
(HKD)
40
35
30
25
20
15
10
5
0
Jan-09
Major shareholder
60x
34
Ting Hsin (33%)
12m high/low (HKD)
50x
3m historic vol. (%)
40x
30x
ADR ticker
20x
ADR closing price (USD)
Issued shares (m)
Sources: Bloomberg consensus; BNP Paribas estimates
Oct-09
Jul-10
Apr-11
Sources: Bloomberg; BNP Paribas estimates
Charlie Y Chen
[email protected]
+852 2825 1109
30
16.6
Free float (%)
70x
Jan-12
Oct-12
Jul-13
Apr-14
(33)
(%)
23.20/16.24
25.7
5,599
Tingyi
322 HK
Charlie Y Chen
Investment thesis
Catalyst
We believe Tingyi's revenue growth will recover slowly to low
single digits in 2015 after a decline in 2014. Long- term
revenue growth prospects remain bearish, due to slow
industry growth and Tingyi’s high market share. Without
successful new product launches and meaningful
acquisitions, we believe Tingyi valuation multiples will de-rate
from current high levels.
The 2014 result, due in March 2015, is the next possible
catalyst. It will be then that investors can see if the gutter oil
scandal has had a negative impact and if there has been
any further restructuring cost.
We believe Tingyi could suffer some losses from restructuring
in the near term (eg, from redundancy payments), and the
gutter oil scandal at sister company, Weichuan (1201 TT, NR)
may also damage Tingyi’s reputation and remain an
overhang on the share price until the case is over. Hence, we
reiterate our REDUCE rating on Tingyi.
Company background
Risks to our call
Lower/higher-than-expected raw material prices (eg PET
and sugar) would benefit/hurt Tingyi's margins and are an
upside/downside risk to our EPS forecasts.
Successful new product launches could improve Tingyi’s
margins significantly, which is an upside risk to our view.
If the overall stock market in Hong Kong improves, fund
flows to more cyclical stocks may cause Tingyi to
underperform and is a downside risk to our view.
Key assumptions
Tingyi is a leading manufacturer of instant noodles, beverages,
and baked goods in China. Headquartered in Tianjin, Tingyi
started its business in 1992. It is best known for its Master
Kong brand. The company has established an extensive
distribution network in PRC.
2014E
2015E
2016E
(%)
(%)
(%)
Revenue growth
(3.6)
2.3
3.0
Gross margin
30.7
32.1
32.5
4.0
4.3
4.4
------ Base ------
------ Best ------
Net margin
Source: BNP Paribas estimates
Principal activities
Earnings sensitivity
----- Worst -----
2014E 2015E 2014E 2015E 2014E 2015E
Instant noodles (41.32%)
Beverages (55.72%)
Revenue growth (%)
(3.6)
2.3
1.4
7.3
(8.6)
Recurring EPS (USD)
0.075
0.083
0.083
0.100
0.068
0.066
-
-
10.6
20.4
(9.9)
(21.5)
EPS change (%)
(2.7)
Bakery (1.71%)
Others (1.25%)
Key executives
Source: BNP Paribas estimates
Age
Joined
Title
Wei Ing-Chou
59
1991
Chairman/CEO
RyoRyo Yoshizawa
71
2002
Vice Chief Executive Officer
Wu Chung-Yi
57
1996
Executive Director
Wei Ying-Chao
58
1991
Executive Director
Junichiro Ida
51
2002
Vice-Chairman
We believe long-term revenue growth has slowed to low
single digits.
Every 5% change in 2014E revenue growth would change
Tingyi’s EPS by 10%, all else being equal.
Every 5% change in 2015E revenue growth would change
EPS by 21.5%, all else being equal.
http://www.tingyi.com
31
BNP PARIBAS
28 JANUARY 2015
Tingyi
322 HK
Charlie Y Chen
Financial statements
Tingyi
Profit and Loss (USD m) Year Ending Dec
2012A
2013A
2014E
2015E
2016E
9,212
10,941
10,548
10,789
11,111
(6,077)
(7,187)
(6,819)
(6,810)
(6,973)
3,135
3,754
3,729
3,980
4,138
114
171
158
162
167
(2,238)
(2,781)
(2,685)
(2,754)
(2,825)
Operating EBITDA
1,012
1,144
1,203
1,387
1,479
Depreciation
(381)
(444)
(493)
(513)
(528)
0
0
0
0
0
631
699
709
875
951
Revenue
Cost of sales ex depreciation
Gross profit ex depreciation
Other operating income
Operating costs
Goodwill amortisation
Operating EBIT
16
14
21
(18)
(17)
Associates
Net financing costs
4
16
18
21
25
Recurring non operating income
0
0
0
0
0
Non recurring items
182
(7)
0
0
0
Profit before tax
833
723
748
878
959
(228)
(229)
(232)
(272)
(297)
605
494
516
606
662
(146)
(86)
(95)
(141)
(168)
Preferred dividends
0
0
0
0
0
Other items
0
0
0
0
0
Reported net profit
459
409
421
465
494
Non recurring items & goodwill (net)
(85)
5
0
0
0
Recurring net profit
374
413
421
465
494
Recurring EPS *
0.07
0.07
0.07
0.08
0.09
Reported EPS
0.08
0.07
0.08
0.08
0.09
DPS
0.03
0.04
0.04
0.04
0.04
Revenue (%)
17.1
18.8
(3.6)
2.3
3.0
Operating EBITDA (%)
12.9
13.0
5.2
15.3
6.6
Operating EBIT (%)
9.0
10.9
1.4
23.3
8.8
Recurring EPS (%)
(1.0)
10.4
1.8
10.6
6.1
Reported EPS (%)
9.3
(11.0)
2.9
10.6
6.1
Gross margin inc depreciation (%)
29.9
30.3
30.7
32.1
32.5
Operating EBITDA margin (%)
11.0
10.5
11.4
12.9
13.3
Operating EBIT margin (%)
6.8
6.4
6.7
8.1
8.6
Net margin (%)
4.1
3.8
4.0
4.3
4.4
Effective tax rate (%)
27.3
31.6
31.0
31.0
31.0
Dividend payout on recurring profit (%)
48.3
49.6
50.1
50.2
50.2
-
-
-
50.1
56.2
23.7
24.4
24.7
23.6
23.4
Tax
Profit after tax
Minority interests
Per share (USD)
Growth
Operating performance
Interest cover (x)
Inventory days
Debtor days
7.7
8.2
8.5
7.9
7.9
Creditor days
60.6
58.3
65.7
64.5
63.8
Operating ROIC (%)
13.1
12.1
10.7
11.6
12.2
ROIC (%)
11.8
11.0
9.8
10.7
11.3
ROE (%)
16.1
15.2
14.1
14.4
14.2
ROA (%)
7.7
6.2
5.8
6.9
7.2
*Pre exceptional, pre-goodwill and fully diluted
Revenue By Division (USD m)
2012A
2013A
2014E
2015E
2016E
Instant noodles
3,960
4,332
4,359
4,458
4,592
Beverages
4,931
6,268
5,878
6,028
6,209
Bakery
234
203
180
171
171
Others
87
139
132
132
138
Sources: Tingyi; BNP Paribas estimates
32
BNP PARIBAS
28 JANUARY 2015
Tingyi
322 HK
Charlie Y Chen
Financial statements
Tingyi
Cash Flow (USD m) Year Ending Dec
2012A
2013A
2014E
2015E
2016E
Recurring net profit
374
413
421
465
494
Depreciation
381
444
493
513
528
Associates & minorities
142
70
78
119
143
(250)
(9)
(60)
(29)
(30)
Other non-cash items
Recurring cash flow
648
919
931
1,069
1,134
Change in working capital
326
303
(156)
(14)
26
0
0
0
0
0
(839)
(852)
(1,424)
(647)
(765)
135
369
(649)
407
395
0
0
0
0
0
(248)
(207)
(240)
(292)
(342)
Capex - maintenance
Capex - new investment
Free cash flow to equity
Net acquisitions & disposals
Dividends paid
Non recurring cash flows
677
47
43
29
31
Net cash flow
564
209
(846)
145
84
Equity finance
0
0
0
0
0
(515)
186
243
44
0
50
396
(603)
189
84
Recurring cash flow per share
0.12
0.16
0.17
0.19
0.20
FCF to equity per share
0.02
0.07
(0.12)
0.07
0.07
2012A
2013A
2014E
2015E
2016E
Debt finance
Movement in cash
Per share (USD)
Balance Sheet (USD m) Year Ending Dec
Working capital assets
1,138
1,176
1,184
1,201
1,234
Working capital liabilities
(2,295)
(2,609)
(2,460)
(2,464)
(2,522)
Net working capital
(1,157)
(1,433)
(1,277)
(1,263)
(1,289)
Tangible fixed assets
5,002
5,485
6,416
6,550
6,788
Operating invested capital
3,845
4,052
5,139
5,287
5,499
0
0
0
0
0
29
28
28
28
28
174
Goodwill
Other intangible assets
Investments
84
109
127
148
Other assets
390
392
392
392
392
Invested capital
4,348
4,581
5,686
5,855
6,092
Cash & equivalents
(830)
(1,234)
(667)
(856)
(941)
Short term debt
500
1,017
1,017
1,017
1,017
Long term debt *
985
660
902
947
947
Net debt
654
442
1,252
1,107
1,023
Deferred tax
178
184
184
184
184
26
28
27
28
29
2,544
2,880
3,097
3,351
3,613
Minority interests
945
1,046
1,105
1,165
1,224
Invested capital
4,348
4,581
5,665
5,835
6,072
Other liabilities
Total equity
* includes convertibles and preferred stock which is being treated as debt
Per share (USD)
Book value per share
0.45
0.51
0.55
0.60
0.65
Tangible book value per share
0.45
0.51
0.55
0.59
0.64
Financial strength
Net debt/equity (%)
18.8
11.3
29.8
24.5
21.1
Net debt/total assets (%)
8.8
5.2
14.2
12.1
10.7
Current ratio (x)
0.7
0.7
0.5
0.6
0.6
-
-
-
60.0
67.8
CF interest cover (x)
Valuation
2012A
2013A
2014E
2015E
2016E
Recurring P/E (x) *
34.8
31.5
31.0
28.0
26.4
Recurring P/E @ target price (x) *
31.1
28.2
27.7
25.1
23.6
Reported P/E (x)
28.3
31.8
30.9
27.9
26.3
Dividend yield (%)
1.4
1.6
1.6
1.8
1.9
P/CF (x)
20.0
14.1
13.9
12.2
11.5
P/FCF (x)
96.0
35.2
(20.0)
31.9
32.9
Price/book (x)
5.1
4.5
4.2
3.9
3.6
Price/tangible book (x)
5.2
4.6
4.2
3.9
3.6
EV/EBITDA (x) **
14.2
12.5
12.2
10.9
10.1
EV/EBITDA @ target price (x) **
12.8
11.3
11.1
9.9
9.2
3.4
3.2
2.7
2.6
2.5
EV/invested capital (x)
* Pre exceptional, pre-goodwill and fully diluted
** EBITDA includes associate income and recurring non-operating income
Sources: Tingyi; BNP Paribas estimates
33
BNP PARIBAS
28 JANUARY 2015
28 JANUARY 2015
NEW INFORMATION
HONG KONG
/ FOOD BEVERAGE & 6TOBACCO
CHINA
BIOSTIME INTERNATIONAL
BUY
TARGET PRICE
HKD33.70
CLOSE
HKD21.65
UP/DOWNSIDE
UNCHANGED
1112 HK
HOW WE DIFFER FROM CONSENSUS
MARKET RECS
TARGET PRICE (%)
59
POSITIVE
5
EPS 2014 (%)
6
NEUTRAL
10
EPS 2015 (%)
17
NEGATIVE
4
+55.7%
PRIOR TP
HKD38.20
CHANGE IN TP
-11.8%
KEY STOCK DATA
Focus on fundamentals, not QE
n
n
n
n
YE Dec (RMB m)
QE-driven share price strength a one-off
Biostime’s share price rallied 30% in two trading days (from
HKD16.56 on closing of 22 Jan to HKD21.50 on closing of 26 Jan),
on potential margin expansion from EUR weakness after QE policy
announcement in the eurozone. All else being equal, we estimate
every 5% EUR depreciation vs the RMB would improve Biostime’s
gross margin ~1ppt, or a ~6% increase in net profit.
Exact benefits to financials remain uncertain
A weak EUR is positive for Biostime, but whether it can book all the
cost saving into net profit is uncertain. Biostime and its suppliers
review supply contracts quarterly, and the supply price may rise in
2015. Other European brands such as Nutrilon may invest the cost
savings into marketing, which may force competitors, including
Biostime, to follow suit. This may hurt margins. So, it is too early to
get over-excited about the QE, in our opinion.
Focus on revenue, not on profit, in the near term
We believe Biostime’s future hinges on its ability to maintain a strong
brand and to continue leveraging its distribution channel. Therefore,
we should focus on revenue growth (new product performance and
old product market share trend), rather than margins, which may be
dressed up by the temporary QE effect.
Lower TP to HKD33.70 based on 20x FY15E target P/E
We cut earnings 10-26% over 2014-16E on lower spending per loyal
customer, due to competition and product mix change. This lowers
our TP to HKD33.70 (from HKD38.20), and we still use 20x FY15E
P/E as our target valuation. Our new TP implies 57% upside – BUY.
P/E band
Revenue
2014E
2015E
2016E
4,561
4,609
4,830
5,192
Rec. net profit
974
678
771
830
Recurring EPS (RMB)
1.59
1.17
1.34
1.43
Prior rec. EPS (RMB)
1.59
1.31
1.54
1.92
Chg. In EPS est. (%)
0.0
(10.3)
(12.8)
(25.5)
EPS growth (%)
29.8
(26.3)
14.3
6.7
Recurring P/E (x)
11.0
14.9
13.1
12.2
Dividend yield (%)
5.5
2.6
2.9
3.1
EV/EBITDA (x)
7.5
8.6
6.9
6.1
Price/book (x)
Net debt/Equity (%)
ROE (%)
Jan-14
Apr-14
4.2
3.9
3.3
2.9
(36.3)
(126.0)
(112.0)
(110.4)
40.3
26.0
25.9
23.8
Jul-14
Oct-14
Jan-15
73.00
(10)
(30)
53.00
(50)
33.00
13.00
(HKD)
(70)
Biostime International
Share price performance
Rel to MSCI China
1 Month
3 Month
12 Month
40.6
2.9
(67.3)
Relative to country (%)
31.7
(7.7)
(84.7)
Next results
March 2015
Mkt cap (USD m)
1,696
3m avg daily turnover (USD m)
6.5
Free float (%)
25
Biostime Pharmaceutical (75%)
12m high/low (HKD)
80
3m historic vol. (%)
60
30x
25x
20x
15x
10x
40
20
0
Dec-10
Jul-11
Feb-12
Sep-12
Sources: Bloomberg; BNP Paribas estimates
Charlie Y Chen
[email protected]
+852 2825 1109
34
Apr-13
Nov-13
Jun-14
Jan-15
(90)
(%)
Absolute (%)
Major shareholder
(HKD)
2013A
ADR ticker
ADR closing price (USD)
Issued shares (m)
Sources: Bloomberg consensus; BNP Paribas estimates
69.40/15.02
59.4
607
Biostime International
1112 HK
Charlie Y Chen
Investment thesis
Catalyst
We believe Biostime is a high-quality consumer product
player with sound management, healthy cash flows and
strong balance sheet. However, the company is facing shortterm pressure due to increased competition from foreign
products and e-commerce, which caused earnings decline
and share valuation de-rating in 2014.
Initial feedback on new product launches (mainstream infant
formula products and baby diapers) has been positive. If the
performance of new products is better than expected, this
could bring upside to our earnings forecasts.
2014 results announcement (due in March 2015) should give
a better picture of benefits of European QE to Biostime, and
management may give a clearer guidance for 2015, which
could drive the share price both ways.
As Biostime’s management is trying hard to launch new
products (in particular outside of infant formula category),
exploring new channels (online market) and restructuring
business units to resume high growth, we believe all these
measures are long-term positives and that the stock is being
over-penalised for short-term turmoil.
We forecast Biostime’s revenue growth will accelerate in
2015 with on new product launches and increased cooperation with online retailing platforms, as well as potential
M&A (which has been talked about by management for a
while).
Potential good M&A could be a positive catalyst for
Biostime.
Risks to our call
Increasing competition from low-priced foreign products may
squeeze Biostime’s margins.
Unsuccessful channel development in the online retail
market may weaken Biostime’s competitiveness and cause
market share loss.
Our target price of HKD33.70 (from HKD38.20) is based on a
2015E target P/E of 20x and implies about 57% upside
Potential, and we reiterate our BUY rating.
Company background
Key assumptions
Biostime is a baby product company with the majority of
current business being infant formula. Biostime uses
overseas OEM suppliers to ensure high quality of its products
and its sophisticated Mama100 loyalty program to manage
distribution channels. Biostime has a wide product range
including infant formula, baby food, baby care products and
nutritional products.
2014E
2015E
2016E
Number of points of sale ('000)
29
34
37
Active Mama100 members per store
85
80
75
1,789
1,521
1,445
83
81
76
4,609
4,830
5,192
Avg. spend per Mama100 member (RMB)
Mama100 contribution to total revenue (%)
Total revenue (RMB m)
Source: BNP Paribas estimates
Principal activities: 2014 revenue split on our estimate
Baby care
4%
Probiotic
9%
Earnings sensitivity
Dried baby
food
5%
------ Base ------
------ Best ------
----- Worst -----
2014E 2015E 2014E 2015E 2014E
Revenue growth (%)
Recurring EPS (RMB)
EPS change (%)
(3.9)
2015E
1.1
4.8
6.1
9.8
(0.2)
1.17
1.34
1.52
2.08
0.82
0.63
-
-
30.1
55.5
(30.1)
(52.9)
Infant
formula
82%
Key executives
Source: BNP Paribas estimates
Age
Joined
LUO Fei
49
1999
Chairman and CEO
Title
KONG Qingjuan
51
2000
ED, COO
Zhao Li
44
2004
GM of Sales and Marketing
Frank CAO
35
2007
CFO
Laetitia Garnier
33
2010
Director of International Cooperation
We forecast a 1.1% y-y increase in 2014 revenue.
Every 5% change in 2014 revenue growth would change
Biostime’s 2014 EPS by 30%, all else being equal.
Every 5% change in 2015 revenue growth would change
Biostime’s 2015 EPS by 53-56%, all else being equal.
http://www.biostime.com
35
BNP PARIBAS
28 JANUARY 2015
Biostime International
1112 HK
Charlie Y Chen
EXHIBIT 1: Earnings revision
------------- 2014E ------------New forecast
Revenue growth
------------ 2015E -------------
Change New forecast
(%)
(%)
------------- 2016E -------------
Change New forecast
Change
(%)
(%)
(%)
(%)
1.1
(6.9)
4.8
(6.9)
7.5
(12.5)
GP margin
61.6
(0.5)
61.4
1.1
60.0
0
Net margin
14.7
(0.8)
16.1
(0.2)
16.0
(1.4)
Reported EPS (RMB)
1.13
(9.6)
1.29
(13.4)
1.37
(27.5)
Source: BNP Paribas
36
BNP PARIBAS
28 JANUARY 2015
Biostime International
1112 HK
Charlie Y Chen
Financial statements
Biostime International
Profit and Loss (RMB m) Year Ending Dec
Revenue
Cost of sales ex depreciation
Gross profit ex depreciation
Other operating income
Operating costs
Operating EBITDA
Depreciation
Goodwill amortisation
Operating EBIT
Net financing costs
2012A
2013A
2014E
2015E
3,382
4,561
4,609
4,830
2016E
5,192
(1,153)
(1,586)
(1,771)
(1,863)
(2,077)
2,229
2,975
2,838
2,967
3,115
1
5
6
7
10
(1,204)
(1,720)
(1,869)
(1,935)
(2,013)
1,026
1,260
974
1,039
1,112
(22)
(26)
(50)
(57)
(58)
0
0
0
0
0
1,004
1,234
925
982
1,054
81
54
77
5
75
Associates
0
0
(1)
(1)
2
Recurring non operating income
0
0
0
0
0
(7)
(149)
0
10
0
Profit before tax
Non recurring items
1,051
1,162
929
1,066
1,136
Tax
(307)
(341)
(251)
(288)
(307)
743
821
678
778
830
Minority interests
0
0
0
0
0
Preferred dividends
0
0
0
0
0
Other items
0
0
0
0
0
743
821
678
778
830
Profit after tax
Reported net profit
Non recurring items & goodwill (net)
5
153
0
(7)
0
748
974
678
771
830
Recurring EPS *
1.22
1.59
1.17
1.34
1.43
Reported EPS
1.24
1.37
1.13
1.29
1.37
DPS
0.87
0.95
0.45
0.51
0.54
Revenue (%)
54.5
34.9
1.1
4.8
7.5
Operating EBITDA (%)
56.2
22.8
(22.7)
6.6
7.0
Operating EBIT (%)
55.9
22.9
(25.1)
6.2
7.3
Recurring EPS (%)
52.9
29.8
(26.3)
14.3
6.7
Reported EPS (%)
41.7
10.3
(17.6)
14.3
6.3
Gross margin inc depreciation (%)
65.3
64.7
60.5
60.2
58.9
Operating EBITDA margin (%)
30.3
27.6
21.1
21.5
21.4
Operating EBIT margin (%)
29.7
27.1
20.1
20.3
20.3
Net margin (%)
22.1
21.3
14.7
16.0
16.0
Effective tax rate (%)
29.3
29.4
27.0
27.0
27.0
Dividend payout on recurring profit (%)
71.5
60.1
38.1
38.1
37.9
-
-
-
-
-
129.9
172.0
175.1
146.3
142.3
Recurring net profit
Per share (RMB)
Growth
Operating performance
Interest cover (x)
Inventory days
Debtor days
0.5
0.6
0.9
0.5
0.5
Creditor days
52.3
71.9
52.3
29.3
28.5
(1,096.4)
(29,589.1)
609.6
315.7
220.0
ROIC (%)
Operating ROIC (%)
130.8
92.6
54.2
51.5
51.2
ROE (%)
34.8
40.3
26.0
25.9
23.8
ROA (%)
23.3
22.0
11.7
9.6
9.6
2012A
2013A
2014E
2015E
2016E
379
458
389
389
419
2,715
3,752
3,876
4,061
4,366
Dried baby food
135
199
169
169
182
Baby care
106
152
175
210
226
47
0
0
0
0
*Pre exceptional, pre-goodwill and fully diluted
Revenue By Division (RMB m)
Probiotic
Infant Formula
Nutritioni Suppliment
Sources: Biostime International; BNP Paribas estimates
37
BNP PARIBAS
28 JANUARY 2015
Biostime International
1112 HK
Charlie Y Chen
Financial statements
Biostime International
Cash Flow (RMB m) Year Ending Dec
Recurring net profit
Depreciation
Associates & minorities
Other non-cash items
2012A
2013A
2014E
2015E
2016E
748
974
678
771
830
22
26
50
57
58
0
0
0
0
0
62
(173)
4
(53)
(81)
Recurring cash flow
832
827
732
775
807
Change in working capital
113
(165)
20
0
3
0
0
0
0
0
Capex - new investment
(39)
(138)
(159)
(58)
(63)
Free cash flow to equity
906
525
594
717
748
0
(280)
0
0
0
(404)
(622)
(582)
(271)
(319)
Capex - maintenance
Net acquisitions & disposals
Dividends paid
Non recurring cash flows
(1,849)
299
97
(316)
0
Net cash flow
(1,347)
(78)
108
129
428
Equity finance
(57)
(64)
0
0
0
Debt finance
307
510
2,397
75
81
(1,097)
367
2,505
204
509
Recurring cash flow per share
1.39
1.38
1.22
1.28
1.33
FCF to equity per share
1.51
0.87
0.99
1.19
1.24
2012A
2013A
2014E
2015E
2016E
Movement in cash
Per share (RMB)
Balance Sheet (RMB m) Year Ending Dec
Working capital assets
622
1,128
826
868
961
Working capital liabilities
(863)
(1,294)
(1,013)
(1,055)
(1,152)
Net working capital
(241)
(167)
(187)
(187)
(191)
Tangible fixed assets
77
322
335
661
674
(164)
155
148
474
484
0
143
143
143
143
Operating invested capital
Goodwill
Other intangible assets
Investments
Other assets
Invested capital
Cash & equivalents
Short term debt
Long term debt *
Net debt
Deferred tax
Other liabilities
Total equity
21
90
187
178
169
942
931
925
925
925
202
343
343
343
343
1,002
1,663
1,746
2,063
2,064
(1,669)
(1,663)
(4,168)
(4,372)
(4,881)
271
751
751
751
751
0
0
0
0
0
(1,399)
(912)
(3,417)
(3,621)
(4,131)
77
60
60
60
60
0
0
2,392
2,392
2,392
3,743
2,323
2,516
2,711
3,233
Minority interests
0
0
0
0
0
Invested capital
1,002
1,663
1,746
2,063
2,064
* includes convertibles and preferred stock which is being treated as debt
Per share (RMB)
Book value per share
3.86
4.16
4.46
5.30
6.11
Tangible book value per share
3.82
3.77
3.92
4.77
5.60
Net debt/equity (%)
(60.2)
(36.3)
(126.0)
(112.0)
(110.4)
Net debt/total assets (%)
(39.6)
(19.7)
(49.3)
(48.3)
(51.0)
2.0
1.4
2.8
2.9
3.1
-
-
-
-
-
2012A
2013A
2014E
2015E
2016E
12.2
Financial strength
Current ratio (x)
CF interest cover (x)
Valuation
Recurring P/E (x) *
14.3
11.0
14.9
13.1
Recurring P/E @ target price (x) *
22.2
17.1
23.2
20.3
19.0
Reported P/E (x)
14.1
12.8
15.5
13.5
12.7
Dividend yield (%)
5.0
5.5
2.6
2.9
3.1
P/CF (x)
12.6
12.7
14.3
13.6
13.1
P/FCF (x)
11.5
20.0
17.7
14.7
14.1
Price/book (x)
4.5
4.2
3.9
3.3
2.9
Price/tangible book (x)
4.6
4.6
4.5
3.7
3.1
EV/EBITDA (x) **
8.8
7.5
8.6
6.9
6.1
14.6
12.1
14.7
12.6
11.4
9.1
5.8
4.1
3.4
3.2
EV/EBITDA @ target price (x) **
EV/invested capital (x)
* Pre exceptional, pre-goodwill and fully diluted
** EBITDA includes associate income and recurring non-operating income
Sources: Biostime International; BNP Paribas estimates
38
BNP PARIBAS
28 JANUARY 2015
28 JANUARY 2015
NEW INFORMATION
5 HONG
/ CONSUMER SERVICES
CHINA
KONG
HAICHANG HOLDINGS
BUY
2255 HK
TARGET PRICE
HKD2.30
CLOSE
HKD1.22
UP/DOWNSIDE
UNCHANGED
MARKET RECS
TARGET PRICE (%)
(4)
POSITIVE
7
EPS 2014 (%)
(18)
NEUTRAL
0
EPS 2015 (%)
2
NEGATIVE
0
+88.5%
PRIOR TP
CHANGE IN TP
HOW WE DIFFER FROM CONSENSUS
HKD2.30
UNCHANGED
KEY STOCK DATA
2015: Steady steps forward
n
n
n
n
YE Dec (RMB m)
Shanghai Park site secured, new park targeted to open in 2016
Haichang had announced on 19 January that it has won the bid for
the land in Shanghai, where it plans to build a large-scale marine
theme park (200k sqm construction area in total, including a theme
park and a resort). The company plans to fund the entire cost of
RMB728m paid from internal resources.
Multiple initiatives in 2015
With both Sanya and Shanghai park sites being secured, Haichang
plans to focus on increasing traffic, brand building and new business
trials to generate higher revenue and efficiency in 2015.
Management is considering various new initiatives, including smallscale marine parks in shopping malls, brand identity development
and visitor big data analysis, which may be unveiled in 2015.
Management stock incentive plan in place
In Nov and Dec 2014, Haichang’s management team purchased a
total of 255m shares (6% of total shares outstanding) from chairman
Mr. Qu, at a cost of HKD1.20/share and HKD1.36/share. In our
opinion, this share incentive scheme has aligned management and
shareholders’ interest and is likely to support share performance in
the long term.
Reiterate BUY with a TP of HKD2.30
Haichang reported 10% visitor growth and 7.5% ticket attendance
growth in 2014, in line with our forecasts. We use SOTP to value the
company, and keep our TP unchanged at of HKD2.30 and maintain
our BUY rating.
P/E band
(HKD)
3.0
2014E
2015E
2016E
1,123
1,496
1,757
2,037
23
195
247
273
Recurring EPS (RMB)
0.01
0.05
0.06
0.07
Prior rec. EPS (RMB)
0.01
0.05
0.06
0.07
Chg. In EPS est. (%)
0.0
0.0
0.0
0.0
Revenue
Rec. net profit
EPS growth (%)
Recurring P/E (x)
nm
511.2
26.3
10.9
127.4
20.8
16.5
14.9
Dividend yield (%)
EV/EBITDA (x)
0.0
0.0
0.0
0.0
13.2
8.0
7.1
7.3
Price/book (x)
Net debt/Equity (%)
3.7
1.0
1.0
0.9
304.8
5.0
41.8
78.0
2.5
8.3
6.2
6.5
ROE (%)
Mar-14
Jun-14
Sep-14
Dec-14
2.45
(7)
1.95
(27)
1.45
(47)
0.95
(HKD)
Haichang Holdings
Share price performance
Absolute (%)
Relative to country (%)
Rel to MSCI China
3 Month
12 Month
(6.9)
1.7
-
(12.0)
(6.7)
March 2015
Mkt cap (USD m)
650
3m avg daily turnover (USD m)
0.8
Free float (%)
23
Qu Naijie (56%)
12m high/low (HKD)
40x
35x
30x
25x
20x
2.0
1.5
1.0
0.5
0.0
12-Mar
3m historic vol. (%)
ADR ticker
ADR closing price (USD)
Issued shares (m)
Sources: Bloomberg consensus; BNP Paribas estimates
12-May
12-Jul
Sources: Bloomberg; BNP Paribas estimates
Charlie Y Chen
[email protected]
+852 2825 1109
12-Sep
12-Nov
12-Jan
(67)
(%)
1 Month
Next results
Major shareholder
2.5
39
2013A
2.45/1.05
40.9
4,150
Haichang Holdings
2255 HK
Charlie Y Chen
Investment thesis
Catalyst
Haichang Holdings is a consolidated theme park and property
company with businesses covering theme park operations
and commercial properties. The company has six marine
theme parks and plans to add four more parks through
acquisitions and construction by the end of 2017. We believe
Haichang is in a good position to ride the increasing demand
for leisure and travel in China, which is still increasing at
nearly 20% pa. The high entry barrier (heavy initial capex,
technology know-how and legal restrictions) is likely to deter
newcomers and minimise the possibility of any price
competition. Despite the low margins at the current stage, we
see big earnings upside potential from strong operating
leverage.
We estimate Haichang will report strong 2014 earnings
growth of 163% y-y, due to operating leverage. We believe
strong results should strengthen investor confidence and
probably re-rate the stock.
We use a SOTP methodology to derive our target price of
HKD2.30 for Haichang: we value the theme park business at
9.5x EV/EBITDA and the property business at a 50%
discount to adjusted NAV (which is the valuation range of
Hong Kong listed property companies), using our 2014
estimates.
Company background
Securing land parcels in Shanghai for the new park may also
lift investors’ interest in Haichang, as the Shanghai project is
likely to be the star project given its large size and strong
traffic/profitability prospects.
Risks to our call
China’s volatile property market may hurt Haichang’s
property sales revenue.
An unfavourable economic environment may negatively
impact Haichang’s visitor traffic.
Haichang may need to raise funds if the capex for the park
exceeds our forecast.
Key assumptions
Haichang Holdings develops and operates theme parks and
other ancillary commercial properties. The company manages
museums, aquariums, theme parks, water theme parks, and
other related properties. Haichang manages its parks
throughout China.
2014E
2015E
2016E
(%)
(%)
(%)
Theme park revenue growth
60.3
16.7
14.1
Property revenue growth
47.9
16.2
14.5
Theme park EBITDA margin
46.5
48.4
51.5
Property EBITDA margin
28.5
29
29
13
14
13.4
Recurring net margin
Source: BNP Paribas estimates
Principal activities: 2014 revenue split on our estimate
Earnings sensitivity
------ Base ------
------ Best ------
------ Worst ------
2014E
2015E
2014E
2015E
2014E
2015E
33.3
17.4
38.3
22.4
28.3
12.4
195.2
246.6
251.8
335.4
138.6
165.2
-
-
29
36
(29)
(36)
Park operations (76.8%)
Revenue growth (%)
Net profit (RMB m)
Property development and
holding (21.71%)
Net profit change (%)
Others (1.5%)
Key executives
Source: BNP Paribas estimates
Age
Joined
Title
Wang Xuguang
44
2011
CEO
Zhao Wenjing
59
2001
Joint President
Qu Naiqiang
51
2001
Executive Director
Qu Naijie
53
1996
Chairman
Makoto Inoue
61
2012
Chairman
Haichang’s earnings are very sensitive to revenue growth
due to high operating leverage.
We estimate a 5% change in revenue growth would result
in 29% and 36% changes to Haichang’s earnings in 2014
and 2015, all else being equal.
http://www.haichangholdings.com
40
BNP PARIBAS
28 JANUARY 2015
Haichang Holdings
2255 HK
Charlie Y Chen
Financial statements
Haichang Holdings
Profit and Loss (RMB m) Year Ending Dec
Revenue
Cost of sales ex depreciation
Gross profit ex depreciation
Other operating income
Operating costs
Operating EBITDA
Depreciation
Goodwill amortisation
Operating EBIT
Net financing costs
2012A
2013A
2014E
2015E
2016E
889
1,123
1,496
1,757
2,037
(366)
(491)
(607)
(725)
(738)
523
632
890
1,032
1,299
27
30
48
57
66
(221)
(238)
(290)
(348)
(418)
328
424
648
741
948
(123)
(125)
(201)
(189)
(325)
0
0
0
0
0
205
299
446
551
623
(189)
(177)
(202)
(143)
(166)
Associates
0
0
0
0
0
Recurring non operating income
0
0
0
0
0
Non recurring items
159
84
(30)
(20)
0
Profit before tax
187
181
274
365
434
(108)
(80)
(84)
(114)
(138)
79
101
190
251
296
(19)
(15)
(17)
(20)
(23)
Preferred dividends
0
0
0
0
0
Other items
0
0
0
0
0
60
86
173
232
273
(119)
(63)
23
15
0
(59)
23
195
247
273
Tax
Profit after tax
Minority interests
Reported net profit
Non recurring items & goodwill (net)
Recurring net profit
Per share (RMB)
Recurring EPS *
(0.04)
0.01
0.05
0.06
0.07
Reported EPS
0.04
0.03
0.04
0.06
0.07
DPS
0.00
0.00
0.00
0.00
0.00
Revenue (%)
30.0
26.3
33.3
17.4
16.0
Operating EBITDA (%)
53.3
29.2
52.7
14.3
27.9
Operating EBIT (%)
71.8
45.8
49.1
23.5
12.9
Recurring EPS (%)
nm
nm
511.2
26.3
10.9
Reported EPS (%)
98.4
(19.1)
44.9
34.1
18.1
Gross margin inc depreciation (%)
45.0
45.2
46.0
48.0
47.8
Operating EBITDA margin (%)
36.9
37.8
43.3
42.2
46.5
Operating EBIT margin (%)
23.1
26.7
29.8
31.4
30.6
Net margin (%)
(6.6)
2.1
13.0
14.0
13.4
Effective tax rate (%)
57.8
44.4
30.7
31.3
31.8
0.0
Growth
Operating performance
Dividend payout on recurring profit (%)
-
0.0
0.0
0.0
Interest cover (x)
1.2
1.5
3.1
3.3
3.3
Inventory days
7.1
5.6
7.7
9.4
10.6
Debtor days
7.1
7.3
6.7
6.7
7.0
526.4
317.0
300.6
350.0
401.9
Operating ROIC (%)
4.9
8.5
13.1
10.6
7.9
ROIC (%)
1.4
3.0
6.0
6.4
5.4
ROE (%)
(8.6)
2.5
8.3
6.2
6.5
ROA (%)
0.5
2.1
4.0
4.0
4.1
Creditor days
*Pre exceptional, pre-goodwill and fully diluted
Revenue By Division (RMB m)
2012A
2013A
2014E
2015E
2016E
Park operations
633
713
1,149
1,344
1,531
Property development and holding
250
349
325
400
491
6
61
22
14
15
Others
Sources: Haichang Holdings; BNP Paribas estimates
41
BNP PARIBAS
28 JANUARY 2015
Haichang Holdings
2255 HK
Charlie Y Chen
Financial statements
Haichang Holdings
Cash Flow (RMB m) Year Ending Dec
2012A
2013A
2014E
2015E
Recurring net profit
(59)
23
195
247
273
Depreciation
123
125
201
189
325
19
15
17
20
23
(17)
55
54
199
349
Associates & minorities
Other non-cash items
Recurring cash flow
Change in working capital
Capex - maintenance
2016E
66
217
467
654
970
(121)
(284)
334
203
187
0
0
0
0
0
Capex - new investment
(201)
(264)
(1,678)
(2,384)
(2,924)
Free cash flow to equity
(255)
(330)
(876)
(1,527)
(1,767)
Net acquisitions & disposals
31
(1)
0
0
0
Dividends paid
(7)
0
0
0
0
Non recurring cash flows
(401)
1,149
1,177
0
0
Net cash flow
(632)
818
300
(1,527)
(1,767)
Equity finance
510
0
2,625
0
0
Debt finance
410
(491)
(1,812)
841
222
Movement in cash
288
326
1,113
(686)
(1,545)
Per share (RMB)
Recurring cash flow per share
FCF to equity per share
Balance Sheet (RMB m) Year Ending Dec
Working capital assets
Working capital liabilities
0.04
0.07
0.11
0.16
0.23
(0.15)
(0.11)
(0.21)
(0.37)
(0.43)
2012A
2013A
2014E
2015E
2016E
1,399
1,096
1,489
1,498
1,430
(1,296)
(989)
(1,488)
(1,815)
(2,057)
Net working capital
102
107
0
(317)
(626)
Tangible fixed assets
1,842
1,865
2,738
4,732
6,995
Operating invested capital
1,945
1,972
2,738
4,415
6,368
Goodwill
0
0
0
0
0
Other intangible assets
0
0
0
0
0
Investments
333
324
376
365
355
Other assets
3,698
2,916
1,954
2,068
2,191
Invested capital
5,976
5,212
5,076
6,855
8,918
Cash & equivalents
(404)
(496)
(2,144)
(1,409)
136
Short term debt
1,437
931
942
1,115
1,193
Long term debt *
2,406
2,440
1,405
2,072
2,216
Net debt
3,439
2,876
202
1,778
3,545
(6)
15
(60)
(60)
(60)
Other liabilities
1,395
1,373
882
882
882
Total equity
1,008
806
3,892
4,075
4,348
Deferred tax
Minority interests
136
138
155
175
197
Invested capital
5,976
5,212
5,076
6,855
8,918
* includes convertibles and preferred stock which is being treated as debt
Per share (RMB)
Book value per share
0.60
0.27
0.94
0.98
1.05
Tangible book value per share
0.60
0.27
0.94
0.98
1.05
300.7
304.8
5.0
41.8
78.0
44.8
42.9
2.3
17.6
32.7
Current ratio (x)
0.7
0.8
1.5
1.0
0.4
CF interest cover (x)
0.7
0.7
6.6
6.2
7.1
2012A
2013A
2014E
2015E
2016E
14.9
Financial strength
Net debt/equity (%)
Net debt/total assets (%)
Valuation
Recurring P/E (x) *
neg
127.4
20.8
16.5
Recurring P/E @ target price (x) *
neg
240.2
39.3
31.1
28.0
Reported P/E (x)
27.6
34.2
23.6
17.6
14.9
Dividend yield (%)
0.4
0.0
0.0
0.0
0.0
P/CF (x)
24.9
13.5
8.7
6.2
4.2
P/FCF (x)
(6.5)
(8.9)
(4.6)
(2.7)
(2.3)
Price/book (x)
1.6
3.7
1.0
1.0
0.9
Price/tangible book (x)
1.6
3.7
1.0
1.0
0.9
EV/EBITDA (x) **
17.0
13.2
8.0
7.1
7.3
EV/EBITDA @ target price (x) **
21.4
18.0
12.8
11.9
11.1
0.9
1.1
0.9
0.9
0.9
EV/invested capital (x)
* Pre exceptional, pre-goodwill and fully diluted
** EBITDA includes associate income and recurring non-operating income
Sources: Haichang Holdings; BNP Paribas estimates
42
BNP PARIBAS
28 JANUARY 2015
28 JANUARY 2015
NEW INFORMATION
/ RETAILING
CHINA
5 HONG KONG
GOME ELECTRICAL
BUY
493 HK
TARGET PRICE
HKD1.94
CLOSE
HKD1.08
UP/DOWNSIDE
UNCHANGED
HOW WE DIFFER FROM CONSENSUS
MARKET RECS
TARGET PRICE (%)
21.1
POSITIVE
17
EPS 2014 (%)
(1.3)
NEUTRAL
4
EPS 2015 (%)
4.6
NEGATIVE
2
+79.6%
PRIOR TP
HKD2.13
CHANGE IN TP
-8.9%
KEY STOCK DATA
Several reasons to re-rate
n
n
Positive profit alert shows effect of restructuring
Gome announced a positive profit alert on 22 Jan for 2014 net profit
to grow 40% y-y driven by its ‘omni-channel’ strategy. By increasing
the number of wifi-covered, “experiencing” stores to retain consumer
traffic and closing low efficiency ones, Gome should achieve near 5%
SSSG in 2014 and above a 2% net margin (1.6% in 2013).
Gome’s e-commerce business is outperforming its peers’
Gome’s online revenue more than doubled in 2014, partly due to
efforts to divert traffic from off-line to on-line. Gome’s on-line revenue
target in 2015 is RMB12b, with half from direct sales and half from
third party platforms. From 3Q13 to 3Q14, Gome’s market share in
the on-line B2C market increased from 4.0% to 6.6% (direct sales
only), or from 1.8% to 2.5% (including third party platforms).
YE Dec (RMB m)
2013A
2014E
2015E
2016E
Revenue
56,401
59,805
63,992
69,111
Rec. net profit
892
1,258
1,543
1,858
Recurring EPS (RMB)
0.05
0.07
0.09
0.11
Prior rec. EPS (RMB)
0.05
0.07
0.09
0.11
Chg. In EPS est. (%)
-
5.4
2.9
(0.2)
EPS growth (%)
nm
41.0
22.7
20.4
Recurring P/E (x)
16.5
11.7
9.5
7.9
Dividend yield (%)
3.6
2.6
3.1
3.8
EV/EBITDA (x)
5.8
4.7
4.0
2.7
Price/book (x)
Net debt/Equity (%)
n
Potential positives from partnership with Huishang Bank
Gome’s proposed partnership with Huishang Bank (3698 HK) would,
we think, be positive because in opening a door to Internet financing,
a market still in early stages of development. It could help Gome
improve margins by offering consumer and distributor loan products.
Maintain BUY with TP of HKD1.94 on 1x PEG 2015-2017
We maintain our 1x PEG target but roll over our valuation base EPS
CAGR to 2015-17. With a 17% EPS CAGR, our new TP is HKD1.94
which implies 17x FY15E P/E. The shares are trading at 10x FY15E
PE and 0.9x FY15E P/BV, making them, in our view, an attractive
investment given Gome’s healthy revenue and net profit outlook.
0.9
0.9
0.8
(25.0)
(32.1)
(39.9)
5.8
7.8
9.2
10.4
ROE (%)
Jan-14
n
0.9
(41.3)
Apr-14
Jul-14
Oct-14
Jan-15
21
1.53
11
1.33
1
(9)
1.13
(19)
0.93
(HKD)
GOME Electrical
Share price performance
Absolute (%)
Relative to country (%)
Rel to MSCI China
1 Month
3 Month
12 Month
1.9
(10.7)
(17.6)
(6.0)
(22.6)
(34.2)
Next results
March 2015
Mkt cap (USD m)
2,350
3m avg daily turnover (USD m)
Gome PE band
(x)
2.0
Major shareholder
16x
1.5
12x
55
Wong Kwong Yu (33%)
12m high/low (HKD)
3m historic vol. (%)
1.0
8x
ADR ticker
0.5
4x
ADR closing price (USD)
Issued shares (m)
Source: Bloomberg, company data, BNP Paribas estimates
Charlie Y Chen
[email protected]
+852 2825 1109
Jan-15
Nov-14
Sep-14
Jul-14
May-14
Mar-14
Jan-14
Nov-13
Sep-13
Jul-13
May-13
Mar-13
Jan-13
0.0
43
18.0
Free float (%)
R
4
(29)
(%)
Sources: Bloomberg consensus; BNP Paribas estimates
1.50/1.03
35.5
16,867
GOME Electrical
493 HK
Charlie Y Chen
Investment thesis
Catalyst
We believe it is a good time to accumulate GOME shares as
the company is unfairly being penalised for taking a stake in
Huishang Bank, while its earnings recovery should continue.
After a weak 2012, due to intense competition from online
retailers, GOME turned profitable in 2013 driven by a change
in internal strategy and the launch of a sophisticated ERP
system. There are good signs of revenue growth stabilising
and margin improvement. We expect GOME’s improving
trend to continue with its operating margin improving to 3.4%
in 2017 (from 1.8% in 2013), driving a 23.1% EPS CAGR
over 2014-17E.
Share price catalysts could come from improvement in
fundamentals (reflected in quarterly earnings
announcements) and M&A, given the market in China is
consolidating. Now that Gome has issued a positive profit
alert for its 3Q14 results, the next potential catalyst could be
the FY14 results announcement in March 2015, when the
company will share its strategy and guidance for 2015. If
Gome can consistently deliver strong earnings growth, we
believe the stock will re-rate to a PE in the mid-teens to 20x
in line with other retailing stocks.
We believe our target price of HKD1.94 is not aggressive in
view of GOME’s high earnings growth potential, strong free
cash flow and solid balance sheet. We maintain our BUY
recommendation and 1x PEG target.
Company background
Risks to our call
We believe competition from online retailers is easing but
they could initiate another round of irrational price
competition. Major institutional shareholders may exit to take
profits at a reasonable price.
Key assumptions
GOME is a leading home-appliance retailer in China with just
over 1,000 stores. GOME also sells products online, but online
revenue accounted for less than 10% of its total business in
2014. The company’s strategy is to integrate the offline
experience and services and the online retailing platform to
give customers the best shopping experience, but not simply
to compete on price.
2014E
2015E
2016E
(%)
(%)
(%)
Revenue growth
GP margin
6.0
7.0
8.0
15.4
15.5
15.6
Operating margin
2.3
2.7
3.1
Recurring net margin
2.1
2.4
2.7
Source: BNP Paribas estimates
Principal activities (2014E)
Earnings sensitivity
------ Base ------
-------- Best ------
-------- Worst -------
2014E
2015E
2014E
2015E
2014E
6.0
7.0
11.0
12.0
1.0
2.0
15.4
15.5
15.9
16.0
14.9
15.0
0.075
0.091
0.100
0.169
0.049
0.020
-
-
34.5
84.5
(34.5)
(77.8)
Revenue growth (%)
GP margin (%)
Recurring EPS (HKD)
EPS change (%)
Key executives
Source: BNP Paribas estimates
Age
Since
Title
ZHANG Dazhong
64
2011
Chairman
WANG Junzhou
51
2006
President
Wei Fang
41
2011
CFO
Yang Qing He
50
2012
Vice President
Jun Tao Li
47
2012
Vice President
44
2015E
Margin recovery to drive 17% EPS CAGR over 2015-17E.
Fundamentals are improving due to less competition and a
targeted strategy.
BNP PARIBAS
28 JANUARY 2015
GOME Electrical
493 HK
Charlie Y Chen
Financial statements
GOME Electrical
Profit and Loss (RMB m) Year Ending Dec
2012A
2013A
2014E
2015E
2016E
Revenue
51,097
56,401
59,805
63,992
69,111
Cost of sales ex depreciation
(44,276)
(47,899)
(50,609)
(54,073)
(58,330)
Gross profit ex depreciation
6,821
8,502
9,197
9,919
10,781
Other operating income
1,692
1,852
1,739
1,860
2,009
(8,875)
(8,856)
(9,052)
(9,492)
(10,047)
Operating EBITDA
(362)
1,498
1,883
2,287
2,743
Depreciation
(450)
(483)
(519)
(557)
(598)
0
0
0
0
0
(812)
1,015
1,364
1,730
2,145
18
180
232
117
159
0
0
0
0
0
34
0
0
0
0
Operating costs
Goodwill amortisation
Operating EBIT
Net financing costs
Associates
Recurring non operating income
Non recurring items
0
0
0
0
0
Profit before tax
(759)
1,195
1,596
1,847
2,303
Tax
(183)
(517)
(559)
(554)
(645)
Profit after tax
(942)
677
1,038
1,293
1,658
Minority interests
213
215
220
250
200
Preferred dividends
0
0
0
0
0
Other items
0
0
0
0
0
(728)
892
1,258
1,543
1,858
Reported net profit
Non recurring items & goodwill (net)
Recurring net profit
0
0
0
0
0
(728)
892
1,258
1,543
1,858
Per share (RMB)
Recurring EPS *
(0.04)
0.05
0.07
0.09
0.11
Reported EPS
(0.04)
0.05
0.07
0.09
0.11
0.00
0.03
0.02
0.03
0.03
DPS
Growth
Revenue (%)
(14.6)
10.4
6.0
7.0
8.0
Operating EBITDA (%)
(113.3)
(513.9)
25.7
21.4
19.9
Operating EBIT (%)
(135.3)
(225.0)
34.5
26.8
24.0
Recurring EPS (%)
nm
nm
41.0
22.7
20.4
Reported EPS (%)
(139.4)
(222.5)
41.0
22.7
20.4
Gross margin inc depreciation (%)
13.3
15.1
15.4
15.5
15.6
Operating EBITDA margin (%)
(0.7)
2.7
3.1
3.6
4.0
Operating EBIT margin (%)
(1.6)
1.8
2.3
2.7
3.1
Net margin (%)
(1.4)
1.6
2.1
2.4
2.7
Effective tax rate (%)
-
43.3
35.0
30.0
28.0
Dividend payout on recurring profit (%)
-
60.0
30.0
30.0
30.0
Interest cover (x)
-
-
-
-
-
74.0
61.0
61.6
62.4
63.1
Operating performance
Inventory days
Debtor days
1.8
1.5
1.2
1.0
1.0
Creditor days
149.8
137.5
125.2
116.2
115.6
Operating ROIC (%)
(32.1)
103.1
56.4
39.8
54.0
ROIC (%)
(5.3)
7.9
9.8
11.2
14.4
ROE (%)
(4.7)
5.8
7.8
9.2
10.4
ROA (%)
(2.5)
1.4
2.3
3.3
4.0
*Pre exceptional, pre-goodwill and fully diluted
Revenue By Division (RMB m)
2012A
2013A
2014E
2015E
2016E
Audio visual
11,752
12,408
13,157
0
-
Refrigerators and washing machines
9,197
9,588
10,167
0
-
Air conditioners
7,154
9,024
9,569
0
-
Telecommunication
8,176
8,460
8,971
0
-
Computers
5,621
6,768
7,177
0
-
Small electrical appliances
6,132
6,768
7,177
0
-
Digital
3,066
3,384
3,588
0
-
Sources: GOME Electrical; BNP Paribas estimates
45
BNP PARIBAS
28 JANUARY 2015
GOME Electrical
493 HK
Charlie Y Chen
Financial statements
GOME Electrical
Cash Flow (RMB m) Year Ending Dec
2012A
2013A
2014E
2015E
2016E
(728)
892
1,258
1,543
1,858
450
483
519
557
598
Associates & minorities
(214)
(215)
(220)
(250)
(200)
Other non-cash items
(152)
240
9
9
9
Recurring cash flow
(645)
1,401
1,566
1,860
2,266
Change in working capital
3,204
411
(3,337)
256
327
0
0
0
0
0
Capex - new investment
(812)
(436)
(499)
(533)
(575)
Free cash flow to equity
2,018
Recurring net profit
Depreciation
Capex - maintenance
1,748
1,375
(2,270)
1,583
Net acquisitions & disposals
8
0
0
0
0
Dividends paid
0
(94)
(611)
(416)
(505)
Non recurring cash flows
Net cash flow
Equity finance
(26)
108
0
0
0
1,730
1,389
(2,881)
1,167
1,513
0
0
0
0
0
Debt finance
(164)
322
(2,183)
0
0
Movement in cash
1,566
1,711
(5,064)
1,167
1,513
(0.04)
0.08
0.09
0.11
0.13
0.10
0.08
(0.13)
0.09
0.12
Per share (RMB)
Recurring cash flow per share
FCF to equity per share
Balance Sheet (RMB m) Year Ending Dec
2012A
2013A
2014E
2015E
2016E
Working capital assets
17,256
17,330
18,845
19,841
21,054
Working capital liabilities
(20,433)
(21,151)
(19,329)
(20,582)
(22,121)
Net working capital
(3,177)
(3,821)
(484)
(741)
(1,068)
Tangible fixed assets
4,379
4,095
3,842
3,818
3,794
Operating invested capital
1,202
273
3,358
3,077
2,727
Goodwill
7,161
7,145
7,145
7,145
7,145
Other intangible assets
313
289
79
69
60
Investments
124
135
135
135
135
Other assets
1,412
1,314
945
740
535
Invested capital
10,212
9,157
11,662
11,167
10,602
Cash & equivalents
(7,067)
(9,016)
(4,320)
(5,693)
(7,411)
2,434
2,683
500
500
500
5
0
0
0
0
(4,628)
(6,333)
(3,820)
(5,193)
(6,911)
171
172
172
172
172
0
0
0
0
0
15,064
15,927
16,140
17,267
18,620
Short term debt
Long term debt *
Net debt
Deferred tax
Other liabilities
Total equity
Minority interests
(395)
(610)
(830)
(1,080)
(1,280)
Invested capital
10,212
9,157
11,662
11,167
10,602
* includes convertibles and preferred stock which is being treated as debt
Per share (RMB)
Book value per share
0.89
0.94
0.96
1.02
1.10
Tangible book value per share
0.45
0.50
0.53
0.60
0.68
Net debt/equity (%)
(31.5)
(41.3)
(25.0)
(32.1)
(39.9)
Net debt/total assets (%)
(12.3)
(16.1)
(10.8)
(13.9)
(17.2)
1.1
1.1
1.2
1.2
1.3
-
-
-
-
-
2012A
2013A
2014E
2015E
2016E
Financial strength
Current ratio (x)
CF interest cover (x)
Valuation
Recurring P/E (x) *
neg
16.5
11.7
9.5
7.9
Recurring P/E @ target price (x) *
neg
29.6
21.0
17.1
14.2
Reported P/E (x)
neg
16.5
11.7
9.5
7.9
Dividend yield (%)
0.0
3.6
2.6
3.1
3.8
(22.8)
10.5
9.4
7.9
6.5
P/FCF (x)
8.4
10.7
(6.5)
9.3
7.3
Price/book (x)
1.0
0.9
0.9
0.9
0.8
Price/tangible book (x)
1.9
1.7
1.6
1.5
1.3
EV/EBITDA (x) **
(30.6)
5.8
4.7
4.0
2.7
EV/EBITDA @ target price (x) **
(66.4)
13.6
10.9
9.2
7.0
0.9
0.8
0.9
0.8
0.6
P/CF (x)
EV/invested capital (x)
* Pre exceptional, pre-goodwill and fully diluted
** EBITDA includes associate income and recurring non-operating income
Sources: GOME Electrical; BNP Paribas estimates
46
BNP PARIBAS
28 JANUARY 2015
China Consumer
Charlie Y Chen
NOTES
NOTES
\
\
\
\
\
\
\
\
\
\
47
BNP PARIBAS
28 JANUARY 2015
Charlie Y Chen
China Consumer
Disclaimers and Disclosures
APPENDIX
DISCLAIMERS AND DISCLOSURES APPLICABLE TO NON-US BROKER-DEALER(S): BNP Paribas Securities (Asia) Ltd
ANALYST(S) CERTIFICATION
Charlie Y Chen, BNP Paribas Securities (Asia) Ltd, +852 2825 1109, [email protected].
The analyst(s) or strategist(s) herein each referred to as analyst(s) named in this report certify(ies) that (i) all views expressed in this report accurately
reflect the personal view of the analyst(s) with regard to any and all of the subject securities, companies or issuers mentioned in this report; and (ii) no part
of the compensation of the analyst(s) was, is, or will be, directly or indirectly, related to the specific recommendations or views expressed by the research
analyst herein.
Analysts mentioned in this disclaimer are employed by a non-US affiliate of BNP Paribas Securities Corp., and are not registered/ qualified pursuant to NYSE
and/or FINRA regulations.
IMPORTANT DISCLOSURES REQUIRED IN THE UNITED STATES BY FINRA RULES AND OTHER JURISDICTIONS
"BNP Paribas” is the marketing name for the global banking and markets business of BNP Paribas Group. No portion of this report was prepared by BNP
Paribas Securities Corp (US) personnel, and it is considered Third-Party Affiliate research under NASD Rule 2711. The following disclosures relate to
relationships between companies covered in this research report and the BNP entity identified on the cover of this report, BNP Securities Corp., and other
entities within the BNP Paribas Group (collectively, "BNP Paribas").
The disclosure column in the following table lists the important disclosures applicable to each company that has been rated and/or recommended in this
report:
Company
Ticker
Disclosure (as applicable)
GOME Electrical
493 HK
6
Tingyi
322 HK
6
Haichang Holdings
2255 HK
Want Want China
151 HK
6
Uni-President China
220 HK
1,2,3,4
China Mengniu Dairy
2319 HK
6
Hengan
1044 HK
6
Sun Art Retail Group
6808 HK
6
China Resources Ent
291 HK
6
Biostime International
1112 HK
6
1,2,3,4
BNP Paribas represents that:
1. Within the past year, it has managed or co-managed a public offering for this company, for which it received fees.
2. It had an investment banking relationship with this company in the last 12 months.
3. It received compensation for investment banking services from this company in the last 12 months.
4. It expects to receive or intends to seek compensation for investment banking services from the subject company/ies in the next 3 months.
5. It beneficially owns 1% or more of any class of common equity securities of the subject company.
6. It makes a market in securities in respect of this company.
7. The analyst(s) or an individual who assisted in the preparation of this report (or a member of his/her household) has a financial interest position in
securities issued by this company. The financial interest is in the common stock of the subject company, unless otherwise noted.
8. The analyst (or a member of his/her household) is an officer, director, or advisory board member of this company or has received compensation from the
company.
IMPORTANT DISCLOSURES REQUIRED IN KOREA
The disclosure column in the following table lists the important disclosures applicable to each Korea listed company that has been rated and/or
recommended in this report:
Company
N/A
Ticker
N/A
Price (as of 27-Jan-2015 closing price)
N/A
Interest
N/A
The performance of obligations of the Company is directly or indirectly guaranteed by BNP Paribas Securities Korea Co. Ltd (“BNPPSK”) by means of
payment guarantees, endorsements, and provision of collaterals and/or taking over the obligations.
2. BNPPSK owns 1/100 or more of the total outstanding shares issued by the Company.
3. The Company is an affiliate of BNPPSK as prescribed by Item 3, Article 2 of the Monopoly Regulation and Fair Trade Act.
4. BNPPSK is the financial advisory agent of the Company for the Merger and Acquisition transaction or of the Target Company whereby the size of the
transaction does not exceed 5/100 of the total asset of the Company or the total number of outstanding shares.
5. BNPPSK has taken financial advisory service regarding listing to the Company within the past 1 year.
6. With regards to the tender offer initiated by the Company based on Item 2, Article 133 of the Financial Investment Services and Capital Market Act,
BNPPSK acts in the capacity of the agent for the tender offer designated either by the Company or by the target company, provided that this provision
shall apply only where tender offer has not expired.
7. The listed company which issued the stocks in question in case where 40 days has not passed since the new shares were listed from the date of entering
into arrangement for public offering or underwriting-related agreement for issuance of stocks
8. The Company that has signed a nominated advisor contract with BNPPSK as defined in Item 2 of Article 8 of the KONEX Market Listing Regulation.
9. The Company is recognized as having considerable interests with BNPPSK in relation to No.1 to No. 8.
10. The analyst or his/her spouse owns (including delivery claims of marketable securities based on legal regulations and trading and misc. contracts) the
1.
48
BNP PARIBAS
28 JANUARY 2015
Charlie Y Chen
China Consumer
following securities or rights (hereinafter referred to as “Securities, etc.” in this Article) regardless of whose name is used in the trading.
1) Stocks, bond with stock certificate, and certificate of pre-emptive rights issued by the Company whose securities dealings are being solicited.
2) Stock options of the Company whose securities dealings are being solicited.
3) Individual stock future, stock option, and warrants that use the stocks specified in Item 1) as underlying.
GENERAL DISCLAIMER
This report was produced by BNP Paribas Securities (Asia) Ltd, member company(ies) of the BNP Paribas Group.
This report is for the use of intended recipients only and may not be reproduced (in whole or in part) or delivered or transmitted to any other person without
our prior written consent. By accepting this report, the recipient agrees to be bound by the terms and limitations set forth herein.
This report does not constitute a personal recommendation or take into account the particular investment objectives, financial situations, or needs of
individual clients. Customers are advised to use the information contained herein as just one of many inputs and considerations prior to engaging in any
trading activity. This report does not constitute a prospectus or other offering document or an offer or solicitation to buy or sell any securities or other
investments. This report is not intended to provide the sole basis of any evaluation of the subject securities and companies mentioned in this report.
Information and opinions contained in this report are published for reference of the recipients and are not to be relied upon as authoritative or without the
recipient’s own independent verification, or taken in substitution for the exercise of judgment by the recipient. Additionally, the products mentioned in this
report may not be available for sale in certain jurisdictions.
As an investment bank with a wide range of activities, BNP Paribas may face conflicts of interest, which are resolved under applicable legal provisions and
internal guidelines. You should be aware, however, that BNP Paribas may engage in transactions in a manner inconsistent with the views expressed in this
document, either for its own account or for the account of its clients.
Australia: This report is being distributed in Australia by BNP Paribas Sydney Branch, registered in Australia as ABN 23 000 000 117 at 60 Castlereagh Street
Sydney NSW 2000. BNP Paribas Sydney Branch is licensed under the Banking Act 1959 and the holder of Australian Financial Services Licence no. 238043 and
therefore subject to regulation by the Australian Securities & Investments Commission in relation to delivery of financial services. By accepting this document
you agree to be bound by the foregoing limitations, and acknowledge that information and opinions in this document relate to financial products or financial
services which are delivered solely to wholesale clients (in terms of the Corporations Act 2001, sections 761G and 761GA; Corporations Regulations 2001,
division 2, reg. 7.1.18 & 7.1.19) and/or professional investors (as defined in section 9 of the Corporations Act 2001).
Canada: The information contained herein is not, and under no circumstances is to be construed as, a prospectus, an advertisement, a public offering, an
offer to sell securities described herein, or solicitation of an offer to buy securities described herein, in Canada or any province or territory thereof. Any offer
or sale of the securities described herein in Canada will be made only under an exemption from the requirements to file a prospectus with the relevant
Canadian securities regulators and only by a dealer properly registered under applicable securities laws or, alternatively, pursuant to an exemption from the
dealer registration requirement in the relevant province or territory of Canada in which such offer or sale is made. The information contained herein is under
no circumstances to be construed as investment advice in any province or territory of Canada and is not tailored to the needs of the recipient. To the extent
that the information contained herein references securities of an issuer incorporated, formed or created under the laws of Canada or a province or territory
of Canada, any trades in such securities must be conducted through a dealer registered in Canada. No securities commission or similar regulatory authority in
Canada has reviewed or in any way passed judgment upon these materials, the information contained herein or the merits of the securities described herein,
and any representation to the contrary is an offence.
Hong Kong: This report is prepared for professional investors and is being distributed in Hong Kong by BNP Paribas Securities (Asia) Limited to persons whose
business involves the acquisition, disposal or holding of securities, whether as principal or agent. BNP Paribas Securities (Asia) Limited, a subsidiary of BNP
Paribas, is regulated by the Securities and Futures Commission for the conduct of dealing in securities, advising on securities, providing automated trading
services, dealing in futures contacts and advising on corporate finance. For professional investors in Hong Kong, please contact BNP Paribas Securities (Asia)
Limited for all matters and queries relating to this report.
India: In India, this document is being distributed by BNP Paribas Securities India Pvt. Ltd. ("BNPPSIPL"), having its registered office at 5th floor, BNP Paribas
House, 1 North Avenue, Maker Maxity, Bandra Kurla Complex, Bandra (East), Mumbai 400 051, INDIA (Tel. no. +91 22 3370 4000 / 6196 4000 / Fax no. +91 22
6196 4363). BNPPSIPL is registered with the Securities and Exchange Board of India (“SEBI”) as a stockbroker in the Equities and the Futures & Options
segments of National Stock Exchange of India Ltd. and BSE Ltd. (SEBI Regn. Nos.: INB/INF231474835, INB/INF011474831 ; CIN: U74920MH2008FTC182807;
Website: www.bnpparibas.co.in).
Indonesia: This report is being distributed by PT BNP Paribas Securities Indonesia and is delivered by its licensed employee(s), including marketing/sales
person, to its client. PT BNP Paribas Securities Indonesia, having its registered office at Menara BCA, 35th floor, Grand Indonesia, JL. M.H. Thamrin No.1,
Jakarta 10310, Indonesia, is a subsidiary company of BNP Paribas SA and licensed under Capital Market Law no. 8 year 1995, a holder of broker-dealer and
underwriter licenses issued by the Capital Market and Financial Institution Supervisory Agency (now Otoritas Jasa Keuangan/OJK). PT BNP Paribas Securities
Indonesia is also a member of Indonesia Stock Exchange and supervised by Otoritas Jasa Keuangan (OJK). Neither this report nor any copy hereof may be
distributed in Indonesia or to any Indonesian citizens except in compliance with applicable Indonesian capital market laws and regulations. This report is not
an offer of securities in Indonesia and may not be distributed within the territory of the Republic of Indonesia or to Indonesian citizens in circumstance which
constitutes an offering within the meaning of Indonesian capital market laws and regulations.
Japan: This report is being distributed to Japanese based firms by BNP Paribas Securities (Japan) Limited or by a subsidiary or affiliate of BNP Paribas not
registered as a financial instruments firm in Japan, to certain financial institutions defined by article 17-3, item 1 of the Financial Instruments and Exchange
Law Enforcement Order. BNP Paribas Securities (Japan) Limited is a financial instruments firm registered according to the Financial Instruments and
Exchange Law of Japan and a member of the Japan Securities Dealers Association, the Financial Futures Association of Japan and the Type II Financial
Instruments Firms Association. BNP Paribas Securities (Japan) Limited accepts responsibility for the content of a report prepared by another non-Japan
affiliate only when distributed to Japanese based firms by BNP Paribas Securities (Japan) Limited. Some of the foreign securities stated on this report are not
disclosed according to the Financial Instruments and Exchange Law of Japan.
Malaysia: This report is issued and distributed by BNP Paribas Capital (Malaysia) Sdn Bhd. The views and opinions in this research report are our own as of
the date hereof and are subject to change. BNP Paribas Capital (Malaysia) Sdn Bhd has no obligation to update its opinion or the information in this research
report. This publication is strictly confidential and is for private circulation only to clients of BNP Paribas Capital (Malaysia) Sdn Bhd. This publication is
being provided to you strictly on the basis that it will remain confidential. No part of this material may be (i) copied, photocopied, duplicated, stored or
reproduced in any form by any means or (ii) redistributed or passed on, directly or indirectly, to any other person in whole or in part, for any purpose
without the prior written consent of BNP Paribas Capital (Malaysia) Sdn Bhd.
Philippines: This report is being distributed in the Philippines by BNP Paribas Manila Branch, an Offshore Banking Unit (OBU) of BNP Paribas whose head
office is in Paris, France. BNP Paribas Manila OBU is registered as an offshore banking unit under Presidential Decree No. 1034 (PD 1034), and regulated by
the Bangko Sentral ng Pilipinas. This report is being distributed in the Philippines to qualified clients of OBUs as allowed under PD 1034, and is qualified in its
entirety to the products and services allowed under PD 1034.
Singapore: This report is distributed in Singapore by BNP Paribas Securities (Singapore) Pte Ltd ("BNPPSSL") and may be distributed in Singapore only to an
Accredited or Institutional Investor, each as defined under the Financial Advisers Regulations ("FAR") and the Securities and Futures Act (Chapter 289) of
Singapore, as amended from time to time. In relation to the distribution to such categories of investors, BNPPSSL and its representatives are exempted under
Regulation 35 of the FAR from the requirements in Section 36 of the Financial Advisers Act of Singapore, regarding the disclosure of certain interests in, or
certain interests in the acquisition or disposal of, securities referred to in this report. For Institutional and Accredited Investors in Singapore, please contact
BNP Paribas Securities (Singapore) Ptd Ltd (company registration number: 199801966C; address: 10 Collyer Quay, 34/F Ocean Financial Centre, Singapore
049315; tel: (65) 6210 1288; fax: (65) 6210 1980) for all matters and queries relating to this report.
South Africa: In South Africa, BNP Paribas Cadiz Securities (Pty) Ltd and BNP Paribas Cadiz Stock Broking (Pty) Ltd (hereinafter referred to as “BNPP Cadiz”)
are licensed members of Johannesburg Stock Exchange and are authorised Financial Services Providers and subject to regulation by the Financial Services
Board. BNPP Cadiz does not expressly or by implication represent, recommend or propose that the financial products referred to in this report are
49
BNP PARIBAS
28 JANUARY 2015
Charlie Y Chen
CHINA CONSUMER
appropriate to the particular investment objectives, financial situation or particular needs of the recipient.
South Korea: BNP Paribas Securities Korea is registered as a Licensed Financial Investment Business Entity under the FINANCIAL INVESTMENT SERVICES AND
CAPITAL MARKETS ACT and regulated by the Financial Supervisory Service and Financial Services Commission. This document does not constitute an offer to
sell to or the solicitation of an offer to buy from any person any financial products where it is unlawful to make the offer or solicitation in South Korea.
Switzerland: This report is intended solely for customers who are “Qualified Investors” as defined in article 10 paragraphs 3 and 4 of the Swiss Federal Act
on Collective Investment Schemes of 23 June 2006 (CISA) and the relevant provisions of the Swiss Federal Ordinance on Collective Investment Schemes of 22
November 2006 (CISO). “Qualified Investors” includes, among others, regulated financial intermediaries such as banks, securities dealers, fund management
companies and asset managers of collective investment schemes, regulated insurance companies as well as pension funds and companies with professional
treasury operations. This document may not be suitable for customers who are not Qualified Investors and should only be used and passed on to Qualified
Investors. For specification purposes, a “Swiss Corporate Customer” is a Client which is a corporate entity, incorporated and existing under the laws of
Switzerland and which qualifies as “Qualified Investor” as defined above." BNP Paribas (Suisse) SA is authorised as bank and as securities dealer by the Swiss
Federal Market Supervisory Authority FINMA. BNP Paribas (Suisse) SA is registered at the Geneva commercial register under No. CH-270-3000542-1. BNP
Paribas (Suisse) SA is incorporated in Switzerland with limited liability. Registered Office: 2 place de Hollande, CH-1204 Geneva.
Taiwan: Information on securities that trade in Taiwan is distributed by BNP Paribas Securities (Taiwan) Co., Ltd. Such information is for your reference only.
The reader should independently evaluate the investment risks and is solely responsible for their investment decision. Information on securities that do not
trade in Taiwan is for informational purposes only and is not to be construed as a recommendation or a solicitation to trade in such securities. BNP Paribas
Securities (Taiwan) Co., Ltd. may not execute transactions for clients in these securities. This publication may not be distributed to the public media or
quoted or used by the public media without the express written consent of BNP Paribas.
Thailand: Research relating to Thailand and Thailand based issuers is produced pursuant to an arrangement between BNP PARIBAS (“BNPP”) and Finansia
Syrus Securities Public Company Limited (“FSS”). FSS International Investment Advisory Securities Co Ltd (“FSSIA”) prepares and distributes research under
the brand name “BNP PARIBAS/FSS”. BNPP is not an affiliate of FSSIA or FSS. FSS also publishes a different research product under the brand name
“FINANSIA SYRUS,” which is prepared by research analysts who are not part of FSSIA and who may cover the same securities, issuers, or industries that are
the subject of this report. The ratings, recommendations, and views expressed in this report may differ from the ratings, recommendations, and views
expressed by other research analysts or research teams employed by FSS. This report is being distributed outside Thailand by members of BNP Paribas.
Turkey: This report is being distributed in Turkey by TEB Investment (TEB YATIRIM MENKUL DEGERLER A.S., Teb Kampus D Blok Saray Mah. Kucuksu Cad.
Sokullu Sok., No:7 34768 Umraniye, Istanbul, Turkey, Trade register number: 358354, www.tebyatirim.com.tr) and outside Turkey jointly by TEB Investment
and BNP Paribas. Information, comments and suggestions on investment given in this material are not within the scope of investment consulting. The
investment consulting services are rendered tailor made for individuals by competent authorities considering the individuals risk and return preferences.
However the comments and recommendations herein are based on general principles. These opinions may not be consistent with your financial status as
well as your risk and return preferences. Therefore, making an investment decision only based on the information provided herein may not bear
consequences in parallel with your expectations. This material issued by TEB Yatırım Menkul Değerler A.Ş. for information purposes only and may be
changed without any prior notification. All rights reserved. No part of this material may be copied or reproduced in any manner without the written consent
of TEB Yatırım Menkul Değerler A.Ş. Although TEB Yatırım Menkul Değerler A.Ş. gathers the presented material that is current as possible, it does not
undertake that all the information is accurate or complete, nor should it be relied upon as such. TEB Yatırım Menkul Değerler A.Ş. assumes no responsibility
whatsoever in respect of or arising out or in connection with the content of this material to third parties. If any third party chooses to use the content of this
material as reference, he/she accepts and approves to do so entirely at his/her own risk.
United States: This report may be distributed in the United States only to U.S. Persons who are “major U.S. institutional investors” (as such term is defined in
Rule 15a-6 under the Securities Exchange Act of 1934, as amended) and is not intended for the use of any person or entity that is not a “major U.S.
institutional investor”. U.S persons who wish to effect transactions in securities discussed herein must do so through BNP Paribas Securities Corp., a USregistered broker dealer and member of FINRA, SIPC, NFA, NYSE and other principal exchanges.
Certain countries within the European Economic Area: This document may only be distributed in the United Kingdom to eligible counterparties and
professional clients and is not intended for, and should not be circulated to, retail clients (as such terms are defined in the Markets in Financial Instruments
Directive 2004/39/EC (“MiFID”)). This document will have been approved for publication and distribution in the United Kingdom by BNP Paribas London
Branch, a branch of BNP Paribas SA whose head office is in Paris, France. BNP Paribas SA is incorporated in France with limited liability with its registered
office at 16 boulevard des Italiens, 75009 Paris. BNP Paribas London Branch (registered office: 10 Harewood Avenue, London NW1 6AA; tel: [44 20] 7595 2000;
fax: [44 20] 7595 2555) is lead supervised by the European Central Bank (ECB) and the Autorité de Contrôle Prudentiel et de Résolution (ACPR). BNP Paribas
London Branch is authorised by the ACPR and the Prudential Regulation Authority (PRA) and subject to limited regulation by the Financial Conduct Authority
and PRA. Details about the extent of our authorisation and regulation by the PRA, and regulation by the Financial Conduct Authority are available from us on
request. This report has been approved for publication in France by BNP Paribas, a credit institution licensed as an investment services provider by the ACPR
whose head office is 16, Boulevard des Italiens 75009 Paris, France. This report is being distributed in Germany either by BNP Paribas London Branch or by
BNP Paribas Niederlassung Frankfurt am Main, regulated by the Bundesanstalt für Finanzdienstleistungsaufsicht (BaFin).
Other Jurisdictions: The distribution of this report in other jurisdictions or to residents of other jurisdictions may also be restricted by law, and persons into
whose possession this report comes should inform themselves about, and observe, any such restrictions. By accepting this report you agree to be bound by
the foregoing instructions. This report is not directed to, or intended for distribution to or use by, any person or entity that is a citizen or resident of or
located in any locality, state, country, or other jurisdiction where such distribution, publication, availability or use would be contrary to law or regulation.
All research reports are disseminated and available to all clients simultaneously through our internal client websites. For all research available on a
particular stock, please contact the relevant BNP Paribas research team or the author(s) of this report.
’
Additional Disclosures
Target price history, stock price charts, valuation and risk details, and equity rating histories applicable to each company rated in this report is available in
our most recently published reports available on our website: http://eqresearch.bnpparibas.com, or you can contact the analyst named on the front of this
note or your BNP Paribas representative.
All share prices are as at market close on 27 January 2015 unless otherwise stated.
50
BNP PARIBAS
28 JANUARY 2015
Charlie Y Chen
CHINA CONSUMER
RECOMMENDATION STRUCTURE
Stock Ratings
Stock ratings are based on absolute upside or downside, which we define as (target price* - current price) / current price.
BUY (B). The upside is 10% or more.
HOLD (H). The upside or downside is less than 10%.
REDUCE (R). The downside is 10% or more.
Unless otherwise specified, these recommendations are set with a 12-month horizon. Thus, it is possible that future price volatility may cause a
temporary mismatch between upside/downside for a stock based on market price and the formal recommendation.
* In most cases, the target price will equal the analyst's assessment of the current fair value of the stock. However, if the analyst doesn't think the market will
reassess the stock over the specified time horizon due to a lack of events or catalysts, then the target price may differ from fair value. In most cases, therefore, our
recommendation is an assessment of the mismatch between current market price and our assessment of current fair value.
Industry Recommendations
Improving (é): The analyst expects the fundamental conditions of the sector to be positive over the next 12 months.
Stable (previously known as Neutral) (çè): The analyst expects the fundamental conditions of the sector to be maintained over the next 12
months.
Deteriorating (ê): The analyst expects the fundamental conditions of the sector to be negative over the next 12 months.
Country (Strategy) Recommendations
Overweight (O). Over the next 12 months, the analyst expects the market to score positively on two or more of the criteria used to determine
market recommendations: index returns relative to the regional benchmark, index sharpe ratio relative to the regional benchmark and index
returns relative to the market cost of equity.
Neutral (N). Over the next 12 months, the analyst expects the market to score positively on one of the criteria used to determine market
recommendations: index returns relative to the regional benchmark, index sharpe ratio relative to the regional benchmark and index returns
relative to the market cost of equity.
Underweight (U). Over the next 12 months, the analyst does not expect the market to score positively on any of the criteria used to determine
market recommendations: index returns relative to the regional benchmark, index sharpe ratio relative to the regional benchmark and index
returns relative to the market cost of equity.
RATING DISTRIBUTION (as at 27 January 2015)
Total BNP Paribas coverage universe
687
Investment Banking Relationship
(%)
Buy
345
Buy
8.70
Hold
253
Hold
4.30
89
Reduce
1.10
Reduce
Should you require additional information concerning this report please contact the relevant BNP Paribas research team or the author(s) of this report.
© 2015 BNP Paribas Group
51
BNP PARIBAS
28 JANUARY 2015
HONG KONG
BEIJING
BANGKOK
BNP Paribas (China) Ltd
Beijing Branch
Room 2001, 20/F
China World Tower
1 Jianguomenwai Avenue
Beijing, China
Tel: +86-10-6535 0888
Fax: +86-10-6535 0883
BNP Paribas Equities (Asia) Ltd
Shanghai Representative Office
Room 2630, 26/F
Shanghai World Financial Center
100 Century Avenue
Shanghai 200120, China
Tel (86 21) 6096 9000
Fax (86 21) 6096 9018
JAKARTA
BNP Paribas Securities (Asia) Ltd
63/F, Two International Finance Centre
8 Finance Street, Central
Hong Kong SAR
China
Tel (852) 2825 1888
Fax (852) 2845 9411
(In cooperation with BNP Paribas)
FSS International Investment Advisory
Securities Co., Ltd
990 Abdulrahim Place, 12/F, Room 1210
Rama IV Road, Bangrak
Bangkok 10500
Thailand
Tel (66 2) 611 3500
Fax (66 2) 611 3551
PT BNP Paribas Securities Indonesia
Grand Indonesia, Menara BCA, 35/F
JI. M.H. Thamrin No. 1
Jakarta 10310
Indonesia
Tel (62 21) 2358 6586
Fax (62 21) 2358 7587
KUALA LUMPUR
MUMBAI
BNP Paribas Capital (Malaysia) Sdn Bhd
Vista Tower, Level 48C
The Intermark, 182 Jalan Tun Razak
50400 Kuala Lumpur
Malaysia
Tel (60 3) 2179 6222
Fax (60 3) 2179 6226
TOKYO
SHANGHAI
SEOUL
BNP Paribas Securities India Pvt Ltd
BNP Paribas House
1 North Avenue, Maker Maxity
Bandra Kurla Complex
Bandra East
Mumbai 400 051
Tel (91 22) 3370 4000
Fax (91 22) 3370 4386
SINGAPORE
TAIPEI
BNP Paribas Securities Korea Co Ltd
25/F, State Tower Namsan
100 Toegye-Ro
Jung-Gu, Seoul 100-052
Tel (82 2) 2125 0500
Fax (82 2) 2125 0593
BNP Paribas Securities
(Singapore) Pte Ltd
(Co. Reg. No. 199801966C)
10 Collyer Quay
34/F Ocean Financial Centre
Singapore 049315
Tel (65) 6210 1288
Fax (65) 6210 1980
BNP Paribas Securities
(Taiwan) Co Ltd
72/ F, Taipei 101
No. 7 Xin Yi Road, Sec. 5
Taipei, Taiwan
Tel (886 2) 8729 7000
Fax (886 2) 8101 2168
CAPE TOWN
ISTANBUL
NEW YORK
BASEL
TEB Investment
(A JV between TEB Bank and BNP Paribas)
TEB Kampus D7 Saray Mahallesi
Sokullu Sok No 7
Umraniye 34768 Istanbul
Turkey
Tel: (90 216) 636 44 44
Fax: (90 216) 631 44 00
BNP Paribas
The Equitable Tower
787 Seventh Avenue
New York
NY 10019, USA
Tel (1 212) 841 3800
Fax (1 212) 841 3810
BNP Paribas
Aeschengraben 26
CH 4002 Basel
Switzerland
Tel (41 61) 276 5555
Fax (41 61) 276 5514
BNP Paribas Securities (Japan) Ltd
GranTokyo North Tower
1-9-1 Marunouchi, Chiyoda-Ku
Tokyo 100-6740
Japan
Tel (81 3) 6377 2000
Fax (81 3) 5218 5970
BNP Paribas Cadiz Securities (Pty) Ltd
Ground floor, Fernwood House
The Oval, 1 Oakdale Road, Newlands
Cape Town
South Africa 7700
Tel (27 21) 657 8300
Fax (27 21) 657 8301
FRANKFURT
GENEVA
LONDON
MADRID
BNP Paribas
Mainzer Landstrasse 16
60325 Frankfurt
Germany
Tel (49 69) 7193 6637
Fax (49 69) 7193 2520
BNP Paribas
2 Place de Hollande
1211 Geneva 11
Switzerland
Tel (41 22) 787 7377
Fax (41 22) 787 8020
BNP Paribas
10 Harewood Avenue
London NW1 6AA
UK
Tel (44 20) 7595 2000
Fax (44 20) 7595 2555
MILAN
BNP Paribas SA, sucursal en Espana
Hermanos Becquer 3
PO Box 50784
28006 Madrid
Spain
Tel (34 91) 745 9000
Fax (34 91) 745 8888
BNP Paribas Equities Italia SIM SpA
Piazza San Fedele, 2
20121 Milan
Italy
Tel (39 02) 72 47 1
Fax (39 02) 72 47 6562
PARIS
ZURICH
MANAMA
BNP Paribas Equities France
Société de Bourse
20 boulevard des Italiens
75009 Paris
France
Tel (33 1) 4014 9673
Fax (33 1) 4014 0066
BNP Paribas
Talstrasse 41
8022 Zurich
Switzerland
Tel (41 1) 229 6891
Fax (41 1) 267 6813
BNP Paribas Bahrain
PO Box 5253
Manama
Bahrain
Tel (973) 53 3978
Fax (973) 53 1237
https://eqresearch.bnpparibas.com
.
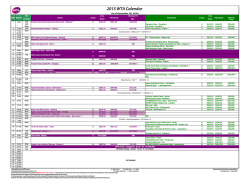
© Copyright 2026