
1736
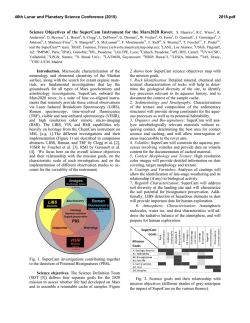
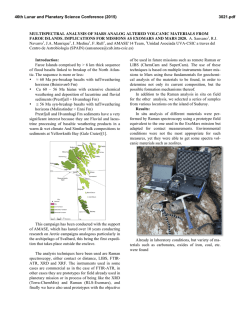
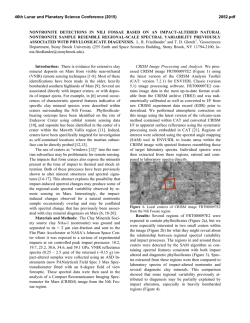
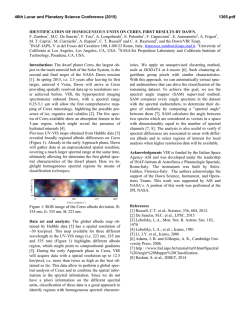
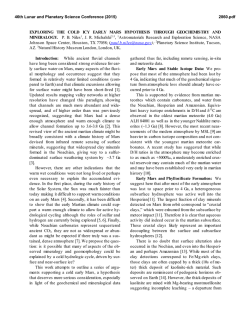
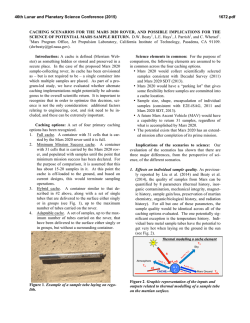
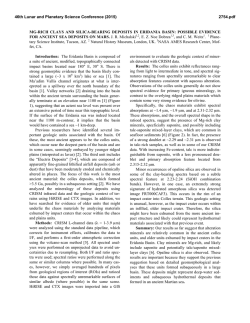
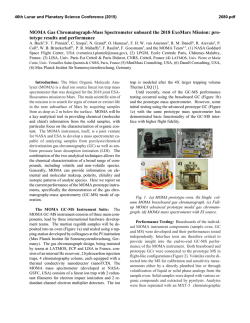
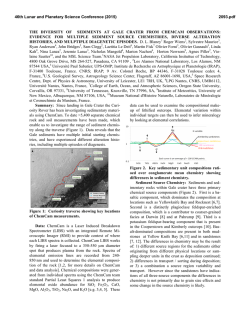
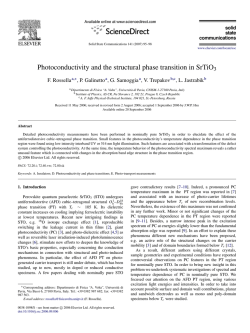
46th Lunar and Planetary Science Conference (2015)
1736.pdf
The Infrared Investigation on the SuperCam Instrument for the Mars2020 Rover. T. Fouchet1, F. Montmes2
3
3
4
5
1
6
7
sin , O. Forni , S. Maurice , R.C. Wiens , J.R. Johnson , S.M. Clegg , P. Beck , F. Poulet , O. Gasnault3, P.-Y. Mes1
2
3
lin , and the SuperCam Team. Observatoire de Paris, LESIA, Meudon ([email protected]); LATMOS,
3
4
5
6
7
Paris; IRAP, Toulouse; LANL; APL/JHU; IPAG, Grenoble; IAS, Orsay.
Introduction: The Mars2020 Science Definition
The Mars2020 rover will bring down this spatial resoTeam (SDT) has highlighted the need for both context
lution to 1.3 mm at 2 m distance from the rover to
and fine-scale mineralogy to address the Mission Scicompletely identify the mineralogy of outcrops, and to
ence Objectives A and B of deciphering the geological
determine the occurrence and distribution of various
processes and history of an astrobiologicaly relevant
minerals within the scene. In synergy with context
ancient environment on Mars, and assessing the biimaging, this will allow to better understand the forosignature preservation potential of this environment.
mation and alteration of the landing site, and particiThe SDT particularly emphasized the need for this
pate to the selection of potential biominerals and
l
SuperCam
mineralogy measurement to be nested and co-aligned
cached samples. Moreover, SuperCam LIBS will parwith context imaging and fine-scale elemental chemistially clear away dust coatings on surfaces within the
ely long integration
time. The pulsed laser approach makes the resulting
spectra far
try.
IR FOV to maximize the infrared spectroscopy identio high fluorescence and
ambient
light
backgrounds.
SuperCam on Mars 2020 is a suite of four instrufication power.
Cam’s Raman instrument will also detect and identify organic materials by their ments that provide these critical observations via Laser
Scientific requirements:
fluorescence spectra over 534-900 nm (e.g., [69,70]). Organic and biological
Induced Breakdown Spectroscopy (LIBS), Raman
Wavelength range. The LIBS laser operates at 1064
oduce fluorescence both with UV and visible laser excitation with very
short
spectroscopy [1], visible and near-infrared spectrosconm on SuperCam, capitalizing on ChemCam’s high
1 ns to 200 ns; e.g., [70-74]). Our time-resolved instrument will be able to
(VISIR), andfrom
high resolution
color imaging,
all co-minerals
heritage
telescope design rejecting the laser light. By
ort-lived organicpyfluorescence
that of longer-lived
(µs-ms)
and rocks
aligned
and
at
micro-radian
angular
resolution.
Here
operating
s identifying targets that have biological molecules embedded in them. In the
theinstrument in passive mode (no laser)
we
describe
the
scientific
objectives,
the
technical
imthis
will
allow
ological materials, SuperCam Raman will not have interference from short-lived collection of data in the ~0.4-0.9 µm
wavelength range to assist in the identification of ironbackgrounds. plementation and performances of the SuperCam infrared investigation.
bearing minerals [12].
le and Infrared Spectroscopy
Scientific Rationale: Orbital inFig.1 Mineral signatures within
spectroscopy tofrared
~2.6spectroscopy
µm has demonstrated
its
has completely
the SuperCam IR range. Data from
pability in the revolutionized
detection andouridentification
of
concept of the
CRISM [13].
ses through characteristic
absorption
features
Martian history and particularly
The SuperCam IR spectrometer
ectronic processes,
vibrational
and/or
demonstrated
thestretching
presence in
the
has been designed to work in the
aracteristic molecular
bounds
(e.g.,
[75-77]).
The
past of persistent liquid water at or
1.3-2.6 µm wavelength range to
wavelength range
µm,
1.3–2.6
near(0.3–0.9
the surface
of the
planet. µm)
Inidentify the following minerals : i)
identification ofdeed,
mostthe
minerals
to
be
found
in
the
two infrared instruments,
Ortho- and chain silicates through
cal record [78] (Fig.
D.2.1.3-1):
OMEGA on board the Mars Express
Fe-related crystal field bands
nd hydroxides characterized
by
a
large
absorption
spacecraft, and CRISM on board the
around 1.0 and 2.0 µm, the latter
ge transfer extending
from
the
ultraviolet
to
NIR
MRO
spacecraft have definitively
discriminating pyroxene from oliow features of identified
Fe3+ transitions
(0.65/0.85
µm)
phyllosilicates [2,3], sulvine; ii) hydrated silicates (mostly
hemCam passive spectra [4];
fates [4,5], carbonates
[6], and zeoand chain silicates
through Fe2+ transitions
that
phyllosilicates), through the first
lites [7,8]. Orbital infrared spectrose absorption bands
around 1.0 and 2.0 µm, the
harmonics of the fundamental vibracopy has
also its
been
very successful
nates pyroxene from
olivine;
position
strongly
tional mode of hydroxyl radical OH
in identifying
various[79,80];
igneous mine crystal chemistry
of the pyroxene
(1.4 µm) and through the transverse
erals [9],
mostly within
mafic
icates (phyllosilicates,
smectite),
through
therocks
first
vibrational modes of Al-OH (2.2
with
low silica mode
contents,
but also
the fundamental
vibrational
of hydroxyl
µm), Mg/Fe-OH (2.28-2.35 µm) and
some rare
of anorthosites
1.4 µm) and through
theexamples
transverse
vibrational
SiOH (2.20-2.5 µm) ; iii) sulfates
Infrared
is also
OH (2.2 µm) and[10].
Mg-OH
(2.3 spectroscopy
µm), [81,82];
(mono- and polyhydrated) through
very sensitive
to organics,
even if
(mono- and polyhydrated)
through
combinations
combinations and overtones of OH–
none
have
been
detected
so
far
on
es of OH– or H2O bending and stretching
or H2O bending and stretching funthe and
surface
Mars
this tech(1.4 µm, 1.9 µm)
3ν3of
(SO
overtone
(2.4
4)2–using
damentals (1.4 µm, 1.9 µm) and
nique. Finally, atmospheric dust,
3ν3(SO4)2–overtone (2.4 µm) ; iv)
Fig.
D.2.1.3-1.
Mars
mineral
CO2 andand
H2Ocombinations
clouds can be of
efficiently
tes through overtones
C-O detected and
carbonates
through overtones and combinations of C-O
signatures
over
the
SuperCam
monitored
[11].
d bending vibrations
(3ν3 atatinfrared
2.3 µmwavelengths
and (ν1 +2ν
3)
stretching
and bending vibrations (3ν3 at 2.3 µm and
IR range;thedata from
CRISM
have globally
The wavelengths ofOrbital
their instruments
minima identify
majorcharacterized
(νalso
[78].
SuperCam
1 +2νcovers
3) at 2.5 µm), v) complex organic compounds
ydrous carbonatesmineralogy
with mostly
Mg
exhibit
minima
of the
Martian
surface,
but have been limfrom absorptions at 1.7 and 2.3-2.5 µm due to various
the 0.4-0.9 µm range.
velengths than those
with
mostly
and Fe to
[87].
ited in
their
spatialCa
resolution
> 20 meters per pixel.
dition, VISIR spectroscopy might provide a tool to identify complex organic
om absorptions at 1.7 and 2.3-2.5 µm due to various combinations of CH2 and CH3
nd symmetric stretch [88].
Cam records atmospheric CO2, CO, H2O, O2 (IR and 700-850 nm) and O3 (UV).
tral range is used to measure scattered light diagnostic of aerosol size distribution,
and opacity. These measurements will be made by fitting the observed sky radiance
46th Lunar and Planetary Science Conference (2015)
combinations of CH2 and CH3 asymmetric and symsymmetric stretch.
Spectral resolution and signal-to-noise ratio.
These two requirements are closely intertwined in
the need to fully resolve the absorption bands and
determine accurately their center position to discriminate the structure of various minerals. Following [14], we chose to set a constant 30 cm-1 FWHM
within the full spectral range (i.e. 5 nm at 1.3 µm,
10 nm at 1.82 µm, and 20 nm at 2.6 µm), while
achieving a SNR of 100:1 for a solar zenith angle of
30° at Mars aphelion on 0.3 lambertian albedo in 150
ms of integration per spectral element.
Spatial resolution: To capitalize on the ChemCam
heritage, the telescope and the optical fiber design will
remain identical in SuperCam. This design sets an angular FOV of 0.67 mrad for the IR spectrometer, translating to a spatial FOV of 6.7 cm at 10 meters, within
the SDT requirements for context mineralogy and 1.3
mm at 2 meters, close to the 0.5 mm SDT requirement
for fine scale mineralogy.
Calibration Accuracy: The IR spectrometer must
account for time-dependent, wavelength-dependent
variations in solar illumination as it is filtered by atmospheric aerosols and gases. To prevent artifacts
from this variable environment to affect the mineralogical identification enabled by the high SNR, a calibration target mounted on the deck of the rover will realize a relative calibration accuracy of 1% in radiance.
Investigation design: The SuperCam IR spectrometer is based on the SPICAM-IR spectrometer on Mars
Express [15]. It is an independent device, linked to the
telescope objective by a 300 µm core fiber (length < 20
cm, ChemCam connectors, multi-mode fiber, 0.12 numerical aperture). This optical fiber link requires the
IR spectrometer to be mounted on the Mast Unit to
maximize the transmission. A radio-frequency (RF)
signal drives a transducer, which is attached to the side
of an Acousto-Optical Tunable Filter (AOTF). Thus,
for each frequency of the piezo, a single wavelength is
selected and scattered by ±4° (2 polarizations). The
main beam is rejected, while both polarizations are
registered by two HgCdTe (MCT) photodiodes and
summed (Fig. 2). These MCTs are packaged with a
triple-stage TEC. The spectrometer is mounted directly
on the SuperCam Optical Box to passively minimize
its temperature. The detector TEC can lower the photodiode temperature up to 70°C below that of the spectrometer (verified in the laboratory), although a smaller
delta is required usually. The RF driver is designed to
independently address 256 wavelengths equally spaced
at 15 cm-1 to achieve the Nyquist sampling of the
AOTF 30-cm-1 spectral window.
Design du spectro IR
1736.pdf
Thermal strap
to thermal I/F
RF driver
Detector
front-end
electronics
Fig.2 IR spectrometer optical path
Considering the heritage
and the simplicity of the
17
design, the IR spectrometer provides extremely valuable science, especially at far distances, using minimal
resources (mass of 600 g and volume of 140×56×45
mm3, see Fig. 3).
Fig. 3: Mechanical design of IR spectrometer
The spectral scanning flexibility of the SuperCam
IR spectrometer will allow various operation modes.
The scan mode will perform 30° exploration in azimuth of limited spectral bands to explore the mineralogical diversity of the scene, while raster and fine
scale modes will explore the full spectral range of specific targets.
References: [1] Clegg S.M. et al (2015), this meeting. [2] Poulet F. et al. 2005. Nature 438, 623.
[3] Mustard J.F. et al. (2008) Nature 454, 309.
[4] Gendrin A. et al. (2005). Science 307, 1587.
[5] Carter J. (2013) JGR 118, 831. [6] Ehlmann B.L. et
al. (2008) Science 322, 1828. [7] Ehlmann B.L. et al.
(2009) JGR 114, E00D08. [8] Loizeau D. et al. (2012)
Icarus 219, 476. [9] Mustard J.F. et al. (2005). Science
307, 1594. [10] Carter J. and Poulet F. (2013). Nature
Geoscience 6, 1008. [11] Wolff M. et al. (2015) in The
Atmosphere and Climate of Mars. Cambridge University Press. [12] Johnson J.R. et al. (2015) Icarus,
http://dx.doi.org/10.1016/j.icarus.2014.02.028.
[13]
Ehlmann B.L. and Edwards, C. (2014) AREPS 42, 291.
[14] Swayze G.A. et al (2003) JGR 108, 5105. [15]
Bertaux J.-L. et al. (2000) PSS 48, 1303.
© Copyright 2026