
EXPLORING SOURCES OF EXOGENIC MATERIAL ON CERES. L
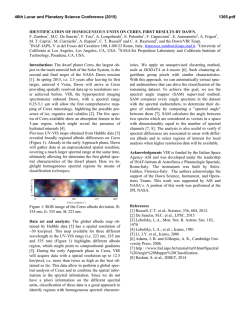
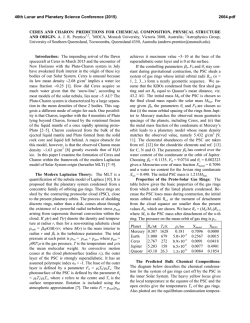
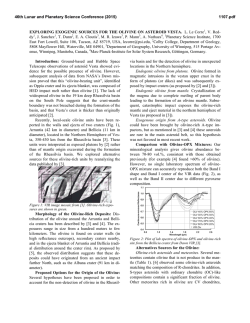
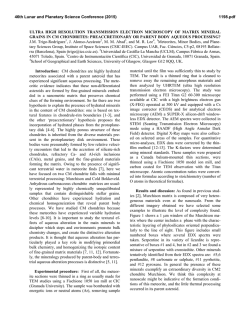
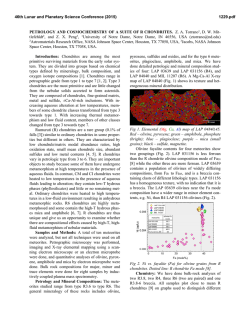
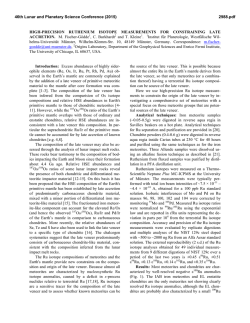
46th Lunar and Planetary Science Conference (2015)
1431.pdf
EXPLORING SOURCES OF EXOGENIC MATERIAL ON CERES. L. Le Corre1, V. Reddy1, W. F. Bottke2,
M. Dykhuis3, A. Nathues4, 1Planetary Science Institute, Tucson, Arizona, [email protected], 2 SwRI, Boulder, Colorado, 3Lunar and Planetary Lab., Univ. of Arizona, Tucson, Arizona, 4Max-Planck-Institute for Solar System Research, Göttingen, Germany.
Introduction: Dwarf planet Ceres is the largest
and the most massive object in the main asteroid belt.
Liquid water or water ice is thought to dominate its
mantle while its surface is most probably aqueously
altered (e.g., [1] and [2]). Surface albedo or compositional variations on the surface of Ceres were observed
using Hubble Space Telescope (HST) data [3], and [2]
showed that spectral properties of Ceres vary with rotational phase. However, the surface composition of
Ceres is not well constrained from ground-based and
space-based telescopes observations. NASA’s Dawn
mission will enter orbit around Ceres in April 2015 to
characterize its surface and understand its internal
structure and origin.
On Vesta, Dawn discovered exogenic material in
the form of remnant carbonaceous [4] and possibily
ordinary chondrite [5] impactors. These exogenic terrains have albedo and spectral properties that were
distinct from Vestan material enabling their easy identification using Dawn Framing Camera (FC) color filter and VIR data. Evidence from the study of HED
meteorites also supported the presence of exogenic
material on Vesta. In contrast, there are no known meteorites from Ceres and our ability to predict what exogenic material we might find on Ceres is limited.
Possible Hypothesis: In an effort to predict what
exogenic material one might find on Ceres, we looked
at asteroid families close to Ceres in dynamical space
that show distinct spectral features and higher albedo.
One family that fit these criteria is the Gefion family,
which is in dynamical proximity to Ceres. Dynamical
models of asteroid family evolution and meteorite delivery mechanisms led [6] and [7] to suggest the Gefion family as the source of the L-chondrites. A majority of L chondrites record an intense shock event
~470 Ma, interpreted as evidence of the breakup and
dispersal of the L chondrite parent body. [6] and [7]
used dynamical models to connect the Gefion familyforming collision event with this shock history.
Following the formation of the Gefion family,
“fossil” L chondrite meteorites dominated the impactor
population arriving at Earth ~470 million years ago
[6]. Depending on the assumptions made, a brief burst
of Gefion fragments could also potentially dominate
the small impactor population at Ceres near this time.
Thus, exogenic L chondrite material conceivably could
be found on Ceres. While a short-lived impact spike
would mainly create small craters, their signature
would then be diluted by ~470 My of crater production
superposed on them from other main belt impactors.
This may make it difficult to identify L chondrite craters or their remnant fragments on Ceres, though hopefully it is not impossible.
Proposed Methodology: Given Ceres’ low albedo
(0.09), only bright exogenic impactors will be easily
identifiable. Another criterion for identification is the
spectral shape of the exogenic material. Bright impactors such as E-types (enstatite achondrites) lack
diagnostic absorption bands deep enough to be distinguishable with the Dawn FC color filter data. Here we
present color spectra of Ceres and potential ordinary
chondrite exogenic materials that have albedos and
band depths higher than Ceres. Our goal is to provide a
broad baseline for analysis and interpretation of Dawn
FC color images of Ceres once Dawn arrives at the
dwarf planet.
Dawn Framing Camera Filters: FC contains a set
of seven color filters ranging from 0.44 to 0.97 µm
(Table 1) in addition to a clear filter. Color filters will
provide information about the surface composition
either through the creation of color composite images
allowing the identification of spectrally distinct units,
or through the analysis of the color spectra in combination with laboratory spectra of meteorites or minerals
that could be good analogues to Ceres.
Filter
Wavelength cenBandwidth (µm)
name
ter (µm)
F8
0.438
0.040
F2
0.555
0.043
F7
0.653
0.042
F3
0.749
0.044
F6
0.829
0.036
F4
0.917
0.045
F5
0.965
0.086
Table 1: List of FC filters (except clear filter) with
their respective center wavelength and band width.
Spectral Analysis: In the wavelength range corresponding to the FC filters, the spectrum of Ceres appears almost featureless. Ceres displays a weak absorption band in the NIR wavelengths (centered at ~1.2
µm) thought to be due to magnetite [8] or maybe lizardite [9]. The shorter wavelength shoulder of this
band is within the range of three FC filters (F6, F4,
46th Lunar and Planetary Science Conference (2015)
F5). As noted earlier, given Ceres’ low albedo and
based on HST data, color variations are expected to be
subtle [3]. Hence we focused on meteorites with moderate to high albedo exhibiting deep absorption bands
and meteorites that are the most likely to impact Ceres
(ordinary chondrites). We resampled the ground-based
spectrum of Ceres and laboratory spectral data of ordinary chondrites to the FC filter band passes using FC
filters responsivity and resampling function in the IDL
ENVI software [10].
The FC responsivity corresponds to the combination of filter, CCD and optics transmission measured in
the laboratory [11]. Spectra of meteorites were obtained from RELAB and ground-based observations of
Ceres are from the Small Bodies Data Ferret. To get
the FC color spectrum of Ceres (Fig. 1), we combined
data from SMASS (Small Main-Belt Asteroid Spectroscopic Survey with the MDM telescopes at Kitt Peak
National Observatory) from [12] and a 52-color IR
spectrum of Ceres taken using a double circularly variable filter [13].
Figure 1: Spectrum of Ceres from SMASS and 52color asteroid survey. The first five FC filters use the
data from SMASS and the two last filters use data from
52-color asteroid survey. Overall shape is consistent
with the shape of Ceres’ spectrum observed with the
NASA InfraRed Telescope Facility SpeX instrument
[9].
Future Work: We intend to evaluate how different
meteoritic components can be identified with FC color
filters (Fig. 2), and possibly develop an automated lithology identification software tool that would allow
us to classify spectrally distinct units based on a spectral library and color criteria for different meteorites.
1431.pdf
Figure 2: Average spectrum of L chondrites from 17
laboratory spectra (RELAB) after resampling to FC
filters. Error bars correspond to the maximum and
minimum reflectance values found among all the L
chondrites used for the average spectrum.
References: [1] McCord T.B and Sotin C. (2005)
JGR, 110, E05009. [2] Rivkin A.S. et al. (2006) Icarus,
180, 464-472. [3] Li J.-Y. et al. (2006) Icarus, 182,
143-160. [4] Reddy V. et al. (2012) Icarus, 221, 544559. [5] Le Corre L. et al. (in review) Icarus. [6]
Nesvorný D. et al. (2009) Icarus, 200, 698-701. [7]
Bottke W.F. et al. (2009) LPS XL, Abstract #1445. [8]
Larson H.P et al. (1979) Icarus, 39, 257-271. [9] Rivkin A.S. et al. (2011) Space Sci. Rev., 163, 95-116.
[10] Le Corre et al. (2011) Icarus, 216, 376-386. [11]
Sierks H. et al. (2011) Space Sci. Rev., 163, 263-327.
[12] Bus S. and Binzel R.P. (2003) NASA PDS . [13]
Bell J.F. et al (1995) NASA PDS.
Acknowledgement: This research work was supported by NASA Planetary Mission Data Analysis
Program Grant NNX14AN16G, NASA Planetary Geology and Geophysics Grant NNX14AN35G. This
research utilizes spectra acquired by Richard P. Binzel,
Takahiro Hiroi, Tim McCoy, Harry Y. McSween, David W. Mittlefehldt, Carle M. Pieters, and Allan H.
Treiman with the NASA RELAB facility at Brown
University.

© Copyright 2026