
A new high background radiation area in the
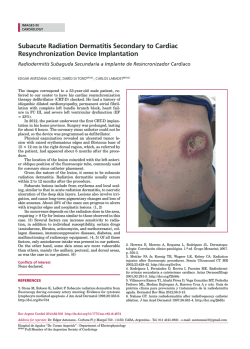
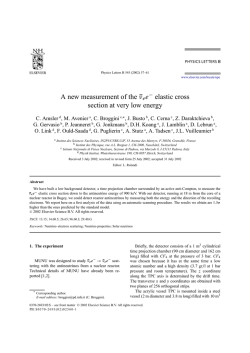
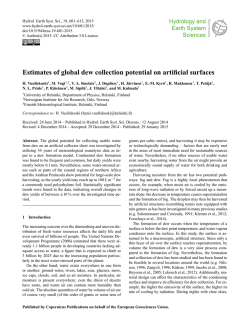
Radiation Measurements 41 (2006) 602 – 610
www.elsevier.com/locate/radmeas
A new high background radiation area in the Geothermal region of
Eastern Ghats Mobile Belt (EGMB) of Orissa, India
V.C. Baranwal a , S.P. Sharma a,∗ , D. Sengupta a , M.K. Sandilya b , B.K. Bhaumik b ,
R. Guin c , S.K. Saha c
a Department of Geology and Geophysics, Indian Institute of Technology, Kharagpur, West Bengal 721 302, India
b Physics Laboratory, Eastern Region, Atomic Minerals Directorate for Exploration and Research, Department of Atomic Energy, Jamshedpur 831002, India
c Radiochemistry Division, Variable Energy Cyclotron Centre, BARC, Bidhan Nagar, Kolkata, West Bengal 700064, India
Received 13 May 2005; received in revised form 21 November 2005; accepted 21 March 2006
Abstract
A high natural radiation zone is investigated for the first time in a geothermal region of Eastern Ghats Mobile Belt (EGMB) of Orissa state
in India. The surrounding area comprises a geothermal region which has surveyed using a portable pulsed Geiger–Muller counter. On the basis
of findings of GM counter, an area was marked as a high radiation zone. Soil and rock samples collected from the high radiation zone were
analyzed by -ray spectrometry (GRS) using NaI(Tl) detector. The radioactivity is found to be contributed mainly by thorium. Concentration
of thorium is reported to be very high compared to their normal abundance in crustal rocks. Further, concentrations of 238 U and 40 K are also
high compared to normal abundance in crustal rocks but their magnitude is comparatively less than that of thorium. The average concentrations
of 238 U (i.e. U (.)), 232 Th and 40 K are found to be 33, 459 ppm and 3%, respectively, in soils and 312, 1723 ppm and 5%, respectively, in
the granitic rocks. Maximum concentrations of 238 U, 232 Th and 40 K are found to be 95, 1194 ppm and 4%, respectively, in soils and 1434,
10,590 ppm and 8%, respectively, in the granitic rocks.
Radioactive element emits various energies in its decay chain. High energies are utilized to estimate the concentration of actual 238 U, 232 Th
and 40 K using a NaI(Tl) detector, however, low energies are used for the same in an HPGe detector. Some of the rock samples (eight in
number) were also analyzed using HPGe detector for studying the behavior of low energies emitted in the decay series of uranium and thorium.
The absorbed gamma dose rate in air and external annual dose rate of the high radiation zone are calculated to be 2431 nGy/h and 3.0 mSv/y,
respectively. It is approximately 10 times greater than the dose rates obtained outside the high radiation zone. The high concentration of uranium
and thorium may be one of the possible heat sources together with the normal geothermal gradient for hot springs present in the region.
© 2006 Elsevier Ltd. All rights reserved.
Keywords: Radioactivity; HBRA; Geothermal region; Granites; GM counter; Gamma ray spectrometry
1. Introduction
Natural radioactive mineral deposits are found in suitable
geological environment like unconformity contact, veins, surficial, etc. (Bhaumik et al., 2004). Their occurrences in outcrop
enhance the background radiation of the area. This high exposure level may be harmful for people residing in the region. According to the United Nations Scientific Committee on Effects
∗ Corresponding author. Tel.: +91 3222 283386; fax: +91 3222 282268.
E-mail address: [email protected] (S.P. Sharma).
1350-4487/$ - see front matter © 2006 Elsevier Ltd. All rights reserved.
doi:10.1016/j.radmeas.2006.03.002
of Atomic Radiation Report (UNSCEAR, 2000), the greatest
contribution to mankind’s exposure comes from natural background radiation, and the worldwide average annual effective
dose is 2.4 mSv. However, much higher levels of exposure are
usual for inhabitants of natural high background radiation areas (HBRAs). High radiation above the Earth is mainly due
to naturally occurring radioactive elements in the Earth’s crust
such as 238 U, 232 Th and 40 K. Areas at high altitudes are also
affected by cosmic radiations (NCRP, 1987; UNSCEAR, 1993;
Bennett, 1997).
Radioactive elements are also very useful for mankind
due to their different type of industrial and commercial uses.
V.C. Baranwal et al. / Radiation Measurements 41 (2006) 602 – 610
603
Fig. 1. Map of the area showing location of the survey.
Uranium and thorium may be found in naturally occurring minerals. Monazites, ilmenite, rutile, sillimanite and zircons, etc.
are some heavy radioactive minerals which are found abundantly in India (Virnave, 1999). Monazite is one of the principal sources of rare-earth elements (REEs) and thorium in the
continental crust. Thorium may be used as an important raw
material in the production of nuclear power in India. 233 U, a fissile product, generated through irradiation of 232 Th, is used in
fast breeder reactors (Mohanty et al., 2003). Rare-earth oxides
(REOs) have wide applications in material science research and
high-technology industries.
Economically viable concentrations of radionuclides mostly
occur in beach placer deposits. Generally coastal regions of
various countries are designated as very HBRAs due to enrichment of radioactive placer deposits. Various HBRAs have
been reported time to time from various parts of the world
(NCRP, 1987; Wei et al., 1993; Paschoa, 2000; UNSCEAR,
2000; Ghiassi-nejad et al., 2002; Mohanty et al., 2004). Some
of these areas have been under study in order to determine
the risks and effects of long-term, low-level natural radiation
exposure (Sohrabi, 1998). Ullal in Karnataka (Radhakrishna
et al., 1993), Kalpakkam in Tamil Nadu (Kannan et al., 2002),
coastal parts of Tamil Nadu and Kerala state, and the southwestern coast of India are known HBRAs in the Indian coastal
region. Thorium-bearing minerals are found extensively in igneous complexes, mainly associated with the granites, syenites
and pegmatite intrusive of all ages, however, the main resource
base is confined to beach and inland placer deposits. Beach
placer deposits occur at several places along both the eastern
and western coasts of India. There are two appreciable concentrations of inland placers containing monazite: Ranchi plateau
of Jharkhand and the Purulia planes of West Bengal in India (Virnave, 1999). Nonplacer-type thorium deposits occur in
USA, Canada, Greenland, Brazil, South Africa, Uganda, Kenya,
China and India (Overstreet, 1967; Virnave, 1999). These are
associated with mainly carbonatite complexes, conglomerates,
sandstones, granites, syenites and pegmatites.
The study area is shown in Fig. 1. Previously, geophysical
surveys using very low frequency electromagnetic, magnetic
and resistivity surveys were carried out in the region near
Tarbalu hot spring, Orissa (Baranwal and Sharma, 2005). A radiometric reconnaissance survey was also carried out in nearby
regions using a portable pulsed Geiger–Muller (GM) counter
and a relatively high natural background radiation region was
identified. High concentration of radionuclides may be the
source of heat responsible for the hot spring. A GM counter
responds to and particles and -radiations from all the
radionuclides (decay products of all the elements) and it is
not possible to know about the particular element causing the
radiation. Therefore, a laboratory measurement of soil and
rock samples from the area was needed to determine the relative concentration of radioactive elements 238 U, 232 Th and
40 K contributing to the high radiation level. Soil and rock
samples along four profiles (Fig. 1) were collected from a part
of area showing high radiation (Fig. 2) and analyzed by -ray
spectrometry (GRS) using NaI(Tl) and HPGe-type detectors.
V.C. Baranwal et al. / Radiation Measurements 41 (2006) 602 – 610
18
400
17
320
10
100
100
240
0
16
200
Hot spring
Chakradharprasad
160
80
10
0
15
Total radiation count
480
20
Latitude (20 deg. and minutes)
604
0
14
15
0
16
17
18
19
20
Longitude (85 deg. and minutes)
Fig. 2. Contour map of radiation counting measured in the area (total counts
per 100 s). Solid squares show the locations of the measured data. X- and
Y -axis shows variation of longitude and latitude in minutes. Exact value
should be read as 20◦ 14 N and 85◦ 15 E (taken from Baranwal and Sharma,
2005).
2. Geological setting
The study area is near Tarbalu hot spring in Orissa, India.
This area belongs to the Eastern Ghats metamorphic province
and bounded by the latitude 20◦ 14 N to 20◦ 15.5 N and longitude 85◦ 14.5 E to 85◦ 19 E (Fig. 1). The area is characterized
by high-grade (granulite facies) metamorphic rocks such as
khondalite, charnockite, quartzofeldspathic gneisses, enderbites, with interlayered mafic horizons (Kundu et al., 2002).
Granites and quartzofeldspathic gneisses mostly occur as flat
sheet-like outcrops, in contrast to the more resistant, elevated
domains of enderbites and khondalites. Granites are essentially
abundant at the contact between enderbites and quartzofeldspathic gneisses. These granites cut across both rock units. In
places, these coarse-grained granites have been subsequently
deformed, as inferred from the crude alignment of biotite
and flattened quartz grains. It is important to note that only
these deformed granites coincide with zones of high radioactivity. The high radioactive zone is aligned along a roughly
east–west trend, parallel to the enderbite hills, and passes
through Chakradharprasad, Nimani and Arkhapalli villages
(Fig. 1). The topography of the area is undulating; the high
radiation zone is slightly elevated with respect to the surrounding country rock. Eight hot water spouts, distributed over an
area of 0.01 km2 , with temperatures ranging between 47 and
85 ◦ C, have been reported in the area (Shanker, 1996). Tarbalu
hot spring is approximately 4 km away from the high radiation
zone delineated in the present study.
3. Experimental methods
3.1. Field survey and sample collection
Since many hot springs are present in the area, therefore, to
know the possible heat source feeding the hot springs, a radiometric survey was carried out using a portable pulsed GM
counter at various locations covering an area about 78.75 km2 .
Survey locations and contour of the total radiation are shown
in Fig. 2. For detail radiometric survey over the high radiation zone, total radiation counts were again measured at 25 m
interval along profiles 0000, 1200, 2400, 3600, 4800, 6000 and
7200 with profile spacing of 1200 m (Fig. 1). For each measurement, the sensor of GM counter was kept approximately
1 foot above the ground surface and operated for 100 s. This
helped to have the appropriate geometry for subsequent sample
collection. These profiles cover the area from Gobardhanprasad
to Khuntaparha villages. Plotting of these profiles is shown in
Figs. 3a–g. For laboratory assaying of the samples, rock and
soil samples were collected along the profiles 2400, 3600, 4800
and 6000 at 200 m intervals. Some rock samples were also collected from the exposures along these profiles. Locations of
rock and soil samples are marked by R1 and S1, respectively.
However, rock samples are given extra notation i.e. a–c (e.g.
R1a ) to show different rock types from the same location. For
GRS, soil and rock samples were crushed to make it into a fine
powder of size ∼ 508 m. Uranium analysis by . technique
requires a further powdering to a size of ∼ 212 m.
For GRS using NaI(Tl) detector, 200 g soil and rock samples
were taken for the analysis. Some rock samples were also prepared in 10 g amount by coning and quartering method for subsequent analysis using high-purity germanium (HPGe) detector
at VECC, Kolkata. For preparation of a sample of a specific
amount from a bulk powder material by coning and quartering
method, first of all, a cone shape is made by dropping powder
material on a glass plate. The cone is spilt into four parts and
two opposite parts are taken to mix them thoroughly, leaving
the other two parts away from the plate. Again a cone shape is
made in the same way and the process is repeated till the required amount is obtained. It is then kept in a sealed container
for approximately one month period for attainment of equilibrium of radon daughter with the parent radium in the U-series.
3.2. Radiometric analysis
3.2.1. Gamma-ray spectrometry using NaI(Tl)
The -ray spectrometric analysis using NaI(Tl) detector was
carried out at physics laboratory of Atomic minerals directorate
for Exploration and Research (AMD), Jamashedpur, Jharkhand.
The samples were analyzed to estimate thorium concentration
(Th), equivalent radium concentration Ra(eU3 O8 ), designated
by Ra(eU) and potassium concentration (K) using four channel
gamma ray spectrometer in which a 5 in × 4 in NaI(Tl) coupled
to a 5 in diameter photomultiplier tube (PMT) integrated crystal
is used as detector. The detector assembly was enclosed in a 4 in
thick lead chamber. Details of the theory and instrumentation
are discussed by Acharyulu et al. (2004).
For estimation of K, Ra(eU) and Th, their corresponding energies i.e., 1.46, 1.76 and 2.62 MeV were used. For determination of concentration of K, Ra(eU), and Th, the windows
were selected in the energy range of 1.36–1.56, 1.66–1.86 and
2.42–2.82 MeV, respectively. Channel stripping and sensitivities (i.e., rate of count per ppm) were calculated by using three
standards namely; Th, U and K standards. In addition to this
V.C. Baranwal et al. / Radiation Measurements 41 (2006) 602 – 610
605
sion for net rate of counts in channels (Bhauwmik et al., 2004).
The gamma ray energies 1.76 MeV (from 214 Bi) and 2.62 MeV
(from 208 TI) provide indirect estimate of 238 U and 232 Th, respectively. However, in geologic specimens, Th for all practical
purposes, remains in equilibrium (only 50 years required for Th
to attain equilibrium with its daughters). Therefore, measurement based on 2.62 MeV can give estimate of 232 Th. But for U,
if the sample is not in equilibrium with respect to U-series, the
measurement based on 1.76 MeV does not give the proper estimate of 238 U. Thus, the actual concentration of U is required
to be determined based on simultaneous beta and total gamma
counting (integral measurement i.e., no specific beta or gamma
energy is used). The technique is described by Eichholz et al.
(1953) and is designated by U(.).
In this method, from the rate of gamma count (98% contribution comes from Ra group and 2% from uranium group of
U-series), the amount of (eU3 O8 ) present in the sample is estimated. The rate of beta count is a sum contributed by both
U-group and Ra-group of the U-series. From the calibration
constant of the system i.e., rate of count per ppm, contribution in the rate of beta count by the estimated (eU3 O8 ) can be
found out and therefore the contribution in the rate of beta count
only due to U-group can be determined. This rate of beta count
then provides an estimate of the actual concentration of uranium. The presence of thorium in the sample, which Eichholz
et al. (1953) proved mathematically, is equivalent to an excess
of radium, which contributes to both the rates of gamma and
beta count. For a ratio even greater than 10 between Th and
U, it is possible to obtain a good estimate of the concentration
of uranium. The mathematical expression for estimating actual
concentration of U is given by
U = (1 + c)(eU3 O8 ) + c(eU3 O8 ) ,
(1)
where ‘c’ is the ratio between the numbers of beta particles
emitted by Ra-group to that of the U-group of a sample in
equilibrium. The precision of estimates () is given by
= (1 + c)2 {(eU3 O8 ) }2 + c2 {(eU3 O8 ) }2 .
Fig. 3. Radiation counts per 100 s along the profiles (a) 0000, (b) 1200,
(c) 2400, (d) 3600, (e) 4800, (f) 6000, (g) 7200. Dark region shows high
radiation zone.
there is an integral channel (400 keV–3 MeV) for counting of
all the gamma photons. The data in this channel provide an estimation of (eU3 O8 ) , content of sample, which provides the
combined contribution of all the radio elements. It is determined
by the method of equivalence of gamma count between an equilibrium uranium standard and the sample. A similar quantity
(eU3 O8 ) can be estimated by beta count equivalence also.
The results of radiometric analysis are given in Table 1 with
±1 error due to statistical fluctuations (following Poisson
statistics) in counting. They are calculated based on the expres-
(2)
Samples were also analyzed for actual concentration of uranium (designated as U(.)) using . technique (Eichholz
et al., 1953). This technique gives the concentration of uranium irrespective of its state of equilibrium and presence of
thorium. At a level of 100 ppm (eU3 O8 ) , the precision of estimate is 11%. All the concentrations i.e., U(.), Ra(eU) and
Th are measured in ppm, however, K is shown in percentage
of K2 O. Whenever, U or Th concentration of sample becomes
very high, determination of 40 K is difficult due to Compton
scattering giving poor precision of the measurements.
Radioactivity in the study area is contributed primarily by
thorium which is measured by NaI(Tl) detector at corresponding high energy of 2.62 MeV and to some extent by uranium.
There is a series of various decay products of -ray emitters.
228Ac (having energies 209, 338 and 911 keV), 212 Bi (having
energies 727 keV) are important -ray emitters in the decay
chain of Th element. Since HPGe detector has very high resolution for low energies and it shows sharp peaks at corresponding
606
V.C. Baranwal et al. / Radiation Measurements 41 (2006) 602 – 610
Table 1
Concentration of U(.), Th, Ra(eU) and K2 O in soil and rock samples analyzed by -ray spectrometry using NaI(Tl) detector
Type of sample
Sample no.
U( − ) (in ppm)
Th (in ppm)
Ra(eU) (in ppm)
K2 O (in %)
Soil samples
-
S1
S2
S3
S4
S5
S6
S7
S8
S9
S10
S11
S12
S13
S14
S15
S16
S17
S18
S19
S20
S21
S22
S23
S24
S25
S26
S27
*
43 ± 6
42 ± 3
5±1
23 ± 4
*
*
*
73 ± 4
14 ± 1
15 ± 2
33 ± 4
*
31 ± 5
71 ± 4
95 ± 6
57 ± 4
13 ± 2
47 ± 5
4±1
37 ± 4
2
16 ± 7
10 ± 1
2
*
*
99 ± 3
268 ± 5
696 ± 10
376 ± 6
261 ± 4
161 ± 3
64 ± 2
87 ± 3
1194 ± 14
551 ± 8
566 ± 8
458 ± 7
51 ± 2
269 ± 5
1066 ± 13
832 ± 10
735 ± 10
443 ± 7
514 ± 8
203 ± 4
418 ± 7
792 ± 10
552 ± 8
351 ± 6
62 ± 2
32 ± 2
69 ± 2
*
—
11 ± 1
6±1
7±1
7±1
3
3
12 ± 3
10 ± 2
9±1
11 ± 2
2
5±1
11 ± 2
22 ± 2
22 ± 2
6±1
7±2
5±1
8±1
48 ± 3
59 ± 2
28 ± 2
4
4
7±1
1.5 ± 0.1
2.7 ± 0.2
2.7 ± 0.2
2.3 ± 0.2
1.5 ± 0.1
1.1 ± 0.1
2.6 ± 0.1
3.0 ± 0.1
3.7 ± 0.3
2.4 ± 0.2
2.6 ± 0.2
2.2 ± 0.2
2.8 ± 0.1
3.3 ± 0.2
4.0 ± 0.3
2.1 ± 0.3
1.8 ± 0.2
2.7 ± 0.2
3.6 ± 0.2
2.3 ± 0.1
2.6 ± 0.2
1.0 ± 0.2
—
1.6 ± 0.2
2.6 ± 0.1
1.5 ± 0.1
2.4 ± 0.1
Rock samples
Granite
R1a
20 ± 2
653 ± 9
7±1
7.1 ± 0.2
Mafic layer
R1b
*
20 ± 1
2
2.9 ± 0.1
Granite
R1c
*
157 ± 3
3
4.6 ± 0.1
Enderbite
R2a
*
59 ± 2
2
3.4 ± 0.1
Granite
R2b
R3a
R4a
R4b
R4c
R5a
R5b
R5c
R6a
R7a
R7b
96 ± 8
549 ± 8
25 ± 2
4.6 ± 0.2
*
146 ± 3
2
6.3 ± 0.1
*
18 ± 1
2
0.9 ± 0.1
Granite
Enderbite
Granite
Granite
QFG
Granite
Granite
Granite
QFG
Granite
1434 ± 22
10590 ± 102
338 ± 19
7.5 ± 2.0
238 ± 11
1228 ± 14
185 ± 4
—
*
27 ± 2
1
3.3 ± 0.1
*
97 ± 3
10 ± 1
0.2
39 ± 1
3080 ± 30
44 ± 5
3.1 ± 0.6
*
366 ± 6
4±1
5.8 ± 0.2
*
20 ± 1
2
1.2 ± 0.1
44 ± 5
366 ± 6
4±1
5.8 ± 0.2
‘*’ indicates error in the analysis to be more than 10%.‘-’ indicates insignificant concentration.QFG—Quartzofeldspathic Gneiss.
energies of its decay products, therefore, a few samples (eight
in numbers) were also analyzed using an HPGe detector. HPGe
detector generates full spectrum of the sample’s decay products instead of counting the gamma rays of a particular energy
range (set as window) in NaI(Tl). In case of NaI(Tl) detector,
efficiency is high, however, resolution is high in case of HPGe
detector. There may be relative migration of the isotopes of radionuclides which may show discrepancy in measurements by
NaI(Tl) detector. However, energy peaks corresponding to various decayed isotopes can be seen clearly by use of an HPGe
detector.
3.2.2. Gamma-ray spectrometry using HPGe
The gamma-ray spectrometric analysis using a coaxial HPGe
detector (EG & G, ORTEC) with a 15% relative efficiency was
carried out at the Radiochemistry Division, Variable Energy
V.C. Baranwal et al. / Radiation Measurements 41 (2006) 602 – 610
607
Table 2
Concentration of Th revealed by various low energies emitted by its decay products in -ray spectrometry using HPGe detector
Type of rock Sample Concentration of Th (in ppm) revealed by various low energies emitted due to the decay products
no.
239 keV
(212 Pb)
338 keV
(228Ac)
583 keV
(208 Tl)
727 keV
(212 Bi)
911 keV
(228Ac)
Average
concentration
Granite
R2b
550 ± 30
547 ± 36
497 ± 28
310 ± 22
546 ± 30
490 ± 29
Enderbite
R4a
R4b
R4c
R5c
R6a
R7a
R7b
29 ± 2
42 ± 4
62 ± 4
43 ± 4
50 ± 3
45 ± 3
9946 ± 536
9472 ± 512
8557 ± 462
9519 ± 519
9288 ± 504
9356 ± 507
1159 ± 63
1114 ± 63
1010 ± 55
1317 ± 77
1132 ± 62
1146 ± 64
2475 ± 134
2780 ± 154
2511 ± 137
3064 ± 174
2671 ± 146
2700 ± 149
377 ± 21
362 ± 25
291 ± 16
296 ± 20
311 ± 17
327 ± 20
44 ± 3
70 ± 6
42 ± 3
31 ± 2
15 ± 2
40 ± 3
397 ± 22
556 ± 37
401 ± 22
262 ± 19
430 ± 24
409 ± 25
Granite
Granite
Granite
Granite
QFG
Granite
212Pb
20000
208Tl
Net counts
228Ac
15000
228Ac
10000
214Pb
212Bi
214Pb
5000
40K
214Bi
0
100
300
500
700
900
Energy (keV)
1100
1300
1500
Fig. 4. -ray spectrum of granitic rock sample R4b counted using HPGe detector. Counts at 238 keV (212 Pb) and 583 keV (208 Tl) are 16,709 and 21,658,
respectively.
Cyclotron Centre BARC, Kolkata. The detector was placed in
a 10 cm shield of lead bricks to reduce background radiation
caused by building materials and cosmic rays. The detector
was cooled to liquid-nitrogen temperatures and coupled to a
PC-based 8K multi-channel analyzer with appropriate software
for data acquisition and analysis developed by Bhabha Atomic
Research Centre (BARC), India.
The absolute efficiency of the detector was determined
with a 152 Eu liquid source detector (Amersham International Company, UK). The 152 Eu liquid source was thoroughly mixed with the normal silica sands, whose activity
level was similar to the background radiation level. An ideal
measuring geometry of a cylindrical source (homogeneously
distributed activity with constant volume and distance) was
placed coaxially with the detector for the efficiency determination and the same procedure applied for the sample
measurements.
The sample was sealed and stored for a period of one month
in a tight container to attain radioactive equilibrium in the decay chains (Evans, 1969). The samples were subsequently assayed by GRS using a high-resolution HPGe detector having a
resolution of 1.9 keV at 1332 keV photo peak of 60 Co. 232 Th is
not a direct gamma ray emitter but gamma rays of their decay
product can be measured. Decay products for 232 Th i.e., 228Ac
(energies 338 and 911 keV), 212 Pb (energy 239 keV), 212 Bi (energy 727 keV), and 208 Tl (energy 583 keV) were used to estimate the thorium concentration assuming the decay series to
be in secular equilibrium (Firestone and Shirley, 1998). Instead
of one gamma, we used several gamma rays and finally an average value is mentioned in the results provided (Table 2). The
counting time for each sample was 80,000 s.
The activity concentration is calculated from HPGe data using the relation A = peak area/(t ∗ ∗ %yield), where ‘t’ is
the collection time and is the efficiency. Thus, one can calculate that 1 ppm of thorium corresponds to 4.04 Bq/kg activity.
There may be various errors in estimation due to a number of
factors, like geometry of the sample, efficiency determination,
peak area determination and random uncertainties associated
with background and sample counts. Main sources of errors are
efficiency calculation (up to 5%, including error due to geometry also), weighing error (up to 2%) and peak area calculation (up to 2 %). A fixed error of 5% in efficiency calculation
and 2% in weighing are considered to calculate total error in
measurement, however, error in peak area estimation was different for various energies. A gamma ray spectrum of granitic
rock sample, R4b recorded using HPGe detector is presented as
an example (Fig. 4), showing the gamma lines from various
daughter radionuclides of 232 Th.
608
V.C. Baranwal et al. / Radiation Measurements 41 (2006) 602 – 610
3.3. Absorbed gamma dose rate measurement
The absorbed gamma dose rate in air 1 m above the ground
surface for the uniform distribution of radionuclides (232 Th,
238 U, 40 K) can be computed on the basis of guidelines provided
by UNSCEAR (1993, 2000). We assumed that the contribution from other radionuclides, such as 137 Cs, 235 U, 87 Rb, 90 Sr,
138 La, 147 Sm and 176 Lu to the total dose rate is negligible. The
conversion factors used to compute absorbed gamma dose rate
(D) in air per unit activity concentration in 1 Bq/kg material
corresponds to 0.621 nGy/h for 232 Th, 0.462 nGy/h for 238 U
and 0.0417 nGy/h for 40 K. Expression to calculate the dose rate
can be given as
D = (0.621CTh + 0.462CU + 0.0417CK )
nGy/h,
(3)
where CTh , CU and CK are the average activity concentrations
of 232 Th, 238 U and 40 K in Bq/kg, respectively. If concentrations
are taken in units of ppm then the formula can be re-written as
D = (2.51CTh + 5.71CU + 10.51CK ) nGy/h.
(4)
To estimate the annual effective dose rates, the conversion coefficient from absorbed dose in air to effective dose (0.7 Sv/Gy)
and outdoor occupancy factor (0.2) proposed by UNSCEAR
(2000) is used. The effective dose rate in units of mSv/y may be
calculated using the following formula (Matiullah et al., 2004)
effective dose rate (mSv/y) = 1.23 × 10⁻³ × dose rate.
(5)
4. Results and discussion
Radiation counts measured by a portable GM counter is
shown in Figs. 3a–g along the profile lines 0000, 1200, 2400,
3600, 4800, 6000 and 7200, respectively. For comparison of
the total radiation counts, all the profiles are plotted on the
same scales. Profiles 0000, 1200 and 7200 (Figs. 3a–c) show almost consistent nature and not varying much from background
radiation count, approximately 50 counts per 100 s. However,
profiles 2400, 3600, 4800 and 6000 (Figs. 3c–e) show a high
radiation zone at 200–1000 m distance on each profile. Maximum value of the count is approximately 650 counts/100 s along
the profiles 3600, 4800 and 6000. The width of the high radioactive zone is largest along the profile 4800 and varies from
200 to 1400 m. Because the GM counter responds to , and
-radiations of various energies, it is not possible to know about
the particular radioactive elements responsible for such anomalous radiations as shown by the counter. Therefore, soil and
rock samples were collected subsequently along these profiles
for laboratory assaying by GRS.
All the soil and rock samples are analyzed by GRS using
NaI(Tl) detector, however, a few rock samples were also analyzed by a HPGe detector to observe the peaks of low energies
corresponding to decay products of thorium. Concentration of
thorium is calculated by assuming a secular equilibrium among
the various isotopes of Th-series. Results of all the rock and
soil samples analyzed using NaI(Tl) detector are summarized
in Table 1 and the results of rock samples analyzed by use of
HPGe detector are summarized in Table 2.
Fig. 5. Concentration of thorium in the soil samples along the profiles (a)
2400, (b) 3600, (c) 4800, (d) 6000, analyzed by -ray spectrometry using
NaI(Tl) detector.
The error of estimation by NaI(Tl) detector is less than 2% in
case of thorium. However, error in measurement for concentration of uranium is high for samples of low activities. This higher
error occurs due to low statistics in counting for low activity
samples. When concentration of eU3 O8 is less than 100 ppm
then error in estimation of uranium will increase significantly
(Acharyulu et al., 2004). For some samples, concentration of
the element is not mentioned in Table 1 if the error was more
than 10%, however, an asterisk mark (*) is mentioned there.
In some samples, concentration of elements was very low and
insignificant, therefore a hyphen (-) is mentioned there.
It is clear from Table 1 that thorium (232 Th) concentration
is very high in comparison to 238 U and 40 K elements. Since,
regular rock exposures were not available along the profiles
2400, 3600, 4800 and 6000, therefore, soil samples were collected at equidistant points along these profiles. Concentrations
of thorium in soil samples along various profiles are plotted
and shown in Fig. 5. Maximum concentration of thorium in
soil sample is reported as 1194 and 1066 ppm in the sample S9
and S15 along the profiles 3600 and 4800, respectively. These
samples were collected at 400 m location on respective profiles.
V.C. Baranwal et al. / Radiation Measurements 41 (2006) 602 – 610
Fig. 3 also shows maximum radiation count at 400 m location
on the same profiles (3600 and 4800, Figs. 3d and e). However, moving further away from the 400 m location (profiles
3600 and 4800, Figs. 5b and c), the concentration of thorium
is decreasing. Profile 6000 (Fig. 5d) shows high concentration
of thorium at its starting point due to the presence of rock exposures containing radioactive elements at this location. The
average concentrations of 238 U (i.e., U(.)), 232 Th and 40 K
in soil are calculated as 33, 459 ppm and 2.5%, respectively.
Maximum concentrations of 238 U (i.e., U(.)), 232 Th and 40 K
in soil are calculated as 95, 1194 ppm and 4%, respectively.
Rock types for the various samples studied are also mentioned in Table 1. Locations of rock samples are shown in Fig.1.
In the area, three types of rocks, quartzofeldspathic gneiss,
enerbites and granites are found. Different rocks collected from
same exposure are distinguished by superscripts a, b and c (e.g.,
R1a ). High concentration of thorium is reported only for the
granitic rocks (see Table 1). In host rocks, quartzofeldspathic
gneiss and enderbite thorium activity is very less and can be
assumed insignificant (R1b , R2a , R4a , R5a and R7a ; Table 1).
Granitic rock samples, R1a , R5b , R7b , R2b and R6a along the profiles
1200, 2400, 3600 4800 and 6000, respectively show high concentration of thorium. Rock samples collected from the nearby
regions along these profiles also show high concentration of
thorium which indicates a good agreement between concentration of thorium in rocks and soil samples. This suggests about
the possibility of formation of soil by weathering of these rocks.
Rock sample, R4b , collected from the foot of the nearby hills exhibits maximum concentration of thorium (10,590 ppm) from
the region. Uranium concentration in this sample was also relatively high. The average concentrations of 238 U (i.e., U(.)),
232 Th and 40 K in granitic rock are calculated as 312, 1723 ppm
and 5%, respectively. Maximum concentrations of 238 U (i.e.,
U(.)), 232 Th and 40 K in granitic rock are calculated as 1434,
10,590 ppm and 7 %, respectively.
The average concentrations of U(.), 232 Th and 40 K in high
radiation zone are calculated as 100, 728 ppm and 3%, respectively. In the soil samples collected outside the high radiation
zone (Samples S26 and S27 ; Fig. 1), the average concentrations
of U(.), 232 Th and 40 K are 50, 12 ppm and 5%, respectively.
The absorbed gamma dose rate in the air and external annual
effective dose rate are also calculated using Eqs. (4) and (5).
The absorbed gamma dose rate and annual effective dose rate
outside the high radiation zone are 248 nGy/h and 0.31 mSv/y,
respectively. In high radiation zone, absorbed gamma dose rate
and annual effective dose rate are 2431 nGy/h and 2.99 mSv/y,
respectively. Dose rates in the high radiation zone are approximately 10 times greater than the dose rates outside the high
radiation zone in this region.
A few rock samples were analyzed using HPGe detector. All
the samples showed energy peaks of the corresponding decayed
isotopes of 232 Th, 238 U and 40 K clearly. A -ray spectrum of
granitic rock sample, R4b is shown in Fig. 4. 212 Pb, 228Ac, 208 Tl,
212 Bi and 228Ac are decay products of thorium and show sharp
peak at -energies 239, 338, 583, 727 and 911 keV, respectively. 214 Pb, decay product of uranium shows sharp -peak at
609
energies 295 and 352 keV and 214 Bi, also a decay product of
uranium shows sharp peak at 609 keV. 40 K shows a -peak at
1459.2 keV. Concentration of 232 Th is also calculated assuming
a secular equilibrium among the various isotopes of thorium
corresponding to various energies and tabulated in Table 2. The
results are consistent for different energies from the same sample with the results obtained using the NaI(Tl) detector.
Tarbalu hot springs are present at a distance of 4 km in the
east direction from the high radiation zone (Figs. 1 and 2).
Baranwal and Sharma (2005) carried out integrated geophysical study using a very low frequency EM, magnetic, resistivity
and radiometric survey around the hot spring. Resistivity, VLF
and magnetic interpretation are suggested for shallow fracture
zones. Self-potential survey carried out in the area does not suggest the presence of any mineral body. Self-potential data also
does not support any upflow of hot water from greater depth
below the hot spring. Small positive self-potential anomaly suggests possible lateral movement of hot water. Tectonothermal
activities and deep magma chamber have not been reported in
earlier geological studies carried out in the area. These geophysical studies indicate the presence of fracture zones near the
hot spring and suggest the possibility of the radiogenic heating
in the region. High concentration of thorium reported in the
rock and soil samples in the present study supports the possibility of radiogenic heating in the region. Water contained in
high heat production granites is likely to set into convective
circulation (Durrance, 1986).
5. Conclusions
A high background radiation zone is identified in a geothermal region of Eastern Ghats Mobile Belt (EGMB) on the basis of radiometric profiling of the area using a portable pulsed
GM counter. Soil and rock samples collected from the high
radiation zone showed mainly high concentration of thorium.
Therefore, background of the area is enhanced to high radiation due to presence of primarily thorium in rocks and
soils. Presence of thorium in rock and soil samples suggests
that soils are formed by weathering of the ambient rocks. A
good correlation between radiation counts measured by GM
counter and thorium concentration determined by GRS is also
reported (Figs. 3 and 5). Error in estimation for thorium is
within 2% for all the samples, whereas it is high for uranium
estimations.
A few rock samples analyzed by HPGe detector also show
distinct energy peaks corresponding to various isotopes in the
decay chain of thorium. Corresponding energy peaks also confirm presence of abundant thorium in the area. Concentrations
of thorium measured by both methods also match within the
limit of the experimental error. The absorbed gamma dose rate
in air and external annual dose rate of the high radiation zone
are calculated as 2431 nGy/h and 2.99 mSv/y, respectively. It
is about 10 times greater than the dose rates outside the high
radiation zone. High concentration of thorium reported in
the rock and soil samples supports the possibility of radiogenic heating in the region to be an important contributor to
the subsurface heat flow. Normal geothermal gradient may
610
V.C. Baranwal et al. / Radiation Measurements 41 (2006) 602 – 610
also be one of the reasons for hot spring, moreover, presence of very deep fractures (> 4 km) will support for such a
possibility.
References
Acharyulu, A.A.P.S.R., Murty, B.S., Bhaumik, B.K., 2004. Enrichment
characteristics of radioelements in various types of rock from Sambalpur
district, Orissa, India. Proc. Indian Acad. Sci. (Earth Planet. Sci.) 113,
321–352.
Baranwal, V.C., Sharma, S.P., 2005. Integrated geophysical studies in the
East-Indian Geothermal Province. Pure Appl. Geophys. 163, 209–227.
Bennett, B.G., 1997. Exposure to natural radiation worldwide. In: Proceedings
of the Fourth International Conference on High Levels of Natural
Radiation: Radiation Doses and Health Effects, Beijing, China, 1996.
Elsevier, Tokyo, pp. 15–23.
Bhaumik, B.K., Bhattacharya, T., Acharyulu, A.A.P.S.R., Srinivas, D.,
Sandilya, M.K., 2004. Principles of Radiometry in Radioactive Metal
Exploration. Physics Lab, Eastern Region, AMD Complex, Jamshedpur,
India, 292pp.
Durrance, E.M., 1986. Radioactivity in Geology: Principles and Applications.
Ellis Horwood Limited, Chichester, UK, pp. 143–162.
Eichholz, G.G., Hilborn, J.W., McMahon, C., 1953. The determination of
uranium and thorium in ores. Can. J. Phys. 31.
Evans, R.D., 1969. The Atomic Nucleus. McGraw-Hill, New York. p. 927.
Firestone, R.B., Shirley, V.S., 1998. Table of Isotopes. eighth ed.. Wiley,
New York.
Ghiassi-nejad, M., Mortazavi, S.M.J., Cameron, J.R., Niroomand-rad, A.,
Karam, P.A., 2002. Very high background radiation areas of Ramsar, Iran:
preliminary biological studies. Health Phys. 82, 87–93.
Kannan, V., Rajan, M.P., Iyengar, M.A.R., Ramesh, R., 2002. Distribution of
natural and anthropogenic radionuclides in soil and beach sand samples
of Kalpakkam (India) using hyper pure germanium (HPGe) gamma ray
spectrometry. Appl. Radiat. Isot. 57, 109–119.
Kundu, N., Panigrahi, M.K., Sharma, S.P., Tripathy, S., 2002. Delineation
of fluoride contaminated groundwater around a hot spring in Nayagarh,
Orissa, India using geochemical and resistivity studies. Environ. Geol. 43,
228–235.
Matiullah, A.A., Rehman, S., Rehman, S., Faheen, M., 2004. Measurement
of radioactivity in the soil of Bahawalpur division Pakistan. Radiat. Prot.
Dosim. 112 (3), 443–447.
Mohanty, A.K., Das, S.K., Vijayan, V., Sengupta, D., Saha, S.K., 2003. The
geochemical studies of monazite sands of Chhatrapur beach placer deposit
of Orissa, India by PIXE and EDXRF method. Nucl. Instrum. Methods
Phys. Res. B 211, 145–154.
Mohanty, A.K., Sengupta, D., Das, S.K., Saha, S.K., Van, K.V., 2004.
Natural radioactivity and radiation exposure in the high background area
at Chhatrapur beach placer deposit of Orissa, India. J. Environ. Radioact.
75, 15–33.
NCRP, 1987. Exposure of the population of the United States and Canada
from natural background radiation. Report no. 94. National Council on
Radiation Protection and Measurements, Bethesda, MD.
Overstreet, W.C., 1967. The geological occurrence of monazite. US Geological
Survey Professional Paper 530, p. 327.
Paschoa, A.S., 2000. More than forty years of studies of natural radioactivity
in Brazil. Technology 7, 193–212.
Radhakrishna, A.P., Somasekarapa, H.M., Narayana, Y., Siddappa, K., 1993.
A new natural background radiation area on the southwest coast of India.
Health Phys. 65, 390–395.
Shanker, R., 1996. Development of geothermal resources in India: possibilities
and constraints. In: Pitale, U.L., Padhi, R.L. (Eds.), Geothermal Energy
in India, GSI Pub. No. 45, pp, 1–5.
Sohrabi, M., 1998. The state-of-the-art on worldwide studies in some
environments with elevated naturally occurring radioactive materials
NORM. Appl. Radiat. Isot. 49, 169–188.
UNSCEAR, 1993. Sources and Effects of Ionizing Radiation. United Nations
Scientific Committee on the Effect of Atomic Radiation, United Nations,
New York.
UNSCEAR, 2000. Sources and Effects of Ionizing Radiation. United Nations
Scientific Committee on the Effect of Atomic Radiation, United Nations,
New York.
Virnave, S.N., 1999. Nuclear Geology and Atomic Mineral Resources. Bharti
Bhawan, Patna, India.
Wei, L., Zha, Y., Tao, Z., He, W., Chen, D., Yuan, Y., 1993. Epidemiological
investigation in highbackground radiation areas in Yangjiang, China. In:
Proceedings of the International Conference on High Levels of Natural
Radiation Areas, Ramsar, Iran, 1990. IAEA Publication Series, IAEA,
Vienna, pp. 523–547.


© Copyright 2026