
Use of a global model to understand speciated atmospheric mercury
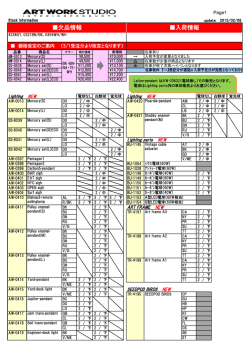
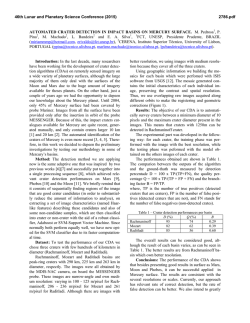
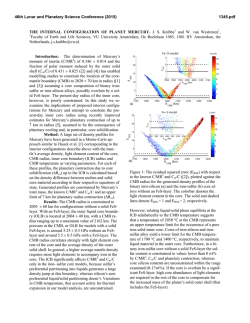
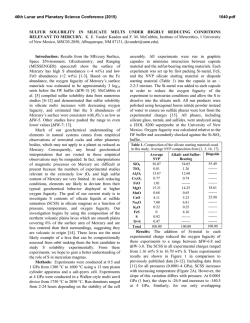
Atmos. Chem. Phys., 15, 1161–1173, 2015 www.atmos-chem-phys.net/15/1161/2015/ doi:10.5194/acp-15-1161-2015 © Author(s) 2015. CC Attribution 3.0 License. Use of a global model to understand speciated atmospheric mercury observations at five high-elevation sites P. Weiss-Penzias1 , H. M. Amos2 , N. E. Selin3 , M. S. Gustin4 , D. A. Jaffe5 , D. Obrist6 , G.-R. Sheu7 , and A. Giang3 1 Microbiology and Environmental Toxicology, University of California, Santa Cruz, USA of Public Health, Harvard University, Cambridge, Massachusetts, USA 3 Department of Earth, Atmospheric and Planetary Sciences, Massachusetts Institute of Technology, Massachusetts, USA 4 Department of Natural Resources and Environmental Science, University of Nevada, Reno, USA 5 School of STEM Physical Sciences Division, University of Washington, Bothell, USA 6 Division of Atmospheric Sciences, Desert Research Institute, Reno, Nevada, USA 7 Department of Atmospheric Science, National Central University, Taoyuan City, Taiwan 2 School Correspondence to: P. Weiss-Penzias ([email protected]) Received: 17 June 2014 – Published in Atmos. Chem. Phys. Discuss.: 8 September 2014 Revised: 25 November 2014 – Accepted: 12 December 2014 – Published: 2 February 2015 Abstract. Atmospheric mercury (Hg) measurements using the Tekran® analytical system from five high-elevation sites (1400–3200 m elevation), one in Asia and four in the western US, were compiled over multiple seasons and years, and these data were compared with the GEOS-Chem global model. Mercury data consisted of gaseous elemental Hg (GEM) and “reactive Hg” (RM), which is a combination of the gaseous oxidized (GOM) and particulate bound (< 2.5 µm) (PBM) fractions as measured by the Tekran® system. We used a subset of the observations by defining a “free tropospheric” (FT) data set by screening using measured water vapor mixing ratios. The oxidation scheme used by the GEOS-Chem model was varied between the standard run with Br oxidation and an alternative run with OH–O3 oxidation. We used this model–measurement comparison to help interpret the spatio-temporal trends in, and relationships among, the Hg species and ancillary parameters, to understand better the sources and fate of atmospheric RM. The most salient feature of the data across sites, seen more in summer relative to spring, was that RM was negatively correlated with GEM and water vapor mixing ratios (WV) and positively correlated with ozone (O3 ), both in the standard model and the observations, indicating that RM was formed in dry upper altitude air from the photo-oxidation of GEM. During a free tropospheric transport high RM event observed sequentially at three sites from Oregon to Nevada, the slope of the RM / GEM relationship at the westernmost site was −1020 ± 209 pg ng−1 , indicating near-quantitative GEM-toRM photochemical conversion. An improved correlation between the observations and the model was seen when the model was run with the OH–O3 oxidation scheme instead of the Br oxidation scheme. This simulation produced higher concentrations of RM and lower concentrations of GEM, especially at the desert sites in northwestern Nevada. This suggests that future work should investigate the effect of Br- and O3 -initiated gas-phase oxidation occurring simultaneously in the atmosphere, as well as aqueous and heterogeneous reactions to understand whether there are multiple global oxidants for GEM and hence multiple forms of RM in the atmosphere. If the chemical forms of RM were known, then the collection efficiency of the analytical method could be evaluated better. 1 Introduction Mercury (Hg) is a neurotoxin that persists in the environment and bioaccumulates in food chains. It is dispersed globally by long-range atmospheric transport (Schroeder and Munthe, 1998; Strode et al., 2008). Anthropogenic sources emit Hg into the atmosphere as gaseous elemental mercury (GEM) and divalent chemical compounds (HgII ), whereas natural sources are thought to emit predominantly GEM (Pirrone et al., 2010). Oxidized atmospheric compounds (also Published by Copernicus Publications on behalf of the European Geosciences Union. 1162 P. Weiss-Penzias et al.: Use of a global model to understand speciated atmospheric mercury observations termed reactive mercury = RM = gaseous oxidized mercury (GOM) + particulate bound mercury (PBM)) are typically measured as two operationally defined forms. The first is adsorbed onto a KCl (potassium chloride)-coated denuder and the latter collected on quartz-fiber filters (Landis et al., 2002). Gaseous oxidized Hg is water soluble and removed rapidly from the atmosphere in wet deposition (Lindberg and Straton, 1998); however, it may be transported long distances in the free troposphere (Huang and Gustin, 2012; Ambrose et al., 2011; Wright et al., 2014). Dry deposition is also thought to be an important sink for GOM, and this has been demonstrated using surrogate surfaces (cf. Gustin et al., 2012; Wright et al, 2014; Huang et al., 2013; Sather et al., 2013; Castro et al., 2012). The lifetime of PBM, limited by particle size, is typically less than 10 days (Schroeder and Munthe, 1998). Gaseous elemental Hg has lower water solubility and an atmospheric lifetime on the order of months to a year (Schroeder and Munthe, 1998). This form may also make a contribution to dry deposition of equivalent magnitude to GOM (Zhang et al., 2012). Gaseous elemental Hg atoms may be re-emitted, depending on the surfaces on which they land (Gustin, 2011). Most measurements of Hg forms made using the Tekran® system have found that GEM comprises 95–100 % of total Hg (Valente et al., 2007), a result of the long lifetime of GEM, and the rapid removal of GOM and PBM by wet and dry deposition. However, observations in the free troposphere (FT) from a mountaintop site have shown that the concentrations of GOM can be roughly equivalent to the concentrations of GEM during brief periods (Swartzendruber et al., 2006; Timonen et al., 2013). Observations from aircraft have shown depletion of GEM in the upper troposphere/lower stratosphere (Talbot et al., 2007; Swartzendruber et al., 2008; Lyman and Jaffe, 2011), consistent with a previous hypothesis that Hg is contained within particles in this region of the atmosphere (Murphy et al., 2006). Recent measurements of oxidized forms from aircraft at an altitude of nearly 6 km have shown a strong correlation with ozone and potential vorticity, both tracers of stratospheric air (Lyman and Jaffe, 2011). It is currently thought that the process of formation of GOM in the upper atmosphere involves the oxidation of GEM by Br atoms (formed from BrO) (Holmes et al., 2006), but there is no current consensus (Subir et al., 2011). Early experiments with Hg+O3 (Hall, 1995) were likely influenced by wall effects (Hynes et al., 2009), and theoretical calculations from Goodsite et al. (2004) suggest that the Hg+OH reaction is not likely in the atmosphere. However, Dibble et al. (2012) suggested that a HgBr+OH reaction is possible. There is a current discussion among the atmospheric mercury measurement community that the Tekran® analytical system may produce GOM measurements that are biased too low due to poor uptake efficiency of the KCl denuder and quartz filter, and interferences due to the presence of ozone (O3 ) (Gustin and Jaffe, 2010; Gustin et al., 2013; Ambrose Atmos. Chem. Phys., 15, 1161–1173, 2015 et al., 2013; Huang et al., 2013; Kos et al., 2013; Huang et al., 2013; Jaffe et al., 2014; McClure et al., 2014). On the other hand, some studies have seen quantitative conversion of GEM to RM during events, as well as zero GEM concentrations coinciding with large RM concentrations (Moore et al., 2013, 2014), suggesting that the analytical system may perform more accurately in some environments with extreme low humidity. Thus, a goal of this study was to compare available Tekran® instrument measurements of GEM/GOM/PBM along with ozone and meteorology, from five surface sites that have reported interception of dry free troposphere air, with simulated speciated Hg concentrations from the GEOS-Chem Hg coupled atmosphere–ocean–land model (Amos et al., 2012), in order to examine spatio-temporal trends both in the observations and the model. Reactive Hg (RM = GOM+PBM) was used throughout this paper because, given the uncertainty and the GOM/PBM equilibria, RM is a more meaningful quantity than the individual species. This is the first attempt to compare observations across high-elevation sites and to incorporate model data to constrain the processes important for RM. In addition, we examined OH+O3 chemistry in the model as an alternative to the standard model run that uses Br as the oxidant, and compared it with the observations to reveal any clues about the likely oxidation mechanism for GEM. 2 2.1 Methods Site characteristics Maps depicting the locations of the study sites are shown in Fig. S1 in the Supplement. Site characteristics and the date ranges of the model–observation comparisons are given in Table 1. Four sites in this study are located at the temperate latitudes of North America, in the intermountain west. Two of these sites are on mountaintops: Mount Bachelor Observatory (MBO) and the Storm Peak Laboratory (SPL). Two other sites are within the Basin and Range Province of Nevada: the Desert Research Institute near Reno (DRI) and Paradise Valley north of Winnemucca (NV02). The fifth site, Lulin Atmospheric Background Station (LABS), is a tropical mountaintop location on the island of Taiwan in eastern Asia. Details of all these sites have been discussed elsewhere (Sheu et al., 2010; Swartzendruber et al., 2008; Stamenkovic et al., 2007; Weiss-Penzias et al., 2009; Faïn et al., 2009). The LABS site observed polluted air due to Asian outflow primarily in spring, fall and winter (Sheu et al., 2010), and biomass burning emissions from the Indochina Peninsula in spring (Sheu et al., 2012). Likewise, Asian long-range transport of GEM has been observed at MBO and SPL in spring (Jaffe et al., 2005; Obrist et al., 2008). The DRI and NV02 sites were operated by the University of Nevada–Reno from 2005 to 2007 (Peterson et al., 2009) and during the summer of 2007 (Lyman and Gustin, 2008), respectively. All sites www.atmos-chem-phys.net/15/1161/2015/ P. Weiss-Penzias et al.: Use of a global model to understand speciated atmospheric mercury observations have reported enhanced concentrations of GOM during periods of dry air and low GEM. 2.2 Speciated Hg and ancillary measurements At all sites, GEM, GOM, and PBM were measured with the Tekran® 2537/1130/1135 automated CVAFS instrument. Details of the Hg measurements, along with O3 and meteorology, are described in detail elsewhere (Swartzendruber et al., 2006; Faïn et al., 2009; Peterson et al., 2009; Lyman and Gustin, 2008; Sheu et al., 2010). Briefly, air is drawn into an inlet with a 2.5 µm size cut impactor into a KCl-coated denuder that absorbs GOM (unknown efficiency), then through a quartz fiber filter that is hypothesized to collect PBM, and finally across alternating Au cartridges that adsorb GEM. Gaseous elemental Hg measurements are recorded every 5 min, while GOM and PBM are collected for 2 h and desorbed for 1 h, giving a measurement every 3 h. Concentration units are ng m−3 at STP (standard temperature and pressure) (273.14 K and 1 atm) for GEM and pg m−3 at STP for GOM and PBM. The uncertainty in the GEM measurement when compared with other instruments is typically less than 10 % (Lyman et al., 2007). While the RAMIX results for GEM did identify one out of four instruments that had a significant discrepancy, three out of the four instruments had a very similar response for GEM (within 10 %) (Gustin et al., 2013). Another recent intercomparison also determined the average systematic uncertainty for Tekran® GEM measurements to be less than 10 %, but in some extreme cases it can be up to 20 % (Slemr et al., 2014). Thus, while the instruments in this study were not compared side by side, they were operated by trained technicians and likely produced results with the normal range of uncertainty. GEM can be calibrated with a primary source, but currently there is no calibrant for GOM or PBM, a serious limitation to the accuracy of the GOM and PBM data (Gustin and Jaffe, 2010; Jaffe et al., 2014). Furthermore, ambient ozone concentrations negatively interfere with the adsorption and retention of GOM on the denuder (Lyman et al., 2010). There is also recent evidence that GOM may be composed of various forms of Hg, including HgCl2 , HgBr2 , etc., and that the KCl-coated denuder may not collect all these forms with the equivalent efficiency (Gustin et al., 2012; Huang et al., 2013; Gustin et al., 2013). In addition to the denuder, some fraction of GOM may be collected on the quartz fiber filter in the particulate Hg instrument (Tekran® -1135) (Gustin et al., 2013), and for these reasons we present GOM + PBM = reactive Hg (RM) measurements in this paper. A recent intercomparison between Tekran® and new Hg measurement methods was performed, and it was found that the Tekran® RM measurements were systematically 2–3 times lower than HgII measured with other methods (Gustin et al., 2013; Huang et al., 2013). Thus, the Tekran® measurements reported in this paper, while representing the best available observations, must www.atmos-chem-phys.net/15/1161/2015/ 1163 be treated with caution in light of these uncertainties, and are likely a lower bound to the actual concentrations of RM. However, despite these uncertainties, we hypothesized that comparison of speciated Hg data from these high-elevation sites would be useful for comparing site-to-site variability and RM / GEM slopes. 2.3 GEOS-Chem model Model output was from version 9-01-01 of the GEOS-Chem (GC) Hg coupled atmosphere–ocean–land model (http:// www.geos-chem.org), described in detail elsewhere (Amos et al., 2012). Briefly, the simulation was conducted for 2004– 2009 with GEOS-5 assimilated meteorological and surface data from the NASA Global Modeling and Assimilation Office (GMAO) at 2◦ ×2.5◦ resolution. The GEOS-Chem simulation transports two Hg tracers into the atmosphere: Hg0 and HgII . The concentration units, as with the observations, are ng m−3 at STP (273.14 K and 1 atm) for GEM and pg m−3 at STP for GOM and PBM. We will compare results from a simulation with Br chemistry versus one with OH and ozone chemistry. While both oxidation mechanisms, and possibly others, may operate together in the real atmosphere, these idealized simulations enable us to explore the constraints that observations place on the atmospheric chemistry of mercury. Mercury redox chemistry in the standard GC model followed from Holmes et al. (2010), with oxidation of Hg0 by Br atoms according to the following reactions: Hg0 + Br + M → HgBr + M, 0 (R1) HgBr → Hg + Br, (R2) HgBr + Br → HgBr2 , (R3) HgBr + OH → HgBrOH, (R4) 0 HgBr + Br → Hg + Br2 . (R5) For rate expressions of these reactions, see Holmes et al. (2010). Photoreduction of HgII occurs in liquid cloud droplets. Alternatively, oxidation of Hg0 can proceed via OH and O3 in GEOS-Chem according to the following reactions (Pal and Ariya, 2004; Hall, 1995; Sommar et al., 2001; Selin et al., 2007): Hg0 + O3 → HgO + O2 , 0 (R6) Hg + HO → HgOH, (R7) HgOH + O2 → HgO + HO2 . (R8) Anthropogenic emissions are from the GEIA 2005 inventory (Pacyna et al., 2010). Model output is taken from pressure levels consistent with each site, and mean modeled values, on seasonal, daily, 12 h, and 3 h timescales, were compared with observations. Ancillary model output data (O3 , water vapor (WV), and temperature (T )) were generated from the v9-01-01 full chemistry simulation. GEOS-Chem has been extensively evaluated against Mercury Deposition Network Atmos. Chem. Phys., 15, 1161–1173, 2015 1164 P. Weiss-Penzias et al.: Use of a global model to understand speciated atmospheric mercury observations Table 1. Information on the five sites that are compared in this study∗ (listed from west to east). Site Site abbrev. Latitude Longitude Physical setting Elevation (m) Periods of measurement/model comparison Mt. Front Lulin, Taiwan LABS 23.51 120.92 Ridgetop summit, scrub forest 2862 Mt. Bachelor, Oregon, USA MBO 43.98 −121.69 Summit of dormant volcano, rock, ice 2763 Reno, Nevada, USA Paradise Valley, Nevada, USA DRI 39.57 −119.8 1497 NV02 41.5 −117.5 1388 13 Jun–21 Aug 2007 Storm Peak, Colorado, USA SPL 40.46 −106.74 Foothills, 5 km N of Reno, desert scrub Valley within basin and range, sagebrush, cultivated alfalfa Ridgetop summit, alpine 3–31 Mar, 30 Jun–23 Jul, 31 Aug–10 Sep, 30 Nov–31 Dec 2008 25 Apr–30 Jun 2006 17 Apr–17 Jul 2007 13 Mar–7 Jun 2008 1–20 May 2009 1 Jan 2005–21 Aug 2007 3200 29 Apr–1 Jul 2008 ∗ Details of all these sites have been discussed elsewhere (Weiss-Penzias et al., 2006 (MBO); Faïn et al., 2009 (SPL); Peterson et al., 2009 (DRI); Lyman and Gustin, 2008 (NV02); Sheu et al., 2010 (LABS)) wet deposition observations (Amos et al., 2012; Holmes et al., 2010; Selin and Jacob, 2008) as well as surface landbased sites, ship cruises, and plane flight data of GEM and seawater concentrations (Selin et al., 2008; Holmes et al., 2010; Soerensen et al., 2010; Amos et al., 2012). 2.4 FT subset of data based on water vapor measurements The global chemical transport model used here cannot resolve local effects that sometimes influenced the measurements at each site. The model samples in the free troposphere (FT), but each site had time periods where the air was from the boundary layer (BL) influenced by surface Hg sources and sinks. Comparisons between the observations and the model were made by applying a WV cutoff of WV < 75th percentile based on seasonal data sets (Table S1 in the Supplement). The drier air data set was termed “FT” and was used for model comparisons. The seasonal months were March–May (spring), June–August (summer), September– November (fall), and December–February (winter). This cutoff was evaluated by examining NO + NO2 = NOx concentrations at one site in Nevada (NV02) during the summer of 2007, where it was found that, when WV was less than the 75th percentile, mean NOx was 0.12 ppb, and that when WV was in the upper 25th percentile, mean NOx was 0.53 ppb. This supported our use of the cutoff. The drier air contained less NOx , and thus less influence from the BL. At NV02, NOx was positively correlated with GEM (r 2 = 0.57, p<0.05), and thus applying the WV screen to these data also removed very high GEM concentrations (> 6 ng m−3 ), likely from geogenic sources at the surface, from the FT data set. Applying a more stringent WV cutoff, such as < 50th percentile, would select data with even Atmos. Chem. Phys., 15, 1161–1173, 2015 less influence from the BL, but would have less statistical power due to small numbers of observations. Thus, the 75th percentile WV cutoff was chosen for all sites. Water vapor screens have been used previously based on the empirically derived equations described in Bolton (1980): WV g kg−1 = 77.345 + 0.0057 Tamb − 7235 T amb RH · (6.22) 0.01 · e P −1 , (1) 8.2 Tamb where RH is relative humidity, Tamb is the ambient temperature in kelvin, and P is the barometric pressure in hPa (Weiss-Penzias et al., 2006, 2009; Ambrose et al., 2011; Faïn et al., 2009; Sheu et al., 2010). Since barometric pressure data were not available for each site, a constant P was assumed for each site, based on the elevation of each site, which adds less than 1 % error to the WV calculation. 2.5 Statistical analyses Statistical calculations were performed with Origin 9.1. Comparisons between population means were considered significantly different based on a paired t test or ANOVA with p less than 0.05. For correlations between species in the observations and the model, daily means were used to avoid biases associated with diel variations. The model output and the observations were compared over equivalent time periods on the same time resolution. www.atmos-chem-phys.net/15/1161/2015/ P. Weiss-Penzias et al.: Use of a global model to understand speciated atmospheric mercury observations 3 3.1 Results and discussion Spatial and temporal trends in the observations Mean measured GEM concentration was highest at LABS during spring (2.2 ng m−3 ), likely due to Asian outflow impacting the island of Taiwan during this season (Sheu et al., 2010) (Fig. 1). The lowest observed seasonal mean GEM concentration occurred at DRI during summer at 1.36 ng m−3 , simultaneously with the highest observed RM measurements, suggesting photochemical conversion of GEM (Weiss-Penzias et al., 2009). Summertime GEM was lower compared to all other seasons at the sites with measurements in multiple seasons (MBO, DRI, LABS, SPL). Mean GEM concentrations from the unfiltered data set were larger than from the FT data set at NV02 (summer) and DRI (summer), but the opposite trend was observed at MBO (spring) and LABS (spring). This suggests that the desert sites were influenced more by local surface sources (Lyman and Gustin, 2008), whereas MBO and LABS have observed springtime Asian long-range transport of GEM in the FT (Jaffe et al., 2005; Sheu et al., 2010). Measured RM concentrations varied by a factor of about 7 between sites, with the highest concentrations occurring during summertime dry air conditions at DRI, MBO and SPL (Fig. 1). At the tropical site (LABS), summertime RM was at its seasonal minimum, due to high humidity and rapid loss from wet deposition, but during spring, RM was enhanced when the conditions at LABS were drier and more conducive to long-range transport. The FT data showed higher mean RM at every site and in every season, with notable increases of 40, 20, and 15 % for MBO summer, SPL summer, and DRI summer compared to unfiltered RM mean concentrations. This suggests that air from the FT at these sites was generally enhanced in RM and depleted in GEM, reflecting the photochemical loss of GEM and longer lifetime of RM in the FT. Measured O3 concentrations were 15–20 % higher during spring compared to summer at the North American mountaintop sites (MBO, SPL), which is different from the RM seasonal maximum in summer (Table S1). The desert sites located in Nevada showed WV mixing ratios equivalent to or below those at the mountaintop sites during summer. 3.2 1165 Standard model–measurement comparison The standard model showed the highest mean GEM concentration among all sites at LABS (2.10 ng m−3 ) during spring (Fig. 1), which was in close agreement with the observations (2.20 ng m−3 ) (Table S1). At all sites, the direction of the seasonal trend in GEM in the standard model agreed with the observations (spring > summer). The best agreement was at MBO, where spring mean GEM concentrations were 11 % greater than summer GEM concentrations in both the standard model and the observations. However, the standard www.atmos-chem-phys.net/15/1161/2015/ Figure 1. Means and standard deviations of observed and standardmodeled (a) GEM and (b) RM for each site by season. The WVscreened data are plotted in the same column as the unscreened data. model tended to overpredict GEM concentrations by about 10 % across all sites (Table S1), with the greatest difference in summer at DRI (+32 %). Modeled RM concentrations also varied by a factor of about 7 between sites (similar variance seen in the observations), with the highest concentrations predicted for MBO and SPL in spring and summer, and the lowest predicted for LABS in summer (Fig. 1, Table S1). However, in terms of absolute difference in RM concentrations, the model overpredicted the observations by a factor of 2.5 overall. The linear relationships between RM and other measured species (GEM, O3 , and WV) were determined both for the observations and the standard model. The slopes between Atmos. Chem. Phys., 15, 1161–1173, 2015 1166 P. Weiss-Penzias et al.: Use of a global model to understand speciated atmospheric mercury observations Figure 2. Slopes from the linear regressions of observed and standard-modeled RM vs. GEM, RM vs. O3 , and RM vs. water vapor daily mean concentrations for each site and season. Observed data were filtered using only data when WV is less than the 75th percentile. Winter and fall data not shown. All linear regression statistics given in Table S2. observed RM vs. GEM daily concentrations were negative at all sites during summer, and the standard model reproduced this RM / GEM trend at all sites (except for LABS) (Figs. 2 and 3, and Table S2). Positive slopes were observed between observed RM and O3 at all sites (significant at MBO, NV02, and SPL) during summer, and this trend was duplicated by the standard model (significant at all sites). Negative slopes between RM and WV were also observed Atmos. Chem. Phys., 15, 1161–1173, 2015 (significant at all sites except SPL) and modeled (significant at all sites) for data from summer. Negative correlations of RM with GEM and WV and positive correlations of RM with O3 , both in the observations and the standard model, are consistent with RM being formed in the free troposphere (where WV was low and O3 was high) from the photo-oxidation of GEM (resulting in low GEM). www.atmos-chem-phys.net/15/1161/2015/ P. Weiss-Penzias et al.: Use of a global model to understand speciated atmospheric mercury observations 1167 Figure 3. Scatterplots of RM vs. GEM daily mean concentrations for the WV-screened observations and the standard model delineated by site and season. In contrast to the summertime period, however, there was a greater lack of agreement between the model and observations for the spring data in Fig. 2 and Table S2. The slopes of interspecies correlations of observed RM with GEM were about a factor of 2 less negative during spring compared to summer at MBO and SPL (Fig. 2). At LABS, the spring RM / GEM ratio was a factor of 4 less negative compared to the summertime ratio, and at DRI, the RM / GEM ratio was positive (Fig. 2). Modeled RM / GEM ratios did not show the same seasonal trend, but instead were similar across spring and summer (∼ −275 for MBO, ∼ −150 for DRI and ∼ −350 pg ng−1 for SPL). For RM : O3 , the observed ratios were positive, and the observed RM : WV ratios were negative at all sites during summer, but during spring, these ratios did not show a consistent pattern (Fig. 2). Slopes of GOM vs. GEM of around −1 have been reported previously (Swartzendruber et al., 2006; Lyman and Jaffe, 2012). These have been for specific events, when one particular air mass was measured, and when total gaseous Hg is likely constant. For these conditions, a slope of −1 indicates that photochemical conversion of GEM to GOM has occurred and that there have been limited losses of GOM due to scavenging and deposition, and limited replenishment of GEM from the background pool. The RM / GEM slopes reported in Fig. 2 and Table S2 are greater than −1 (or −1000 pg ng−1 ); in other words, the slopes are less steep and the relationship between RM and GEM is weaker than the ideal −1 slope. For these data, we do not expect a slope of −1, since these are across an entire season. Over such a long www.atmos-chem-phys.net/15/1161/2015/ time period, GEM concentrations do not stay constant, especially at DRI, which has regular inputs from local natural enrichment, scavenging occurs at varying rates, and thus the lifetime of RM is highly variable. 3.3 Case study of free tropospheric transport This study also compared observed and modeled data on a 12 h time resolution during a period of subsiding air across western North America (see the weather maps and back trajectories shown in the Supplement) when observed RM concentrations were elevated. This event occurred during the week of 20–25 June 2007, when 12 h maximum concentrations of the RM reached 260, 250, and 100 pg m−3 at MBO, DRI, and NV02, respectively (Fig. 4 a, f, i). These maximum values were observed at the three sites sequentially in time along a west–east transect from central Oregon to northern Nevada. Maximum RM concentrations occurred at MBO during the night when downslope flow was observed, and maximum RM concentrations at DRI and NV02 occurred during the day when convective mixing was at its maximum. Observed 12 h mean GEM concentrations associated with the RM maxima were 1.0, 1.2, and 1.0 ng m−3 at MBO, DRI, and NV02, respectively (Fig. 4b, e, h), all significantly lower than the seasonal means of GEM at each site. The diurnal pattern in GEM can be seen in Fig. 4e and h for DRI and NV02, with higher concentrations during the night (12:00 UTC) and lower concentrations during the day (00:00 UTC) due to acAtmos. Chem. Phys., 15, 1161–1173, 2015 1168 P. Weiss-Penzias et al.: Use of a global model to understand speciated atmospheric mercury observations Figure 4. (a–i): The twelve h mean concentrations of O3 , water vapor, GEM, and RM at three sites during a high-RM event from 20 to 25 June 2007. Observational, standard model, and OH–O3 model data are shown. cumulation in the boundary layer at night and local geological emissions of GEM. MBO experienced the highest 3 h RM concentration of the three sites at 547 pg m−3 ; however, as discussed by Timonen et al. (2013), this event was meteorologically complex. High RM was first observed in an unusually low O3 air mass (23 ppb), but then O3 recovered to more typical values (Fig. 4a), while RM remained high (Fig. 4c) and water vapor was relatively low throughout this period (Fig. 4a). We interpret the RM event as follows: 21 June brought an air mass to MBO that was transported at low latitudes and was photochemically processed, with a maximum CO concentration of only 63 ppb, maximum particle scattering of 1 Mm−1 , and the aforementioned O3 concentration, and labeled as a “marine boundary layer” event by Timonen et al. (2013). This event was followed by another RM event on 22 June, when O3 rebounded to 50 ppb, which is more characteristic of FT air (Fig. 4a). Further evidence of the transport is given by the gridded frequency distribution of the HYSPLIT back trajectories shown in the supporting information (Fig. S3). At MBO, modeled O3 and WV concentrations from 20 to 26 June were higher and lower, respectively, than the observations, whereas at DRI and NV02, the model–observation agreement was better. We suspect that the global model did not reproduce the observed O3 concentrations at MBO due to the complex transport that was evident from the back trajectories. Observed water vapor concentrations at DRI and NV02 (Fig. 4d, g) were equivalent to, or lower than, WV observed at MBO (Fig. 4a), corresponding to minimum relative humidity values of 17, 6, and 3 % at MBO, DRI, and NV02, respectively. This indicates the very dry conditions in the desert and may have contributed to the longer lifetime of RM in the Atmos. Chem. Phys., 15, 1161–1173, 2015 atmosphere and also perhaps the better collection efficiency of the analytical system. The RM / GEM mean ratio calculated using the data including the maximum and minimum concentrations during the events followed both a longitudinal and an elevation trend. At the westernmost and highest elevation site, MBO, the RM / GEM event ratio was −1020 ± 209 pg ng−1 , compared with −568 ± 60 pg ng−1 at DRI and −173 ± 33 pg ng−1 at NV02, which was the easternmost and lowest elevation site. The nearness of the RM / GEM ratio to −1000 at MBO suggests approximate “mass conservation” between RM and GEM. Slopes of less than −1000 can indicate some combination of loss of RM due to deposition, air mass mixing with varying total Hg concentrations, and varying air chemistries producing different forms of RM that have different collection efficiencies by the KCl denuder (Huang et al., 2013). Model output from two simulations is also shown for this time: the standard Hg model with Br oxidation and the OH– O3 model with the oxidation scheme involving OH and O3 (Fig. 4b, c, e, f, h, i). At MBO, the model simulation with the OH–O3 chemistry provided a closer match in timing of peak RM concentrations (within 12 h) compared to the Br simulation (the RM peak was 2 days later) (Fig. 4c). The simulated RM / GEM slopes for the MBO event were −850 pg ng−1 and −750 pg ng−1 for the Br and OH–O3 simulations, respectively. Both model runs matched the timing of the RM peak at DRI within 12 h (Fig. 4f) and NV02 within 24 h (Fig. 4i). 3.4 Testing model oxidation RM and GEM observations were compared with Hg model simulations using two different oxidation schemes: Br and www.atmos-chem-phys.net/15/1161/2015/ P. Weiss-Penzias et al.: Use of a global model to understand speciated atmospheric mercury observations 1169 Figure 5. Comparison of observed, standard-modeled, and OH–O3 -modeled RM and GEM daily mean concentrations for spring/summer 2007 at MBO and summer 2007 at DRI. Figure 6. Comparison of linear relationships between GEM and RM in the observations with data from the model using either the Br or OH–O3 oxidation schemes. www.atmos-chem-phys.net/15/1161/2015/ Atmos. Chem. Phys., 15, 1161–1173, 2015 1170 P. Weiss-Penzias et al.: Use of a global model to understand speciated atmospheric mercury observations Figure 7. Plots of monthly mean RM / GEM from the observations vs. monthly mean RM / GEM in the standard model (left panel) and vs. monthly mean RM / GEM in the OH–O3 model (right panel). The units are pg ng−1 . The month is indicated by the labels on each data point. Only data from summer 2007 were considered for DRI, since the model with OH–O3 chemistry was not run for all time periods. OH–O3 , the reactions of which are listed above (cf. Holmes et al. (2010) and Selin et al. (2008), respectively). Bromine reaction kinetics are more widely accepted than the OH– O3 kinetic pathway, but there are still large uncertainties, and present instruments cannot directly confirm the chemical composition of RM, and, therefore, the oxidation mechanisms in the atmosphere are not known. Thus, we ran GEOSChem with either the OH–O3 or Br kinetics and compared it with the observations to test whether there was evidence of different oxidants of GEM or a single global oxidant. Daily mean RM and GEM concentrations from the observations at MBO and DRI and the two model runs are shown in Fig. 5. Note that the standard and OH–O3 models provide similar RM concentrations but different GEM concentrations. Correlations across the time series in Fig. 5 between observations and each model run for RM and GEM for MBO and DRI are shown in Fig. 6. For GEM at both sites, but more so at DRI, the OH–O3 model more closely matched the observations (steeper slope) compared to the Br model (Fig. 6). For RM, the OH–O3 model also produced steeper slopes and larger r 2 values compared to the Br model, again most notably at DRI. Simulated RM concentrations from the Br model were notably smaller than the observations during summer at DRI. This is significant because RM is probably already a lower bound on real ambient concentrations due to inefficiencies associated with the collection method. Figure 7 shows monthly mean RM / GEM ratios in the observations plotted against monthly mean RM / GEM ratios in the model using the Br oxidation scheme (left panel) and the OH–O3 oxidation scheme (right panel). Both the observations and the model agree that the higher RM / GEM ratios occurred in the summer months, and lower RM / GEM ratios occurred in spring. This is consistent with greater photochemical conversion of GEM and greater loss via dry deposition during spring (Sigler et al., 2009). Modeled RM / GEM Atmos. Chem. Phys., 15, 1161–1173, 2015 using either oxidation scheme was on average 2.5 ± 2.6 higher than the mean observed RM / GEM, a factor roughly in line with the estimate of collection inefficiency of the KCl denuder (Gustin et al., 2013). Note that, in Fig. 7, the RM / GEM ratios using the Br oxidation scheme fall into two patterns: data with a higher slope, which include those from DRI and NV02 (the desert sites), and data with a lower slope, which include those from MBO and SPL (the mountaintop sites). In contrast, the RM / GEM ratios using the OH–O3 oxidation scheme from all sites generally fall along one line. This is a consequence of higher RM concentrations and lower GEM concentrations modeled using the OH–O3 oxidation scheme relative to the Br scheme, as shown in Fig. 5. The increase in RM concentrations modeled with the OH–O3 scheme relative to the Br scheme is greater for the desert sites than for MBO and SPL, the mountaintop sites. This result suggests the presence of different chemical regimes in different parts of the troposphere and signals that there is not necessarily one single global oxidant. Future GEOS-Chem work should investigate the effect of Br- and O3 -initiated gas-phase oxidation occurring simultaneously in the atmosphere, as well as aqueous and heterogeneous reactions. 4 Conclusions In this study, we have compiled the available speciated atmospheric Hg measurements from three high elevation and two mid-elevation sites (four in the US and one in Taiwan) and compared them to the GEOS-Chem global Hg model with two different oxidation schemes in order to examine spatiotemporal trends both in the observations and the model and to test for evidence of multiple GEM oxidation pathways in the atmosphere. Overall, the comparison between observed mercury species (GEM and RM) and those from the standard www.atmos-chem-phys.net/15/1161/2015/ P. Weiss-Penzias et al.: Use of a global model to understand speciated atmospheric mercury observations model showed a relatively weak relationship, which demonstrates the need to strengthen our understanding of fundamental chemistry and measurement artifacts. Where the observations and the standard model agreed was in displaying negative correlations between RM and GEM, negative correlations between RM and WV, and positive correlations between RM and O3 . This indicated the tendency of RM to be produced in dry upper altitude air from the photo-oxidation of GEM. A case study of a wide-scale subsidence event observed from Oregon to Nevada at three sites sequentially showed that RM concentrations were enhanced and GEM concentrations were depleted, with an observed RM / GEM ratio at MBO of −1020 ± 209 pg ng−1 , a slope suggesting stoichiometric conversion of Hg0 to HgII and minimal analytical collection inefficiencies. The correlations in the observations were weaker in spring compared to summer, but not in the standard model, suggesting a seasonal change in the sources and/or sinks of RM that was not simulated in the model and/or a seasonal change in the collection efficiency of the method. The variability of seasonal mean observed RM concentrations across sites was a factor of about 7, with the highest concentrations seen at DRI and at MBO in summer and the lowest at LABS in summer. The standard model also simulated mean RM concentrations that varied by a factor of about 7 across sites, but these concentrations were offset positively from the observations by a mean factor of 2.5 across all sites. However, the model offset was not equivalent at all sites, with mean observed RM concentrations across three consecutive summers at DRI being slightly higher than RM concentrations from the standard model (76 vs. 72 pg m−3 ). When the model was run with the OH–O3 oxidation scheme instead of the Br oxidation scheme, it was found that mean concentrations of RM were higher and GEM were lower, especially at the DRI and NV02 desert sites, producing better correlations between measured/modeled RM and GEM compared to the model with the Br oxidation scheme. This is consistent with multiple GEM oxidation pathways occurring in the atmosphere, and hence with multiple forms of RM. The Supplement related to this article is available online at doi:10.5194/acp-15-1161-2015-supplement. Acknowledgements. The authors wish to thank SPL personnel Gannet Hallar, Ian McCubbin, and Xavier Faïn, and the Taiwan Environmental Protection Administration for financially supporting the atmospheric Hg monitoring at LABS. We would also like to thank the past UNR graduate students that collected the DRI and NV02 data, Seth Lyman and Christiana Peterson, and Harvard graduate student Hannah Horowitz. We also thank the anonymous reviewers for their useful comments. Edited by: L. Zhang www.atmos-chem-phys.net/15/1161/2015/ 1171 References Ambrose, J. L., Reidmiller, D. R., and Jaffe, D. A.: Causes of high O3 in the lower free troposphere over the Pacific Northwest as observed at the Mt. Bachelor Observatory, Atmos. Environ., 45, 5302–5315, 2011. Ambrose, J. L., Lyman, S. N., Huang, J. Gustin, M. S., and Jaffe, D. A.: Fast time resolution oxidized mercury measurements during the Reno Atmospheric Mercury Intercomparison Experiment (RAMIX), Environ. Sci. Technol., 47, 7285–7294, 2013. Amos, H. M., Jacob, D. J., Holmes, C. D., Fisher, J. A., Wang, Q., Yantosca, R. M., Corbitt, E. S., Galarneau, E., Rutter, A. P., Gustin, M. S., Steffen, A., Schauer, J. J., Graydon, J. A., Louis, V. L. St., Talbot, R. W., Edgerton, E. S., Zhang, Y., and Sunderland, E. M.: Gas-particle partitioning of atmospheric Hg(II) and its effect on global mercury deposition, Atmos. Chem. Phys., 12, 591–603, doi:10.5194/acp-12-591-2012, 2012. Bolton, D.: The computation of equivalent potential temperature, Mon. Weather Rev., 108, 1046–1053, 1980. Castro, M. S., Moore, C., Sherwell, J., and Brooks, S. B.: Dry deposition of gaseous oxidized mercury in Western Maryland, Sci. Total. Environ., 417–418, 232–240, 2012. Dibble, T. S., Zelie, M. J., and Mao, H.: Thermodynamics of reactions of ClHg and BrHg radicals with atmospherically abundant free radicals, Atmos. Chem. Phys., 12, 10271–10279, doi:10.5194/acp-12-10271-2012, 2012. Faïn, X., Obrist, D., Hallar, A. G., Mccubbin, I., and Rahn, T.: High levels of reactive gaseous mercury observed at a high elevation research laboratory in the Rocky Mountains, Atmos. Chem. Phys., 9, 8049–8060, doi:10.5194/acp-9-8049-2009, 2009. Goodsite, M., Plane, J., and Skov, H.: A theoretical study of the oxidation of Hg0 to HgBr2 in the troposphere, Environ. Sci. Technol., 38, 1772–1776, doi:10.1021/es034680s, 2004. Gustin, M. S.: Exchange of mercury between the atmosphere and terrestrial ecosystems, in: Environmental Chemistry and Toxicology of Mercury, edited by: Liu, G, Cai, Y, and O’Driscoll, N., John Wiley and Sons, Hoboken, New Jersey, USA, doi:10.1002/9781118146644.ch13, 2011. Gustin, M. S. and Jaffe, D. A.: Reducing the uncertainty in measurement and understanding of mercury in the atmosphere, Environ. Sci. Technol., 44, 2222–2227, 2010. Gustin, M. S., Weiss-Penzias, P. S., and Peterson, C.: Investigating sources of gaseous oxidized mercury in dry deposition at three sites across Florida, USA, Atmos. Chem. Phys., 12, 9201–9219, doi:10.5194/acp-12-9201-2012, 2012. Gustin, M. S., Huang, J., Miller, M. B., Finley, B. D., Call, K., Ambrose, J. L., Peterson, C., Lyman, S. N., Everhart, S., Bauer, D., Remeika, J., Hynes, A., Jaffe, D. A., and Lindberg, S. E.: RAMIX – a step towards understanding mercury atmospheric chemistry and Tekran® observations, Environ. Sci. Technol., 47, 7295–7306, 2013. Hall, B.: The gas phase oxidation of elemental mercury by ozone, Water Air Soil Poll., 80, 301–315, 1995. Holmes, C., Jacob, D., and Yang, X.: Global lifetime of elemental mercury against oxidation by atomic bromine in the free troposphere. Geophys. Res. Lett., 33, L20808, doi:10.1029/2006GL027176, 2006. Holmes, C. D., Jacob, D. J., Corbitt, E. S., Mao, J., Yang, X., Talbot, R., and Slemr, F.: Global atmospheric model for mercury Atmos. Chem. Phys., 15, 1161–1173, 2015 1172 P. Weiss-Penzias et al.: Use of a global model to understand speciated atmospheric mercury observations including oxidation by bromine atoms, Atmos. Chem. Phys., 10, 12037–12057, doi:10.5194/acp-10-12037-2010, 2010. Huang, J. Y. and Gustin, M. S.: Evidence for a free troposphere source of mercury in wet deposition in the western United States, Environ, Sci. Technol., 46, 6621–6629, 2012. Huang, J. Y., Miller, M. B., Weiss-Penzias, P., and Gustin, M. S.: Comparison of Gaseous Oxidized Hg Measured by KCl-Coated Denuders, and Nylon and Cation Exchange Membranes, Environ. Sci. Technol., 47, 7307–7316, doi:10.1021/es4012349, 2013. Hynes, A. J., Donohoue, D. L., Goodsite, M. E., and Hedgecock, I. M.: Our current understanding of major chemical and physical processes affecting mercury dynamics in the atmosphere and at the air-water/terrestrial interfaces, in: Mercury Fate and Transport in the Global Atmosphere, edited by: Mason, R. and Pirrone, N., Springer, New York, 427–457, 2009. Jaffe, D., Prestbo, E., Swartzendruber, P., Weiss-Penzias, P., Kato, S., Takami, A., Hatakeyama, S., and Kajii, Y.: Export of atmospheric mercury from Asia, Atmos. Environ., 39, 3029–3038, 2005. Jaffe, D. A., S. Lyman, Amos, H. M., Gustin, M. S., Huang, J., Selin, N. E., Levin, L., ter Schure, A., Mason, R. P., Talbot, R., Rutter, A., Finley, B., Jaeglé, L., Shah, V., McClure, C., Ambrose, J., Gratz, L., Lindberg, S., Weiss-Penzias, P., Sheu, G.-R., Feddersen, D., Horvat, M., Dastoor, A., Hynes, A. J., Mao, H., Sonke, J. E., Slemr, F., Fisher, J. A., Ebinghaus, R., Zhang, Y., and Edwards, G.: Progress on Understanding Atmospheric Mercury Hampered by Uncertain Measurements, Environ. Sci. Technol., 48, 7204–7206, doi:10.1021/es5026432, 2014. Kos, G., Ryzhkov, A., Dastoor, A., Narayan, J., Steffen, A., Ariya, P. A., and Zhang, L.: Evaluation of discrepancy between measured and modelled oxidized mercury species, Atmos. Chem. Phys., 13, 4839–4863, doi:10.5194/acp-13-4839-2013, 2013. Landis, M. S., Stevens, R. K., Schaedlich, F., and Prestbo, E. M.: Development and characterization of an annular denuder methodology for the measurement of divalent inorganic reactive gaseous mercury in ambient air, Environ. Sci. Technol., 36, 3000–3009, 2002. Lindberg, S. E. and Stratton, W. J.: Atmospheric mercury speciation: concentrations and behavior of reactive gaseous mercury in ambient air, Environ. Sci. Technol., 32, 49–57, 1998. Lyman, S. N., Gustin, M. S., Prestbo, E. M., and Marsik, F. J.: Estimation of Dry Deposition of Atmospheric Mercury in Nevada by Direct and Indirect Methods, Environ. Sci. Technol., 41, 1970– 1976, 2007. Lyman, S. N. and Gustin, M. S.: Speciation of atmospheric mercury at two sites in northern Nevada, USA, Atmos. Environ., 42, 927– 939, doi:10.1016/j.atmosenv.2007.10.012, 2008. Lyman, S. N. and Jaffe, D. A.: Formation and fate of oxidized mercury in the upper troposphere and lower stratosphere, Nat. Geosci., 5, 114–117, doi:10.1038/NGEO1353, 2011. Lyman, S. N., Jaffe, D. A., and Gustin, M. S.: Release of mercury halides from KCl denuders in the presence of ozone, Atmos. Chem. Phys., 10, 8197–8204, doi:10.5194/acp-10-81972010, 2010. McClure, C. D., Jaffe, D. A., and Edgerton, E. S.: Evaluation of the KCl Denuder Method for Gaseous Oxidized Mercury using HgBr2 at an In-Service AMNet Site, Environ. Sci. Technol., 48, 11437–11444, 2014. Atmos. Chem. Phys., 15, 1161–1173, 2015 Moore, C. W., Obrist, D., and Luria, M.: Atmospheric mercury depletion events at the Dead Sea: Spatial and temporal aspects, Atmos. Environ., 69, 231–239, 2013. Moore, C. W., Obrist, D., Steffen, A., Staebler, R., Douglas, T., Richter, A., and Nghiem, S.: Convective forcing of mercury and ozone in the Arctic boundary layer induced by leads in sea ice, Nature, 506, 81–84, doi:10.1038/nature12924, 2014. Murphy, D. M., Hudson, P. K., Thompson, D. S., Sheridan, P. J., and Wilson, J. C.: Observations of mercury-containing aerosols, Environ. Sci. Technol., 40, 3163–3167, 2006. Obrist, D., Hallar, A. G., McCubbin, I., Stephens, B. B., and Rahn, T.: Atmospheric mercury concentrations at Storm Peak Laboratory in the Rocky Mountains: evidence for longrange transport from Asia, boundary layer contributions, and plant mercury uptake, Atmos. Environ., 42, 7579–7589, doi:10.1016/j.atmosenv.2008.06.051, 2008. Pal, B. and P. A. Ariya: Studies of ozone initiated reactions of gaseous mercury: Kinetics, product studies, and atmospheric implications, Phys. Chem. Chem. Phys., 6, 572–579, 2004. Pacyna, E. G., Pacyna, J. M., Sundseth, K., Munthe, J., Kindbom, K., Wilson, S., Steenhuisen, F., and Maxson, P.: Global emission of mercury to the atmosphere from anthropogenic sources in 2005 and projections to 2020, Atmos. Environ., 44, 2487–2499, doi:10.1016/j.atmosenv.2009.06.009, 2010. Peterson, C., Gustin, M., and Lyman, S.: Atmospheric mercury concentrations and speciation measured from 2004 to 2007 in Reno, Nevada, USA, Atmos. Environ., 43, 4646–4654, 2009. Pirrone, N., Cinnirella, S., Feng, X., Finkelman, R. B., Friedli, H. R., Leaner, J., Mason, R., Mukherjee, A. B., Stracher, G. B., Streets, D. G., and Telmer, K.: Global mercury emissions to the atmosphere from anthropogenic and natural sources, Atmos. Chem. Phys., 10, 5951–5964, doi:10.5194/acp-10-59512010, 2010. Sather, M. E., Mukerjee, S., Smith, L., Mathew, J., Jackson, C., Callison, R., Scrapper, L., Hathcoat, A., Adam, J., Keese, D., Ketcher, P., Brunette, R., Calstrom, J., and Van der Jagt, G.: Gaseous oxidized mercury dry deposition measurements in the Four Corners Area and Eastern Oklahoma, USA, Atmos. Pollut. Res., 4, 168–180, 2013. Schroeder, W. H. and Munthe, J.: Atmospheric mercury – an overview, Atmos. Environ., 32, 809–822, 1998. Selin, N. E. and Jacob, D. J.: Seasonal and spatial patterns of mercury wet deposition in the United States: Constraints on the contribution from North American anthropogenic sources, Atmos. Environ., 42, 5193–5204, doi:10.1016/j.atmosenv.2008.02.069, 2008. Selin, N. E., Jacob, D. J., Park, R. J., Yantosca, R. M., Strode, S., Jaeglé, L., and Jaffe, D.: Chemical cycling and deposition of atmospheric mercury: Global constraints from observations, J. Geophys. Res.-Atmos., 112, D02308, doi:10.1029/2006jd007450, 2007. Selin, N. E., Jacob, D. J., Yantosca, R. M., Strode, S., Jaeglé, L., and Sunderland, E. M.: Global 3-D land-ocean-atmosphere model for mercury: Present-day versus preindustrial cycles and anthropogenic enrichment factors for deposition, Global Biogeochem. Cyc., 22, 1–13, doi:10.1029/2007GB003040, 2008. Sheu, G.-R., Lin, N.-H., Wang, J.-L., Lee, C.-T., Ou Yang, C.-F., and Wang, S.-H.: Temporal distribution and potential sources of www.atmos-chem-phys.net/15/1161/2015/ P. Weiss-Penzias et al.: Use of a global model to understand speciated atmospheric mercury observations atmospheric mercury measured at a high-elevation background station in Taiwan. Atmos. Environ., 44, 2393–2400, 2010. Sheu, G.-R., Lin, N.-H., Lee, C.-T., Wang, J.-L., Chuang, M.-T., Wang, S.-H., Chi, K. H., and Ou Yang, C.-F.: Distribution of atmospheric mercury in northern Southeast Asia and South China Sea during Dongsha Experiment, Atmos. Environ., 78, 174–183, doi:10.1016/j.atmosenv.2012.07.002, 2012. Sigler, J. M., Mao, H., and Talbot, R.: Gaseous elemental and reactive mercury in Southern New Hampshire, Atmos. Chem. Phys., 9, 1929–1942, doi:10.5194/acp-9-1929-2009, 2009. Slemr, F., Angot, H., Dommergue, A., Magand, O., Barret, M., Weigelt, A., Ebinghaus, R., Brunke, E.-G., Pfaffhuber, K., Edwards, G., Howard, D., Powell, J., Keywood, M., and Wang, F.: Comparison of mercury concentrations measured at several sites in the Southern Hemisphere, Atmos. Chem. Phys. Discuss., 14, 30611–30637, doi:10.5194/acpd-14-30611-2014, 2014. Soerensen, A. L., Skov, H., Jacob, D. J., Soerensen, B. T., and Johnson, M. S.: Global concentrations of gaseous elemental mercury and reactive gaseous mercury in the marine boundary layer, Environ. Sci. Technol., 44, 425–427, 2010. Sommar, J., Gårdfeldt, K., Strömberg, D., and Feng, X.: A kinetic study of the gas-phase reaction between the hydroxyl radical and atomic mercury, Atmos. Environ., 35, 3049–3054, 2001. Stamenkovic, J., Lyman, S., and Gustin, M.: Seasonal and diel variation of atmospheric mercury concentrations in the Reno (Nevada, USA) airshed, Atmos. Environ., 41, 6662–6672, 2007. Strode, S. A., Jaeglé, L., Jaffe, D. A., Swartzendruber, P. C., Selin, N. E., Holmes, C., and Yantosca, R. M.: TransPacific transport of mercury, J. Geophys. Res., 113, D15305, doi:10.1029/2007JD009428., 2008. Subir, M., Ariya, P. A., and Dastoor, A. P.: A review of uncertainties in atmospheric modeling of mercury chemistry I. Uncertainties in existing kinetic parameters: fundamental limitations and the importance of heterogeneous chemistry, Atmos. Environ., 45, 5664–5676, 2011. Swartzendruber, P. C., Jaffe, D. A., Prestbo, E. M., WeissPenzias, P., Selin, N. E., Park, R., Jacob, D. J., Strode, S., and Jaeglé, L.: Observations of reactive gaseous mercury in the free troposphere at the Mount Bachelor Observatory. J. Geophys. Res., 111, D24301, doi:10.1029/2006JD007415, 2006. www.atmos-chem-phys.net/15/1161/2015/ 1173 Swartzendruber, P. C., Chand, D., Jaffe, D. A., Smith, J., Reidmiller, D., Gratz, L., Keeler, J., Strode, S., Jaeglé, L., and Talbot, R.: Vertical distribution of mercury, CO, ozone, and aerosol scattering in the Pacific Northwest during the spring 2006 INTEX-B campaign, J. Geophys. Res., 113, D10305, doi:10.1029/2007JD009579, 2008. Talbot, R., Mao, H., Scheuer, E., Dibb, J., and Avery, M.: Total depletion of Hg◦ in the upper troposphere-lower stratosphere, Geophys. Res. Lett., 34, L23804, doi:10.1029/2007GL031366, 2007. Timonen, H., Ambrose, J. L., and Jaffe, D. A.: Oxidation of elemental Hg in anthropogenic and marine airmasses, Atmos. Chem. Phys., 13, 2827–2836, doi:10.5194/acp-13-2827-2013, 2013. Valente, R. J., Shea, C., Humes, K. L., and Tanner, R. L.: Atmospheric mercury in the Great Smoky Mountains compared to regional and global levels. Atmos. Environ., 41, 1861–1873, 2007. Weiss-Penzias, P., Jaffe, D. A., Swartzendruber, P., Dennison, J. B., Chand, D., Hafner, W., and Prestbo, E.: Observations of Asian air pollution in the free troposphere at Mount Bachelor Observatory during the spring of 2004, J. Geophys. Res., 111, D10304, doi:10.1029/2005JD006522, 2006. Weiss-Penzias, P., Gustin, M. S., and Lyman, S. N.: Observations of speciated atmospheric mercury at three sites in Nevada: evidence for a free tropospheric source of reactive gaseous mercury, J. Geophys. Res., 114, D14302, doi:10.1029/2008JD011607, 2009. Wright, G., Miller, M. B., Weiss-Penzias, P., and Gustin, M.: Investigation of mercury deposition and potential sources at six sites from the Pacific Coast to the Great Basin, USA, Sci. Total Environ, 470–471C, 1099–1113, doi:10.1016/j.scitotenv.2013.10.071, 2014. Zhang, L., Blanchard P., Johnson, D., Dastoor, A., Ryzhkov, A., Lin, C. J., Vijayaraghavan, K., Gay, D., Holsen, T. M., Huang, J., Graydon, J. A., St. Louis, V. L., Castro, M. S., Miller, E. K., Marsik, F., Lu, J., Poissant, L., Pilote, M., and Zhang, K. M.: Assessment of modeled mercury dry deposition over the Great Lakes region, Environ. Pollut, 161, 272–283, 2012. Atmos. Chem. Phys., 15, 1161–1173, 2015

© Copyright 2026