
A framework for assessing hydrological regime sensitivity to climate
Hydrol. Earth Syst. Sci., 19, 567–581, 2015
www.hydrol-earth-syst-sci.net/19/567/2015/
doi:10.5194/hess-19-567-2015
© Author(s) 2015. CC Attribution 3.0 License.
A framework for assessing hydrological regime sensitivity to climate
change in a convective rainfall environment: a case study of two
medium-sized eastern Mediterranean catchments, Israel
N. Peleg1 , E. Shamir2 , K. P. Georgakakos2,3 , and E. Morin4
1 Hydrology
and Water Resources Program, Hebrew University of Jerusalem, Givat Ram, Jerusalem 91904, Israel
Research Center, San Diego, California, USA
3 Scripps Institution of Oceanography, University of California San Diego, California, USA
4 Department of Geography, Hebrew University of Jerusalem, Jerusalem 91905, Israel
2 Hydrologic
Correspondence to: N. Peleg ([email protected])
Received: 14 July 2014 – Published in Hydrol. Earth Syst. Sci. Discuss.: 23 September 2014
Revised: – – Accepted: 5 January 2015 – Published: 29 January 2015
Abstract. A modeling framework is formulated and applied
to assess the sensitivity of the hydrological regime of two
catchments in a convective rainfall environment with respect
to projected climate change. The study uses likely rainfall
scenarios with high spatiotemporal resolution that are dependent on projected changes in the driving regional meteorological synoptic systems. The framework was applied to
a case study in two medium-sized Mediterranean catchments
in Israel, affected by convective rainfall, by combining the
HiReS-WG rainfall generator and the SAC-SMA hydrological model. The projected climate change impact on the hydrological regime was examined for the RCP4.5 and RCP8.5
emission scenarios, comparing the historical (beginning of
the 21st century) and future (mid-21st-century) periods from
three general circulation model simulations available from
CMIP5. Focusing on changes in the occurrence frequency
of regional synoptic systems and their impact on rainfall
and streamflow patterns, we find that the mean annual rainfall over the catchments is projected to be reduced by 15 %
(outer range 2–23 %) and 18 % (7–25 %) for the RCP4.5 sand
RCP8.5 emission scenarios, respectively. The mean annual
streamflow volumes are projected to be reduced by 45 % (10–
60 %) and 47 % (16–66 %). The average events’ streamflow
volumes for a given event rainfall depth are projected to be
lower by a factor of 1.4–2.1. Moreover, the streamflow season in these ephemeral streams is projected to be shorter by
22 % and 26–28 % for the RCP4.5 and RCP8.5, respectively.
The amplification in reduction of streamflow volumes relative to rainfall amounts is related to the projected reduc-
tion in soil moisture, as a result of fewer rainfall events and
longer dry spells between rainfall events during the wet season. The dominant factors for the projected reduction in rainfall amount were the reduction in occurrence of wet synoptic systems and the shortening of the wet synoptic systems
durations. Changes in the occurrence frequency of the two
dominant types of the regional wet synoptic systems (active
Red Sea trough and Mediterranean low) were found to have
a minor impact on the total rainfall.
1
Introduction
Rainfall spatial and temporal variability plays a major role
in the hydrological response of catchments affecting runoff
timing, streamflow volume, and peak discharge (Morin et al.,
2006; Morin and Yakir, 2014; Paschalis et al., 2014; Rozalis et al., 2010; Singh, 1997). The role of rainfall variability
is even greater in climate regimes where a substantial portion of rainfall is convective and runoff is sensitive to this
type of rainfall (Morin and Yakir, 2014; Peleg and Morin,
2014; Rozalis et al., 2010; Smith et al., 2000; Yakir and
Morin, 2011). The hydrological response was found to be
sensitive to rainfall spatial variability in very small catchments (less than 1 km2 ; Bahat et al., 2009), in catchments of
few dozen km2 (Zoccatelli et al., 2011) and larger catchments
(> 100 km2 ; Arnaud et al., 2011). It is therefore essential to
use rainfall data with high spatial and temporal resolution
Published by Copernicus Publications on behalf of the European Geosciences Union.
568
N. Peleg et al.: Modeling convective rainfall sensitivity to climate change
for hydrological modeling purpose. Such resolution can be
provided for small and medium sized catchments by weather
radar data (e.g., 1.5 km2 and 3 min, Peleg et al., 2013) and for
large catchments by satellite data (e.g., Nikolopoulos et al.,
2010; Shamir et al., 2013).
General circulation models (GCMs) used for climate studies and climate projections have coarser spatial and temporal resolution than usually required for hydrological simulations. For example, most GCM simulations that are available from the Coupled Model Intercomparison Project Phase
5 (CMIP5) have a spatial scale larger than 10 000 km2 and
monthly to 6 h reporting intervals (an extensive overview of
CMIP5 is given by Moss et al., 2010 and Taylor et al., 2012),
which is inadequate to serve as input for catchment scale hydrologic modeling.
To generate GCM-forced rainfall input with spatial and
temporal scales that are appropriate for catchment scale hydrologic modeling, dynamical and statistical downscaling
methods were developed (e.g., Fowler et al., 2007; Hewitson and Crane, 1996; Wilby and Wigley, 1997). Dynamical
downscaling uses output from the GCM as boundary conditions for a nested regional circulation model (RCM) with
higher spatial and temporal resolution that accounts for local and regional climate processes and orographic influences.
Due to the significant computational time involved, dynamical downscaling efforts often yield a single downscaled realization of physically consistent input vectors for hydrologic modeling (e.g., downscaling 30 years of GCM data produces a single 30 year simulation). This approach often requires bias adjustment for the downscaled high resolution
fields and/or for the resultant streamflow (Georgakakos et al.,
2012a).
A less computationally intensive approach uses statistical downscaling of the GCM fields. In statistical downscaling, statistical relationships are formed between local observations (e.g., temperature or rainfall intensity at ground
gauges) and large scale atmospheric variables simulated by
the GCMs (e.g., sea level pressure or specific humidity). This
downscaling method permits the incorporation of changes
in the mean and variability of climate in a statistically consistent and computationally inexpensive way (Semenov and
Barrow, 1997). It does, however, simplify the large-to-small
scale process dynamics and arrives at relationships for such
dynamics that are calibrated based on the historical climate.
Statistical downscaling is often integrated with a weather
generator (WG), which is a stochastic model that simulates
a likely weather time series realizations that are based on
statistical analysis of observed local data (Wilks and Wilby,
1999). In contrast to dynamical downscaling, an ensemble of
many realizations can be generated to represent the statistical
properties of the weather. Statistical downscaling is used in
this work as a first step to understand the sensitivity of the
hydrologic regime to climate change.
WG can be used to generate rainfall that represents different statistical characteristics of the regional synoptic sysHydrol. Earth Syst. Sci., 19, 567–581, 2015
tems (e.g., Robertson et al., 2004; Kioutsioukis et al., 2008;
Samuels et al., 2009; Shamir et al., 2014b). In these cases,
however, the rainfall was generated with a daily temporal resolution for point locations. Thober et al. (2014) presented a
daily but spatially high-resolution rainfall generator (4 km2 )
that satisfies the requirements for assessments of hydrological response at regional and continental scales. Two WG
models that were recently presented by Paschalis et al. (2013)
and Peleg and Morin (2014), simulate rainfall in high spatial and temporal resolution (4 km2 and 5 min and 0.25 km2
and 5 min, respectively). This is a resolution that is adequate
for hydrological modeling of small size (less than 50 km2 )
catchments assuming reliable rainfall estimates (Borga et al.,
2014). The latter rainfall generator model (high resolution
synoptically conditioned weather generator (HiReS-WG),
Peleg and Morin, 2014) which is used in this study, is unique
in that it was designed to capture convective characteristics
in a climate regime that is dominated by convective rainfall.
In this study we present a new modeling framework to
assess projected climate impact on the hydrological regime
by generating high spatiotemporal resolution rain fields with
statistics that are dependent on the regional meteorological
synoptic systems (Fig. 1). The suggested modeling framework integrates methods and models from various disciplines
such as a classification of synoptic systems, remote sensing
of rainfall, stochastic convective rainfall generator, and hydrological modeling. This integration enables, for the first
time, an assessment of the impact of climate change on the
hydrological regime in an environment that is strongly influenced by convective rainfall. To exemplify the presented
modeling framework, two medium size catchments in Israel
were selected for a case study. Section 2 describes the suggested conceptual modeling framework, and Sect. 3 presents
the case study. The projected rainfall and runoff changes are
presented in Sect. 4, and discussion and conclusions are in
Sect. 5.
2
A framework for assessing the sensitivity of the
hydrologic regime to climate change
A conceptual framework for assessing the sensitivity of the
hydrologic regime to climate change is presented on the left
side of Fig. 1. This framework integrates several tools and
models that were previously developed by the authors. The
steps of the conceptual modeling framework and their relation with the previously developed tools and models are presented in the following section. First, using reanalysis data,
a synoptic classification is performed to determine the regional synoptic system prevalent during rainfall events and
its occurrence frequency for the historical climate record.
Second, a historical record of remotely sensed rainfall estimate is used to derive the relevant rainfall spatiotemporal
statistical properties for each synoptic system. Third, based
on the first and second steps, the WG is used to generate an
www.hydrol-earth-syst-sci.net/19/567/2015/
N. Peleg et al.: Modeling convective rainfall sensitivity to climate change
569
Figure 1. A framework flow chart (left) for assessing the sensitivity of the hydrologic regime to climate change. Models mentioned in
parenthesis (italic caption) relate to the models or methods used for the case study of upper Dalya and upper Taninim catchments. The
catchments are presented in the lower right side (red dots represent the hydrometric stations) and the prevailing two wet synoptic systems
affecting the region are presented in the upper right side (contours represent sea level pressure in hPa, blue star indicate the catchments
location).
ensemble of likely rainfall realizations that represents the historical climate. Fourth, the GCM synoptic variables are bias
corrected to match the synoptic variables derived from the
reanalysis data during the analyzed historic period, and projected changes in the occurrence frequency of future synoptic systems are then estimated from the bias corrected GCM.
Fifth, the WG is used to generate an ensemble of likely rainfall scenarios that represent the occurrence frequency of the
GCM’s projected synoptic systems. Sixth, the historic and
projected synthetic rainfall ensembles are used as input to
a hydrologic model to assess the sensitivity of the hydrologic
regime to modeled climate change.
This framework is adequate for regions that experience
rainfall from distinctively different synoptic systems that can
be represented by uniquely identified statistical indices. In
such regions, not only the effect of changes in total amounts
of rainfall, but also the effect of changes in occurrence frequency of the synoptic systems that cause rainfall should be
examined. A high correspondence between annual amounts
of rainfall and the occurrence frequency of wet synoptic systems was found for the study region (Saaroni et al., 2010).
Therefore, the proposed framework focuses on the change in
www.hydrol-earth-syst-sci.net/19/567/2015/
projected future rainfall that resulted from changes in the occurrence frequency of the regional wet synoptic systems. The
effect of projected changes in rainfall spatiotemporal characteristics was not examined in this study because future projections with the adequate skill and resolution that are required for such assessment are not yet available for the application area.
3
The case study of the Dalya and Taninim catchments
The framework discussed in the previous section was applied
to the upper Dalya and upper Taninim catchments. We focused on the projected change in rainfall and streamflow volumes by comparing the beginning of the 21st century (historical period; 1996–2005) to mid-21st century (future period;
2046–2055). To achieve this goal the following methods and
models (Fig. 1, left side in italic) were used: (1) a synoptic classification was carried out using the NCEP/NCAR reanalysis data (Peleg and Morin, 2012); (2) convective rainfall space–time characterization and the associated empirical
distributions per synoptic system were computed using data
Hydrol. Earth Syst. Sci., 19, 567–581, 2015
570
N. Peleg et al.: Modeling convective rainfall sensitivity to climate change
Table 1. Summary of data sources and resolutions used in this study.
Data type
Source
Resolution
Weather radar
Rain gauges (national network)
Rain gauges (dense network)
Hydrometric stations
Shacham (EMS) Mekorot
Israel Meteorological Service
Hydrometeorology lab at the Hebrew University
Israel Water Authority
5 min and 1.4◦ × 1 km
Daily
1 min
Changes within flow event
from the Shacham–Mekorot weather radar (Peleg and Morin,
2012; Peleg et al., 2013); (3) selected GCM simulations from
CMIP5 were bias corrected and changes in the occurrence
frequency of the synoptic systems between the historical and
future periods were estimated (Peleg et al., 2014); (4) rainfall
ensembles with convective features for current and projected
climate were generated by the HiReS-WG (Peleg and Morin,
2014); and (5) the streamflow in the catchments’ outlets was
simulated using the Sacramento Soil Moisture Accounting
Model (SAC-SMA) (Shamir et al., 2014a).
3.1
Study area
The upper Dalya (Bat Shlomo hydrometric station, 42 km2 )
and upper Taninim (Amiqam hydrometric station, 47 km2 )
catchments are located in the Ramot Menashe region, northwestern Israel (Fig. 1, right side). The terrain near the catchments outlets is mostly flat, ascending moderately eastward
up to 380 m a.s.l. Both upper Dalya and upper Taninim are
ephemeral streams, similar in size but slightly different in
their geologic formation and soil cover. The Adulam formation, dated to the lower Eocene and composed mainly
of limestone and chalk, cover most of the drainage area of
the upper Dalya catchment. This formation covers also large
parts of the upper Taninim catchment, while the highest parts
of the catchment consist of older (Paleocene) Taqiye formation, composed mainly of chalk and marl. The area is mostly
cultivated agriculture that has experienced a severe soil erosion in the last several decades. The soil thickness varies between 240 and 340 mm for the upper Dalya catchment and
between 240 and 500 mm for the upper Taninim catchment.
In both catchments the soil is classified as Rendzina with clay
texture in the top soil. The lithology of the upper parts of
Dalya and Taninim catchments is concordant with other areas of the Ramot Menashe region (Grodek et al., 2012).
The region has a Mediterranean climate with wet winters
(October–May) and dry and hot summers (June–September).
The annual rainfall is highly variable with rainfall exceeded
1000 mm in the wettest observed year (1991/1992), while
less than 400 mm was recorded in driest observed year
(1981/1982). A considerable number of rainfall events in
this area are caused by convective processes (Peleg and
Morin, 2014). Records of rainfall and streamflow exist for
these catchments from a weather radar, rain gauges, and
hydrometric stations (a summary of available data is in
Table 1). Following a rigorous quality control assessment
Hydrol. Earth Syst. Sci., 19, 567–581, 2015
applied to the weather radar information, data for twelve
hydrological years (1 October–30 September) were compiled for this study (i.e., 1991/1992–1997/1998, 1999/2000–
2002/2003 and 2004/2005).
3.2
Rainfall patterns and synoptic classification
The wet synoptic systems (i.e., synoptic systems that might
lead to rainfall over the catchments) and their rainfall statistics were studied for the northern coastal region of Israel by
Peleg and Morin (2012, 2014). A summary of their findings
that is relevant to this study follows.
The wet synoptic systems were classified using the
NCEP/NCAR meteorological reanalysis data (Kalnay et al.,
1996), extracted for the nearest location available to the
catchments (35◦ E, 32.55◦ N, Fig. 1). The grid cell is located offshore; approximately extending from the northern
Israel coastline to Cyprus. The above-mentioned 12 years of
data were examined and 882 6 h intervals with rainfall over
the catchments observed by the weather radar were identified. The synoptic classification during these periods was
performed using a cluster analysis technique that considers
four variables from the reanalysis data: (1) sea level pressure, (2) specific humidity at 700 hPa, (3) geopotential height
at 500 hPa; and (4) zonal wind at 850 hPa. Initially, three wet
synoptic systems classes were identified (Peleg and Morin,
2012). However, the first two were merged into one synoptic
class – known as the Mediterranean low (ML), an extratropical cyclone, see Fig. 1). The ML is the prevailing synoptic
system that generates rainfall over the study region (Alpert
et al., 2004; Peleg et al., 2014; Peleg and Morin, 2012; Saaroni et al., 2010). The second synoptic system (Fig. 1) was
linked to the active Red Sea trough (ARST), which occurs
mainly during the transition seasons (Tsvieli and Zangvil,
2005) and mainly affects the southern and eastern parts of Israel (Kahana et al., 2002). The ARST is defined as a sea-level
trough that extends from eastern Africa along the Red Sea
towards the Mediterranean (Ashbel, 1938). The cluster analysis classified 94 % of the wet synoptic systems in the study
area as ML, and (6 %) as ARST (Peleg and Morin, 2012).
Empirical distributions that describe the rainfall statistics
during ML and ARST events were derived from analysis of
191 586 radar volume scans of the C-band Shacham (EMS)
Mekorot weather radar system, located ∼ 60 km south of the
study area (Peleg and Morin, 2012). The convective features
were spatially determined using a segmentation method and
www.hydrol-earth-syst-sci.net/19/567/2015/
N. Peleg et al.: Modeling convective rainfall sensitivity to climate change
571
Table 2. Summary of the control (NCEP/NCAR reanalysis) and the climate models (CMIP5) used in the study.
Modeling center
National Centers for Environmental Prediction
Beijing Climate Center, China Meteorological
Administration
NOAA Geophysical Fluid Dynamics Laboratory
Met Office Hadley Centre (Realization
contributed by Instituto Nacional
de Pesquisas Espaciais)
Model name
Grid location
Spatial resolution
NCEP/NCAR reanalysis
BCC-CSM1.1
35◦ E, 32.5◦ N
33.75◦ E, 32.1◦ N
2.5◦ × 2.5◦
2.8◦ × 2.8◦
GFDL-ESM2G
HadGEM2-ES
33.75◦ E, 33.4◦ N
33.75◦ E, 33.1◦ N
2◦ × 2.5◦
1.25◦ × 1.87◦
Figure 2. Annual average of 6 h occurrence frequency of dry, ML, and ARST synoptic systems derived from the NCEP/NCAR reanalysis
data and the three GCMs used in this study for the historical period (after Peleg et al., 2014). The GCMs slightly overestimate the wet
synoptic systems frequency by 2.1 % (HadGEM2-ES), 1.2 % (GFDL-ESM2G) and 2.5 % (BCC-CSM1.1).
temporally analyzed using a rain cell tracking algorithm (Peleg and Morin, 2012). The empirical distributions include for
example: the number of convective rain cells, their areal extent, maximal and areal mean of rain intensity, orientation
and advection properties, the low-intensity rainfall area, and
mean rainfall intensity (Peleg and Morin, 2012, 2014). In
addition to the radar data, a dense rain-gauge network in
a 4 km2 plot located in the upper Taninim catchment was
used to assess the small scale rainfall spatial correlation at
the sub-grid resolution (Peleg et al., 2013).
3.3
Climate change projection using CMIP5 models
The Coupled Model Intercomparison Project Phase 5
(CMIP5, see Moss et al., 2010 and Taylor et al., 2012 for
more details) simulations were used to compare the wet
synoptic systems’ occurrence between the historical (beginning of the 21st century) and future (mid-21st-century) periods. The analyzed simulations were obtained from models with 6 h temporal resolution that correspond with the
NCEP/NCAR reanalysis, and for two of the IPCC Assessment Report 5 emission scenarios: (1) the high-emission
scenario (RCP8.5); and (2) a midrange-mitigation-emission
scenario (RCP4.5). Peleg et al. (2014) present synoptic system classification and occurrence frequency related
to each system for the eastern Mediterranean based on
NCEP/NCAR reanalysis and GCMs for the two selected scenarios. A quantile-quantile bias correction was applied for
the meteorological variables of the CMIP5 models, using
the NCEP/NCAR reanalysis data as a reference for the corrections. For the current analysis three GCM CMIP5 modwww.hydrol-earth-syst-sci.net/19/567/2015/
els were selected: HadGEM2-ES, GFDL-ESM2G and BCCCSM1.1. These GCMs were selected because of their 6 h
temporal resolution, the close proximity of the pixels from
which the models’ meteorological variables were derived to
the study region (Table 2), and the relatively good representation of synoptic systems occurrence frequency by these models (Fig. 2). It was found that the following are likely: rain in
the region will become less frequent because of a reduction
in the occurrence frequency of wet synoptic systems, the wet
season period (i.e., the period from the first to last rainy day
in the year) will be shortened mainly from the ending of the
wet season and the occurrence frequency of ARST will increase at the expense of the ML; the magnitudes of the above
changes for each GCM and emission scenario are summarized in Table 3 (see a detailed analysis and discussion by
Peleg et al., 2014).
Based on the above analyses two scenarios of projected
synoptic system frequency change were examined here.
RCP4.5 scenario: the wet season period was projected to be
shortened by 6.5 % from its ending, the occurrence of wet
synoptic systems was projected to be reduced by 16 %, and
the occurrence of ARST was projected to increase by 4.25 %
at the expense of the ML. RCP8.5 scenario: the wet season
period was projected to be shortened by 9.5 % from its ending, the occurrence of wet synoptic systems was projected
to be reduced by 16 %, and the occurrence of ARST was
projected to increase by 8.5 % at the expense of the ML.
These two projections were combined subjectively from the
changes found for each GCM (Table 3) giving some higher
weights to higher values of change found.
Hydrol. Earth Syst. Sci., 19, 567–581, 2015
572
N. Peleg et al.: Modeling convective rainfall sensitivity to climate change
Table 3. Projected changes in regional synoptic system frequency derived from three GCMs comparing the beginning and the middle of the
21st century for the northern Israeli coastline (after Peleg et al., 2014).
Change in occurrence frequency of wet
synoptic systems
Change in duration of wet season period
Change in occurrence frequency of ARSTs
(on the expense of occurrence frequency of MLs)
3.4
HadGEM2-ES
RCP4.5
RCP8.5
GFDL-ESM2G
RCP4.5 RCP8.5
BCC-CSM1.1
RCP4.5
RCP8.5
−10 %
−10 %
−12 %
−12 %
−17 %
−17 %
−2.6 %
+5.8 %
−6 %
+10.8 %
+6.6 %
0%
+1.9 %
+2.2 %
−12.6 %
+1 %
−12.7 %
+1.2 %
HiReS-WG
The high resolution synoptically conditioned weather generator (HiReS-WG) is a stochastic model that generates rain
fields with a substantial proportion of convective features
(Peleg and Morin, 2014). The HiReS-WG generates rain
fields based on the empirical distributions of the rainfall characteristics subjected to the classified wet synoptic system.
The rain fields were generated for the catchments in a spatial resolution of 0.25 km2 (see Fig. 1 lower right side) and
a temporal resolution of 5 min. This is a sufficiently high spatiotemporal resolution that can be adequately used to simulate the hydrological response of the studied catchments.
An ensemble of 300 years of likely rainfall realizations that
represents the historical period was generated. The ensemble
was further divided into 10 series of 30 years each, in order
to assess the inter- and intra-annual variability of the rainfall.
In addition, ensembles were generated for the future period
for each scenario and were also similarly divided into 10 data
series, representing the projected changes in the occurrence
of the wet synoptic systems, as discussed above.
3.5
SCA-SMA hydrological model
The Sacramento Soil Moisture Accounting Model (SACSMA) is a conceptual, continuous, and aerial-lumped model
that describes the wetting and drying processes in the soil.
A detailed description of the continuous-time form formulation of the model that was implemented in this study as described by Georgakakos (1986). The SAC-SMA robustness
was demonstrated by the results of the Distributed Modeling Intercomparison Project (Reed et al., 2004; Smith et al.,
2004) and this model is used in many operational setups
for various water resources management and flood warning practices. In recent years the SAC-SMA was also used
in various climate change impact studies (e.g., Georgakakos
et al., 2012a, b; Carpenter, 2011; Kerkhoven and Gan, 2011;
Koutroulis et al., 2013; Kwon et al., 2011; Najafi et al., 2011).
The development of the SAC-SMA model for the study
area is detailed in Shamir et al. (2014a) and a short summary is provided below. The model was calibrated for the
hydrometric stations of Bat Shlomo (upper Dalya catchment)
and Amiqam (upper Taninim catchment; Fig. 1). The rainHydrol. Earth Syst. Sci., 19, 567–581, 2015
fall data are from the Shacham (EMS) Mekorot weather
radar system for a period of 12 years (mentioned above).
Daily rainfall data from 26 rain gauges within 100 km distance from the radar were used for the radar-gauge adjustment and another 13 rain gauges in the surroundings of the
Dalya and Taninim catchments were used for validation (Peleg and Morin, 2012). Rainfall data were initially calculated
using the weather radar reflectivity data by applying a fixed
reflectivity-rainfall power law relationship and then readjusted for each year using the weighted regression method
(Gabella et al., 2001; Morin and Gabella, 2007). The model
was constructed for four and five sub-basins for the upper
Dalya and upper Taninim catchments, respectively. The rainfall input to the model was spatially aggregated to reflect
mean areal values for these sub-basins. Initial SAC-SMA parameter values were estimated using field survey soil data
and GIS layers of terrain, soil, and lithology. The SAC-SMA
model was implemented to run in 5 min intervals, which is
the native resolution of the radar data and the output of the
HiReS-WG and is adequate because of the small sub-basins
size and their rapid response time. The model was calibrated
to capture the general hydrologic regime rather than to simulate the peak and the timing of a specific flow event. The
SAC-SMA model was set to run continuously for each year
from 1 October to 31 May, where for each year the initial
conditions of the soil components were set to dry conditions
(∼ 1 % of saturation).
Comparing the observed average mean areal rainfall over
the hydrometric stations drainage area with the streamflow
indicate that initial cumulative rainfall is required in the
beginning of the rainy season before measurable streamflow is recorded in the stations. This phenomenon was previously reported in other Mediterranean karst catchments
(e.g., Ben-Zvi, 1998; Hartmann et al., 2014; Rimmer et al.,
2006; Samuels et al., 2009). Note that even very intense
and long rainfall events in the beginning of the wet season
(e.g., 1991/1992 and 1994/1995) did not generate measurable streamflow at the stations. The SAC-SMA model structure was modified to include an initial loss reservoir that
starts empty every year (1 October) and has to be satisfied
first before the rainfall is applied as input to the rest of the
SAC-SMA model components.
www.hydrol-earth-syst-sci.net/19/567/2015/
N. Peleg et al.: Modeling convective rainfall sensitivity to climate change
573
Figure 3. Panels (a) and (b) present calculated (from SAC-SMA) vs. observed (from hydrometric stations) annual streamflow volumes for
the upper Dalya and upper Taninim catchments, respectively, for 12 years of data. The R 2 values relate to the linear fit that runs through the
origin (red line). Dashed line represents perfect match between observed and calculated volumes (slope of 1). Panels (c) and (d) are the same
but for event streamflow volumes.
The SAC-SMA simulations match the observed annual
volumes at the hydrometric stations of the upper Dalya and
upper Taninim catchments (Fig. 3a and b), with high R 2 values (0.89 and 0.94, respectively) for the linear fit (slope of
0.96 and 0.95, respectively). To examine the fit at the event
level we defined rain and streamflow events as follows: a rain
event begins when rain first appears over the catchment and
ends when there is a dry-spell intermission that exceeds at
least 3 h before the next pulse of rain occurs; a rain event is
being accounted for only if its mean areal rainfall exceeds
10 mm. A streamflow event begins when a corresponding
rain event begins. The end of the streamflow event was determined by fitting an exponential decay to the discharge recession limb (using a decay constant of 0.01 h−1 for both
catchments), cut at a threshold closer to zero (∼ 0.03 m3 s−1 ).
An example is shown in Fig. 4 for a 2-week period in January 1991 for the upper Dalya catchment. The SAC-SMA
simulates the events streamflow volumes reasonably well
(Fig. 3c and d), with an acceptable slope of the linear fit
between observed and calculated data of 0.72 for the upper
Dalya catchment and 0.7 for the upper Taninim catchment
(R 2 of 0.45 and 0.5, respectively).
A rainfall ensemble of 300 years was generated by the
HiReS-WG for historical climate conditions and was used
as forcing to the SAC-SMA model. Figure 5 presents three
www.hydrol-earth-syst-sci.net/19/567/2015/
Figure 4. An example of rainfall and streamflow discharge from
the upper Dalya catchment separated into different events of rainfall and streamflow. Red line represents the observed hydrograph
obtained from the hydrometric station and filled areas represent the
hydrograph simulated by the SAC-SMA. See text for details about
the separation procedure for rain and streamflow events.
Hydrol. Earth Syst. Sci., 19, 567–581, 2015
574
N. Peleg et al.: Modeling convective rainfall sensitivity to climate change
its associated SAC-SMA simulated streamflow. It seems that
the HiReS-WG and SAC-SMA integration simulates well the
observed period with the exception of the wettest annual rainfall (1181 mm observed in 1991/1992). This is attributed to
the HiReS-WG limitation in generating uncharacteristically
long lasting rain events as in 1991/1992 (discussed in details by Peleg and Morin, 2014). For example, the average
duration of the longest 10 % rain events during the observed
12 years was 13 h, while the average duration of the longest
10 % rain events during 1991/1992 was 17 h.
4
4.1
Figure 5. The annual streamflow volumes vs. the annual rainfall
depth over the catchments. Three data samples are presented: observed rainfall from weather radar and observed volumes from hydrometric stations (blue), observed rainfall from weather radar and
simulated volumes from SAC-SMA (red) and rainfall realizations
generated by the HiReS-WG and simulated volumes from SACSMA (grey).
combinations of annual rainfall and streamflow data: (1) observed rainfall (from weather radar) and observed streamflow, (2) observed rainfall and its associated SAC-SMA simulated streamflow, and (3) HiReS-WG simulated rainfall and
Hydrol. Earth Syst. Sci., 19, 567–581, 2015
Projected change in the hydrological regime induced
by climate change
Changes in rainfall amounts
Three ensembles, each with 10 data series of 30 years of rainfall, were generated by the HiReS-WG. The first ensemble
represents the historical period (beginning of the 21st century) and the second and third ensembles represent the projected future (mid 21st century) for the RCP4.5 and RCP8.5
emission scenarios, respectively. As seen in Fig. 6, the mean
annual rainfall is projected to decrease from 646 to 547 mm
(15 % reduction) and 531 mm (18 %) for the RCP4.5 and
RCP8.5 emission scenarios, respectively. The decrease in
mean annual rainfall was found to be statistically significant
for both emission scenarios using a two-sided z test (with
a significance level [α] of 0.05).
A range of reduction values can be estimated by examining
the change between the minimum (maximum) rainfall annual
mean that was derived from the 10 data series of the three ensembles. For the RCP4.5 and RCP8.5 emission scenarios, the
projected range of the mean annual rainfall reduction over the
catchments is 2–23 % and 7–25 %, respectively. In addition,
the standard deviation of the annual rainfall derived from the
ensembles is projected to decrease from 104.5 mm for the
historical period to 99.9 mm and 95.8 mm for the RCP4.5
and RCP8.5 scenarios, respectively. The changes in standard
deviation however, were found insignificant (α = 0.05) using F test for equality of two standard deviations; samples
were normally distributed as tested by Shapiro–Wilk W test
(α = 0.05). In contrast to the projected decrease in mean annual rainfall and standard deviations, the coefficient of variation (CV) of the annual rainfall is projected to increase from
an average of 16.5 % for the historical period to 17.9 and
18.2 % for the RCP4.5 and RCP8.5 emission scenarios, respectively, indicating an increase of the inter-annual changes
relative to the mean rainfall.
Local sensitivity tests were conducted for the parameters
that were modified in the ensembles of the future projection.
Rainfall ensembles of 300 years each were generated for the
following cases: a shortening of the wet season period, an
increase in the occurrence frequency of ARST on the expense of occurrence frequency of ML, and a reduction of
www.hydrol-earth-syst-sci.net/19/567/2015/
N. Peleg et al.: Modeling convective rainfall sensitivity to climate change
Figure 6. The standard deviation of the annual rainfall of each 30year ensemble selected from the 300-year simulation (black for historical, red for RCP4.5 scenario and blue for RCP8.5 scenario) is
presented vs. the mean annual rainfall for each ensemble. Dashed
lines represent the average annual rainfall of each ensemble, and
colored boxes show the extent of annual rainfall mean and standard
deviation for the different periods and scenarios. The rainfall ensembles represent upper Dalya and upper Taninim catchments combined.
occurrence frequency of wet synoptic systems. For all cases,
a 10 % change in the parameter values that were estimated
from the historic data was examined. The average annual
rainfall of each ensemble and its change compared to the historical period are summarized in Table 4.
The reduction in the mean annual rainfall (by 15 %; statistically significant using a two-sided z test, α = 0.05) was
most sensitive to the reduction in occurrence frequency of
the wet synoptic systems (by 10 %). Increased frequency of
ARST at the expense of ML (by 10 %) had a small (a reduction of 0.5 %) and insignificant effect on rainfall in this region. This is a surprising result because of the marked differences in rainfall characteristics between the ML and ARST
synoptic conditions. For example, convective features caused
by ARST compared to ML are larger in area but with weaker
rain intensities (Peleg and Morin, 2012, 2014); it is possible that some of these differences affect the total rainfall in
an opposite manner such that the integrated effect is small.
Shortening of the wet season period (by 10 %) had no detectible effect on the mean annual rainfall (a reduction of
0.9 %, statistically insignificant). This is because the shortening of the wet season period by 10 % implies a reduction
www.hydrol-earth-syst-sci.net/19/567/2015/
575
Figure 7. Same as Fig. 6 but for annual streamflow volume for upper Dalya catchment.
Table 4. Summary of the local sensitivity tests. The average annual
rainfall of each ensemble and its projected change comparing to the
historical ensemble (in parenthesis) are presented.
Ensemble
Mean annual rainfall (mm)
Historical period (1996–2005)
Shortening of wet season period by 10 %
Increasing occurrence frequency of ARSTs on the
expense of occurrence frequency of MLs by 10 %
Reducing occurrence frequency of wet synoptic
systems by 10 %
646
640 (−0.9 %)
643 (−0.5 %)
547 (−15.3 %) ∗
∗ Significant changes at the 0.05 level
of about 1–2 rain events only when the occurrence frequency
of rain events for either the beginning or end of the wet season is low.
4.2
Changes in streamflow volumes
The mean annual streamflow volumes for the 10 data series of the historical period and of the future period (RCP4.5
and RCP8.5 emission scenarios) are presented in Fig. 7 for
the upper Dalya catchment. Streamflow was calculated by
the SAC-SMA using input from the above mentioned rainfall HiReS-WG ensembles. The mean annual streamflow volume calculated from the ensembles is projected to decrease
from 5.34 × 10⁶ m3 to 2.96 × 10⁶ m3 (45 % reduction) for
the RCP4.5 scenario and to 2.84 × 10⁶ m3 (47 %) for the
RCP8.5 scenario. A range of reduction values were computed (Fig. 7) using the maximum and minimum streamflow
Hydrol. Earth Syst. Sci., 19, 567–581, 2015
576
N. Peleg et al.: Modeling convective rainfall sensitivity to climate change
Figure 8. The average event streamflow volume vs. event rainfall
depth for the historical period (black), RCP4.5 simulations (red) and
RCP8.5 simulations (blue) with exponential fits (lines) for upper
Dalya (upper graph) and upper Taninim (lower graph) catchments.
Note that rainfall is quantized in 10 mm intervals and the points in
the graph represent the average of all events within each 10 mm
interval of rainfall.
volumes of the data series for each period, as explained in
the previous section. For the RCP4.5 and RCP8.5 emission
scenarios, the projected reduction range of the mean annual
streamflow volume is 10–60 % and 16–66 %, respectively.
As seen in the analysis of the rainfall ensembles, the standard deviation of the annual streamflow volume was proHydrol. Earth Syst. Sci., 19, 567–581, 2015
jected to decrease from 3.17 × 10⁶ m3 for the historical climate to 2.53 × 10⁶ m3 and 2.39 × 10⁶ m3 for the RCP4.5 and
RCP8.5 emission scenarios, respectively. The decrease in the
mean annual streamflow volume was found to be statistically significant (using a two-sided z test, α = 0.05). Because
the samples of the standard deviation are not normally distributed (tested by Shapiro–Wilk W , α = 0.05), we did not
assess the statistical significance of the projected reduction in
the standard deviation. As in the case of annual rainfall, while
both mean annual streamflow volume and average standard
deviation of annual volume are expected to decrease, the
CV of the annual streamflow volume was projected to increase from an average of 61.9 % for the historical period to
87.5 and 86.2 % for the RCP4.5 and RCP8.5 scenarios, respectively. This paragraph discuss the changes in streamflow
volumes for the upper Dalya catchment; similar trends were
found for the upper Taninim catchment.
In addition to the annual scale, changes in events’ streamflow volumes were examined. In general, a comparison between streamflow volume and rain depth at the event scale
presents a large scatter because of factors such as antecedent
moisture conditions and spatial and temporal distribution of
rainfall. Therefore, we have examined the average streamflow volume for all events with rainfall depth binned in
10 mm intervals (Fig. 8); an exponential fit was applied for
each period for both catchments (lowest R 2 calculated was
0.96). The average events’ streamflow volumes for the historical period were found to be higher than for the future period for upper Dalya by a factor of 1.9–2 and 1.4–1.9 for the
RCP4.5 and RCP8.5, respectively, and for upper Taninim by
a factor of 1.5–2.1 for both emission scenarios. The decrease
in events’ streamflow volumes for a given event rainfall depth
is a result of the reduction in occurrence frequency of wet
synoptic systems which implies longer dry periods between
events. Thus, the upper Dalya and upper Taninim catchments
were projected to produce less runoff because of drier soil
and drier antecedent moisture conditions that precede rainfall events.
Last, the effect of climate change on the duration of the
streamflow season (i.e., from the first to the last appearance
of streamflow in the catchment’s outlet) was examined. Figure 9 presents the wet season periods and streamflow seasons
for both catchments. It can be seen that streamflow season is
projected to be shortened mainly because of delayed onset.
This shorter streamflow season is attributed to the increase in
dry duration between rainfall events, which cause drier soil
conditions and delays the first streamflow event. Although to
a lesser extent, the projected shorter streamflow season was
also due to an earlier ending caused by projected earlier ending of wet synoptic systems, as discussed in Sect. 3.3. The
shorter streamflow season was projected to be more severe
for the RCP8.5 scenario (26 and 28 % for the upper Dalya
and upper Taninim catchments, respectively) compared to the
RCP4.5 scenario (22 % for both catchments).
www.hydrol-earth-syst-sci.net/19/567/2015/
N. Peleg et al.: Modeling convective rainfall sensitivity to climate change
Figure 9. The period of the wet season (light blue, numbers represent duration in days), its interquartile range (IQR, dark blue) and
the streamflow season (central boxes, numbers represent duration
in days) for upper Dalya and Taninim catchments for historical and
future periods.
5
Discussion and conclusions
In this paper we present a case study in which we assessed
the sensitivity of the hydrological regime of two mediumsize catchments (upper Dalya and upper Taninim, ∼ 50 km2
each) to projected climate changes by generating high spatiotemporal resolution rain fields using the HiReS-WG (adequate for convective features) and applying them as input
to the SAC-SMA hydrological model. The climate projections were done by modifying the occurrence frequency of
the regional meteorological wet synoptic systems based on
analysis of three GCMs CMIP5 simulations for the RCP4.5
and RCP8.5 emission scenarios.
Previous studies used daily rainfall resolution, for example: Chiew and McMahon (2002) examined the projected
effects of climate change on runoff, evapotranspiration and
soil moisture for eight Australian catchments, ranging from
a medium scale (27 km2 ) to large scale (544 km2 ); Jones et al.
(2006) estimated the hydrological sensitivity to changes in
rainfall and potential evaporation in 22 catchments in Australia, ranging from medium (52 km2 ) to large (1300 km2 )
scale; Chiew et al. (2010) conducted a comprehensive study
on eight medium-to-large catchments (161–1540 km2 ) in
Western Australia by comparing the predicted changes in
rainfall and runoff characteristics; Vaze and Teng (2011) conducted another study in Australia to predict changes in runoff
for catchments of medium-to-large scales (50–2000 km2 ).
Most of the above studies used rainfall data for point locations.
The use of the HiReS-WG model to generate high spatiotemporal resolution rain fields for hydrological projection
www.hydrol-earth-syst-sci.net/19/567/2015/
577
for small-to-medium sized catchments enables the simulation of streamflow not only for the annual or seasonal scale
but also for the examination of the characteristics of flow
events that last less than a few hours. In this study we demonstrated this capability by examining the projected change in
the volumes of streamflow events for the upper Dalya and upper Taninim catchments. It was found that a major reduction
in the projected average volumes of the streamflow events is
expected.
The synthetic rainfall ensembles generated by the HiReSWG indicated that the mean annual rainfall is projected to be
reduced by 15 % (in a range of 2–23 %) and 18 % (7–25 %)
for the RCP4.5 and RCP8.5 emission scenarios, respectively,
comparing 1996–2005 to 2046–2055 periods. This reduction
is larger than the regional reduction projected by other studies conducted for northern Israel. For example, Evans (2009)
projected an annual decrease in rainfall of 20 mm (3 %) for
2050 compared to 2005; future rainfall reductions for the end
of the 21st-century of 30–75 mm (4–12 %) were reported by
Alpert et al. (2008) while Oenol and Semazzi (2009) reported
a decrease in winter rainfall of 24 %. These studies used the
A2 emission scenario (presented in the IPCC AR4 report)
and were averaged for a much larger domain than the one
examined in this study. In addition, their projections were
derived from RCMs. In this study we focused on changes
in the characteristics of the wet synoptic systems. We found
that the characteristics of the projected wet synoptic systems
are expected to have a shorter season, fewer occurrences of
wet synoptic systems, and an increase in the occurrences of
ARST at the expense of ML. Other factors related to rainfall characteristics might also be subject to change, for example, Black (2009) and Krichak et al. (2011) discussed that
the proportion of convective rainfall out of the total rainfall
might increase as a result of projected increase in surface
temperature. Such factors weren’t considered in this study
but could be included in future studies. To the best of our
knowledge, currently there are no future projections that consider changes in rainfall spatiotemporal statistics for this region.
Along with the projected decrease in mean annual rainfall,
a decrease in the annual rainfall standard deviations and an
increase in the annual rainfall CV were found. This implies
an increase of the inter-annual changes relative to the mean
rainfall for the future period. This is a similar trend to that
found by Samuels et al. (2013) for Tel Aviv, located on the
central coastline of Israel, for the A1B emission scenario.
They reported a median decrease of 9.8 % in annual rainfall
for 2035–2060 with a minor annual rainfall decrease of 1.7 %
for the upper 5 percentiles. This implies that the extreme wet
years will be affected by climate change in a different way
than the mean annual rainfall. Similar results were found for
the projected change in the mean annual streamflow volume,
as it was also found that the mean and standard deviation are
projected to decrease and the CV is projected to increase.
Hydrol. Earth Syst. Sci., 19, 567–581, 2015
578
N. Peleg et al.: Modeling convective rainfall sensitivity to climate change
The mean annual streamflow volumes were projected to
be reduced by 10–66 % (RCP4.5 and RCP8.5 emission scenarios). Only three studies that assessed climate change projected impact on the hydrological regime for this region
(using A1B emission scenario) were found. Samuels et al.
(2009) evaluated the impact of projected increase of multiyear droughts and extreme rainfall events on the streamflow of the Upper Jordan River and its tributaries. They
found that while the projected increase in extreme rainfall events increases the streamflow intensity and change
the extreme events recurrence distribution; no substantial
changes were found for the low flow regime. Samuels et al.
(2010) reported a projected reduction in mean daily base
flow and surface flow of 10–11 % and 17 %, respectively,
for the large-sized catchment (> 1000 km2 ) of the upper Jordan River, comparing 1980–2005 and 2036–2060 periods.
Rimmer et al. (2011) calculated trends of the annual incoming water volumes for the Sea of Galilee (northern Israel),
comparing the periods 1979–2009 and 2015–2060 and using four climate models. The trends were found to vary between −9.05 × 10⁶ m3 year−1 and 1.94 × 10⁶ m3 year−1 ; the
maximum projected annual inflow reduction trend was equal
to ∼ 1.3 %. All studies projected a reduction in streamflow
volumes, but differences exist between projected reduction
amounts as there are differences between the studies: the domain size, the emission scenarios, the historical and future
periods that were considered, and the catchments properties
(e.g., Dalya and Taninim are ephemeral streams and the Upper Jordan River is a perennial river).
Changes in rainfall amounts are usually amplified in
streamflow discharge and volume (Chiew and McMahon,
2002; Chiew et al., 2010; Li et al., 2013; Peleg and Gvirtzman, 2010). This effect was well demonstrated in the results of this study when examining the non-linearity of the
synoptic-rainfall-streamflow interactions, which resolved in
percentage change in runoff of about 3 times the percentage change in rainfall (the rainfall is projected to reduce by
2–25 % and the annual streamflow volume by 10–66 %). Future drier soil conditions resulting from the shortening of the
wet season and reducing the number of rainfall events (which
cause an increase in the length of dry periods between rainfall events) are the reasons for this amplification. Chiew et al.
(2006) defined this amplification, the change in annual runoff
in comparison to the change in annual rainfall, as the precipitation elasticity of streamflow (p ). Chiew et al. (2010)
reported a change in annual runoff that is up to 2 times the
change in annual rainfall, but in an earlier study Chiew and
McMahon (2002) stated that “in ephemeral catchment with
low runoff coefficients the percentage change in runoff can
be more than 4 times the percentage change in rainfall”. p
values similar in magnitude to those of this study (p > 3)
were found in other catchments worldwide, representing a
variety of climates Chiew et al. (2006).
Lastly, limitation of the HiReS-WG and SAC-SMA should
be taken into consideration when discussing the effect of cliHydrol. Earth Syst. Sci., 19, 567–581, 2015
mate change on rainfall and streamflow. First, the HiReSWG is unable to generate the observed extreme rainfall year
(1991/1992); this is attributed to the HiReS-WG inability of
generating rain events with extreme long-durations (Peleg
and Morin, 2014). The SAC-SMA was often implemented
to a coarser spatiotemporal resolution than an area of tens
km2 and 5 min intervals that was applied in this study. The
River Forecast Centers of the US National Weather Service
commonly implement the SAC-SMA in basins larger than
50 km2 and with hourly or longer temporal resolution (e.g.,
Shamir et al., 2006). The coarse resolution allows for averaging in time and space, and the hydrologic response is less
abrupt therefore contributing to robust model performance.
Nevertheless, the SAC-SMA was successfully implemented
in the upper Dalya and upper Taninim catchments (Shamir
et al., 2014a). When considering the results presented here
of the effect of climate change on the hydrological regime it
should be noted that besides the rainfall changes discussed
above, no other changes were made. SAC-SMA parameters
(land use, vegetation type and coverage, evaporation, etc.)
were regarded as stationary; thus enabling the examination
of how the projected changes in the regional synoptic systems would affect the runoff without taking into consideration other non-synoptic parameters (some are expected to
change, e.g., evaporation is projected to increase along with
an increase in temperature).
We conclude that for small-to-medium sized catchments
influenced by convective rainfall, the HiReS-WG, integrated
in the suggested modeling framework, is a good tool for projecting changes in the hydrological regime resulting from climate change. The HiReS-WG can be applied to catchments
in other climate environments affected by convective rainfall. Further research assessing projected changes in rainfall
spatiotemporal statistics is still required to better represent
climate change impact on rainfall; once such information is
available, its integration into the HiReS-WG is straightforward.
Acknowledgements. The study was funded by the Israel Water Authority, the Israel Ministry of Environmental Protection, the Israel
Ministry of Agriculture and Rural Development, the KKL-JNF,
the Israel–USA Bi-National Science Foundation (BSF-2008046),
and the Israel Science Foundation’s Recanati and IDB Group
Foundation (grant no. 332/11). We acknowledge the World Climate
Research Programmer’s Working Group on Coupled Modelling,
which is responsible for CMIP, and we thank the climate modeling
groups (listed in Table 2 of this paper) for making the model’s
output available. For CMIP, the US Department of Energy’s
Program for Climate Model Diagnosis and Intercomparison
provides coordinating support and led the development of software
infrastructure in partnership with the Global Organization for Earth
System Science Portals. NCEP reanalysis data was provided by
the NOAA/OAR/ESRL PSD, Boulder, Colorado, USA, from their
website at http://www.esrl.noaa.gov/psd/.
Edited by: L. Samaniego
www.hydrol-earth-syst-sci.net/19/567/2015/
N. Peleg et al.: Modeling convective rainfall sensitivity to climate change
References
Alpert, P., Osetinsky, I., Ziv, B., and Shafir, H.: Semi-objective classification for daily synoptic systems: application to the Eastern
Mediterranean climate change, Int. J. Climatol., 24, 1001–1011,
doi:10.1002/joc.1036, 2004.
Alpert, P., Krichak, S. O., Shafir, H., Haim, D., and Osetinsky, I.: Climatic trends to extremes employing regional modeling and statistical interpretation over the E.
Mediterranean, Global Planet. Change, 63, 163–170,
doi:10.1016/j.gloplacha.2008.03.003, 2008.
Arnaud, P., Lavabre, J., Fouchier, C., Diss, S., and
Javelle, P.: Sensitivity of hydrological models to uncertainty in rainfall input, Hydrolog. Sci. J., 56, 397–410,
doi:10.1080/02626667.2011.563742, 2011.
Ashbel, D.: Great floods in Sinai Peninsula, Palestine, Syria
and the Syrian Desert, and the influence of the red sea
on their formation, Q. J. Roy. Meteorol. Soc., 64, 635–639,
doi:10.1002/qj.49706427716, 1938.
Bahat, Y., Grodek, T., Lekach, J., and Morin, E.: Rainfall-runoff
modeling in a small hyper-arid catchment, J. Hydrol., 373, 204–
217, doi:10.1016/j.jhydrol.2009.04.026, 2009.
Ben-Zvi, A.: Enhancement of runoff from a small watershed by
cloud seeding, J. Hydrol., 101, 291–303, doi:10.1016/00221694(88)90041-8, 1998.
Black, E.: The impact of climate change on daily precipitation
statistics in Jordan and Israel, Atmos. Sci. Lett., 10, 192–200,
doi:10.1002/asl.233, 2009.
Borga, M., Stoffel, M., Marchi, L., Marra, F., and Jakob, M.: Hydrogeomorphic response to extreme rainfall in headwater systems: flash floods and debris flows, J. Hydrol., 518, 194–205,
doi:10.1016/j.jhydrol.2014.05.022, 2014.
Carpenter, T. M. M.: An interdisciplinary approach to characterize
flash flood occurrence frequency for mountainous Southern California, Ph.D. thesis, UC San Diego, California, 2011.
Chiew, F. H. S. and McMahon, T. A.: Modelling the impacts of
climate change on Australian streamflow, Hydrol. Process., 16,
1235–1245, doi:10.1002/hyp.1059, 2002.
Chiew, F. H. S., Peel, M. C., McMahon, T. A., and Siriwardena, LW.: Precipitation elasticity of streamflow in catchments
across the world, IAHS publication, 308, 256–262, 2006.
Chiew, F. H. S., Kirono, D. G. C., Kent, D. M., Frost, A. J.,
Charles, S. P., Timbal, B., Nguyen, K. C., and Fu, G.: Comparison of runoff modelled using rainfall from different downscaling
methods for historical and future climates, J. Hydrol., 387, 10–
23, doi:10.1016/j.jhydrol.2010.03.025, 2010.
Evans, J. P.: 21st century climate change in the Middle East, Climatic Change, 92, 417–432, doi:10.1007/s10584-008-9438-5,
2009.
Fowler, H. J., Blenkinsop, S., and Tebaldi, C.: Linking climate
change modelling to impacts studies: recent advances in downscaling techniques for hydrological modelling, Int. J. Climatol.,
27, 1547–1578, doi:10.1002/joc.1556, 2007.
Gabella, M., Joss, J., Perona, G., and Galli, G.: Accuracy of rainfall estimates by two radars in the same Alpine environment using gage adjustment, J. Geophys. Res.-Atmos., 106, 5139–5150,
doi:10.1029/2000jd900487, 2001.
Georgakakos, K. P.: A generalized stochastic hydrometeorological model for flood and flash-flood forecast-
www.hydrol-earth-syst-sci.net/19/567/2015/
579
ing. 1. Formulation, Water Resour. Res., 22, 2083–2095,
doi:10.1029/WR022i013p02083, 1986.
Georgakakos, A. P., Yao, H., Kistenmacher, M., Georgakakos, K. P.,
Graham, N. E., Cheng, F. Y., Spencer, C., and Shamir, E.: Value
of adaptive water resources management in Northern California
under climatic variability and change: reservoir management, J.
Hydrol., 412, 34–46, doi:10.1016/j.jhydrol.2011.04.038, 2012a.
Georgakakos, K. P., Graham, N. E., Cheng, F. Y., Spencer, C.,
Shamir, E., Georgakakos, A. P., Yao, H., and Kistenmacher, M.: Value of adaptive water resources management in northern California under climatic variability and
change: dynamic hydroclimatology, J. Hydrol., 412, 47–65,
doi:10.1016/j.jhydrol.2011.04.032, 2012b.
Grodek, T., Jacoby, Y., Morin, E., and Katz, O.: Effectiveness of
exceptional rainstorms on a small Mediterranean basin, Geomorphology, 159, 156–168, doi:10.1016/j.geomorph.2012.03.016,
2012.
Hartmann, A., Mudarra, M., Andero, B., Marin, A., Wagener, T.,
and Lange, J.: Modeling spatiotemporal impacts of hydroclimatic extremes on groundwater recharge at a Mediterranean karst aquifer, Water Resour. Res., 50, 6507–6521,
doi:10.1002/2014WR015685, 2014.
Hewitson, B. C. and Crane, R. G.: Climate downscaling: techniques
and application, Clim. Res., 7, 85–95, doi:10.3354/cr007085,
1996.
Jones, R. N., Chiew, F. H. S., Boughton, W. C., and Zhang, L.: Estimating the sensitivity of mean annual runoff to climate change
using selected hydrological models, Adv. Water Resour., 29,
1419–1429, doi:10.1016/j.advwatres.2005.11.001, 2006.
Kahana, R., Ziv, B., Enzel, Y., and Dayan, U.: Synoptic climatology
of major floods in the Negev Desert, Israel, Int. J. Climatol., 22,
867–882, doi:10.1002/joc.766, 2002.
Kalnay, E., Kanamitsu, M., Kistler, R., Collins, W., Deaven, D.,
Gandin, L., Iredell, M., Saha, S., White, G., Woollen, J.,
Zhu, Y., Chelliah, M., Ebisuzaki, W., Higgins, W., Janowiak, J.,
Mo, K. C., Ropelewski, C., Wang, J., Leetmaa, A., Reynolds, R.,
Jenne, R., and Joseph, D.: The NCEP/NCAR 40 year reanalysis
project, B. Am. Meteorol. Soc., 77, 437–471, doi:10.1175/15200477(1996)077<0437:tnyrp>2.0.co;2, 1996.
Kerkhoven, E. and Gan, T. Y.: Unconditional uncertainties of historical and simulated river flows subjected to climate change, J. Hydrol., 396, 113–127, doi:10.1016/j.jhydrol.2010.10.042, 2011.
Kioutsioukis, I., Melas, D., and Zanis, P.: Statistical downscaling of
daily precipitation over Greece, Int. J. Climatol., 28, 679–691,
doi:10.1002/joc.1557, 2008.
Koutroulis, A. G., Tsanis, I. K., Daliakopoulos, I. N., and Jacob, D.: Impact of climate change on water resources status: a
case study for Crete Island, Greece, J. Hydrol., 479, 146–158,
doi:10.1016/j.jhydrol.2012.11.055, 2013.
Krichak, S. O., Breitgand, J. S., Samuels, R., and Alpert, P.:
A double-resolution transient RCM climate change simulation experiment for near-coastal eastern zone of the Eastern
Mediterranean region, Theor. Appl. Climatol., 103, 167–195,
doi:10.1007/s00704-010-0279-6, 2011.
Kwon, H.-H., Sivakumar, B., Moon, Y.-I., and Kim, B.-S.: Assessment of change in design flood frequency under climate change using a multivariate downscaling model and a
precipitation-runoff model, Stoch. Env. Res. Risk A., 25, 567–
581, doi:10.1007/s00477-010-0422-z, 2011.
Hydrol. Earth Syst. Sci., 19, 567–581, 2015
580
N. Peleg et al.: Modeling convective rainfall sensitivity to climate change
Li, F., Zhang, Y., Xu, Z., Teng, J., Liu, C., Liu, W., and
Mpelasoka, F.: The impact of climate change on runoff in
the southeastern Tibetan Plateau, J. Hydrol., 505, 188–201,
doi:10.1016/j.jhydrol.2013.09.052, 2013.
Morin, E. and Gabella, M.: Radar-based quantitative precipitation
estimation over Mediterranean and dry climate regimes, J. Geophys. Res., 112, D20108, doi:10.1029/2006jd008206, 2007.
Morin, E. and Yakir, H.: Hydrological impact and potential flooding
of convective rain cells in a semi-arid environment, Hydrolog.
Sci. J., 59, 1353–1362, doi:10.1080/02626667.2013.841315,
2014.
Morin, E., Goodrich, D. C., Maddox, R. A., Gao, X. G.,
Gupta, H. V., and Sorooshian, S.: Spatial patterns in thunderstorm rainfall events and their coupling with watershed
hydrological response, Adv. Water Resour., 29, 843–860,
doi:10.1016/j.advwatres.2005.07.014, 2006.
Moss, R. H., Edmonds, J. A., Hibbard, K. A., Manning, M. R.,
Rose, S. K., van Vuuren, D. P., Carter, T. R., Emori, S.,
Kainuma, M., Kram, T., Meehl, G. A., Mitchell, J. F. B., Nakicenovic, N., Riahi, K., Smith, S. J., Stouffer, R. J., Thomson, A. M., Weyant, J. P., and Wilbanks, T. J.: The next generation of scenarios for climate change research and assessment,
Nature, 463, 747–756, doi:10.1038/nature08823, 2010.
Najafi, M. R., Moradkhani, H., and Jung, I. W.: Assessing the uncertainties of hydrologic model selection in climate change impact
studies, Hydrol. Process., 25, 2814–2826, doi:10.1002/hyp.8043,
2011.
Nikolopoulos, E. I., Anagnostou, E. N., Hossain, F., Gebremichael, M., and Borga, M.: Understanding the scale relationships of uncertainty propagation of satellite rainfall through
a distributed hydrologic model, J. Hydrometeorol., 11, 520–532,
doi:10.1175/2009jhm1169.1, 2010.
Oenol, B. and Semazzi, F. H. M.: Regionalization of climate
change simulations over the eastern Mediterranean, J. Climate,
22, 1944–1961, doi:10.1175/2008jcli1807.1, 2009.
Paschalis, A., Molnar, P., Fatichi, S., and Burlando, P.: A stochastic
model for high-resolution space-time precipitation simulation,
Water Resour. Res., 49, 8400–8417, doi:10.1002/2013wr014437,
2013.
Paschalis, A., Fatichi, S., Molnar, P., Rimkus, S., and Burlando, P.: On the effects of small scale space–time variability
of rainfall on basin flood response, J. Hydrol., 514, 313–327,
doi:10.1016/j.jhydrol.2014.04.014, 2014.
Peleg, N. and Gvirtzman, H.: Groundwater flow modeling of twolevels perched karstic leaking aquifers as a tool for estimating recharge and hydraulic parameters, J. Hydrol., 388, 13–27,
doi:10.1016/j.jhydrol.2010.04.015, 2010.
Peleg, N. and Morin, E.: Convective rain cells: radar-derived spatiotemporal characteristics and synoptic patterns over the eastern Mediterranean, J. Geophys. Res.-Atmos., 117, D15116,
doi:10.1029/2011jd017353, 2012.
Peleg, N. and Morin, E.: Stochastic convective rain-field simulation using a high-resolution synoptically conditioned weather
generator (HiReS-WG), Water Resour. Res., 50, 2124–2139,
doi:10.1002/2013wr014836, 2014.
Peleg, N., Ben-Asher, M., and Morin, E.: Radar subpixel-scale rainfall variability and uncertainty: lessons learned from observations of a dense rain-gauge network, Hydrol. Earth Syst. Sci.,
17, 2195–2208, doi:10.5194/hess-17-2195-2013, 2013.
Hydrol. Earth Syst. Sci., 19, 567–581, 2015
Peleg, N., Bartov, M., and Morin, E.: CMIP5-predicted climate
shifts over the east mediterranean: implications for the transition region between mediterranean and semi-arid climates, Int. J.
Climatol., doi:10.1002/joc.4114, online first, 2014.
Reed, S., Koren, V., Smith, M., Zhang, Z., Moreda, F.,
Seo, D. J., and Participants, D.: Overall distributed model
intercomparison project results, J. Hydrol., 298, 27–60,
doi:10.1016/j.jhydrol.2004.03.031, 2004.
Rimmer, A. and Salingar, Y.: Modelling precipitationstreamflow processes in karst basin: The case of the
Jordan River sources, Israel, J. Hydrol., 331, 524–542,
doi:10.1016/j.jhydrol.2006.06.003, 2006.
Rimmer, A., Givati, A., Samuels, R., and Alpert, P.: Using ensemble of climate models to evaluate future water and solutes
budgets in Lake Kinneret, Israel, J. Hydrol., 410, 248–259,
doi:10.1016/j.jhydrol.2011.09.025, 2011.
Robertson, A. W., Kirshner, S., and Smyth, P.: Downscaling of
daily rainfall occurrence over northeast Brazil using a hidden
Markov model, J. Climate, 17, 4407–4424, doi:10.1175/jcli3216.1, 2004.
Rozalis, S., Morin, E., Yair, Y., and Price, C.: Flash flood
prediction using an uncalibrated hydrological model and
radar rainfall data in a Mediterranean watershed under
changing hydrological conditions, J. Hydrol., 394, 245–255,
doi:10.1016/j.jhydrol.2010.03.021, 2010.
Saaroni, H., Halfon, N., Ziv, B., Alpert, P., and Kutiel, H.:
Links between the rainfall regime in Israel and location and
intensity of Cyprus lows, Int. J. Climatol., 30, 1014–1025,
doi:10.1002/joc.1912, 2010.
Samuels, R., Rimmer, A. and Alpert, P.: Effect of extreme rainfall
events on the water resources of the Jordan River, J. Hydrol., 375,
512–523, doi:10.1016/j.jhydrol.2009.07.001, 2009.
Samuels, R., Rimmer, A., Hartmann, A., Krichak, S., and Alpert, P.:
Climate change impacts on Jordan river flow: downscaling application from a regional climate model, J. Hydrometeorol., 11,
860–879, doi:10.1175/2010jhm1177.1, 2010.
Samuels, R., Harel, M., and Alpert, P.: A new methodology
for weighting high-resolution model simulations to project
future rainfall in the Middle East, Clim. Res., 57, 51–60,
doi:10.3354/cr01147, 2013.
Semenov, M. A. and Barrow, E. M.: Use of a stochastic weather
generator in the development of climate change scenarios,
Climatic Change, 35, 397–414, doi:10.1023/a:1005342632279,
1997.
Shamir, E., Carpenter, T. M., Fickenscher, P., and Georgakakos, K. P.: Evaluation of the National Weather Service operational hydrologic model and forecasts for the American River
basin, J. Hydrol. Eng., 11, 392–407, doi:10.1061/(asce)10840699(2006)11:5(392), 2006.
Shamir, E., Georgakakos, K., Spencer, C., Modrick, T. M., Murphy Jr., M., and R., J.: Evaluation of real-time flash flood forecasts for Haiti during the passage of Hurricane Tomas, November
4–6, 2010, Nat. Hazards, 67, 459–482, doi:10.1007/s11069-0130573-6, 2013.
Shamir, E., Georgakakos, K. P., Peleg, N., and Morin, E.: Hydrologic Model Development for the Dalia-Taninim watersheds in Israel, Tech. rep., HRC, San Diego, CA, available
at: www.hrc-lab.org/projects/projectpdfs/HRCTN66_20140210.
pdf (last access: 15 September 2014), 2014a.
www.hydrol-earth-syst-sci.net/19/567/2015/
N. Peleg et al.: Modeling convective rainfall sensitivity to climate change
Shamir, E., Megdal, S., Carrillo, C., Castro, C., Chang, H.-I.,
Chief, K., Corkhill, F., Eden, S., Georgakakos, K., Nelson, K.,
and Prietto, J.: Climate change and water resources management in the Upper Santa Cruz River, Arizona, J. Hydrol.,
doi:10.1016/j.jhydrol.2014.11.062, 2014b.
Singh, V. P.: Effect of spatial and temporal variability in rainfall and watershed characteristics on stream flow hydrograph, Hydrol. Process., 11, 1649–1669, doi:10.1002/(sici)10991085(19971015)11:12<1649::aid-hyp495>3.0.co;2-1, 1997.
Smith, J. A., Baeck, M. L., Morrison, J. E., and Sturdevant-Rees, P.:
Catastrophic rainfall and flooding in Texas, J. Hydrometeorol., 1,
5–25, doi:10.1175/1525-7541(2000)001<0005:crafit>2.0.co;2,
2000.
Smith, M. B., Seo, D. J., Koren, V. I., Reed, S. M., Zhang, Z.,
Duan, Q., Moreda, F., and Cong, S.: The distributed model intercomparison project (DMIP): motivation and experiment design,
J. Hydrol., 298, 4–26, doi:10.1016/j.jhydrol.2004.03.040, 2004.
Taylor, K. E., Stouffer, R. J., and Meehl, G. A.: An overview of
CMIP5 and the experiment design, B. Am. Meteorol. Soc., 93,
485–498, doi:10.1175/bams-d-11-00094.1, 2012.
Thober, S., Mai, J., Zink, M., and Samaniego, L.: Stochastic temporal disaggregation of monthly precipitation for regional gridded data sets, Water Resour. Res., 50, 8714–8735,
doi:10.1002/2014WR015930, 2014.
www.hydrol-earth-syst-sci.net/19/567/2015/
581
Tsvieli, Y. and Zangvil, A.: Synoptic climatological analysis of
“wet” and “dry” Red Sea Troughs over Israel, Int. J. Climatol.,
25, 1997–2015, doi:10.1002/joc.1232, 2005.
Vaze, J. and Teng, J.: Future climate and runoff projections across
New South Wales, Australia: results and practical applications,
Hydrol. Process., 25, 18–35, doi:10.1002/hyp.7812, 2011.
Wilby, R. L. and Wigley, T. M. L.: Downscaling general circulation
model output: a review of methods and limitations, Prog. Phys.
Geog., 21, 530–548, doi:10.1177/030913339702100403, 1997.
Wilks, D. S. and Wilby, R. L.: The weather generation game: a review of stochastic weather models, Prog. Phys. Geog., 23, 329–
357, doi:10.1177/030913339902300302, 1999.
Yakir, H. and Morin, E.: Hydrologic response of a semi-arid watershed to spatial and temporal characteristics of convective rain
cells, Hydrol. Earth Syst. Sci., 15, 393–404, doi:10.5194/hess15-393-2011, 2011.
Zoccatelli, D., Borga, M., Viglione, A., Chirico, G. B., and
Blöschl, G.: Spatial moments of catchment rainfall: rainfall spatial organisation, basin morphology, and flood response, Hydrol. Earth Syst. Sci., 15, 3767–3783, doi:10.5194/hess-15-37672011, 2011.
Hydrol. Earth Syst. Sci., 19, 567–581, 2015


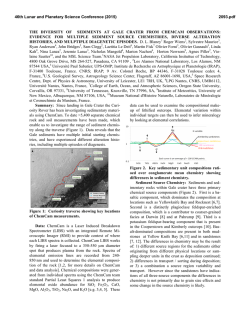
© Copyright 2026