
Budget Document - Wall Street Journal
FISCAL YEAR 2016
BUDGET
OF THE U.S. GOVERNMENT
OFFICE OF MANAGEMENT AND BUDGET
BUDGET.GOV
Scan here to go to
our website.
THE BUDGET DOCUMENTS
Budget of the United States Government, Fiscal
Year 2016 contains the Budget Message of the President,
information on the President’s priorities, and summary
tables.
Analytical Perspectives, Budget of the United
States Government, Fiscal Year 2016 contains analyses that are designed to highlight specified subject areas or provide other significant presentations of budget
data that place the budget in perspective. This volume
includes economic and accounting analyses; information
on Federal receipts and collections; analyses of Federal
spending; information on Federal borrowing and debt;
baseline or current services estimates; and other technical presentations.
The Analytical Perspectives volume also has supplemental materials (formerly part of the printed volume)
that include tables showing the budget by agency and account and by function, subfunction, and program. These
and other tables and additional supplemental materials
are available on the internet at www.budget.gov/budget/
Analytical_Perspectives and on the Budget CD-ROM.
Historical Tables, Budget of the United States
Government, Fiscal Year 2016 provides data on budget
receipts, outlays, surpluses or deficits, Federal debt, and
Federal employment over an extended time period, generally from 1940 or earlier to 2016 or 2020. To the extent
feasible, the data have been adjusted to provide consistency with the 2016 Budget and to provide comparability
over time.
The text and tables comprising the Historical Tables
are available on the internet at www.budget.gov/budget/
Historicals and on the Budget CD-ROM.
Appendix, Budget of the United States
Government, Fiscal Year 2016 contains detailed information on the various appropriations and funds that
constitute the budget and is designed primarily for the
use of the Appropriations Committees. The Appendix
contains more detailed financial information on individual programs and appropriation accounts than any of the
other budget documents. It includes for each agency: the
proposed text of appropriations language; budget schedules for each account; legislative proposals; explanations
of the work to be performed and the funds needed; and
proposed general provisions applicable to the appropriations of entire agencies or group of agencies. Information
is also provided on certain activities whose transactions
are not part of the budget totals.
ELECTRONIC SOURCES OF BUDGET
INFORMATION
The information contained in these documents is available in electronic format from the following sources:
Internet. All budget documents, including documents
that are released at a future date, spreadsheets of many
of the budget tables, and a public use budget database
are available for downloading in several formats from
the internet at www.budget.gov/budget. Links to documents and materials from budgets of prior years are also
provided.
Budget CD-ROM. The CD-ROM contains all of the
printed budget documents in fully indexed PDF format
along with the software required for viewing the documents. The CD-ROM also includes many of the budget
tables in spreadsheet format, supplemental materials
that were previously included in the printed Analytical
Perspectives volume, and materials comprising the
Historical Tables.
For more information on access to electronic versions
of the budget documents (except CD-ROMs), call (202)
512-1530 in the D.C. area or toll-free (888) 293-6498. To
purchase the Budget CD-ROM or printed documents call
(202) 512-1800.
GENERAL NOTES
1. All years referenced for budget data are fiscal years unless otherwise noted. All years referenced for economic data are calendar years unless otherwise noted.
2. Detail in this document may not add to the totals due to rounding.
3. At the time the President’s 2016 Budget request was developed, the 2015 Department of
Homeland Security Appropriations bill was not enacted; therefore, the discretionary programs
and activities normally provided for in the full-year appropriations bill were operating under a
continuing resolution (Public Law 113-235, Division L). For those programs and activities, fullyear appropriations data included in the current year column (2015) in the budget Appendix,
and in tables that show details on discretionary spending amounts in the Analytical Perspectives
volume, reflect the annualized level provided by the continuing resolution. In the main Budget
volume and the online Historical Tables volume, current year totals by agency and for the total
Government match the President’s 2015 Budget request.
U.S. GOVERNMENT PRINTING OFFICE, WASHINGTON 2015
092678-5
90000
For sale by the Superintendent of Documents, U.S. Government Publishing Office
Internet: bookstore.gpo.gov Phone: toll free (866) 512-1800; DC area (202) 512-1800
Fax: (202) 512-2104 Mail: Stop IDCC, Washington, DC 20402-0001
I S B N 978-0-16-092678-5
Table of Contents
Page
The Budget Message of the President ������������������������������������������������������������������������������������������������1
Building on a Record of Economic Growth and Progress ������������������������������������������������������������7
Helping, Not Hurting the Economy: The End of Austerity and the Move Away from
Manufactured Crises ��������������������������������������������������������������������������������������������������������������8
Fiscal Progress �������������������������������������������������������������������������������������������������������������������������10
The Budget: A Roadmap for Continued Economic and Fiscal Progress �������������������������������12
Investing in America’s Future �����������������������������������������������������������������������������������������������������������15
Investing in Jobs and Economic Growth ���������������������������������������������������������������������������������������17
Accelerating Manufacturing Industry Growth ����������������������������������������������������������������������17
Investing in Research and Development ��������������������������������������������������������������������������������18
Cutting Carbon Pollution and Investing in Climate Preparedness and Resilience �������������19
Investing in the Green Climate Fund and Leading International Efforts
to Cut Carbon Pollution and Enhance Climate Change Resilience �����������������������������������24
Maintaining the Nation’s Natural Resources ������������������������������������������������������������������������25
Improving the Farm Safety Net through Common Sense Reforms ��������������������������������������25
Building a 21st Century Infrastructure �����������������������������������������������������������������������������������������25
Long-Term Investments in Upgrading America’s Transportation Infrastructure ���������������25
Infrastructure Permitting �������������������������������������������������������������������������������������������������������27
Build America Investment Initiative ��������������������������������������������������������������������������������������27
Launching the National Parks Centennial Initiative ������������������������������������������������������������28
Smart Investments in Federal Facilities ��������������������������������������������������������������������������������28
High-Quality, Affordable Education: From Pre-K to College �������������������������������������������������������29
Improving Access to High-Quality, Affordable Early Education �������������������������������������������30
Preparing all Students for Success in College and Careers ��������������������������������������������������30
Delivering a Quality, Affordable College Education to Millions of Americans ���������������������32
Wall Street Reform �������������������������������������������������������������������������������������������������������������������������33
Creating Opportunity and Supporting Working Families �����������������������������������������������������������34
Supporting Working Families �������������������������������������������������������������������������������������������������34
Strengthening Retirement Security ���������������������������������������������������������������������������������������38
A Place-Based Approach to Expanding Opportunity ������������������������������������������������������������39
Strengthening Social Security and Services for People with Disabilities ����������������������������42
Ending Homelessness ��������������������������������������������������������������������������������������������������������������43
Ensuring Safety, Fairness, and Community Trust in the Criminal Justice System �������������������43
Maintaining the Nation’s Security ������������������������������������������������������������������������������������������������44
Advancing National Security Priorities ���������������������������������������������������������������������������������46
Honoring America’s Commitment to Veterans �����������������������������������������������������������������������51
Tax Reform That Promotes Growth and Opportunity ������������������������������������������������������������������52
Supporting Middle Class and Working Families through the Tax Code �������������������������������52
Reforming Capital Gains Taxation, Imposing a Fee on Large
Financial Firms, and Closing Tax Loopholes ����������������������������������������������������������������������54
Making Sure Everyone Pays Their Fair Share and Reducing the Deficit ����������������������������56
Fixing America’s Broken Business Tax System and Rebuilding Its Infrastructure ������������56
Investing in a High-Performing Internal Revenue Service ���������������������������������������������������58
Fixing America’s Broken Immigration System �����������������������������������������������������������������������������58
Addressing the Root Causes of Migration from Central America �����������������������������������������59
Securing the Borders and Enforcing U.S. Immigration Laws �����������������������������������������������59
Page
Improving Health Care through ACA and Additional Reforms ���������������������������������������������������60
Supporting Implementation of the Affordable Care Act ��������������������������������������������������������61
Strengthening Medicare and Medicaid ����������������������������������������������������������������������������������61
Health Care Delivery System Reforms �����������������������������������������������������������������������������������63
Public Health, Safety, and Security ����������������������������������������������������������������������������������������64
Health Centers and Health Workforce �����������������������������������������������������������������������������������66
A Government of the Future ��������������������������������������������������������������������������������������������������������������69
Effectiveness: Delivering World-Class Customer Service for Citizens and Businesses �������������70
Ramping Up Smarter Information Technology Delivery �������������������������������������������������������70
Delivering World-Class Customer Service �����������������������������������������������������������������������������71
Efficiency: Increasing Quality and Value in Core Operations �����������������������������������������������������72
Expanding Shared Services to Increase Quality and Savings ����������������������������������������������72
Shrinking the Federal Real Property Footprint ���������������������������������������������������������������������73
The Benchmarking Initiative ��������������������������������������������������������������������������������������������������74
Economic Growth: Investing in Government Assets to Fuel Innovation,
Job Creation, and Economic Prosperity �������������������������������������������������������������������������������������74
Opening Data to Spark Innovation �����������������������������������������������������������������������������������������74
Accelerating and Institutionalizing Lab-to-Market Practices �����������������������������������������������75
People and Culture: Unlocking the Full Potential of Today’s Federal
Workforce and Building the Workforce Needed for Tomorrow �������������������������������������������������75
Leading America’s Workforce ��������������������������������������������������������������������������������������������������76
Employee Engagement ������������������������������������������������������������������������������������������������������������76
Encouraging an Agile Workforce ���������������������������������������������������������������������������������������������77
Improving Results: Setting Goals and Tracking Performance ����������������������������������������������������77
Improving Performance and Accountability ���������������������������������������������������������������������������77
Using Evidence and Evaluation to Drive Innovation and Outcomes �����������������������������������78
Reorganizing Government: Reforming the Government to Win in the Global Economy �����������81
Economic Competitiveness ������������������������������������������������������������������������������������������������������81
Food Safety �������������������������������������������������������������������������������������������������������������������������������81
Science, Technology, Engineering, and Mathematics �������������������������������������������������������������82
Reforming the Tennessee Valley Authority ����������������������������������������������������������������������������83
Other Actions ���������������������������������������������������������������������������������������������������������������������������83
Cuts, Consolidations, and Savings ����������������������������������������������������������������������������������������������������85
Summary Tables ������������������������������������������������������������������������������������������������������������������������������������89
OMB Contributors to the 2016 Budget �������������������������������������������������������������������������������������������141
THE BUDGET MESSAGE OF THE PRESIDENT
To the Congress of the United States:
After a breakthrough year for America, our economy is growing and creating jobs at the fastest
pace since 1999, and in 58 months we have created over 11 million jobs. Our unemployment rate is
now lower than it was before the financial crisis. More of our kids are graduating than ever before.
More of our people are insured than ever before. We are as free from the grip of foreign oil as we’ve
been in almost 30 years. Thanks to the hard work, resilience, and determination of the American
people over the last six years, the shadow of crisis has passed.
With a growing economy, shrinking deficits, bustling industry, and booming energy production, we
have risen from recession freer to write our own future than any other Nation on Earth. It’s now up
to us to choose what kind of country we want to be over the next 15 years, and for decades to come.
Will we accept an economy where prosperity belongs to a few and opportunity remains out of reach
for too many? Or will we commit ourselves to an economy that generates rising incomes and chances
for everyone who makes the effort?
Over the last six years, we’ve seen that middle-class economic works. We’ve reaffirmed one of our
most fundamental values as Americans: that this country does best when everyone gets their fair
shot, does their fair share, and plays by the same set of rules.
The ideas I offer in this Budget are designed to bring middle-class economics into the 21st Century.
These proposals are practical, not partisan. They’ll help working families feel more secure with
paychecks that go further, help American workers upgrade their skills, so they can compete for
higher-paying jobs, and help create the conditions for our businesses to keep generating good new jobs
for our workers to fill. The Budget will do these things while fulfilling our most basic responsibility
to keep Americans safe. We will make these investments and end the harmful spending cuts known
as sequestration, by cutting inefficient spending, and closing tax loopholes. We will also put our
Nation on a more sustainable fiscal path by achieving $1.8 trillion in deficit reduction, primarily
from reforms in health programs, our tax code, and immigration.
First, middle-class economics means helping working families afford the cornerstones of economic
security: child care, college, health care, a home, and retirement. We will help working families
tackle the high costs of child care and make ends meet by tripling the maximum child care credit for
middle-class families with young children, increasing it to up to $3,000 per child, expanding child
care assistance to all eligible low-income families with children under four by the end of 10 years,
and making preschool available to all four-year-olds.
The Budget also provides middle-class families more flexibility at work by encouraging States to
develop paid family leave programs. Today, we’re the only advanced country on Earth that doesn’t
guarantee paid sick leave or paid maternity leave to our workers. Forty-three million workers
have no paid sick leave, which forces too many parents to make the gut-wrenching choice between
1
2
THE BUDGET MESSAGE OF THE PRESIDENT
a paycheck and a sick kid at home. It’s time to change that. For many families in today’s economy,
having both parents in the workforce isn’t a luxury, it’s an economic necessity.
Second, middle-class economics means making sure more Americans have the chance to earn the
skills and education they need to keep earning higher wages down the road. The Budget calls for new
investments and innovation that will expand preschool and invest in high-quality early education for
America’s youngest learners, provide more help to disadvantaged students and the schools that serve
them, better prepare and support teachers, and transform our high schools so they help all students
graduate prepared for college and career.
In a 21st Century economy that rewards knowledge more than ever, our efforts must reach higher
than high school. By the end of this decade, two-thirds of job openings will require some higher
education, and no American should be priced out of the education they need. Over the course of my
Administration, we have increased Pell Grants, and the Budget continues to ensure that they will
keep pace with inflation over time. The Budget also includes a bold new plan to bring down the cost
of community college tuition for responsible students, to zero. Forty percent of college students attend
community college; some to learn a particular skill, others as a path to a four-year degree. It is time
for two years of college to become as free and universal in America as high school is today.
Even as we help give our students the chance to succeed, we also must work together to give
our workers the chance to retool. Last year, the Congress came together and passed important
improvements to the Nation’s job training system with the bipartisan Workforce Innovation and
Opportunity Act. To build on this progress, the proposals in this Budget support more in-person
career counseling for unemployed workers and double the number of workers receiving training
through the workforce development system. My plan would also expand the successful “learn-as-youearn” approaches that our European counterparts use successfully by investing in the expansion of
registered apprenticeships that allow workers to learn new skills while they are earning a paycheck.
The Budget would also ensure that training leads to high-quality jobs by investing in projects that
feature strong employer partnerships, include work-based learning, and develop new employervalidated credentials.
As we welcome home a new generation of returning heroes, the Budget makes sure they have the
chance to live the American Dream they helped defend. It invests in the five pillars I have outlined
to support our Nation’s veterans: providing the resources and funding they deserve; ensuring highquality and timely health care; getting veterans their earned benefits quickly and efficiently; ending
veteran homelessness; and helping veterans and their families get good jobs, education, and access to
affordable housing.
Third, middle-class economics means creating the kind of environment that helps businesses start
here, stay here, and hire here. We want to build on the growth we have seen in the manufacturing
sector, where more than 750,000 new jobs have been created over the last 58 months. To create jobs,
continue growth in the industry, and strengthen America’s leadership in advanced manufacturing
technology, the Budget funds a national network of 45 manufacturing institutes, building on the nine
already funded through 2015. As part of the manufacturing initiative, the Budget also launches
a Scale-Up Fund, funded through a public-private partnership to help ensure that if a technology
is invented in the United States, it can be made in the United States. The Budget proposes an
investment fund to help startup companies produce the goods they have developed. Taken together,
these investments will help ensure that America keeps making things the rest of the world wants to
buy and will also help create manufacturing jobs for the future.
THE BUDGET FOR FISCAL YEAR 2016
3
Our Nation thrives when we are leading the world with cutting-edge technology in manufacturing,
infrastructure, clean energy, and other growing fields. That is why the Budget includes investments
in cutting-edge advanced manufacturing research—to make sure we are leading the way in creating
technology that supports our manufacturing sector; biomedical research—like our BRAIN initiative,
which studies the brain to offer new insight into diseases like Alzheimer’s, and Precision Medicine,
which can improve health outcomes and better treat diseases; or, agricultural research—looking at
climate resilience and sustainability. These investments have the potential to create high-wage jobs,
improve lives, and open the door to new industries, resulting in sustainable economic growth.
As our economy continues to grow, our Nation’s businesses and workers also need a stronger
infrastructure that works in the new economy—modern ports, stronger bridges, better roads, faster
trains, and better broadband. The Budget proposes to build a 21st Century infrastructure that creates
jobs for thousands of construction workers and engineers, connects hardworking Americans to their
jobs, and makes it easier for businesses to transport goods. The Budget would do more to repair and
modernize our existing roads and bridges, while expanding transit systems to link communities and
support workers.
These proposals will put more money in middle-class pockets, raise wages, and bring more highpaying jobs to America. To pay for them, the Budget will cut inefficient spending and close tax loopholes
to make sure that everyone pays their fair share. The Budget closes loopholes that punish businesses
investing domestically and reward companies that keep profits abroad, and uses some of the savings
created to rebuild our aging infrastructure. The Budget closes loopholes that perpetuate inequality
by allowing the top one percent of Americans to avoid paying any taxes on their accumulated wealth
and uses that money to help more young people go to college. The Budget simplifies the system so
that a small business owner can file based on her actual bank statement, instead of the number of
accountants she can afford. It is time for tax reform that at its core is about helping working families
afford child care and college, and plan for retirement, and above all, get a leg up in the new economy.
Of course, we cannot separate our work here at home from challenges beyond our shores. By
winding down the wars overseas and lowering war spending, we’ve strengthened our economy and
shrunk our deficits. But we still face threats to our security that we must address.
The Budget supports our efforts to degrade and ultimately destroy ISIL. We are leading over 60
partners in a global effort that will take time and steady resolve. As I made clear in my State of the
Union address, I am calling on the Congress to show the world that we are united in this mission by
passing a bill to authorize the use of force against ISIL.
The Budget supports our efforts to counter Russian pressure and aggressive actions in concert with
our European allies, by funding support for Ukraine’s democracy and efforts to reassure our NATO
allies.
We also must look beyond the issues that have consumed us in the past to shape the coming
century. This Budget provides the resources we need to defend the Nation against cyber-attacks. No
foreign nation, no hacker, should be able to shut down our networks, steal our trade secrets, or invade
the privacy of American families. In addition to increasing funding to protect our Nation against
cyber-attacks, I continue to urge the Congress to finally pass the legislation we need to meet this
evolving threat.
4
THE BUDGET MESSAGE OF THE PRESIDENT
The Budget invests in our efforts to confront the threat posed by infectious diseases like Ebola—
here at home, and internationally. It provides resources to support the Global Health Security Agenda,
increases funding to eradicate polio and other global health challenges, and creates a new Impact
Fund for targeted global HIV/AIDS efforts. In addition, the Budget increases funding for domestic
preparedness efforts to more effectively and efficiently respond to potential, future outbreaks here
at home and dedicates funding for States to develop HIV Plans to help them reach the goals of the
National HIV/AIDS Strategy.
The Budget also capitalizes on historic opportunities in Asia and the Pacific—where we are
modernizing alliances, opening new markets, and making sure that other nations play by the rules—
in how they trade, resolve disputes, and do their part to confront the biggest challenges we face.
No challenge poses a greater threat to future generations than climate change. Fourteen of our
planet’s 15 warmest years on record have all fallen in the first 15 years of this century. The world’s best
scientists are telling us that our activities are changing the climate, and if we do not act forcefully, we’ll
continue to see rising oceans, longer, hotter heat waves, dangerous droughts and floods, and massive
disruptions that can trigger greater migration, conflict, and hunger around the globe. The Pentagon
says that climate change poses immediate risks to our national security. And as discussed in the
Budget, the significant costs to inaction on climate change hit the Federal Government’s bottom-line
directly, as worsening climate impacts create Government liabilities. That’s why this Budget takes
action on climate by supporting the Climate Action Plan that I released in 2013 with investments to
accelerate carbon pollution reductions, to build on-the-ground partnerships with local communities
and help them put in place strategies for greater resilience to climate change impacts, and to support
America’s leadership abroad on this important moral and fiscal issue.
Beyond these critical investments, the Budget also supports my Management Agenda, which seeks
to create a Government for the future that is more efficient, effective, and supportive of economic
growth. The Budget includes initiatives to improve the service we provide to the American public; to
leverage the Federal Government’s buying power to bring more value and efficiency to how we use
taxpayer dollars; to open Government data and research to the private sector to drive innovation and
economic growth; to promote smarter information technology; and, to attract and retain the best talent
in the Federal workforce. The Budget includes proposals to consolidate and reorganize Government
agencies to make them leaner and more efficient, and it increases the use of evidence and evaluation
to ensure that taxpayer dollars are spent wisely on programs that work.
The Congress can also help grow the economy, reduce deficits, and strengthen Social Security by
passing comprehensive immigration reform. Last year, I took a series of executive actions to crack
down on illegal immigration at the border; prioritize deporting felons, not families; and allow certain
undocumented immigrants who register and pass criminal and national security background checks
to start paying their fair share of taxes and stay in the United States without fear of deportation. I also
took action to streamline the legal immigration system for talented STEM students, entrepreneurs,
and business. These actions will raise average wages for all American workers and reduce the deficit.
But this is only a first step toward real reform, and as I have said before, the Congress should act on
the more comprehensive reform that only changes in the law can provide. Independent economists
say immigration reform will grow our economy and shrink our deficits by almost $1 trillion over 20
years. It is time to fix our broken system and help grow our economy by passing comprehensive
immigration reform.
THE BUDGET FOR FISCAL YEAR 2016
5
The Budget also builds on the progress we have made ensuring that every American has the peace
of mind that comes with quality, affordable health insurance. The Affordable Care Act has helped to
provide millions more Americans get covered. It has forced insurance companies to play by the rules
by prohibiting discrimination for pre-existing conditions and eliminating lifetime insurance caps. It
has also helped to put our Nation on a more sustainable fiscal path by slowing the growth of health
care costs. The Budget includes additional reforms and cost saving proposals to continue encouraging
high-quality and efficient health care.
This Budget shows what we can do if we invest in America’s future and commit ourselves to an
economy that rewards hard work, generates rising incomes, and allows everyone to share in the
prosperity of a growing America. It lays out a strategy to strengthen our middle class, and help
America’s hard-working families get ahead in a time of relentless economic and technological change.
Fifteen years into this new century, and six years after the darkest days of the financial crisis, we
have picked ourselves up, dusted ourselves off, and begun again the work of remaking America. We’ve
laid a new foundation. A brighter future is ours to write. This Budget will help us begin this new
chapter together.
Barack Obama
The White House,
February 2, 2015.
BUILDING ON A RECORD OF ECONOMIC
GROWTH AND PROGRESS
“It is indisputable that our economy is stronger today than when I took office. By every economic
measure, we are better off now than we were when I took office.”
—President Barack Obama, Northwestern University, October 2, 2014
When the President took office in 2009, the
economy was shrinking at its fastest rate in 50
years and shedding over 800,000 private sector jobs per month. The unemployment rate
reached 10 percent that year, a level not seen
in over 25 years. The housing market was in
a free fall and the American manufacturing
industry was thought to be in irreversible decline, with the auto industry nearing collapse.
The deficit hit a post-World War II high, and
health care costs had been rising rapidly for
decades.
Today, the U.S. economy is recovering and, in
2014, achieved a number of important milestones.
American businesses set a new record for the most
consecutive months of job growth: 58 straight
months and a total of 11.2 million new jobs, and
counting. In 2014, the economy added more jobs
than in any year since the 1990s. Significantly,
nearly all of the employment gains have been in
full-time positions. At the same time, the annual
unemployment rate in 2014 fell 1.2 percentage
points from the previous year, the largest annual
decline in the last 30 years.
11.2 Million Jobs Added Over the Past 58 Months
Seasonally-adjusted private sector monthly job gain/loss
400,000
200,000
0
-200,000
-400,000
-600,000
-800,000
Jan
2008
Jan
2009
Jan
2010
Jan
2011
Source: Bureau of Labor Statistics.
7
Jan
2012
Jan
2013
Jan
2014
8
BUILDING ON A RECORD OF ECONOMIC GROWTH AND PROGRESS
Over the last four years, the United States has
put more people back to work than Europe, Japan,
and every other advanced economy combined. As
the economy strengthened, the unemployment
rate fell from a high of 10 percent in 2009 to 5.6
percent at the end of 2014. Long-term unemployment declined from 6.8 million in April 2010 to
2.8 million in December 2014 and fell even faster
than overall unemployment over the past year.
collapse; fought for passage of the Affordable
Care Act to provide insurance coverage to millions of Americans and help slow the growth
of health care costs; and secured the DoddFrank Wall Street reform legislation to help
prevent future crises. The American people’s
determination and resilience, coupled with the
Administration’s work, are driving the economy
full steam ahead.
For the first time in two decades, the United
States has started producing more oil than it imports. Domestic natural gas production set a new
record high in 2014. The manufacturing sector
continues to experience its strongest period of job
growth since the late 1990s. Rising home prices
are bringing millions of homeowners back above
water, restoring nearly $5 trillion in home equity.
Helping, Not Hurting the Economy:
The End of Austerity and the Move
Away from Manufactured Crises
The progress in the economy since the
President took office has been steady and it
has been real. The President’s decisive actions
during the financial crisis brought the economy
back from the brink, to the increasingly strong
growth seen today. The Administration pushed
the Recovery Act to jumpstart the economy and
create jobs; rescued the auto industry from near
During the first years of the Administration,
the President and the Congress worked together to enact measures that jumpstarted and
strengthened the economy, and made it more resilient for the future. In addition to the Recovery
Act, the Affordable Care Act, and Dodd-Frank
Wall Street reform legislation, the Congress
took bipartisan action in 2010 to temporarily
reduce payroll taxes and continue emergency
unemployment benefits.
Unfortunately, policies adopted in subsequent
years hurt, rather than helped, the economy.
Consumer Confidence has Returned to Pre-Crisis Levels
Reuters/Michigan monthly consumer sentiment index
100
95
90
85
80
75
November 2013
70
65
60
August 2011
55
50
Jul 2007
Jul 2008
Jul 2009
Jul 2010
Jul 2011
Source: University of Michigan: Consumer Sentiment (NSA, Q1-66=100).
Jul 2012
Jul 2013
Jul 2014
9
THE BUDGET FOR FISCAL YEAR 2016
A Retrospective on 2013 Sequestration
When the Congress failed to enact the balanced long-term deficit reduction required by the Budget Control Act
of 2011, a series of automatic cuts known as sequestration went into effect, cancelling more than $80 billion
in budgetary resources across the Federal Government in 2013. Beyond the economic impacts, these cuts
also had severe programmatic impacts, shortchanging investments that contribute to future growth, reducing
economic opportunity, and harming vulnerable populations. For example:
•
Hundreds of important scientific projects went unfunded. The National Institutes of Health funded the
lowest number of competitive research project grants in over a decade, providing roughly 750 fewer
competitive grants in 2013 compared to the previous year. These unfunded grants included more than a
hundred competitive renewal applications that were considered highly meritorious for additional funding
in peer review, limiting research into brain disorders, infectious disease, and cancer. Also as a result of
sequestration, the National Science Foundation awarded 690 fewer competitive awards than the previous
year, resulting in the lowest total number of competitive grants provided since 2006, limiting scientists and
students’ ability to pursue cutting-edge, potentially revolutionary discoveries.
•
Tens of thousands of low-income children lost access to Head Start. Over 57,000 children lost access
to Head Start and Early Head Start in school years 2012-2013 and 2013-2014, forgoing critical early
learning experiences and health and nutrition services intended to help improve their cognitive, physical,
and emotional development. As a result, Head Start enrollment dipped to its lowest level since 2001. In
addition, Head Start centers were forced to reduce the number of school days by more than 1.3 million.1
•
Fewer low-income families received housing vouchers. A total of 67,000 Housing Choice Vouchers were
lost, resulting in reduced access to affordable, safe, and stable housing for low-income families. Although
the Department of Housing and Urban Development and Public Housing Authorities took extraordinary
steps to prevent families from losing assistance, many vouchers were withdrawn from families that were
in the process of looking for housing or not reissued when families left the program, while many of the
families remaining in the program faced higher rents.
While the Bipartisan Budget Act of 2013 replaced a portion of the damaging and short-sighted sequestration
cuts in 2014 and 2015 with long-term reforms, they did not go far enough. Without further congressional
action, sequestration will return in full in 2016, bringing discretionary funding—or, spending that is approved
through the appropriations process—to its lowest level in a decade, adjusted for inflation. In fact, assuming
roughly the current allocation of resources across programs, a return to sequestration levels in 2016 would
mean the lowest real funding level for research since 2002—other than when sequestration was in full effect in
2013—and the lowest real per-pupil funding levels for education since 2000, a major disinvestment in exactly
the areas where investment is needed to support growth.
1
Head Start programs reported the number of days of service reduced because a shortened school year was required to implement the
unprecedented reductions in their funding. The total number of days grantees reported eliminated from their school year is multiplied by
the number of children affected by those cuts to produce the estimate that 1.3 million days of service were eliminated.
Sequestration cuts that took effect in March
2013 reduced the gross domestic product (GDP)
by 0.6 percentage points and cost 750,000 jobs,
according to the Congressional Budget Office
(CBO). In 2011, and again in 2013, congressional
Republicans sought to use the Nation’s full faith
and credit as a bargaining chip, driving down con-
sumer confidence and driving up economic policy
uncertainty measures. The Federal Government
shutdown in October 2013 created further uncertainty and reduced growth in the fourth quarter
of 2013 by at least 0.3 percentage points.
10
BUILDING ON A RECORD OF ECONOMIC GROWTH AND PROGRESS
Beginning in 2014, however, policymakers
moved away from manufactured crises and austerity budgeting, helping to lay the groundwork
for job market gains and stronger growth. The
President worked with congressional leaders
from both parties to secure a two-year budget
agreement (the Bipartisan Budget Act of 2013)
and enact full-year appropriations bills that replaced a portion of the harmful sequestration
cuts and allowed for higher investment levels in
2014 and 2015.
The Council of Economic Advisers estimated that the 2013 budget deal will create about
350,000 jobs over the course of 2014 and 2015,
meaning that it has likely contributed to the
marked improvement in the labor market this
past year. Moreover, thanks in part to the budget deal, 2014 will likely have been the first year
since 2010 that Federal fiscal policy did not significantly reduce economic growth.
Increased certainty and a break from the threat
of shutdown and other fiscal crises also added to
growth, according to several independent analyses. For example, an analysis by Macroeconomic
Advisers found that fiscal uncertainty cost
900,000 jobs from 2009 through mid-2013. The
crises also negatively impacted consumer confi-
dence, which fell markedly around the time of the
2011 and 2013 manufactured crises, and, along
with small business optimism, has only returned
to pre-recession levels in the past year (see previous chart). Business leaders, economists, and the
Federal Reserve Chair have all attributed stronger growth in part to reduced fiscal headwinds
and uncertainty, and business leaders have urged
policymakers to avoid a return to manufactured
crises and needless austerity.
Fiscal Progress
Since 2010, Federal deficits have shrunk at an
historic pace—the most rapid sustained deficit
reduction since the period just after World War
II. The turn away from austerity in 2014 was accompanied by another steep drop in the deficit,
bringing it to 2.8 percent of GDP—the lowest level
since 2007, about one-third the size of the deficit
the President inherited, and below the 40-year
average. Over the past five years, actual and projected deficits have fallen due to three main factors.
First, economic growth has helped accelerate
the pace of deficit reduction. Growth in recent
years has increased revenues and reduced spending on “automatic stabilizers” programs, such as
Recent Growth in Health Spending has been Slow in
Both the Private and Public Sectors
Average annual growth in real per enrollee health spending by payer
6%
5.5%
5.2%
2000-2007
2007-2010
2010-2013
5%
4%
4.2%
3%
2.4%
2%
1.4%
1%
0.4%
0%
-0.5%
-1%
-2%
-1.0%
Private Insurance
Medicare
Source: Centers for Medicare & Medicaid Services; U.S. Bureau of Economic
Analysis; Council of Economic Advisers calculation.
Medicaid
-0.6%
11
THE BUDGET FOR FISCAL YEAR 2016
unemployment insurance, that automatically increase during economic downturns.
Second, since 2010, policymakers have put in
place more than $4 trillion in deficit reduction
measures through 2025, not counting additional
savings achieved by winding down wars in Iraq
and Afghanistan. These measures include restoring Clinton-era tax rates on the wealthiest
Americans and discretionary spending restraint.
Sequestration cuts account for a minority of the
discretionary savings achieved since 2010, and
have had a negative impact on critical services
and public investments in future growth (see
above, A Retrospective on 2013 Sequestration).
Finally, deficits are falling due to historically
slow health care cost growth. The years since
2010 have seen exceptionally slow growth in
per-beneficiary health care spending in both
private insurance and public programs (see previous chart). As a result, 2011-2013 saw the
three slowest years of growth in real inflationadjusted per-capita national health expenditures
since record-keeping began in 1960. While some
of the slowdown can be attributed to the Great
Recession and its aftermath, there is increasing
evidence that much of it is the result of structural
changes. These include reforms enacted in the
Affordable Care Act that are reducing excessive
payments to private insurers and health care providers in Medicare, creating strong incentives for
hospitals to reduce readmission rates, and starting to change health care payment structures
from volume to value.
The health care cost slowdown is already yielding substantial fiscal dividends. Compared with
the 2011 Mid-Session Review, aggregate projected
Federal health care spending for 2020 has decreased by $216 billion based on current budget
estimates, savings above and beyond the deficit
reduction directly attributable to the Affordable
Care Act.
The chart below shows how slower health care
cost growth and policy changes are contributing
to improving the medium-term budget outlook. In
the 2011 Mid-Session Review, published in July,
2010, the Administration projected a 2020 deficit of 5.1 percent of GDP if current policies were
to continue. The Budget projects a baseline deficit of 3.3 percent of GDP in 2020, a reduction of
1.9 percentage points, or $491 billion. One major
contributor to the improvement is lower-thanexpected Federal health spending. Revisions to
health spending forecasts based on the historically slow growth of the past several years (and
Health Savings and Policy Choices have
Significantly Reduced Projected Deficits
Projected annual deficit in 2020 ($ in billions)
1,600
1,400
1,200
1,000
Projected deficit in 2020 is now
$491 billion, or 40% lower,
than anticipated in 2010
2010
Projection
800
600
2015
Projection
400
200
0
Plus Economic &
Non-Health
Technical
Revisions*
Plus Lower
Plus Discretionary Plus High-Income
Revenue
Spending
Health Spending
Reductions
Increases
* Also includes minor policy changes (e.g., mandatory sequestration).
12
BUILDING ON A RECORD OF ECONOMIC GROWTH AND PROGRESS
based on the assumption that only a portion of the
slowdown will continue) account for about half
of the net improvement in the projected deficits.
Another important factor is the high-income revenue increases enacted in the American Taxpayer
Relief Act of 2012, which contributed about a fifth
of the new improvement. Discretionary spending
restraint has also played a large role, although
the impact of sequestration is much less than the
impact of the pre-sequestration Budget Control
Act caps and prior appropriations action and less
than the savings from winding down wars.
An under-appreciated aspect of the Nation’s recent fiscal progress has been the way these same
factors, discussed above, have led to a significant
improvement in the long-term outlook (as discussed in more detail in the Long Term Budget
Outlook chapter of the Analytical Perspectives volume). Moreover, as discussed below, a number of
the President’s Budget policies, and particularly
the proposed reforms to health and immigration,
will not only substantially reduce deficits over
the next 10 years, but will have a growing impact
in reducing deficits beyond the next decade.
The Budget: A Roadmap for Continued
Economic and Fiscal Progress
The progress that has been made to date is
significant, but not sufficient to address either
the Nation’s economic or fiscal challenges. The
Budget increases investments that will accelerate growth and expand opportunity, while also
finishing the task of putting the Nation on a sustainable fiscal path.
Investing in Growth and Opportunity. The
Bipartisan Budget Act of 2013 reversed a portion
of sequestration and allowed for higher investment levels in 2014 and 2015, but it did nothing
to alleviate sequestration in 2016. In the absence
of congressional action, non-defense discretionary
funding in 2016 will be at its lowest level since
2006, adjusted for inflation, even though the need
for pro-growth investments in infrastructure, education, and innovation has only increased due to
the Great Recession and its aftermath. Inflation-
adjusted defense funding will also be at its lowest
level since 2006.
The Budget finishes the job of reversing mindless austerity budgeting and makes needed
investments in key priorities, even while setting the Nation on a fiscally responsible course.
The proposed increases in the discretionary budget caps make room for a range of domestic and
security investments that will help move the
Nation forward. These include investments to
strengthen the economy by improving the education and skills of the U.S. workforce, accelerating
scientific discovery, and continuing to bolster
manufacturing. They also include program integrity initiatives that will reduce the deficit by many
times their cost. As described in the Investing in
America’s Future chapter, the Budget proposes to
further accelerate growth and opportunity and
create jobs through pro-work, pro-family tax reforms and through mandatory investments—or,
direct spending that is determined outside the
appropriations process—in surface transportation infrastructure, universal pre-kindergarten,
child care assistance for middle-class and working families, and other initiatives.
Putting the Nation on a Sustainable Fiscal
Path. The Budget achieves $1.8 trillion of deficit
reduction over 10 years, primarily from health,
tax, and immigration reform. As described further in the Investing in America’s Future chapter,
the Budget includes about $400 billion of health
savings that grow over time, extending the life of
the Medicare Trust Fund by approximately five
years, and building on the Affordable Care Act
with further incentives to improve quality and
control health care cost growth. It also reflects
the President’s support for commonsense, comprehensive immigration reform along the lines
of the 2013 bipartisan Senate-passed bill. The
CBO estimated that the Senate-passed bill would
reduce the deficit by about $160 billion over 10
years and by almost $1 trillion over two decades,
while the Social Security Actuary estimated that
it would reduce Social Security’s 75-year shortfall
by eight percent. In addition, the Budget obtains
about $640 billion in deficit reduction from reducing tax benefits for high-income households.
THE BUDGET FOR FISCAL YEAR 2016
Under the Budget, deficits decline to about
2.5 percent of GDP. Starting in 2016, debt declines as well, reaching 73.3 percent of GDP in
2025, a reduction of 1.9 percentage points from
its peak. The key test of fiscal sustainability is
whether debt is stable or declining as a share of
the economy, resulting in interest payments that
consume a stable or falling share of the Nation’s
resources over time. The Budget meets that test,
showing that investments in growth and opportunity are compatible with also putting the Nation’s
finances on a strong and sustainable path.
13
The economic growth and progress the Nation
has seen in the President’s first six years in office prove that America’s resurgence is real. As
the President said it would be, 2014 was a year
of action and a breakthrough year for America;
a year that saw accelerated job growth, sharp
declines in unemployment, uninsured rates
at near-record lows, and a continuation of historically slow health care price growth. Now
it is time to invest in America’s future to drive
economic growth and opportunity, secure the
Nation’s safety, and put the Nation’s finances
on the road to a more sustainable fiscal outlook.
The Budget does just that.
INVESTING IN AMERICA’S FUTURE
“We have to make our economy work for every working American. And every policy I
pursue as President is aimed at answering that challenge.”
—President Barack Obama, Northwestern University, October 2, 2014
Today in America, we are seeing real, tangible
evidence of economic recovery from the crisis the
President inherited. In a 58-month streak, the
longest on record, American businesses have created more than 11 million new jobs, and almost
all of the employment gains since 2010 have
been in full-time positions. All in all, the economy added more jobs in 2014 than in any year
since the 1990s.
The Administration’s investments in American
manufacturing have helped fuel its best stretch
of job growth since the 1990s. America is now the
number-one producer of oil and the number-one
producer of natural gas; this has meant decreasing dependence on imported oil and increasing
competitiveness for American industry. The
rescue of the auto industry officially ended in
December 2014, and the American auto industry
is on track for its strongest year of new vehicle
production since 2005; about half a million new
jobs have been created in auto production and
sales since mid-2009, when Chrysler and General
Motors emerged from bankruptcy.
Since the President took office, the deficit has
been cut by about two thirds. The Nation has
seen the slowest health care cost growth in 50
years, with the largest reduction in the number
of uninsured Americans in decades. The high
school graduation rate is above 80 percent for
the first time in history. Both the crime rate and
the incarceration rate are falling.
We now have the chance to make sure that all
Americans are able to benefit from the economic
recovery. America’s promise has always been
that if we work hard, we can change our circumstances for the better. The economy cannot truly
succeed until we live up to that promise. The
Budget lays out a strategy to reach that promise,
by investing in the drivers of growth and opportunity for all Americans.
To ensure America remains a magnet for jobs,
the Budget builds on investments in manufacturing and innovation—including through clean
energy technology programs and tax policies that
position America as a global clean energy leader
with a strong and modern energy infrastructure.
To fix the Nation’s roads and bridges and create
more middle class jobs, it continues the progress
toward building a 21st Century infrastructure.
The Budget invests in education and job training
to give American workers the skills they need to
compete in the global economy. It also provides
resources to programs that help create opportunity and economic mobility for all, and it reforms
the tax system to better support and reward work.
To further the progress made to prevent another crisis such as the one we saw in 2008, the
15
16
INVESTING IN AMERICA’S FUTURE
Budget supports the financial stability efforts
launched through the Dodd-Frank Wall Street
Reform and Consumer Protection Act. The
Budget also invests in climate preparedness and
resilience—providing necessary tools, technical
assistance, and on-the-ground partnership to
communities that are dealing with the effects of
climate change today. In addition to directly helping these communities, preparing for the impacts
of climate change is also part of strengthening
the Nation’s long-term fiscal outlook (see below,
Federal Budget Exposure to Climate Risk).
The Budget recognizes that while America is
a world leader in domestic economic growth, it
must also continue to promote U.S. national security interests while mobilizing the international
community to address global challenges to the
Nation’s safety and security. That is why the
Budget further advances national security priorities by proposing the funding increases above
current law needed to execute the President’s defense strategy. The Budget supports America’s
continued fight to degrade and ultimately defeat the Islamic State of Iraq and the Levant
(ISIL). The Budget continues the transition in
Afghanistan, while also supporting European
reassurance efforts to counter Russia’s aggressive actions. It advances security, prosperity, and
economic growth in the Central America Region
to address the root causes of migration. The
Budget also confronts threats such as Ebola by
strengthening U.S. global health security and
continues to invest in the Nation’s cybersecurity,
while supporting efforts to maintain technological superiority. It continues the progress made to
reassert American leadership in the Asia-Pacific
region. The Budget also upholds the Nation’s
duty to care for its veterans who have risked their
lives to serve America.
The Budget also shows that we can end sequestration, make the investments necessary to
support economic growth, economic mobility, and
national security, and continue to make progress
in meeting the Nation’s fiscal goals. To further
strengthen America’s long-term fiscal outlook
and the economy, the Budget sets the Nation on
a sustainable fiscal path, achieving $1.8 trillion
of deficit reduction over 10 years, primarily from
health, tax, and immigration reforms described
in this chapter. The Budget proposes to maintain
the Affordable Care Act’s progress in constraining the growth of health care costs and spurring
additional health care reforms to make the system work better for all Americans. It supports
comprehensive immigration reform, which would
not only grow the U.S. economy, but also strengthen the Nation’s fiscal future, reducing deficits
by almost $1 trillion over 20 years. The Budget
also reforms the tax system to raise the revenue
needed to keep our commitments to seniors,
Deficits Remain Low Under President's Budget
Annual deficits as a percent of GDP
10% 9.8%
Historical
2016 Budget
8%
6%
4%
2.8%
2.5%
2%
0%
2009 2010 2011 2012 2013 2014 2015 2016 2017 2018 2019 2020 2021 2022 2023 2024 2025
17
THE BUDGET FOR FISCAL YEAR 2016
without shortchanging investments in the next
generation. All told, the Budget puts the Nation’s
economy on a more sustainable fiscal path, with
deficits around 2.5 percent of the Gross Domestic
Product (GDP) and debt as a share of the economy on a downward path after 2015.
In order to make these critical investments to
create more jobs, grow the economy, and ensure
the Nation’s safety and security, while also putting the Federal budget on a more sound fiscal
footing, the Federal Government must continue
to move away from the mindless austerity and
manufactured crises that have hurt the economy
in recent years. As discussed in the previous
chapter, Building on a Record of Economic Growth
and Progress, the Bipartisan Budget Act in late
2013 represented real progress—partially replacing sequestration cuts in 2014 and 2015, fully
offset by long-term savings, in order to provide
certainty and increase discretionary investments.
The Budget builds on this progress by proposing
additional investments in vital areas such as
education, research, and national security, offset
by a balanced package of spending cuts, proposals to close tax loopholes, and program integrity
measures. These investments are crucial to the
Nation’s economic growth and national security. Failing to make them—and returning to the
mindless austerity of sequestration in 2016—
would weaken America’s economy at a time of
accelerating growth.
INVESTING IN JOBS AND ECONOMIC GROWTH
Accelerating Manufacturing
Industry Growth
America is building again. The manufacturing sector has been a critical driver of economic
growth and job creation since the President took
office, adding more than 750,000 new jobs over
the last 58 months. The Recovery Act and subsequent Administration efforts have helped reignite
America’s manufacturing industry, which many
thought was in irreversible decline at the height
of the Great Recession. These efforts helped create new clean energy manufacturing markets
and rescued the auto industry, which is now on
track for its strongest year of new vehicle production since 2005. The President is committed to
continuing the manufacturing sector’s growth in
order to attract the kind of well-paying jobs that
will help drive middle class economic security.
The Budget reflects that commitment by investing in efforts to promote advanced manufacturing
technology and efforts to ensure that manufacturing technology made in America can be used
in America, to help create more jobs, and grow the
economy.
Manufacturing Institutes. To support investment and accelerate innovation in U.S.
manufacturing, the President has called for the
creation of a National Network for Manufacturing
Innovation across the Nation. The Congress supported this initiative in a bipartisan fashion by
passing the Revitalize American Manufacturing
and Innovation Act in December 2014, which authorizes manufacturing innovation institutes to
come together into a shared network and codifies
authority for the Department of Commerce to coordinate this multi-agency initiative.
Leveraging the strengths of a particular
region, each institute will bring together companies, universities, community colleges, and
Government to co-invest in the development of
world-leading manufacturing technologies and
capabilities that U.S.-based manufacturers can
apply in production. For example, the first manufacturing innovation institute, America Makes
in Youngstown, Ohio, is focused on reducing the
cost of 3D printing, connecting small businesses
with new opportunities, and training American
workers to master these sophisticated technologies. Although only in its third year of operation,
the institute has research underway that will
help accelerate the speed of 3D printing in metals by a factor of 10, is partnering to provide over
1,000 schools with access to 3D printers, and has
launched new workforce training programs that
have trained over 7,000 workers in the fundamentals of 3D printing. In addition to launching
18
new products and filing new patents from the research already underway, the institute is serving
as a magnet for investment in the region.
The Budget funds a national network of 45
manufacturing institutes that will position the
United States as a global leader in advanced manufacturing technology. Specifically, the Budget
builds on the nine institutes already funded
through 2015 with more than $350 million in additional discretionary funds to support seven new
manufacturing institutes in the Departments
of Commerce, Agriculture, Defense, and Energy.
The Budget also includes a mandatory spending
proposal of $1.9 billion to fund the remaining 29
institutes in the network.
Scale-Up Manufacturing Investment Funds.
The Budget also calls on the Congress to work
together with the President to launch a publicprivate investment in a Scale-Up Fund as part
of the Administration’s innovative manufacturing initiative. This will help emerging advanced
manufacturing technologies reach commercial viability, ensuring that if a technology is invented
in the United States, it can be made in the United
States. To address the gap in financing for these
new manufacturing firms, the Budget proposes
a $5 billion investment fund, administered by
the Small Business Administration, which will
be matched with non-Federal funds to increase
investment in the first commercial production
facilities for technology intensive manufacturing
start-ups. These funds will help entrepreneurial
firms secure capital to scale from idea to prototype,
and into full commercial production. Once fully
deployed, this fund could eventually leverage up
to $10 billion in total public-private investment
to build first-of-its-kind manufacturing production capabilities here in the United States.
Investing in Research and Development
America’s long-term economic competitiveness
and growth—including efforts to grow domestic
manufacturing—depend on robust investments
in research and development (R&D), which provide the foundation needed to further grow the
economy. Federal funding for R&D has helped
INVESTING IN AMERICA’S FUTURE
lead to new products, new capabilities, and new
industries, resulting in sustainable economic
growth and highly-skilled, high-wage jobs, as well
as the creation of an astounding array of products
and services that benefit every American. Today,
we look to engineering and science to address the
Nation’s biggest challenges: creating jobs; improving the health of all Americans; enhancing
access to clean energy, water, and food; addressing global climate change; managing competing
demands on environmental resources; and ensuring the security of the Nation.
The Budget provides $146 billion for R&D
overall, a 5.5 percent increase from 2015, targeting resources to areas most likely to directly
contribute to the creation of transformational
knowledge and technologies that can benefit society and create the businesses and jobs of the
future. In addition to making permanent and
expanding the Research and Experimentation
Tax Credit (discussed later in this chapter), the
Budget includes increases for several priorities.
• Basic Research at the Department of Energy
(DOE) and the National Science Foundation
(NSF). To continue the cutting-edge R&D
that is essential to U.S. innovation and economic competitiveness, the Budget provides
DOE’s Office of Science with over $5.3 billion and NSF with over $7.7 billion. These
investments support ground-breaking research and world-leading facilities across
fields of science and engineering, including
advanced manufacturing, clean energy, climate science, information technology, and
life sciences.
• Biomedical Research at the National Insti-
tutes of Health (NIH). The Budget provides
$31.3 billion to support biomedical research
at NIH, providing about 10,000 new NIH
grants that will help to better understand
the fundamental causes and mechanisms
of disease. The Budget provides increased
resources for Alzheimer’s, cancer and other
diseases that affect millions of Americans,
and enhanced support for the BRAIN initiative that is helping to revolutionize understanding of the human brain.
THE BUDGET FOR FISCAL YEAR 2016
• Precision Medicine Initiative. The Budget
includes $215 million to launch a Precision
Medicine initiative that will accelerate the
ability to improve health outcomes and better treat diseases. The Budget will help to
begin the establishment of a voluntary national research group of a million or more
Americans, expand research to define cancer
subtypes and identify new therapeutic targets, modernize the regulatory framework
for DNA-sequence-based diagnostic tests,
and enhance interfaces for electronic health
records and patient-generated data in assessment of individual health and population-level trends.
• Agriculture R&D. The Budget recognizes
the importance of science and technology to
meet challenges in agriculture, and provides
significant investment increases in three
major areas of agricultural R&D: 1) Competitive grants are funded at $550 million to
support extramural research grants through
the Department of Agriculture’s (USDA)
flagship Agriculture and Food Research Initiative, for advanced manufacturing publicprivate institutes, and for a new program to
provide competitive support to land grant
institutions; 2) USDA’s in-house research
programs are funded at $1.19 billion, which
includes increases for current and new programs for climate change resilience and vulnerability, agricultural sustainability (e.g.,
vertical agriculture), translational genetics, antimicrobial resistance and pollinator
health, as well as major investments in the
repair and maintenance of USDA laboratories to increase their lifespan and respond
to health and safety issues; and 3) $206 million in key infrastructure investments fully
funds USDA’s five highest laboratory construction and renovation needs, including
the poultry biosafety and laboratory consolidation in Athens, Georgia.
• Stewardship of Natural Resources and
the Environment.
Sustainable stewardship of natural resources requires strong
R&D investments in the natural sciences to
strengthen the scientific basis for decisionmaking. The Budget provides robust R&D
19
funding to support resource decision-making
and environmental stewardship at the Department of the Interior (DOI), Environmental Protection Agency (EPA), National
Oceanic and Atmospheric Administration
(NOAA), and USDA. The Budget provides
strong support for R&D related to the management of public lands, ecosystems, energy
permitting, and Earth observations (such
as earth observing satellites and monitoring of water, wildlife, and invasive species).
The Budget also provides strong support for
science to inform ocean and coastal stewardship, with investments in ocean observations and exploration, coastal mapping and
assessment, coastal ecosystem research,
and coastal habitat restoration. The Budget
strengthens investments in the safety and
security of the Nation through R&D related
to hazards such as earthquakes, floods, and
extreme weather.
Cutting Carbon Pollution and Investing
in Climate Preparedness and Resilience
Deep, persistent drought. Longer, fiercer wildfire seasons. High tides flooding downtowns.
Severe storms wreaking havoc. This is the picture from the front lines of climate change in
communities across America. As they face these
immediate climate crises, cities, towns, counties
and Tribes of every size and in every region of the
United States have stepped up to be part of the
solution: identifying their vulnerabilities; cutting carbon pollution; creating jobs by investing
in clean energy and energy efficiency; and finding
innovative solutions to make their communities
and infrastructure more resilient to climate extremes. Whether it is investing in clean energy
technology, or in necessary tools, technical assistance, and on-the-ground efforts, the Federal
Government has a key role to play as a strong and
ready partner with communities and the State,
local, and tribal leaders who are taking action on
climate today.
The Administration’s robust energy and climate efforts over the last six years provide a
strong foundation for this necessary partnership.
When the President took office, U.S. greenhouse
20
gas emissions were projected to continue increasing indefinitely, but the President set a new
course with an ambitious goal to cut emissions in
the range of 17 percent below 2005 levels in 2020.
Throughout the first term, the Administration
took strong actions to cut carbon pollution, including investing more than $80 billion in clean
energy technologies through the Recovery Act,
establishing historic fuel economy standards,
supporting policies that contributed to a doubling
of renewable energy generation, and implementing ambitious energy efficiency measures.
In 2013, the President launched an ambitious
Climate Action Plan that built on the progress
during the first term and doubled-down on cutting carbon pollution, preparing the Nation for
climate impacts, and leading internationally.
The Plan puts the Nation on track to meet the
President’s 2020 goal and establishes a strong
foundation to reach the new 2025 goal by cutting
carbon pollution through new measures, including a Clean Power Plan, historic standards for
heavy-duty engines and vehicles, new energy efficiency standards, and economy-wide measures
to reduce other greenhouse gases.
Cutting Carbon Pollution. Cutting carbon
pollution is essential to reducing the threat of
climate change and represents one of the greatest economic opportunities of the 21st Century.
Investments in pollution-cutting technologies
and proven energy efficiency and clean energy
solutions are investments in American jobs,
American industries, and Americans’ health.
That is why in June 2014, the EPA proposed
the Clean Power Plan, a flexible, commonsense
approach that builds on the actions States, cities, and businesses across the United States are
already taking to address the risks of climate
change by reducing carbon pollution from existing power plants.
The Budget includes $239 million to support
EPA efforts to address climate change through
commonsense standards, guidelines, and voluntary programs, including $25 million to help States
develop their Clean Power Plan strategies.
INVESTING IN AMERICA’S FUTURE
The Budget also includes an incentive fund for
States choosing to go beyond the Clean Power
Plan, which will be finalized this summer. The
Clean Power State Incentive Fund will provide $4
billion to support States exceeding the minimum
requirements established in the Clean Power Plan
for timing of State plans and the pace and extent
of carbon pollution reductions from the power
sector. This funding will enable States to invest
in a range of activities that complement and advance the Clean Power Plan, including efforts to
address disproportionate impacts from environmental pollution in low-income communities and
support for businesses to expand efforts in energy
efficiency, renewable energy, and combined heat
and power through, for example, grants and investments in much-needed infrastructure.
To support the development of pollution-cutting
technologies, the Budget invests approximately
$7.4 billion in clean energy technology programs,
advancing American clean energy leadership,
supporting job creation, and increasing energy security. These programs conduct research,
development, and deployment efforts that stimulate the evolution and use of clean energy sources
such as solar, wind, and low-carbon fossil fuels,
as well as energy-efficient technologies, products,
and process improvements. The largest investors are DOE, the Department of Defense (DOD),
NSF, and USDA. DOE provides about 75 percent of the clean energy technology funding and
supports a wide array of efforts across the clean
energy spectrum that will further reduce costs
and increase the use of clean energy technologies.
For example, these efforts include increasing the
affordability and convenience of advanced vehicles and domestic renewable fuels. They will
advance technologies to improve the efficiency of
the residential and commercial buildings of today and tomorrow, making energy systems more
easily integrated into the electric grid. DOE is
also developing technologies that reduce the costs
of carbon capture from fossil fuels, undertaking
research to ensure the safe, permanent storage
of carbon dioxide in underground geologic formations, and conducting R&D to measure and
mitigate fugitive methane emissions from natural gas infrastructure. DOE is also supporting
21
THE BUDGET FOR FISCAL YEAR 2016
R&D in advanced nuclear reactor technologies,
life extension for existing power plants, and innovative fuel-cycle concepts.
To support the adoption and scale-up of proven
energy-efficiency and clean-energy solutions, the
Budget includes additional key investments. For
example, the Budget invests roughly $100 million in core DOI renewable energy development
programs to review and permit new renewable
energy projects on Federal lands and waters.
These funds will allow DOI to continue progress toward its goal of permitting 20 gigawatts
of renewable energy capacity and related transmission infrastructure by 2020, as part of the
President’s Climate Action Plan. The Budget also
includes proposals to reform and renew tax credits that incentivize the deployment of wind, solar,
and carbon capture sequestration technologies.
In addition, the Budget invests in communities
that are experiencing an economic transition as
a result of the Nation’s energy transformation
toward cleaner power sources. This includes targeted investments in economic development for
areas such as Appalachia, where declines in coal
production over several decades have created economic challenges for communities and families.
Investing in Climate Resilience and
Preparedness. As a Nation, we need to better understand and prepare for the impacts of a
changing climate, which has widespread implications for the well-being of communities, health of
our natural resources, and national security. The
failure to invest in climate solutions and climate
preparedness does not just fly in the face of the
overwhelming judgment of science—it is fiscally
unwise. While it cannot be said with certainty
that any individual weather event is caused by
climate change, it is clearly increasing the frequency and intensity of extreme weather events,
from floods to drought to the most powerful
storms. The costs of climate change add up, and
ignoring the problem only makes it worse.
That is why the Budget makes investments to
increase the resilience of the Nation’s communities and ecosystems, improve understanding
of projected climate-change impacts, and assist
communities in planning and preparing for climate change. The goal is simple: to proactively
reduce the risks communities and ecosystems
face, rather than waiting until after disaster
strikes. These forward-thinking investments will
not only save lives, but will save communities
and taxpayers the costs associated with recovering from the next weather-related emergency for
which they were not prepared.
• Flood Resilience. The Budget includes $400
million for National Flood Insurance Program Risk Mapping efforts, an increase of
$184 million over current funding levels.
This increase will further support efforts
to help communities and businesses understand what areas pose flood risks. The Budget also includes robust investments that
will supplement ongoing work across USDA
in science and tool development and projects
to improve ecosystem and community resilience. Specifically, the Budget includes $200
million for USDA to emphasize watershedscale planning and land treatment efforts
and aid communities in planning and implementing mitigation and adaptation projects for extreme weather events, including
mitigating the risks associated with coastal
flooding.
The Budget includes
funding for two new coastal resilience programs—one at NOAA and one at DOI—that
will help reduce the risks that a changing
climate poses to ecosystems and communities. Funding at NOAA will help coastal
regions plan for and implement activities
related to extreme weather, changing ocean
conditions and uses, and climate hazards,
while DOI funding will focus on increasing
the return on investment from Federal land
protection and restoration, through projects
on adjacent non-Federal lands that restore
ecosystems and boost resilience in coordination with non-Federal partners. The NOAA
Regional Coastal Resilience Grants, funded at $50 million, will provide competitive
grants to State, local, tribal, private, and
non-governmental organization partners to
support activities such as vulnerability as-
• Coastal Resilience.
22
INVESTING IN AMERICA’S FUTURE
sessments, regional ocean partnerships, and
development and implementation of adaptation strategies. The new program at DOI,
also funded at $50 million, will be modeled
after the agency’s Hurricane Sandy Competitive Grant Program and will expand the
footprint of healthy ecosystems to deliver
valuable ecosystem services, including flood
attenuation and storm risk reduction, to
nearby communities.
The Budget strongly
supports USDA in its efforts to integrate climate considerations into existing programs
and to use programs to drive resilience. For
example, through its regional Climate Hubs,
the Department will provide information
and guidance to farmers, ranchers, and forest landowners on the latest technologies
and risk management strategies to help
them implement climate-smart tactics. This
effort is complemented by $89 million for
DOI’s WaterSMART program, which promotes water conservation initiatives and
technological breakthroughs.
• Drought Resilience.
• Wildland Fire Resilience. The Administra-
tion is committed to ensuring that adequate
funds are available to fight wildland fires,
protect communities and human lives, and
implement appropriate land management
activities to improve the resiliency of the Nation’s forests and rangelands. To accomplish
this, the Budget proposes to establish a new
budget framework for wildland fire suppression, similar to how other natural disasters
are funded. The Budget proposes a base
funding level of 70 percent of the 10-year average for suppression costs within the discretionary budget cap. A cap adjustment would
then be used for only the most severe fire
activity, which comprises one percent of the
fires, but 30 percent of the costs. This framework minimizes the adverse impacts from
transferring funds from other programs, reduces fire risk, and allows landscapes to be
managed more comprehensively.
• Federal Emergency Management Agency
(FEMA) Pre-Disaster Mitigation Grant Program. The Budget provides $200 million
for FEMA’s Pre-disaster Mitigation Grant
Program, an increase of $175 million over
current funding levels. This funding will
predominately support mitigation planning,
facilities hardening, and nonstructural risk
reduction measures, such as buyouts and elevation of structures. Studies on mitigation
activities conclude that Americans save $3$4 for every dollar invested in pre-disaster
mitigation.
• Climate Resilience Toolkit. The President’s
Budget provides $20 million to continue expanding and improving the recently-released
online Climate Resilience Toolkit, which provides scientific tools and information to help
Tribes, communities, citizens, businesses,
planners, and others manage their climaterelated risks and opportunities, and improve
their resilience to extreme events. Through
this online Toolkit, interested parties can access a variety of tools and data streams to
help them understand how certain changes
in environmental conditions—such as sea
level rise and flooding, or droughts and wildfires—may impact their communities.
• On-the-Ground Partnership with Local Com-
munities. The Budget provides $4 million to
support a Resilience Corps pilot program at
the Corporation for National and Community Service. This pilot program will support
roughly 200 AmeriCorps members to assist
communities in planning for and addressing
the impacts of climate change. The Budget
also includes $2 million for NOAA to train
the Resilience Corps members. In addition
to standing up a new Resilience Corps, the
Budget also scales up on-the-ground programs that are already at work—such as the
Corps of Engineers’ Silver Jackets—by providing $31 million for the Corps of Engineers
to provide local communities with technical
and planning assistance regarding the development and implementation of nonstructural approaches to manage and reduce flood
risk. The Budget also provides a total of $50
million, a $40 million increase, for American Indian Tribes and Alaska Native Villages and new funding totaling $7 million
for Insular Areas (including territories and
freely associated states) for understanding,
THE BUDGET FOR FISCAL YEAR 2016
23
Federal Budget Exposure to Climate Risk
The global climate is changing and is projected to continue to change over this century and beyond. 1 Climate
change impacts—such as rising sea level and more frequent and intense extreme weather events—will
increasingly strain the Federal budget. The ability of policymakers to make smart investment decisions and
to steward the Federal budget over the long term is increasingly dependent on understanding the Federal
Government’s exposure to climate risks.
The Federal Government has broad exposure to escalating costs and lost revenue as a direct or indirect
result of a changing climate. For a number of Federal programs, existing climate-related expenditures can be
identified. Over the last decade, the Federal Government has incurred over $300 billion in direct costs due to
extreme weather and fire alone, including the following:
•
$179 billion for domestic disaster response and relief related to extreme weather. Models
demonstrate that climate-driven changes, such as higher sea levels and changes in hurricane
activity, are likely to magnify damages and associated disaster response and relief needs. 2
•
$24 billion for flood insurance. While the National Flood Insurance Program is designed to offset
losses with premium collections, the program accrued approximately $24 billion in debt to the U.S.
Treasury over the last decade. Losses per policy are expected to grow due to climate change. 3
•
$61 billion for crop insurance. The Federal Government’s total exposure for crop insurance is
currently about $110 billion, up from $67 billion in 2007. Climate-driven increases in extreme
weather events such as drought and excessive moisture are expected to exacerbate the costs of
crop insurance.
•
$34 billion for wildland fire management. Climate change is contributing to an increase in wildfire
frequency and intensity across the western United States and Alaska. 1
•
Health care. The effects of climate change will increase risk of asthma attacks and other respiratory
illnesses, extreme heat exposure, the spread of infectious diseases, and flood-related health
hazards. Already, the United States is spending billions of dollars in Medicaid expenses related to
asthma each year.
•
Federal property management. Federal facilities are directly at risk from the kinds of extreme
weather events associated with climate change. For example, a military installation in the
Southwest incurred $64 million in damages due to unusual torrential downpours. Another military
facility in Alaska will incur $25 million in costs to bolster its seawall and runway against rising seas
and thawing permafrost.
•
National security. National security agencies expect that climate change effects worldwide will
drive overseas conflict and associated costs for military and humanitarian operations.
•
Species decline and loss. Climate change is expected to fundamentally alter ecosystems in ways
that are costly to those systems and the people who depend upon and value them. While some
species may be able to move to more suitable climates, others may be unable to and could be
driven to extinction. As populations decline due to the impacts of existing stressors—such as
habitat loss—coupled with climate change, the number of species needing Federal protection and
1 Melillo, Jerry M., Terese (T.C.) Richmond, and Gary W. Yohe, Eds., 2014. Climate Change Impacts in the United States: The Third
National Climate Assessment. U.S. Global Research Program, 841 pp. doi:10.7930/J0Z31WJ2
2 Kopp, Robert, and Solomon Hsiang, 2014: American Climate Prospectus. Economic Risks in the United States. Rhodium Group,
LLC.
3 AECOM, 2013. The Impact of Climate Change and Population Growth on the National Flood Insurance Program through 2100.
Prepared for Federal Emergency Management Agency
24
INVESTING IN AMERICA’S FUTURE
the costs of Federal species recovery efforts will likely increase. For example, climate change has
already brought on a mismatch between the life cycle of the Edith’s checkerspot butterfly and the
timing of the flowering plants it depends on, causing the butterfly’s population to crash along its
southern range.
Current projections estimate that unabated climate change would cost the global economy over four percent
of global GDP each year by 2100. 4 Such economic losses would translate into lost revenue for the U.S.
Government. While the extent of this lost revenue in 2100 is highly uncertain—it could be as much as 0.7
percent of U.S. GDP. 5 For reference, such a loss in 2014 would translate into over $120 billion in lost revenue
for the Federal Government.
How we respond to one of the most significant long-term challenges that the Nation and our planet faces
speaks volumes about our values. It speaks to who we are as policymakers—if we embrace the challenge of
developing pragmatic solutions. It speaks to who we are as Americans—if we seize this moment and lead. It
speaks to who we are as parents—if we take responsibility and leave our children a safer planet.
The President has set the United States on an ambitious course to tackle emissions and prepare the Nation’s
communities for the effects of climate change because he not only believes that we have a moral obligation to
do so, but also because climate action is an economic and fiscal imperative.
See Analytical Perspectives, Federal Exposure to Climate Risk chapter for more detail.
4 Contribution of Working Group II to the Fourth Assessment Report of the Intergovernmental Panel on Climate Change. Parry,
M.L., O.F. Canziani, J.P. Palutikof, P.J. van der Linden, and C.E. Hanson (eds.). Cambridge University Press, Cambridge, United
Kingdom.
5 Based on 2014 receipts as a share of GDP, estimated by OMB (17.3 percent).
planning for, and implementing actions that
support community resilience in the face of a
changing climate.
Investing in the Green Climate
Fund and Leading International
Efforts to Cut Carbon Pollution and
Enhance Climate Change Resilience
The President’s Climate Action Plan also calls
for leadership abroad. To support this objective,
the Budget provides $1.29 billion, a significant
increase above the 2015 enacted level, to advance the goals of the Global Climate Change
Initiative (GCCI) by supporting important multilateral and bilateral engagement with major
and emerging economies. This funding includes
$500 million for U.S. contributions to the new
Green Climate Fund (GCF), which will help developing countries leverage public and private
finance and invest in reducing carbon pollution
and strengthening resilience to climate change.
By reducing the most catastrophic risks of climate change, the GCF will help promote smart,
sustainable long-term economic growth and preserve stability and security in fragile regions of
strategic importance to the United States. These
investments will build on the best practices and
lessons learned from the Climate Investment
Funds. The United States expects that the GCF
will become a preeminent, effective, and efficient
channel for climate finance. More broadly, GCCI
funding enables the United States to provide international leadership through the Department
of State, the U.S. Agency for International
Development (USAID), and the Department of
the Treasury to expand clean and efficient energy use, to reduce emissions from deforestation
and forest degradation and conserve the world’s
remaining tropical rainforests, to phase down
chemicals with high global warming potential,
and to support the poorest and most vulnerable
25
THE BUDGET FOR FISCAL YEAR 2016
communities in their efforts to cope with the
adverse impacts of severe weather events and
climate change.
Maintaining the Nation’s
Natural Resources
American forests are a critical resource for
the economy. They support thousands of timber and forest product jobs, recreation, hunting
and fishing, and help to clean the air we breathe
and water we drink. However, in the face of a
changing climate and increased risk of wildfire,
drought, and pests, the Nation’s forests are under increasing pressure and their future health
and the jobs they support are at risk. Moreover,
pressures to develop forest lands for urban or agricultural uses also contribute to the decline of
forest health. Investments in conservation and
sustainable management and working lands can
help to ensure the forest landowners and dependent communities have sustainable, forest-based
economic development opportunities. Such investments also have the benefit of helping to
improve soil and water quality, reduce wildfire
risk, and otherwise manage forests to be more
resilient in the face of climate change. That is
why the Budget invests $83 million, an increase
of $13 million over the 2015 enacted level, for
the Forest Inventory and Analysis program to
deliver landscape scale survey data in all 50
States, including initial surveys and data collection in interior Alaska, to foster terrestrial carbon
conservation and retention in land and natural
resource management.
Improving the Farm Safety Net
through Common Sense Reforms
In the last 15 years, the Crop Insurance program has evolved from a small program with
minimal participation to one of the main pillars
of farm support. Overly generous benefits have
almost eliminated the risk in farming at a cost
to taxpayers in the billions. The Budget includes
reforms that are designed to reduce the distorting aspects of the program while maintaining its
place as an insurance program and a key component of the farm safety net. Specifically, the
Budget proposes to reduce the subsidy for the
premium on the harvest price protection revenue
insurance, and tighten the prevented planting
crop insurance rules saving an estimated $16
billion over 10 years.
BUILDING A 21ST CENTURY INFRASTRUCTURE
When we build roads, bridges, ports, communications networks, municipal water systems, and
other infrastructure, we are not just putting construction workers and engineers to work—we are
also revitalizing communities, protecting public
health and safety, connecting people to jobs, empowering entrepreneurs, and making it easier
for American businesses to export goods around
the world. There is certainly enough work to
do, with $2 trillion in deferred maintenance on
the Nation’s infrastructure. Built by far-sighted
investment over generations, America’s worldclass infrastructure is falling behind the rest of
the world. As other nations have sought to compete economically by improving infrastructure,
U.S. investment lags behind many of its overseas
competitors. In the most recent World Economic
Forum rankings, the United States had, in less
than a decade, fallen from 7th to 18th overall in
the quality of its roads. Building a durable and
reliable 21st Century infrastructure creates good
jobs that cannot be outsourced and will provide American workers and businesses with the
transportation and communication networks
they need to help grow the economy. The Budget
includes significant investments to repair the existing infrastructure and build the infrastructure
of tomorrow in smart, efficient, and cost-effective
ways.
Long-Term Investments in
Upgrading America’s Transportation
Infrastructure
To spur economic growth and allow States and
localities to initiate sound multi-year investments, the Budget includes a six-year, $478 billion
surface transportation reauthorization proposal.
26
INVESTING IN AMERICA’S FUTURE
By reinvesting the transition revenue from progrowth business tax reform, the President’s plan
will ensure the health of the Highway Trust Fund
for another six years—two years beyond the 2015
Budget GROW AMERICA proposal—and invest in
a range of activities to spur and sustain long-term
growth. The President’s plan to rebuild America
will increase spending to repair and modernize
the Nation’s highways and bridges, as well as injecting much needed investment into the existing
transit and intercity passenger rail systems. The
President’s plan also increases investments to ex-
The Case for Investing in Infrastructure in Today’s Economy
The Budget proposes to invest in infrastructure through a comprehensive six-year surface transportation
reauthorization proposal, as well as tax incentives for State and local infrastructure investment, a new
Infrastructure Bank, and other initiatives. The Federal Government plays a vital role in infrastructure investment,
and the Nation’s roads, bridges, and other surface transportation infrastructure systems are badly in need
of upgrades and repairs. For example, 65 percent of America’s major roads are rated in less than good
condition and one quarter of U.S. bridges need rehabilitation, replacement, or significant maintenance and
repair to remain in service or do not meet current design standards and traffic needs. Although the economic
recovery has begun to accelerate, the economy is still operating below capacity, and interest rates remain at
very low levels. While infrastructure investment will continue to be needed even after the economy reaches full
employment, time is running out to make these needed investments under ideal economic conditions.
A recent study published by the International Monetary Fund (IMF) 1 makes a convincing case that “the time is
right for a strong infrastructure push” in advanced economies such as the United States. While infrastructure
is critical for economic efficiency and growth, the private sector often fails to make sufficient investment in
infrastructure for several reasons, such as positive externalities, large start-up costs, and economies of scale.
Thus, in many cases, the public sector can provide infrastructure more efficiently.
Public infrastructure investment promotes economic growth by boosting aggregate demand in the short run and
improving economic efficiency in the long run. While infrastructure needs to be financed, the IMF study presents
statistical evidence that—under the right conditions—the combination of short- and long-term economic gains
from infrastructure investment can offset much of its cost. When many workers are unemployed, infrastructure
investment increases total employment, as opposed to bidding workers away from other sectors, thus increasing
aggregate demand.
The U.S. economy still has unused capacity. While the unemployment rate has declined significantly and
more workers are holding full-time jobs, nearly four percent of the workforce is still working part time for the
lack of full-time work, and unemployment rates in the construction sector remain higher than in the economy
as a whole. Moreover, the Federal Government remains able to borrow at very low interest rates, with the 10year Treasury rate ending 2014 below two and a half percent. While the Budget proposes to offset the cost
of its new infrastructure investments, it would front-load the investments and pay for them over the 10-year
budget window. This pro-growth approach has the potential to realize both the short- and long-term gains from
investing in infrastructure, with no risk of higher long-run debt.
The IMF study also highlights the importance of choosing high-efficiency infrastructure projects based on
rigorous benefit-cost analysis. The United States has a pent up supply of badly needed infrastructure projects
that meet these tests, and the President’s surface transportation plan would result in larger share of funds being
allocated through competitive processes.
1 International Monetary Fund, 2014, “Is It Time for an Infrastructure Push? The Macroeconomic Effects of Public Investment,” in
World Economic Outlook: Legacies, Clouds, Uncertainties.
27
THE BUDGET FOR FISCAL YEAR 2016
pand new transit projects, link regional economies
by funding the development of high-performance
rail, and support American exports by improving
goods movement within the Nation’s freight rail
networks. Small businesses particularly depend
on the quality of transportation networks to get
goods to market competitively, allowing them to
win customers, expand operations, and hire new
employees. To help spur innovation and economic
mobility, the reauthorization proposal would permanently authorize the competitive TIGER grant
program to support projects that bring job opportunities to communities across the United States.
The proposal would also advance the President’s
Climate Action Plan by building more resilient
infrastructure and reducing transportation emissions by responding to the greater demand and
travel growth in public transit. Also, to make
sure that Americans are driving vehicles that
are safe to operate, the reauthorization proposal
includes additional resources for investigating
automobile defects, improving data collection
to better support Government oversight of auto
manufacturers, and making changes to hold auto
manufacturers more accountable for reporting
and responding to vehicle defects.
Infrastructure Permitting
To further accelerate economic growth and
improve the competitiveness of the American
economy, the Administration is taking action to
modernize and improve the efficiency of the Federal
permitting process for major infrastructure projects. In May 2014, the President announced a
comprehensive interagency plan with 15 reforms
to turn best practices into common practice. To
implement this plan, the 2015 Budget proposed
a new Interagency Infrastructure Permitting
Improvement Center housed at the Department
of Transportation to lead the Administration’s
reform efforts across nearly 20 Federal agencies
and bureaus. While waiting for the Congress to
act, the Administration set-up an interim interagency team to support reforms, such as moving
from separate, consecutive reviews to synchronized, simultaneous reviews. For example, the
U.S. Coast Guard, the Corps of Engineers, and the
Department of Transportation have launched a
new partnership to synchronize their reviews for
transportation and other infrastructure projects,
such as bridges that cross navigation channels.
By developing one environmental analysis that
satisfies all three agencies, project timelines can
be significantly reduced. Building on these efforts, the Budget supports an expanded, publicly
available Permitting Dashboard that tracks project schedules and metrics for major infrastructure
projects, further improving the transparency and
accountability of the permitting process. To accomplish these goals, the Budget proposes $4
million for the Department of Transportation to
expand the Federal Infrastructure Permitting
Dashboard and fund staff to lead interagency
reforms that accelerate progress and improve
outcomes. In addition, the Budget includes $4
million for permitting reforms through a proposal to expand interagency transfer authorities,
which would institutionalize capacity to address
cross-agency management improvements. The
Budget also includes additional funding to expedite the consultations required pursuant to the
Endangered Species Act, which also will help accelerate permit review timeframes.
Build America Investment Initiative
The Budget includes support for the Build
America Investment Initiative (BAII), a
Government-wide, interagency initiative to increase infrastructure investment and promote
economic growth by supporting public-private
collaboration in major infrastructure sectors such
as transportation, water, and telecommunications. As part of the BAII, the Administration has
launched investment centers to provide States
and municipalities with assistance on securing
investment in transportation, water systems, and
rural infrastructure. Together, these centers will
facilitate direct private investment in U.S. infrastructure and encourage greater public-private
collaboration. For example, as part of the BAII,
the Department of Transportation established
the Build America Transportation Investment
Center to serve as a one-stop-shop for cities and
States seeking to use innovative financing and
partnerships with the private sector to support
transportation infrastructure. An Interagency
28
Infrastructure Finance Working Group, cochaired by the Secretaries of the Treasury and
Transportation, delivered recommendations to the
President on how to promote awareness and understanding of innovative financing and increase
effective public-private collaboration. Building
on those recommendations, the Administration
has worked with the private sector to launch
two additional investment initiatives that will
help leverage existing investments in drinking
water and wastewater infrastructure and other
infrastructure such as hospitals, schools, local
and regional food systems, and broadband expansion throughout rural America. Other Federal
agencies are also focusing on using existing
authorities to increase the private sector’s participation in the financing of public infrastructure.
In addition, the Budget proposes to create a new
America Fast Forward Bond program that, like its
Build America Bond precursor, will provide State
and local governments with an optional taxable
bond alternative to traditional tax-exempt bonds.
The Federal Government will share in the cost of
these bonds so they are as affordable to issuers as
tax-exempt bonds, proceeds of which can be used
to further finance governmental capital projects.
Launching the National Parks
Centennial Initiative
For 100 years, National Park Service (NPS)
parks and historic sites have preserved and
shared America’s cultural and historical identity.
These places present America’s unique history
and draw tourists from across the United States
and around the world. There is an opportunity
to celebrate the centennial anniversary of the
Nation’s great parks by providing enhanced park
services for visitors, and through targeted investments to improve NPS facilities. This opportunity
is an historic effort to upgrade and restore national parks, while putting tens of thousands of
Americans to work and engaging and inspiring
younger generations to carry the Nation’s parks
into the future.
The Budget proposes $860 million in mandatory and discretionary funding to allow NPS,
over 10 years, to make targeted, measurable, and
INVESTING IN AMERICA’S FUTURE
quantifiable upgrades to all of its highest priority non-transportation assets and restore and
maintain them to good condition. Addressing
the critical needs of these assets avoids deterioration and costs for future generations. The
Budget also proposes matching funds to leverage private donations for signature projects and
programs at national parks. This significant effort ensures America’s national treasures will be
preserved over the next hundred years for future
generations.
The 1916 Act that created NPS called for parks
to be left “unimpaired for the enjoyment of future
generations.” The Parks Centennial seeks to live
up to this call by providing more opportunities for
children to interact with natural areas. This targeted effort involves transporting over a million
urban youth a year to national and public lands
with dedicated youth coordinators to welcome
them and their families. Today’s investment in
the next generation of visitors will help build the
stewards of America’s national treasures in the
future.
This year also marks the 50th anniversary of
the Voting Rights Act, which the Budget commemorates by proposing $50 million to restore
and highlight key sites across the United States
that contributed to the struggle for civil rights.
This includes investments in specific NPS sites
associated with the 1950s and 1960s civil rights
movement, such as the Selma to Montgomery
National Historic Trail, Little Rock Central High
School National Historic Site, Brown v. Board of
Education National Historic Site, and the Martin
Luther King, Jr. National Historic Site. State,
local, and tribal governments can also apply for
historic preservation funds to help them document and preserve stories and sites associated
with the struggle.
Smart Investments in Federal Facilities
Investing in the Nation’s federally-owned
facilities ensures that mission execution is optimized at the lowest possible cost. Funding
reductions in recent years have led to facility
deterioration, as well as missed opportunities
29
THE BUDGET FOR FISCAL YEAR 2016
to consolidate and reduce operating costs. The
General Services Administration (GSA) is leading the Federal effort to both invest in Federal
facilities and consolidate space to reduce costs
and optimize efficiency, saving tens of millions in
annual lease costs. The Budget will invest more
than $2.5 billion in GSA’s Federal facilities portfolio, an increase of more than $1.1 billion over
the enacted level. GSA will invest $1.25 billion in
construction and acquisition priorities, including
the next phase of the consolidated Department of
Homeland Security Headquarters and the first
phase of a Civilian Cyber Campus. GSA will also
invest more than $900 million in critical repairs
and alterations and consolidation activities. The
National Aeronautics and Space Administration
and the USDA Forest Service will eliminate operating costs by demolishing unneeded facilities.
The Smithsonian Institution and DOI will make
necessary investments to improve the condition
of facilities and reduce operational costs. The
Budget invests $60 million to continue renovations of USDA headquarters, and $206 million
for the Agricultural Research Service to renovate and construct its facilities. The Budget
also invests $1.5 billion for construction projects
at the Department of Veterans Affairs (VA), an
increase of nearly $500 million over the 2015 enacted level. These investments will enhance the
Department’s mission while providing opportunities for long-term savings, as building upgrades
and renovations result in a reduced footprint.
Government-wide, agencies will continue their
efforts to reduce their space in accordance with
the Administration’s goal to reduce the Federal
footprint. In total, the Budget provides an additional $2.4 billion in capital investment funding
over the 2015 enacted level.
HIGH-QUALITY, AFFORDABLE EDUCATION: FROM PRE-K TO COLLEGE
America’s education system led the world in
the 20th Century—we sent generations to college,
and cultivated the most educated workforce in the
world, which supported an unparalleled period of
economic growth and rising middle class incomes.
Since then, other countries have followed our lead
to develop globally competitive education systems.
America must lead the world in education once
again. That requires both reform and investment,
and the Budget does both—investing in what
works to improve student outcomes. The Budget
provides $70.7 billion in discretionary funding for
Department of Education programs, an increase of
$3.6 billion from the 2015 enacted level.
Significant progress has already been made
toward improving educational opportunities.
By tying investments to evidence-based reforms
and focusing on improving student outcomes, the
Administration has worked with States across
the Nation to raise their learning standards,
improve teacher effectiveness, and use data to
ensure students graduate from high school prepared for college and a successful career. These
investments have given teachers, school districts,
and States the tools to turn around some of the
Nation’s lowest-performing schools. We are also
on our way to connecting 99 percent of students
to next-generation broadband in the classroom
through the ConnectED initiative. Progress is
being made on the President’s goal to prepare
100,000 excellent math and science teachers.
Last year, U.S. elementary and middle school students had the highest mathematics and reading
scores on record. The high school graduation rate
is above 80 percent for the first time in history.
More students have been helped to afford college through grants, tax credits, and manageable
loans, and today more people are graduating from
college than ever before. Further, 1.3 million veterans have been sent to college on the Post-9/11
GI Bill.
Tremendous progress has been made in education, but we still have work to do to make sure
we are again leading the world with highlyskilled workers who are able to compete in the
global economy and are ready for the jobs of tomorrow. The Budget proposes to do that through
improving access to early education; preparing
elementary and secondary education students for
success; increasing access to quality, affordable
higher education; and continuing to build the
30
evidence base for what works to improve student
outcomes.
Improving Access to High-Quality,
Affordable Early Education
Providing children with access to high-quality,
early education enables them to start kindergarten ready to succeed and to realize their full
potential. Researchers have established that
supporting children during this critical stage
yields benefits that far outweigh the costs of the
investment. This is particularly true for low-income children, who often start kindergarten far
less prepared than their peers.
Preschool for All. The Budget maintains support for the President’s landmark Preschool for
All proposal to ensure four-year-olds across the
Nation have access to high-quality preschool programs. The proposal establishes a Federal-State
partnership to provide all low- and moderate-income four-year-olds with high-quality preschool,
while providing States with incentives to expand
these programs to reach additional children from
middle class families, and put in place full-day
kindergarten policies. The proposal is paid for
through an increase in tobacco taxes that will
help reduce youth smoking and save lives. To
lay the groundwork for this proposal, the Budget
provides $750 million for Preschool Development
Grants, a substantial increase of $500 million
from the 2015 enacted level. The Department of
Education’s Preschool Development Grants are
currently helping 18 States develop and expand
high-quality preschool programs in targeted communities. The Budget also provides $907 million
for early intervention and preschool services for
children with disabilities, an increase of $115 million from the 2015 enacted level. This proposal
includes $15 million for a pay-for-success initiative for early identification of and intervention
for learning and developmental delays, with a potential focus on autism, intended to help identify,
develop, and scale-up evidence-based practices
through innovative public-private partnerships
that create incentives for service providers to deliver better outcomes.
INVESTING IN AMERICA’S FUTURE
Head Start. The Budget makes historic
investments in the Department of Health and
Human Services’ Head Start program by providing more than $1.5 billion in additional funding
over the 2015 enacted level, including $650
million to expand access to high-quality early
learning settings for tens of thousands of additional children through Early Head Start and
the Early Head Start-Child Care Partnerships.
The increased Head Start funding will also ensure that children are served in programs that
operate for a full school day and a full school
year, which recent research shows promotes
better outcomes for young children. In addition,
the Budget invests $15 billion over the next 10
years to extend and expand evidence-based, voluntary home visiting programs, which enable
nurses, social workers, and other professionals
to work with current and expecting parents to
help families track their children’s development, identify any health and development
issues and connect them to services to address
them, and utilize good parenting practices that
foster healthy development and early learning.
As with Preschool for All, the proposal is paid
for through an increase in tobacco taxes. The
program builds on research showing that home
visiting programs can significantly improve
maternal and child health, child development,
learning, and success. As discussed below under Supporting Working Families, the Budget
also makes historic investments in expanding
access to quality, affordable child care. This
investment is designed to meet two important
purposes—help parents afford child care so they
can work and help children access quality care
that can support their healthy development.
Preparing all Students for Success
in College and Careers
States and school districts have made significant progress toward expanding opportunity so
that all children can meet rigorous, college- and
career-ready standards and graduate from high
school prepared to succeed in a globally competitive economy. Forty-eight States and the District
of Columbia have raised standards for learning
in their schools and are supporting the hard
THE BUDGET FOR FISCAL YEAR 2016
work of teachers to enable their students to succeed. Parents, educators, and communities have
joined together to transform low-performing
schools and embark on a new day of learning for
students. School districts are making important
strides to connect students to high-speed broadband that will facilitate personalized instruction
and link them to a world of learning beyond the
classroom. The signs of progress are clear—the
high school graduation rate is the highest on record and students are making academic gains.
Yet there is a long way to go to ensure that all
students, particularly those who are the most
disadvantaged, are ready to compete in a global
economy.
Title I. The Budget proposes a $1 billion increase from the 2015 enacted level for Title I, the
Department’s largest K-12 grant program and
the cornerstone of its commitment to supporting
low-income schools with the funding necessary
to provide high-need students access to an excellent education. In addition, the Budget proposes
$100 million to support districts that are using
their Federal formula funds for evidence-based
interventions, and includes a pilot opportunity
for districts that distribute funds to schools more
equitably to receive relief from Federal reporting and fiscal requirements. The Budget also
includes increases for programs that help other
students who face academic hurdles meet rigorous academic standards, including $11.7 billion
for special education, an increase of $175 million
over 2015 funding, and $773 million for English
learners, an increase of $36 million.
Support for Teachers. The Budget invests
$3 billion in discretionary funding to provide
broad support for educators at every phase of
their careers, from ensuring they have strong
preparation before entering the classroom, to
pioneering new approaches to help teachers succeed in the classroom and equipping them with
tools and training they need to implement college- and career-ready standards. Recognizing
the importance of integrating technology into the
classroom, this investment includes $200 million for an improved Education Technology State
Grants program focused on providing educators
31
with training and support to maximize the impact of expanded access to technology to provide
high-quality instruction to students.
The Budget also proposes a companion initiative funded at $1 billion annually for five years
in mandatory funding that will support State
and local efforts to attract more of the best and
brightest to the teaching profession and prepare
them for the demands of the classroom, while also
creating a culture of excellence and professional
growth for teachers throughout their careers.
Improving the Nation’s High Schools.
The Budget establishes a new $125 million
competitive program to promote the redesign
of America’s high schools by integrating deeper
learning and student-centered instruction, with
a particular focus on science, technology, engineering, and mathematics (STEM)-themed high
schools that expand opportunities for girls and
other groups underrepresented in STEM fields.
The Budget also invests $556 million, a $50
million increase over the 2015 enacted level, in
School Improvement Grants, to expand the use
of evidence-based approaches to turning around
the Nation’s lowest performing schools, including
high schools with unacceptably low graduation
rates.
Replicating Successful Charter School
Models. The Budget proposes $375 million for
charter schools, a $122 million increase over the
2015 enacted level. This investment includes a
significant emphasis on replicating and expanding those charter schools and models that have
been shown to significantly improve educational outcomes for disadvantaged students to new
areas in need of high-quality schools.
Building
Evidence
and
Fostering
Innovation. The Budget funds the Investing
in Innovation program at $300 million, a $180
million increase over the 2015 enacted level, to
develop and test effective practices and provide
better information to States and districts on
what works in key areas such as implementing
college- and career-ready standards, using data
to inform instruction and personalize learning,
32
and improving low-performing schools. Across
every dimension, the Budget continues the
Administration’s efforts to build a much stronger
evidence base on what works in education.
Strengthening Opportunities for Native
Youth. The Budget supports a comprehensive
redesign and reform of the Bureau of Indian
Education (BIE) to provide students attending BIE-funded schools with a world-class
education, transforming that agency to serve
as a capacity-builder and service-provider for
Tribes in educating their youth. Investments in
the Budget for DOI include funding to: improve
opportunities and outcomes in the classroom;
provide improved instructional services and
teacher quality; promote enhanced language
and cultural programs; enhance broadband and
digital access; rebuild schools and improve school
infrastructure and facilities; and provide grants
to incentivize creative solutions to school transformations. The Budget also supports new Native
Youth Community Projects at the Department of
Education, to provide funding in a select number of Native communities that would support
culturally relevant, coordinated strategies to improve the college-and-career readiness of Native
children and youth.
INVESTING IN AMERICA’S FUTURE
America’s higher education system that make
two years of college free for responsible students,
ensuring affordable, high-quality community college options for students seeking occupational
training or a stepping stone to a four-year degree;
and a simpler, better targeted tax system that
helps families pay for college. But affordability is
not enough. Colleges also need to help students
from all backgrounds, including disadvantaged
and academically underprepared students, to
persist and ultimately succeed. A number of
leading colleges and States have already begun
to successfully meet these challenges and demonstrate what is possible—the Budget builds on
these lessons and the steps the Administration
has already taken to improve higher education
access, affordability, and quality.
Delivering a Quality, Affordable College
Education to Millions of Americans
Investing in Pell Grants. Over the course of
this Administration, the maximum Pell Grant for
working and middle class families has gone up
by more than $1,000, to nearly $5,800 in award
year 2015-16, and the Budget will continue the
President’s commitment to college affordability
by ensuring that Pell Grants keep pace with inflation. The Budget also proposes strengthening
academic progress requirements in the Pell Grant
program and provides a College Opportunity and
Graduation Bonus to successful schools, to ensure
that students make progress toward completing
their degrees.
Today, more than ever, Americans need more
knowledge and skills to meet the demands of a
growing global economy. A college education
opens the door to opportunity—for individuals
and, in turn, for the Nation as a whole. That is
why the President is committed to making a college education affordable and accessible and to
undertaking reforms that improve quality and
performance, ensuring that the United States
once again leads the world in college completion,
as it did a generation ago. This effort requires
a multi-pronged strategy that includes a strong
Pell Grant Program that expands opportunity for
low- and moderate-income students; a student
loan program that helps students and families
make sound financial choices and ensures student debt stays manageable; key investments in
Making Two Years of Community College
Free for Responsible Students and Strengthening the Quality of Community Colleges.
The Budget includes a new proposal to ensure all
Americans have the opportunity to pursue and
succeed in higher education, with a goal of making
two years of college as universal as high school.
The new grant program will provide funding to
States that agree to waive tuition and fees at
community colleges for eligible students, increase
their own investment by matching the Federal
funds, and undertake a set of reforms to improve
the quality of community colleges. In addition,
the Budget includes $200 million to create a postsecondary American Technical Training Fund
within the Career and Technical Education program, which would create or expand job-training
33
THE BUDGET FOR FISCAL YEAR 2016
programs with strong employer partnerships to
provide accelerated training in in-demand fields.
also supports improvements to the loan programs
to ensure that borrowers can make sound choices.
Making the Tax System Simpler and
More Effective at Supporting Families and
Students. The Budget proposes to expand, simplify, and better target education tax benefits,
building on the Administration’s success in creating the American Opportunity Tax Credit.
Using Evidence to Improve Higher
Education. Through a $200 million investment in the First in the World program, a $140
million increase over the 2015 enacted level,
the Administration will scale-up promising
evidence-based practices that aim to improve
college affordability, persistence, and completion
for more of America’s students and families. The
Budget also includes an additional $20 million
for innovative, evidence-based approaches in the
TRIO programs.
Making Student Loans Work for Students.
The Budget continues to propose reforms to PayAs-You-Earn, an income-based repayment option,
to ensure that the program is well-targeted while
making student loan payments manageable. It
WALL STREET REFORM
When the President took office in 2009, financial markets were in a tailspin. The crisis left
millions of Americans unemployed and resulted in
trillions in lost wealth. America’s broken regulatory system was the principal cause of that crisis.
To ensure financial stability for Americans and
businesses, the President fought to reform Wall
Street, ultimately signing a bill that represented
the most sweeping financial regulatory legislation since the Great Depression. Since that time,
Americans are getting back to work and regaining lost equity in their homes. But there is still
work to do to protect American consumers and
investors, and maintain fairness in the financial
system.
In response to the destabilizing 2008 financial
crisis, the Administration achieved landmark
reform of the Nation’s financial system in 2010
with enactment of the Dodd-Frank Wall Street
Reform and Consumer Protection Act (Wall
Street Reform). In the years since enactment,
Federal agencies have helped make home, auto,
and short-term consumer loan terms fairer
and easier to understand for average consumers, improved visibility for investors into the
shadowy corners and complex instruments
of financial markets, and increased financial
firms’ planning for and resilience to future financial downturns. The Budget continues to
support Wall Street Reform implementation
across agencies, including $1.7 billion for the
Securities and Exchange Commission and $322
million for the Commodity Futures Trading
Commission (CFTC), representing increases
over the 2015 enacted level of 15 percent and
29 percent, respectively. These are the only
two Federal financial regulators whose budgets
are set through annual appropriations. The
Budget also reflects continued support for legislation to enable funding the CFTC through
user fees like all other financial regulators. The
Administration will continue to oppose efforts
to restrict the funding independence of the other financial regulators, including the Consumer
Financial Protection Bureau, and will fight other attempts to roll back Wall Street Reform.
To finish addressing the weaknesses exposed
by the financial crisis, the Government must
reform the housing finance system and move forward to wind down the Government-Sponsored
Enterprises (GSEs), which have been in conservatorship since September 2008. A bipartisan
bill developed in the Senate last year includes
many of the Administration’s key housing finance reform principles, including ensuring that
private capital is at the center of the housing finance system, and that the new system supports
affordable housing through programs such as the
Housing Trust and Capital Magnet Funds. The
President stands ready to work with Members
34
INVESTING IN AMERICA’S FUTURE
of Congress in both parties to enact common
sense housing finance legislation that embodies
these core principles. For additional discussion
of the GSEs, see the Credit and Insurance chapter in the Analytical Perspectives volume of the
Budget.
CREATING OPPORTUNITY AND SUPPORTING WORKING FAMILIES
The economy is growing and businesses are
creating a record number of jobs; but in order to
truly judge this economy as healthy, more must
be done to support America’s working families
and create opportunity for those striving to reach
the middle class. Too many Americans are working harder to get by, not feeling the effects of a
growing economy. In addition to creating jobs
by investing in manufacturing, R&D, and clean
energy development, and expanding opportunity
by investing in education from the early years
through college, support must also be provided
to the Nation’s working families and more opportunities provided for hardworking Americans to
get ahead. That is why this Budget invests in
a series of proposals to help ensure that if you
work hard and play by the rules, you can reach
the middle class and thrive in it.
Supporting Working Families
The Budget includes the following proposals to
support working families, and help them reach
their full potential in America’s growing economy.
Expanding Access to Quality Child Care
for Working Families. Research shows that
access to affordable, quality child care can increase parents’ employment and earnings, while
also promoting healthy child development. The
Budget invests $82 billion in mandatory funding over 10 years to ensure that all low- and
moderate-income working families with children
ages three or younger have access to quality, affordable child care. The Budget also provides a
$266 million increase in discretionary funding to
help States implement the policies required by
the new bipartisan Child Care and Development
Block Grant Act of 2014, and designed to improve
the safety and quality of care while giving parents the information they need to make good
choices about their child care providers. In addition, as described later, the Budget proposes to
expand tax credits that help middle class families
afford the cost of child care.
To help build a supply of high-quality child care
that meets the needs of today’s working families,
including those with non-traditional schedules,
the Budget also provides $100 million to States
and local communities to develop, implement,
and evaluate new, innovative models of providing care. These pilots will benefit low-income
working families by focusing on what they need
most—high-quality care that is available in their
community and during the hours they work.
Encouraging State Paid Leave Initiatives.
Too many American workers must make the
painful choice between caring for their families
and a paycheck they desperately need. While the
Family and Medical Leave Act allows many workers to take job-protected unpaid time off to care
for a new baby or sick family member, or tend to
their own health during a serious illness, millions
of families cannot afford to use unpaid leave.
A handful of States have enacted policies to offer paid leave, and the Federal Government can
encourage more States to follow their lead. The
Budget includes $2 billion for the Paid Leave
Partnership Initiative to assist up to five States
that wish to launch paid leave programs, following the example of California, New Jersey, and
Rhode Island. States that participate in the Paid
Leave Partnership Initiative would be eligible
to receive funds for the initial set up and benefit
costs of the program for three years. The Budget
also includes a $35 million State Paid Leave
Fund to provide technical assistance and support
to States that are still building the infrastructure
they need to launch paid leave programs in the
future.
Expanding Paid Family Leave for Federal
Employees. The United States is one of only a
THE BUDGET FOR FISCAL YEAR 2016
few countries (and the only industrialized country) that does not offer workers paid maternity
leave, although Federal workers do have access to
paid sick and annual leave. Evidence shows that
the availability of paid maternity leave increases
the likelihood that mothers return to their jobs
following the birth of a child, in addition to producing better outcomes for the infant. In order to
recruit and retain the best possible workforce to
provide outstanding service to American taxpayers, the Budget proposes legislation that would
offer Federal employees six weeks of paid administrative leave for the birth, adoption, or foster
placement of a child. In addition, the proposal
would make explicit the ability for mothers and
fathers to use sick days to bond with a healthy
new child. This proposal is part of a broader effort to expand the availability of paid family
leave for the Federal workforce, and establish a
Federal family leave policy that is on par with
leading private sector companies and other industrialized nations. The proposal complements
the President’s memorandum in January 2015,
directing agencies to offer advanced sick leave in
connection with the birth or adoption of a child,
foster care placement, or for other sick leave eligible uses, and requiring agencies to consider
providing access to affordable emergency backup
dependent care service.
Helping Families Care for Aging Relatives.
Families are the Nation’s primary provider of longterm care, but financial constraints, work and
family demands, and the challenges of providing
care can place great pressure on family caregivers. Caregiving responsibilities demand time and
money from families who too often are already
strapped for both. Paid leave policies can provide
an important support to workers with caregiving
responsibilities. The Budget provides $88 million
in additional resources for existing programs that
are providing critical help and supports to seniors
and caregivers, such as respite care, transportation assistance, and nutrition services. To ensure
the continued provision of high-quality and effective supports to older adults and caregivers,
the Budget also includes $35 million for these
programs to develop and disseminate evidencebased innovations. In 2015, the Administration
35
will host the sixth White House Conference on
Aging to recognize the importance of these, and
other key programs for older Americans, as well
as to look ahead on how to improve and advance
the quality of life for older Americans in the next
decade.
Maintaining Strong Support for Worker
Protections. The Budget includes nearly $1.9
billion for the Department of Labor’s (DOL) worker protection agencies, putting them on sound
footing to meet their responsibilities to defend
the health, safety, wages, working conditions, and
retirement security of American workers. The
Administration is also pursuing a combination
of executive and legislative actions to strengthen
these laws and their enforcement, so workers can
earn wages that will allow them to sustain their
families, be protected from discrimination, return
home safely at the end of a day’s work, and retire
with dignity. In the Budget, and through its administrative actions, the Administration:
• Supports Raising the Minimum Wage. In
a Nation as wealthy as the United States,
far too many workers are living below the
poverty line. Over the past 30 years, modest minimum wage increases have not kept
pace with the higher costs of basic necessities for working families. The Administration supports raising the minimum wage so
hard-working Americans can earn enough to
support their families and make ends meet.
Many companies, from small businesses to
large corporations, also see higher wages as
the right way to boost productivity, reduce
turnover, and increase profits. Raising the
minimum wage is good for workers, their
families, and for the economy. The President
took an important step in this effort by signing an Executive Order (EO) to increase the
minimum wage to $10.10 for those working
on new and replacement Federal contracts,
and the Administration recently issued regulations to implement the EO. The Administration is encouraged that 17 States and the
District of Columbia have passed increases
in their minimum wage since the President
called for a minimum wage increase during
his State of the Union remarks in February
36
INVESTING IN AMERICA’S FUTURE
2013. Those increases will benefit seven million workers. As the President continues to
encourage States, cities, and businesses to
act, he stands ready to work with the Congress to pass legislation to increase the minimum wage for the rest of the workforce as
soon as possible.
• Enhances Worker Safety and Protections for
Whistleblowers. The Budget provides almost
$990 million for the Occupational and Mine
Safety and Health Administrations (OSHA
and MSHA) to make sure workers are protected from health and safety hazards on the
job. In particular, the Budget provides additional resources to enhance safety and security at chemical facilities and improve response procedures when major incidents at
these sites occur. The Budget also bolsters
OSHA’s ability to enforce the more than 20
whistleblower laws that protect workers
from discrimination and retaliation when
they report unsafe and unscrupulous practices. The Budget also provides MSHA the
resources it needs to meet its statutory obligation to inspect every mine and address the
risks posed to miners by the Nation’s most
dangerous mines.
• Strengthens Penalties Against Employers
Who Jeopardize Workers’ Health, Safety,
Wages, and Retirement Security. Increased
enforcement resources are vital to improving compliance with the Nation’s labor and
employment laws and protecting American
workers. However, many of these laws lack
strong civil penalties, which can help deter
violations. The Budget proposes to strengthen several of the civil monetary penalties
that DOL collects. In addition, the Administration will act on recommendations made
by the Government Accountability Office
(GAO) and the Administrative Conference of
the United States by proposing to improve
the Federal Civil Penalties Inflation Adjustment Act, which was established to maintain
the deterrent effect of civil monetary penalties Government-wide through timely and
predictable inflationary adjustments, but
has fallen short because of its structure and
implementation.
Creating Pathways to High-Growth Jobs.
Last year, the Congress came together and passed
important improvements to the Nation’s job
training system with the bipartisan Workforce
Innovation and Opportunity Act. To build on
this progress, the Budget provides a $500 million
increase over the 2015 enacted level to support
in-person employment services for unemployed
workers to help them find a good job or the training or services to prepare for one. This investment
would reach the one-third of unemployment insurance beneficiaries who are most likely to run
out of benefits before getting reemployed, all
returning veterans who receive unemployment
benefits, and other displaced workers who come
into American Job Centers for help getting back
to work and onto a new career path. Evidence
suggests that these types of services are a costeffective intervention that get workers back
into jobs faster, and help employers to fill their
in-demand jobs.
For workers who need job training to get back
on their feet, the Budget provides $16 billion
over 10 years to double the number of workers
receiving training through the workforce development system. This training would focus on
industries that are expected to experience significant growth in the coming decades, such as
health care, energy, advanced manufacturing,
transportation and logistics, cybersecurity, and
information technology. The combination of intensive reemployment services and expanded
training opportunities will allow the workforce
system to provide a suite of services that helps
workers obtain stable, high-quality employment. To help improve the quality of training
programs and speed the development of credentials that have real labor market value, the
Budget provides $500 million for competitive
Industry Credentialing and Career Pathways
Grants including $300 million specifically targeted at information technology jobs to create
employer-validated credentials where they do
not yet exist, drive additional employer uptake
of existing credentials, and develop curriculum
and assessments that help individuals earn credentials. Building on the success of the Trade
Adjustment Assistance Community College
THE BUDGET FOR FISCAL YEAR 2016
and Career Training grants, the Budget includes $200 million to fund State expansion of
postsecondary programs based on defined competencies for high-demand jobs, with strong
employer partnerships. The Budget also looks
to the successful “learn-and-earn” approaches
of the Nation’s European counterparts, investing $2 billion to achieve the goal of doubling
Registered Apprenticeships across the United
States over the next five years. Apprenticeship
is a cost-effective pathway into the middle class.
According to DOL data, those who complete registered apprenticeship programs earn median
wages of over $50,000 and almost 90 percent
are employed after completion. The Budget
also provides $3 billion for the Connecting for
Opportunity initiative, which provides disconnected youth with additional summer and
year-round job opportunities and supports competitive grants to municipalities to reengage
these youth and create educational and workforce pathways for them.
The Budget also increases job training and
financial incentives for public housing residents to secure greater employment through the
Department of Housing and Urban Development’s
(HUD) Jobs-Plus program. The Budget provides
$100 million for Jobs-Plus to target assistance to
20,000 individuals, or approximately 15,000 more
than in 2015. This includes up to $15 million
to implement a demonstration of the Jobs-Plus
model in Indian Country. Jobs-Plus is an evidence-based program that has been shown to
boost annual incomes by $1,300 on average.
Promoting Responsible Parenthood by
Modernizing Child Support. The Administration is taking steps to modernize the child
support program, which touches the lives of one
in four American children and half of all poor
children. In 2014, the Administration proposed
the first comprehensive regulatory overhaul of
the child support program in years to ensure
that the enforcement tools are strong and effective. The Budget builds on this progress by
proposing a comprehensive package of legislative
reforms to complement executive actions, including a proposal to make sure more child support
37
reaches children rather than being retained by
the Federal and State governments to “pay back”
past assistance the child received.
Promoting Permanency, Safety, and WellBeing for Children and Youth in Foster
Care. On any given day, there are 400,000 children and youth in the Nation’s foster care system
with over 100,000 waiting to be adopted. As part
of the Administration’s efforts to provide support
for stable homes and strong support structures
for vulnerable children and youth, the Budget includes a package of proposals to help improve the
lives of children and youth in foster care and to
help them reach their full potential. The Budget
includes funding to provide preventative services
to vulnerable families and children to address
hardships early, keeping more children out of
foster care and with their families. In addition,
the Budget provides further support and funding
to promote family-based care for children with
behavioral and mental health needs to reduce
the use of congregate care and ensure it is used
only when necessary. The Budget also includes
funding for Tribes to build their child welfare infrastructure, and for tribal children and youth
removed from their homes to remain in their
communities.
Easing Access to Credit for Housing. As
the Nation’s housing market continues to improve, the Federal Housing Administration (FHA)
reduced the annual premiums new borrowers will
pay by half of a percent in January 2015. This action is projected to save new FHA homeowners an
average of $900 annually and spur 250,000 new
homebuyers to purchase their first home over the
next three years. Even with this premium reduction, the financial condition of FHA’s insurance
fund will continue to improve. The FHA actuarial
review issued in November found that the fund’s
economic value increased by $21 billion over the
past two years and the Budget projects that the
value will continue to grow by at least $7 billion
each year.
Supporting Tribal Nation-Building and
Opportunities for Native Youth. The United
States recognizes a unique Nation-to-Nation
38
relationship with each of the 566 federally
recognized Tribes. The Budget strongly supports tribal self-determination and Federal
treaty and trust responsibilities to Native
Americans. The Budget provides significant
increases across a wide range of Federal programs that serve Tribes, including education,
justice, health, infrastructure, stewardship of
land, water, and other natural resources, and
climate resilience, and supports a new “onestop” approach to improving access to Federal
programs and resources particularly focused on
youth. The Budget includes key investments to
support the launch of Generation Indigenous,
a Native youth initiative focused on removing barriers to success. This initiative will
take a comprehensive, culturally appropriate
approach to help improve the lives and opportunities for Native youth. Multiple agencies,
including DOI, the Department of Education,
HUD, the Department of Health and Human
Services (HHS), USDA, the Department of
Commerce (DOC), DOL, and the Department
of Justice (DOJ), are working collaboratively
with Tribes to implement education reforms
and address issues facing Native youth. The
Budget enhances this work through new and
increased investments, including: 1) $41 million at DOI to extend broadband internet and
computer access to all BIE-funded schools
and dormitories, with support from DOC’s
National Telecommunications and Information
Administration community broadband outreach program; 2) $10 million at HUD and
$8 million at DOI to address teacher housing
needs; 3) $50 million at HHS to provide youthfocused behavioral and mental health, and
substance abuse services; and 4) a new $50 million program at the Department of Education
to support community-driven, comprehensive
strategies to improve college and career-readiness of Native youth. These new investments
will build on current efforts to better coordinate and demonstrate results from across the
Federal Government to serve Native youth.
Equalizing Social Security Benefits for
Same-Sex Married Couples. The Budget proposes to amend the Social Security Act to ensure
INVESTING IN AMERICA’S FUTURE
all lawfully married same-sex couples will be eligible to receive Social Security spousal benefits,
regardless of where they live. Currently, if a legally married same-sex couple lives in a State
that does not recognize the marriage, these Social
Security benefits are unavailable under Federal
law. This means that for a couple that marries in
one State where same-sex marriage is recognized
and then moves to another State where it is not,
the protection that Social Security spousal benefits provides to families is unavailable. Under
this proposal, such married couples would have
access to these benefits.
Strengthening Retirement Security
As many as 78 million working Americans—
about half the workforce—do not have a
retirement savings plan at work. Fewer than
10 percent of those without plans at work contribute to a plan of their own. The Nation
needs to do more to help families save and
give them better choices to reach a secure retirement. The Budget includes the following
proposals that will guarantee that nearly every employee has access to an easy way to save
for retirement through their employer. These
proposals complement additional proposals,
discussed later in the chapter, that would
make saving easier for millions of Americans
by automatically enrolling workers without
employer-based retirement plans in Individual
Retirement Arrangements (IRAs) through payroll deposit contributions at their workplace,
and by providing tax incentives for small businesses to offer retirement plans, especially
with automatic enrollment.
Expanding Retirement Savings Options
for Long-Term, Part-Time Workers. Under
current law, just 37 percent of part-time workers
have access to a retirement plan, as compared to
74 percent of full-time private workers, in part
because employers are permitted to exclude parttime workers from a retirement plan they provide
for full-time workers. The Budget would make
employees who have worked for an employer at
least 500 hours per year for at least three years
eligible to participate in the employer’s existing
THE BUDGET FOR FISCAL YEAR 2016
plan. Employers would not be required to offer
matching contributions. This proposal would provide approximately one million individuals with
access to retirement plan coverage.
Encouraging State Retirement Savings
Initiatives. A number of States have been exploring options for creating automatic retirement
accounts for workers in the private sector who do
not otherwise have access to a workplace retirement plan. However, concerns about potential
conflicts with the Federal law that governs employee benefit plans have slowed those efforts. To
better support State efforts, the Budget sets aside
$6.5 million at DOL, along with waiver authority,
to allow a limited number of States to implement State-based automatic enrollment IRAs or
401(k)-type programs.
Promoting Retirement Savings Options
among Servicemembers. The Budget proposes
to remove the current statutory bar prohibiting
DOD and its armed services branches from automatically enrolling servicemembers in the Thrift
Savings Plan. Servicemembers would still have
the option to opt out at any point. This would
allow the branches to decide to automatically enroll certain groups of members by seniority or pay
grade, based on the branches’ judgment of which
members are the most interested in and likely to
benefit from auto enrollment.
A Place-Based Approach to
Expanding Opportunity
Too often in the past, innovative efforts to expand opportunity at the State and local level
have been stymied by a Federal Government acting too much like a “check the box” regulator and
not enough like a partner. In addition, Federal
programs too often focus only on the problems
in a community, while ignoring the assets on the
ground. This is especially true in communities
where limited local revenues and capacity make it
even more important for the Federal Government
to be a strong partner.
Recent research demonstrates that the opportunities and stressors surrounding children
39
in the community where they grow up can have
deep and lasting impacts on their educational
and economic outcomes—their ability to fulfill
their inborn potential. That inequality of opportunity in childhood is not just a moral failure, it
is also an economic failure for the Nation’s cities and America. Every year, the United States
incurs a half trillion dollar cost as a result of allowing millions of America’s children to grow up
in poverty. Most of these costs are obvious, such
as health care. But the single most harmful cost
is the lost productivity and potential of so many
children. Not only do young people lose when
they do not get a fair shot—we all lose.
As the President has said, “real progress does
not come from the top down, not just from the
government. It comes from people.” That is why
the Administration has made providing ladders
of opportunity to all a top priority and has taken a fundamentally different view of expanding
opportunity in distressed communities by: taking a comprehensive approach to community
revitalization instead of addressing problems in
isolation; working with local leaders to support
their vision for their communities; and embracing
creative new solutions to old problems, especially
in this fiscal environment.
The first step in this work is to ensure that
the Federal Government is working well across
agencies. The Administration’s economic mobility and security efforts have sought to increase
collaboration across the Federal Government,
serve as a better partner with communities, and
to direct resources where evidence suggests they
will be most impactful. By creating Federal programs that meet urban and rural communities
where they are, and Federal policies that respond
to the ways that people live, we can better meet
the demands of communities that are striving for
a better quality of life. To that end, the Budget
proposes to institutionalize the Administration’s
place-based approach to funding programs that
help create opportunity in communities across the
Nation. The Budget provides funding to support
more Federal agency field staff, who are wellversed in both the community’s needs and the
Federal resources that can address them, to serve
40
INVESTING IN AMERICA’S FUTURE
as community coordinators on the ground to help
those communities maximize the impact of assistance from all sources. In addition, the Budget
includes funding to accelerate the availability of
geo-coded Federal spending information, so communities and citizens can better understand the
Federal funds available to them and put them to
effective, prompt use.
Through initiatives such as the Strong Cities,
Strong Communities program, which strengthens
towns, cities and regions by growing the capacity
of local governments to develop and execute their
local vision and strategies, the Administration is
proposing holistic solutions to expand opportunity in the Nation’s most vulnerable communities.
The Budget increases the Administration’s placebased efforts through the following investments:
• The Upward Mobility Project. The Budget
proposes an Upward Mobility Project, which
will allow up to 10 communities, States, or
a consortium of States and communities
more flexibility to use funding from up to
four Federal programs for efforts designed
to promote self-sufficiency, improve educational and other outcomes for children, and
enhance communities’ ability to provide opportunities for families. Projects will have
to rely on evidence-based programs or be
designed to test new ideas, and will have a
significant evaluation component that will
determine whether they meet a set of robust
outcomes. The funding streams that States
and communities can use in these projects
are currently block grants—the Social Services Block Grant, the Community Development Block Grant, the Community Services
Block Grant, and the HOME Program—that
share a common goal of promoting opportunity and reducing poverty, but do not facilitate cross-sector planning and implementation as effectively as they could. The Budget
also provides $1.5 billion in additional funding over five years that States and communities can apply for to help support their Upward Mobility Projects.
• The Promise Zone Initiative. The Budget
supports the Administration’s Promise Zone
initiative, which targets communities of concentrated poverty and establishes partnerships between the Federal Government, local
communities, and businesses to create jobs,
increase economic security, expand educational opportunities, increase access to quality, affordable housing, and improve public
safety. Communities are chosen through a
competitive process, and each puts forward
a plan on how they will partner with local
business and community leaders to make
investments that reward hard work and expand opportunity. In exchange, the Federal
Government partners with these communities to help them secure the resources and
flexibility they need to achieve their goals.
The President announced the first five
Promise Zone communities in 2014, and will
designate an additional 15 Zones by the end
of calendar year 2016. The Budget also includes Promise Zone tax incentives to stimulate growth and investments in targeted
communities, such as tax credits for hiring
workers and incentives for capital investment within the Zone.
• Choice and Promise Neighborhoods. To sup-
port the President’s vision for Promise Zones,
the Budget also expands the Department of
Education’s Promise Neighborhoods program and HUD’s Choice Neighborhoods program, funding approximately 25 new Promise Neighborhoods and eight new Choice
Neighborhoods.
• Rural Initiatives. According to a 2014 report
by USDA’s Economic Research Service, rural
childhood poverty rates are at their highest
point since 1986—one in four rural children
live in poverty and deep poverty among children is more prevalent in rural areas (12.2
percent) than in urban areas (9.2 percent).
To help alleviate this growing disparity, the
Budget provides $20 million for demonstration projects to fight childhood poverty in
economically distressed rural areas through
targeted technical assistance investments
in housing, community facilities, small business, and infrastructure. The Budget includes $50 million to expand the Community
Facilities Grant Program to address ongo-
41
THE BUDGET FOR FISCAL YEAR 2016
Modernizing Unemployment Insurance and Improving Automatic Stabilizers
The Budget proposes a suite of reforms to modernize the Unemployment Insurance (UI) program, which provides
critical income support to those who are unemployed through no fault of their own. These reforms would
improve the solvency of State programs, reach more workers in need, strengthen the program’s connection to
work, and make the UI program more responsive to economic downturns.
The UI program is a key stabilizer during economic downturns. It provides an important safety net to workers
who lose their jobs, and helps the economy by allowing those workers to maintain economic activity. The
Budget proposes reforms to strengthen UI’s economic stabilization function. The current Extended Benefits
(EB) program, which provides up to 20 additional weeks of benefits in States with high and rising unemployment,
does not provide sufficient help during recessions because it provides too few weeks of additional benefits and
its triggers (which in most States are based on the insured unemployment rate) are not responsive enough. As
a result, the Congress passes ad hoc emergency UI programs that begin too late to provide the early stimulus
that could lessen the severity of a recession. The Budget proposes to fix this by creating a new permanent,
federally funded EB program that would respond quickly when State unemployment rates rise and provide
more robust Federal assistance. This new program would provide up to 52 weeks of additional federally funded
benefits, with the greatest number of weeks in States with higher unemployment rates. The proposal would
provide up to 13 weeks of additional benefits each time States hit certain unemployment rates triggers—at 6.5
percent, 7.5 percent, 8.5 percent, and 9.5 percent. Under the proposal, these threshold rates can be lower
in States where unemployment is increasing especially rapidly. This new program would ensure that the UI
program responds quickly to dampen the effects of recessions and provides a critical safety net for unemployed
workers in States where jobs are scarce.
For the UI program to be effective, it must be on a strong financial footing. Many States’ UI systems are
chronically underfunded, requiring them to borrow funds from the Federal Government to cover benefits during
the most recent downturn. Currently, 12 States have outstanding Federal loans, and 11 other States have
outstanding debt exceeding their trust fund balances, including borrowing from the private market. The Budget
proposes to improve system solvency by helping States rebuild their trust fund balances to repay their loans,
cover current benefits, and create reserves so they are better prepared for the next downturn. The Budget
accomplishes this by broadening the taxable wage base to equal average insured wages and reducing the
Federal unemployment tax rate to help States shore up their trust funds, while not raising Federal UI taxes.
Although the taxable wage base expansion would have the effect of raising State UI taxes, States would be free
to change their tax rate structures to offset this increase.
The Budget also proposes to modernize the UI system by improving its connection to jobs and making sure
benefits are available to more workers who need them. To do this, the Budget includes a UI modernization
fund that would provide incentive payments to States that adopt measures to expand both program eligibility
and work-based learning opportunities and training for unemployed workers. A State can receive incentive
payments if it adopts two measures that expand eligibility and two measures that improve connections to
training and employment. States that maintain these changes for at least four years would also receive a
bonus payment. The Budget also creates a $60 million fund to allow a consortium of States to modernize
their outdated UI information technology systems, which would improve administrative efficiency and help
businesses and workers interact more easily with the UI system.
ing needs and emerging priorities such as
Promise Zones, Energy Sector Transition, or
Strike Force Communities. These funds will
allow USDA to be responsive to new needs
in communities across rural American and
target them in a flexible way.
42
Strengthening Social Security and
Services for People with Disabilities
Social Security is indispensable to workers,
retirees, survivors, and people with disabilities,
and is one of the most important and successful
programs ever established in the United States.
Although current forecasts indicate that the combined Social Security Trust Funds can pay full
benefits until 2033, the Administration is committed to ensuring that the program is solvent
and viable for the American people, now and in
the future, and the President has laid out key
principles to achieve this objective. Any reforms
should strengthen retirement security for the
most vulnerable, including low-income seniors,
and should maintain robust disability and survivors’ benefits. The Administration will oppose
any measures that privatize or weaken the Social
Security system and will not accept an approach
that slashes benefits for future generations or reduces basic benefits for current beneficiaries.
To address reserve depletion of the Social
Security Disability Insurance (DI) Trust Fund,
the Budget proposes to reallocate existing
payroll tax collections between the Old-Age
and Survivors Insurance (OASI) and DI trust
funds while a longer-term solution to overall
Social Security solvency is developed with the
Congress. At various points over the course
of Social Security’s history, the Congress has
passed reallocation legislation as the need arose
for reallocating revenue from DI to OASI, and
vice versa. This proposed reallocation will have
no effect on the overall health of the OASI and
DI trust funds on a combined basis.
The Budget also includes initiatives to help
people with disabilities remain in the workforce.
It builds on the bipartisan support for these efforts in the Consolidated and Further Continuing
Appropriations Act, 2015, by providing new authority and $400 million in new resources for the Social
Security Administration (SSA), in partnership with
other Federal agencies, to test innovative strategies to help people with disabilities remain in the
workforce. The cost would be offset by a proposal
to better coordinate DI and Federal retroactive disability payments between SSA and the Office of
INVESTING IN AMERICA’S FUTURE
Personnel Management (OPM.) Early-intervention
measures, such as supportive employment services
for individuals with mental impairments, targeted incentives for employers to help workers with
disabilities remain on the job, and incentives and
opportunities for States to better coordinate services, have the potential to achieve long-term gains
in the employment and the quality of life of people
with disabilities, and the proposed demonstrations
will help build the evidence base for future program
improvements.
To address increasing wait times for a disability
appeal decision, the Budget proposes to increase
the hiring of Administrative Law Judges (ALJ).
SSA’s workloads continue to increase as the baby
boom generation enters its most disability-prone
years. The average wait time for a disability decision before an ALJ reached a record high of 18.5
months in August 2008. SSA was able to reduce
the wait time down to a 10-year low of 12 months
in 2011 and 2012, but due to funding constraints,
the wait time has begun to grow again and is
anticipated to rise above 16 months in 2015.
Currently there are over one million people waiting for a disability appeals hearing decision from
an ALJ. The Budget commits increased resources
to hire more ALJs. But resources alone will not
be enough. The process for hiring SSA ALJs has
not operated efficiently as is needed to fill vacancies even when funding is available. Therefore,
the Administration is creating a workgroup led
by the Administrative Conference of the United
States and OPM, along with SSA, DOJ, and the
Office of Management and Budget (OMB) to review the process of hiring ALJs and recommend
ways to eliminate roadblocks, which may include
proposing administrative reforms or legislative
changes.
To continue to strengthen the integrity and accuracy of Social Security, the Budget proposes to
establish a dependable source of mandatory funding in 2017 for Continuing Disability Reviews
(CDRs) and Supplemental Security Income
Redeterminations, which ensure that only those
eligible for benefits continue to receive them.
SSA estimates that each $1 spent on CDRs would
save the Federal Government $9. This proposal,
43
THE BUDGET FOR FISCAL YEAR 2016
Rates of Homelessness Among Veterans
Continue to Decrease
80,000
74,770
70,000
Homeless
Veterans
Sheltered
Veterans
Unsheltered
Veterans
65,645
60,769
60,000
55,779
49,933
50,000
43,437
40,033
40,000
35,143
34,909
31,333
30,000
25,612
25,626
20,870
20,000
10,000
2010
2011
32,048
2012
2013
17,885
2014
Source: Department of Housing and Urban Development. The 2014 Annual Homeless Assessment Report
to Congress, Part 1.
together with discretionary funding proposed for
2016, could produce net savings of $32 billion
over 10 years and reduce the current backlog of
906,000 overdue CDRs.
Ending Homelessness
In 2010, the President set ambitious goals to
end homelessness across the Nation, and since
then significant progress has been made. Major
cities have hit important milestones toward the
goals including New Orleans, Louisiana, which
has ended veteran homelessness, and Salt Lake
City, Utah and Phoenix, Arizona, which have ended chronic homelessness among veterans. Over
300 mayors, governors, and county executives
have committed to ending veteran homelessness in their communities through the Mayors
Challenge to End Veteran Homelessness.
The overall number of veterans experiencing
homelessness has declined by 33 percent—nearly
25,000 veterans—since 2010, and with continued
focus from Federal, State, and local partners, we
are on a path to end veteran homelessness by
the end of 2015. The Budget continues to make
investments to end chronic homelessness in
2017 and to make significant progress in ending
homelessness across all other populations. In addition to targeted increases in HUD’s Homeless
Assistance Grants, the Budget provides 67,000
new Housing Choice Vouchers to support low-income households, including families experiencing
homelessness; survivors of domestic and dating
violence; families with children in foster care;
youth aging out of foster care; and homeless veterans, regardless of their discharge status.
ENSURING SAFETY, FAIRNESS, AND COMMUNITY
TRUST IN THE CRIMINAL JUSTICE SYSTEM
The President has said that if anyone in the
American family feels they have been treated unfairly it is a problem for all Americans. That is
why the President is committed to ensuring the
criminal justice system is safe, fair, and trustworthy for all Americans. In addition to supporting
the enhancement of community policing practices
across the Nation, the Budget proposes to prioritize DOJ’s resources on criminals who pose the
most serious threats to American citizens’ safety,
support Federal reentry programs that help reduce recidivism, and combat violent extremism.
44
INVESTING IN AMERICA’S FUTURE
Implementing the Smart on Crime
Approach. The Administration continues to advance the DOJ’s Smart on Crime initiative, which
was announced in 2013, and designed to promote
fundamental criminal justice system reforms
that will improve public safety, save money, and
ensure the fair enforcement of Federal laws. The
strategy leverages prevention and reentry programs to reduce recidivism; focuses prosecutorial
resources on the most important law enforcement
priorities; ensures that punishments for low-level,
non-violent offenders are consistent with the offense; and strengthens protections for vulnerable
populations. The Budget supports this strategy
by providing additional funding for a dedicated
Prevention and Reentry Coordinator in each U.S.
Attorney’s office, while also expanding pre-trial
diversion programs, such as reentry and drug
courts, that ensure better and more just outcomes
for low-level offenders who deserve a pre-incarceration second chance. The Budget also includes
funding for research to evaluate the efficacy of
these programs using metrics that measure the
effects of the Smart on Crime initiative.
Community Policing Initiative.
The
President’s new Community Policing Initiative
aims to build and sustain trust between law enforcement and the people they serve. The Budget
provides $97 million to expand training and oversight for local law enforcement, increase the use of
body-worn cameras, provide additional opportunities for police department reform, and facilitate
community and law enforcement engagement in
10 pilot sites, with additional technical assistance
and training for dozens of communities and police
departments across the Nation.
Reentry Programs. Each year, more than
600,000 people are released from State and
Federal prison, while another nine million cycle
through local jails. Statistics indicate that more
than two-thirds of State prisoners are re-arrested
within three years of their release and half are
re-incarcerated. High rates of recidivism mean
more crime, more victims, and more pressure
on an already overburdened criminal justice
system. While we must remain vigilant when
fighting crime and ensuring the safety of the
Nation’s communities, there is a substantial and
increasing body of evidence showing that reentry
programs reduce recidivism by helping individuals transition to their community after they are
released. America’s Federal criminal justice efforts must also be smarter and more efficient
by focusing on prevention and reentry, because
whenever a recidivist crime is committed, communities are victimized and less safe; burdens
on law enforcement are increased; and alreadystrained resources are further depleted.
The Administration is committed to a comprehensive strategy to contain incarceration costs
over the long term by facilitating inmates’ transition into society in order to reduce recidivism
rates, increase public safety, and strengthen
communities. The Budget reflects these commitments and takes steps to address the cycle of
incarceration by investing additional resources in
the Bureau of Prisons’ (BOP) reentry programs.
These investments include $110 million to increase mental health staff, expand sex offender
treatment programs, and provide cognitive behavioral treatment and additional residential
reentry center beds. The Budget also provides
$5 million to support a new broader reentry program that reaches out to offenders’ children and
families to strengthen familial bonds, which are
critical for helping inmates transitioning back
home, and $20 million to award innovative reentry programs in BOP facilities. In addition,
through State and local assistance programs,
the Budget nearly doubles the investment in the
Second Chance Act Grant program to reduce recidivism and help those exiting the justice system
to rejoin their communities and lead productive
lives.
MAINTAINING THE NATION’S SECURITY
The President’s Budget includes $612 billion
of national defense discretionary funds, a $26
billion, or 4.5 percent, increase from the 2015
enacted level, to provide the resources needed
THE BUDGET FOR FISCAL YEAR 2016
to sustain the President’s national security and
defense strategies. The Budget reverses the decline in national defense spending of the past
five years and proposes to transition enduring
overseas contingency operations (OCO) costs to
the base budget, to fully fund and account for the
costs of keeping the Nation secure. Discretionary
national defense function spending has fallen
by 18 percent since 2010 as the military has
ended its ground combat missions in Iraq and
Afghanistan, and adjusted to the sequestration
cuts of 2013 and flat base budget funding levels
of 2014 and 2015. This spending—which comprises all base and OCO funding for DOD, as well
as funding for certain programs in DOE, DOJ,
and other Departments and agencies—peaked
in 2010 at $714 billion, and has since decreased
$128 billion, to the 2015 enacted level of $586 billion. Accounting for the effects of inflation, the
decrease over this period is even steeper, at 24
percent.
Part of the decrease reflects the declining
costs of OCO-funded operations in Iraq and
Afghanistan, as highlighted below. However,
sequestration also reduced the base budget significantly in 2013, and the Bipartisan Budget
Act essentially straight-lined the defense base
budget in 2014 and 2015. These levels required
sharp cuts to training, maintenance, and modernization. Combined with a continued demand for
U.S. forces to respond to emergent crises while
preparing for a widening spectrum of future challenges, reduced budgets contributed to degraded
levels of readiness throughout the military, and
delays in fielding equipment and technology that
will be critical for future security. Going forward,
defense base budgets at or near the sequestration
level would undermine the military’s capacity
and capability to respond to contingencies, deter aggression, project power, and decisively win
against potential adversaries—leaving it insufficiently prepared to protect and advance U.S.
interests.
The President’s Budget provides $561 billion in
base discretionary funding for national defense
(of which $534 billion is for DOD), which is $40
billion, or eight percent, above the 2015 enacted
45
level. The Budget makes strategic investments to
sustain and advance U.S. global leadership while
ensuring the Nation’s long-term fiscal health. It
provides for the training, maintenance, and support needed to restore military readiness over the
next several years, and for investment in recapitalization and modernization needed to ensure
America’s continued technological edge. Along
with these funding increases, the Budget provides
savings (detailed below) through critical reforms
that slow growth in compensation and divest unnecessary overhead, infrastructure, weapons, and
end strength. The Budget also increases outyear
projections for defense spending across the 2017
to 2020 period to accommodate select investments in key capabilities, such as space security,
nuclear deterrence, power projection, and intelligence, surveillance, and reconnaissance. These
targeted increases will further enhance the U.S.
military’s ability to execute the defense strategy
as the Nation continues to adapt to a changing
threat environment. The Budget presents a responsible alternative to current law, since risks
to the Nation would grow significantly if sequestration-level funding returns, if proposed reforms
are not accepted, or if uncertainty over budget
levels continues.
DOD’s OCO request is $51 billion, which is
$13 billion, or 21 percent, below the 2015 enacted
level. It provides the funding needed to combat
diverse terrorist groups, such as the Islamic State
of Iraq and the Levant (ISIL); to ensure a responsible transition in Afghanistan, where the United
States and international partners will train, advise, and assist Afghan-led operations; and to
counter Russia’s aggressive actions and reassure
allies and partners in Europe. The OCO budget
includes certain costs that will endure past these
current contingencies, and thus the Budget proposes to transition enduring OCO costs to the
base budget, as described later in this chapter.
The President’s Budget also provides $53.4
billion for the Department of State and Other
International Programs (State/OIP), including
$46.3 billion in base funding and $7.0 billion in
OCO, which is a $4.0 billion, or eight percent,
increase from the 2015 enacted level, exclud-
46
ing emergency Ebola funding. This funding will
make strategic investments that will help provide not only for a stronger and safer America,
but also for a more stable and prosperous world.
The Budget supports sustainable security and
shared prosperity at home and abroad through
critical investments in diplomacy and development, from life-saving humanitarian assistance
to counterterrorism programs aimed at defeating terrorist organizations. It provides strong
support for U.S. diplomatic personnel and facilities abroad, security partnerships, global
engagement, and development programs that
advance economic growth, health, education, and
democratic governance. The Budget advances
American leadership and engagement at a time
when diplomacy is most needed to confront the
many challenges facing the world today.
Advancing National Security Priorities
Degrading and Defeating ISIL and
Responding to the Syria Crisis. As part of the
U.S. effort to degrade and ultimately defeat ISIL,
support security and governance, continue efforts
in Iraq, support regional partners, and bring stability and promote the conditions for a negotiated
settlement to end the conflict in Syria, the Budget
proposes $8.8 billion in OCO funds for DOD and
State/OIP. ISIL poses an immediate threat to
Iraq, Syria, and American allies and partners
throughout the region as it seeks to overthrow
governments, control territory, terrorize local
populations, and attack the United States and
coalition partners throughout the world. The ongoing conflict in Syria also continues to threaten
regional stability and has displaced over 10 million people. The Budget provides funding for
military operations, diplomacy, governance, and
humanitarian and security assistance programs
to address these challenges. This includes $5.3
billion for DOD to continue Operation Inherent
Resolve, which includes conducting airstrikes,
collecting intelligence, as well as training, advising, and equipping the Iraqi security forces and
properly vetted members of the moderate Syrian
opposition. For State/OIP, the Budget provides
$3.5 billion to strengthen regional partners,
counter ISIL, provide humanitarian assistance,
INVESTING IN AMERICA’S FUTURE
and strengthen Syria’s moderate opposition to
advance the conditions for a negotiated political
transition.
Ensuring a Responsible Transition in
Afghanistan. The Budget continues to support
long-term national security and economic interests in Afghanistan and help sustain political,
economic, and security gains in the country as
the United States draws down its forces, assistance levels gradually decline, and the Afghans
assume greater responsibility for securing their
country. The Budget includes resources to reinforce Afghanistan’s security and development
by supporting military training and assistance,
as well as health, education, justice, economic
growth, governance, and other civilian assistance
programs necessary to preserve the gains of the
last decade, strengthen diplomatic ties with the
international community, and promote stability.
The Budget also facilitates the transition of the
U.S. military from a combat mission to a mission
of training, advising, and assisting the Afghan
National Security Forces and maintaining a
limited counterterrorism capability to continue
targeting the remnants of al Qaeda.
Countering
Russian
Pressure
and
Aggressive Action. In response to the Russian
Federation’s aggressive acts and attempts to constrain the foreign and domestic policy choices of
neighboring countries, the Budget includes proposals for political, economic, and military support
to NATO allies and partner states in Europe. To
increase resilience within the governments and
economies most targeted by Russian pressure, the
Budget provides an additional $117 million in foreign assistance funds directed specifically toward
countering Russian aggressive acts in Ukraine,
and $51 million for countering Russian pressure and destabilizing activities in Moldova and
Georgia. This assistance will support efforts to
bolster democracy and good governance, increase
the capabilities of security forces, strengthen the
rule of law and anti-corruption measures, and
promote European Union integration, trade, and
energy security. In addition, through a $16 million
investment in U.S. international media activities,
the United States will seek to engage vulnerable
THE BUDGET FOR FISCAL YEAR 2016
populations in periphery countries, expand U.S.
support to freedom of press and independent
journalism in the region, and advance America’s
foreign policy interests. Building on the $1 billion sovereign loan guarantee provided in 2014
and the forthcoming $1 billion sovereign loan
guarantee in 2015, the Budget includes funding
that could support an additional loan guarantee
providing up to $1 billion in financing in 2016, if
conditions warrant, to help Ukraine continue on
its path of economic recovery, reforms, and normalized access to international financial markets
in the wake of destabilizing Russian actions and
violations of Ukrainian sovereignty. To bolster
security and reassure NATO allies and partner states in Europe, the Budget provides $789
million to continue the European Reassurance
Initiative (ERI). ERI funding will enable the
Unites States to continue increased military exercises, training, and rotational presence in Europe,
enhance U.S. preparedness to reinforce NATO allies through the prepositioning of equipment, and
build the capacity of partner states in Europe to
operate alongside the United States and NATO
in strengthening regional security.
Strengthening Government-wide Efforts
to Combat Terrorism. The Budget provides
$2.5 billion for the Counterterrorism Partnerships
Fund to support a sustainable and effective approach for combating terrorism, with a focus on
enabling and empowering partners facing terrorist threats. The $2.1 billion proposed for DOD
would increase partner capacity-building, facilitate partner counterterrorism operations, and
enhance DOD’s counterterrorism activities. The
$390 million proposed for State/OIP would enable
the Department to bolster global counterterrorism partnerships, as well as address underlying
conditions conducive to terrorism.
Countering Violent Extremism.
The
Administration has developed a strategy to address recent domestic terror incidents and
the emergence of groups attempting to recruit
Americans to take part in ongoing conflicts in
foreign countries. As part of this effort, DOJ’s
Countering Violent Extremism (CVE) initiative is an Administration priority and supports
47
the United Nations’ efforts to address foreign
terrorist fighters. Additional resources are provided to support community led-efforts, including
$4 million to conduct research targeted toward
developing a better understanding of violent
extremism and advancing evidence-based strategies for effective prevention and intervention;
$6 million to support flexible, locally-developed
CVE models; $2 million to develop training and
provide technical assistance; and $3 million for
demonstration projects that enhance the ability of
law enforcement agencies nationwide to partner
with local residents, business owners, community
groups, and other stakeholders to counter violent
extremism.
Rebalancing to the Asia-Pacific Region.
The Budget supports the Presidential priority of
advancing security, prosperity, and human dignity across the Asia-Pacific region. Recognizing
that security in the Asia-Pacific region underpins regional and global prosperity, the Budget
aligns resources and activities to strengthen
U.S. alliances, to forge deeper partnerships
with emerging powers, and to pursue a productive relationship with China. Building on the
President’s successful November 2014 trip, the
Budget provides resources to help deepen U.S.
trade in the region as the United States leads
the way in negotiating the high-standard TransPacific Partnership with 11 countries in the
Asia-Pacific region, which will boost American
exports and create jobs at home by promoting
strong rules to protect labor, the environment,
and intellectual property. To promote universal and democratic values, the Budget expands
education and cultural exchanges and strengthens regional cooperation with organizations
such as the Asia-Pacific Economic Cooperation
forum and the Association of Southeast Asian
Nations. In pursuit of security cooperation, the
Budget enhances and modernizes U.S. defense
relationships, posture, and capabilities with a focus on maritime security. DOD funding remains
consistent with the priorities identified in the
2012 Defense Strategic Guidance and the 2014
Quadrennial Defense Review. To address security, development, and economic challenges, the
Budget prioritizes advancing regional and coun-
48
try capabilities. These investments are critical
to the Administration-wide effort to promote regional security and economic cooperation.
Investing in Adolescent Girls’ Education,
Safety, and Health. In collaboration with the
Office of the First Lady and building on ongoing
U.S. efforts that currently support more than a
million adolescent girls worldwide every year, the
Budget provides $250 million in new and reallocated funds to broaden opportunities for adolescent
girls around the world. This new, expanded Let
Girls Learn initiative—building on USAID’s initial funding and programs—will improve access
to quality education and health care, and help address violence and other barriers to education that
adolescent girls face. The Budget also continues
support for the President’s Emergency Plan for
AIDS Relief (PEPFAR) interventions to reduce
HIV infections in young women, and expands
USAID’s programs in support of adolescent girls’
education, including expanded investments in
educating adolescent girls in Afghanistan. These
and other investments will deepen the United
States’ commitment to adolescent girls, helping
girls and young women thrive and play a fuller
role in their respective societies and economies.
Maintaining Technological Superiority.
Technological superiority enables the United
States to project power to dangerous environments, defend against threats in all domains,
and continuously adapt, innovate, and prevail
as new threats arise. Maintaining this superiority is becoming increasingly challenging as
potential adversaries have accelerated their investments in modernizing their militaries, and
as disruptive technologies have proliferated, resulting in growing threats where U.S. access had
formerly been assured. The Budget makes needed investments in DOD and National Nuclear
Security Administration (NNSA) procurement,
and research, development, test and evaluation
(RDT&E) to address this challenge and maintain
technological superiority. Base budget funding
for DOD’s procurement and RDT&E accounts—
which took disproportionate reductions under
sequestration to achieve rapid savings in recent
years—and funding for NNSA increase to $190
INVESTING IN AMERICA’S FUTURE
billion, a $22 billion, or 13 percent, increase
compared to the 2015 enacted level. With this
funding, the Administration is prioritizing investments in cybersecurity; missile defense; nuclear
deterrence; space; precision strike; intelligence,
surveillance, and reconnaissance; and air and sea
capabilities for projecting power and operating in
denied environments. In addition, DOD recently
announced in November 2014, the establishment
of a broad, Department-wide initiative to pursue
innovative ways to sustain and advance U.S. military superiority for the 21st Century and improve
business operations throughout the Department.
The Defense Innovation Initiative will pursue
breakthrough technologies and new concepts of operations to enhance the U.S. military’s dominance
even as the diffusion of disruptive technology to
potential adversaries makes the future operating
environment more challenging. Scientific discovery and applied research are central to all these
efforts, and thus the proposed funding for DOD’s
RDT&E accounts includes $12 billion for science
and technology investments in areas including
quantum information science, cognitive neuroscience, nanoscience, synthetic biology, autonomy,
cybersecurity, and countering weapons of mass
destruction, among other investments.
Strengthening Space Security. Space capabilities are vital to U.S. national security and
the ability to understand emerging threats, project power globally, conduct operations, support
diplomatic efforts, and enable global economic
prosperity. It is also the shared interest of all
nations to act responsibly in space to help prevent mishaps, misperceptions, and mistrust. The
Budget supports a variety of measures to help
assure the use of space in the face of increasing
threats to U.S. national security space systems.
The Budget also supports the development of capabilities to defend and enhance the resilience of
these space systems. These capabilities help deter and defeat interference with, and attacks on,
U.S. space systems.
Addressing Cyber Threats. Cyber threats
targeting the private sector, critical infrastructure, and the Federal Government demonstrate
that no sector, network, or system is immune to
49
THE BUDGET FOR FISCAL YEAR 2016
Transitioning Overseas Contingency Operations Spending
Since 2001, the Nation has financed the incremental costs of overseas conflicts, primarily in Iraq and Afghanistan,
outside of the base budget. From 2001 to 2009 these funds were designated for the “Global War on Terror”
(GWOT), and from 2009 to the present these funds have been designated for “overseas contingency operations”
(OCO). Following the institution of statutory budget caps in the Budget Control Act of 2011, funding designated
as OCO/GWOT has remained flexible and separate from base budget constraints, which has enabled the
United States to fully fund wartime costs principally associated with these major combat operations.
As the U.S. combat mission in Afghanistan ends, it is time to reconsider the appropriate financing mechanism
for costs of overseas operations that are enduring. As the chart below shows, the Administration’s transitions
in Iraq and Afghanistan have resulted in a $129 billion, or 69 percent, reduction in OCO costs, from their
peak of $187 billion in 2008 to the Administration’s 2016 request for $58 billion. Beyond 2016, some costs
currently funded in the OCO budget will endure. The United States will continue to provide support to its Afghan
partners, counter terrorism abroad, maintain a strong forward presence in the Middle East region, and ensure
U.S. military forces are ready to respond to a wide range of potential crises. The Nation’s fiscal and defense
policies must fully plan and account for these costs, and the transition must be accomplished in a manner that
protects the defense strategy. Accordingly, early this year the Administration will propose a plan to transition
all enduring costs currently funded in the OCO budget to the base budget beginning in 2017 and ending by
2020. This plan will describe which OCO costs should endure as the United States shifts from major combat
operations, how the Administration will budget for the uncertainty surrounding unforeseen future crises, and the
implications for the base budgets of DOD, the Intelligence Community, and State/OIP. This transition will not be
possible if the sequester-level discretionary spending caps remain in place. The Administration continues to
support the replacement of sequestration with a balanced package of deficit reduction as described elsewhere
in the Budget.
BA ($ in billions)
200
Overseas Contingency Operations
Costs Continue to Decline
180
160
140
120
100
80
60
2016 Budget
Request
40
20
0
2001
2003
2005
2007
infiltration by those seeking to steal commercial
or Government secrets and property or perpetrate
malicious and disruptive activity. Addressing
2009
2011
2013
2015
these threats requires a comprehensive approach
that brings all elements of government together
with private industry, academia, and the public,
50
while also protecting individual privacy. The
Budget identifies and promotes initiatives and
priorities, including the deployment of intrusion
detection and prevention capabilities and enhancement of Government information sharing
capabilities with the private sector so that they
can be more vigilant and better protect themselves against emerging threats. It also makes
investments in cyber research and development
to strengthen U.S. cybersecurity defenses and
make cyberspace inherently more secure. In addition, the Budget includes funding to enhance U.S.
capabilities to respond to cyber threats and incidents once they have occurred, begin building a
civilian cyber campus to better share information
on cyber threats and incidents with those being
targeted, improve the ability to share evidence of
cyber-crimes with other nations, and maintain efforts to increase the Nation’s cyber workforce.
As cybersecurity challenges continue to impact Federal agencies, the protection of the
Government’s information and information systems has become critical to protecting national
infrastructure. The Budget funds key investments to enhance the Federal Government’s
cybersecurity posture. These include Continuous
Diagnostics and Monitoring of Federal systems,
the EINSTEIN intrusion detection and prevention system, and Government-wide testing and
incident response training to mitigate the impact
of evolving cyber threats. These resources will
allow the Government to more rapidly protect
American citizens, systems, and information from
cyber threats. Modernizing Military Compensation. The
Budget continues to provide a robust compensation and benefits system that honors the service
of the Nation’s men and women in uniform and
their families. For 2016, the Budget provides a
1.3 percent increase to basic pay, a 1.5 percent
increase in the Basic Allowance for Housing, and
a 3.4 percent increase in the Basic Allowance for
Subsistence. In addition, the Budget proposes to
modernize the TRICARE Program and continues
to pursue commissary operational efficiencies
and revenue generating enhancements. These
proposals will ensure that DOD continues to
INVESTING IN AMERICA’S FUTURE
recruit and retain a high quality All-Volunteer
Force, while addressing costs in a responsible and
balanced manner. In addition to these proposals,
the Administration looks forward to reviewing
the report from the Military Compensation and
Retirement Modernization Commission, and
working with the Congress to ensure a strong
and sustainable military compensation and
retirement system.
Promoting Defense Reforms. The defense
strategy depends on investing every dollar where
it will have the greatest effect, which the Budget
will accomplish through critical reforms that divest unneeded force structure, slow growth in
compensation, and reduce wasteful overhead. To
direct investments toward a ready, technologically
superior force, the military must shed unnecessary force structure now that ground combat
missions in Iraq and Afghanistan have ended.
Venerable weapons systems, such as the A-10
aircraft, have performed decades of service, yet
would now face survivability challenges against
a technologically advanced adversary. Therefore,
the Budget reproposes the retirement of this and
other systems, and directs the money saved toward investment in the most capable, versatile,
and survivable systems to perform their missions.
The Budget also reduces overhead and waste by
continuing the initiative to reduce DOD’s major
headquarters’ operating budgets by 20 percent,
pursuing acquisition reform through the Better
Buying Power initiative, and proposing another
round of Base Realignment and Closure (BRAC)
to free resources currently consumed by maintaining unneeded facilities. The need to reduce
unneeded facilities is so critical that, in the absence of authorization of a new round of BRAC,
the Administration will pursue alternative
options to reduce this wasteful spending.
Suitability and Security. It is critical to
the safe and effective operation of the Federal
Government to ensure that Federal employees
continue to be good stewards of sensitive information and worthy of the public trust their positions
require. In order to protect against threats from
individuals within the Government, and drive
increased efficiency of the security clearance
51
THE BUDGET FOR FISCAL YEAR 2016
processes, the Administration is pursuing several
reforms in the personnel security, suitability, and
credentialing mission space.
Following the Washington Navy Yard shooting, the President directed OMB to conduct a
comprehensive review of Federal procedures for
background investigations and security clearances. The Performance Accountability Council
delivered a Report to the President (120 Day
Report), which was approved in March 2014. The
Report established a set of recommendations to
increase the availability of critical information,
reduce risk inherent in the system, and increase
oversight and accountability. The Administration
established an interagency Program Management
Office focused on implementing the Report’s recommendations. The immediate and meaningful
progress to date includes:
• Continuous Evaluation. The Administration
is committed to shifting security and suitability evaluations to a continuous evaluations approach, allowing agencies to gather
real-time information that may be relevant
to these clearances. In the past year, initial
pilots have successfully demonstrated the effectiveness of more frequent investigations
of cleared personnel. The Budget provides
funding in DOD and the Office of the Director of National Intelligence to expand these
initial pilots and move to making “Continuous Evaluation” a Government-wide practice. While agencies transition to Continuous Evaluation, the Federal Investigative
Standards has already established a new
five-year re-investigation requirement for
all individuals with a security clearance.
• Improved Access to Law Enforcement Re-
cords. The National Defense Authorization
Act-mandated Records Access Task Force
report provided recommendations for improving information sharing among State,
local, and Federal law enforcement entities
when conducting background investigations.
The Budget continues to invest in improving agencies’ information technology (IT)
systems to enhance data sharing between
the Federal Government and State and local
entities.
• Access to Classified Information. The Direc-
tor of National Intelligence issued a requirement for all agencies to validate whether each
individual identified as eligible for access to
classified information still required eligibility. Through this process, the Administration achieved its objective to reduce the total
number of security-cleared individuals by 10
percent. This reduction will allow agencies to
better deploy resources to priority activities,
such as completing periodic reinvestigations
for the most sensitive populations.
Honoring America’s Commitment to
Veterans
The Budget includes $70.2 billion in discretionary 2016 resources for the Department of
Veterans Affairs (VA), a 7.8-percent increase
over 2015. The Budget also includes an advance
appropriation request of $63.3 billion for 2017
medical care, a 5.5-percent increase over the
2016 request. This funding will ensure continued investment in the five pillars the President
has outlined for supporting the Nation’s veterans: providing the resources and funding they
deserve; ensuring high-quality and timely health
care; getting veterans their earned benefits quickly and efficiently; ending veteran homelessness;
and helping veterans and their families get good
jobs, education, and access to affordable housing.
Implementing the Veterans Access,
Choice, and Accountability Act of 2014. On
August 7, 2014, the President signed into law
the Veterans Access, Choice, and Accountability
Act of 2014 (Veterans Choice Act). The Budget
supports implementation of the Veterans Choice
Act and the Administration’s goal of providing
timely, high-quality health care for the Nation’s
veterans. The Veterans Choice Act provided
$5 billion in mandatory funding to increase
veterans’ access to health care by hiring more
physicians and staff and improving VA’s physical infrastructure. It also provided $10 billion in
mandatory funding through 2017 to establish a
temporary program (Veterans Choice Program)
improving veterans’ access to health care by
52
INVESTING IN AMERICA’S FUTURE
allowing eligible veterans who meet certain
wait-time or distance standards to use health
care providers outside of the VA system. The
Veterans Choice Program provides a measure of
short-term relief from the pressure of escalating
health care requirements as current patients in
the VA system elect to receive their care through
the program. These investments, together with
the Budget request of $70.2 billion, will provide
authorities, funding, and other tools to enhance
service to veterans in the short term while
strengthening the underlying VA system to better serve veterans in the future. However, more
resources will be required to ensure that the VA
system can provide timely, high-quality health
care into the future. In the coming months, the
Administration will submit legislation to reallocate a portion of Veterans Choice Program
funding to support essential investments in VA
system priorities in a fiscally-responsible, budget-neutral manner.
Speeding the Processing of Disability
Compensation Claims. VA has made tremendous progress reducing the veteran disability
claims backlog. The Budget provides additional
funding to continue investment in the Veterans
Claims Intake Program and paperless claims,
helping provide faster and more accurate benefits claims processing decisions. The Budget
also includes funding to hire additional employees to address the growth in related claims and
improve the VA’s timeliness in resolving appeals.
Further, the Budget funds efforts to ensure consistent, personalized, and accurate information
about services and benefits, especially in the
delivery of compensation and pension claims
processing.
TAX REFORM THAT PROMOTES GROWTH AND OPPORTUNITY
A simpler, fairer, and more efficient tax
system is critical to achieving many of the
President’s fiscal and economic goals. At a time
when middle class and working parents remain
anxious about how they will meet their families’ needs, the tax system does not do enough
to reward hard work, support working families,
or create opportunity. After decades of rising
income and wealth inequality, the tax system
continues to favor unearned over earned income, and a porous capital gains tax system
lets the wealthy shelter hundreds of billions of
dollars from taxes each year. In a period where
an aging population will put increasing pressure on the Federal budget, a wide range of
inefficient tax breaks prevent the tax system
from raising the level of revenue the Nation
needs. While commerce around the world is
increasingly interconnected, an out-of-date,
loophole-ridden business tax system puts U.S.
companies at a disadvantage relative to their
competitors, while also failing to encourage investment in the United States.
The Budget addresses each of these challenges. It reforms and simplifies tax incentives
that help families afford child care, pay for col-
lege, and save for retirement, while expanding
tax benefits that support and reward work. It
pays for these changes by reforming the system of capital gains taxation and by imposing
a new fee on large, heavily-leveraged financial
firms. It raises revenue for deficit reduction by
curbing high-income tax benefits and closing
loopholes and reforms the business tax system to make it fairer and more pro-growth. It
also reinvests in the Internal Revenue Service
(IRS), reversing the sharp funding reductions
of recent years and improving customer service
and tax enforcement.
Supporting Middle Class and Working
Families through the Tax Code
The President’s tax proposals would simplify
and improve tax benefits that help middle class
families afford quality child care, pay for college,
and save for retirement, as well as tax benefits
that support work and keep millions of children
from growing up in poverty. The Budget also proposes the creation of a new “second earner” tax
credit benefiting middle-income couples where
both spouses work.
THE BUDGET FOR FISCAL YEAR 2016
Expanding Access to Affordable Child
Care. The cost of child care is a major barrier
to work for many parents, especially parents
of young children, and can put a real strain on
the budgets of working families. Through a
combination of tax credits and direct subsidies,
the Budget would make a major investment in
quality, affordable child care for infants and toddlers. Specifically, the Budget would triple the
maximum Child and Dependent Care Tax Credit
(CDCTC) for families with children under age five.
It would also make the full CDCTC available to
families with incomes of up to $120,000, benefiting families with young children, older children,
and elderly or disabled dependents. Meanwhile,
the Budget would eliminate tax preferences for
flexible spending accounts for child care expenses,
which are poorly targeted and complex, reinvesting the savings in the improved CDCTC. The
child care tax reforms would benefit 5.1 million
families, helping them cover costs for 6.7 million
children. They would complement a proposal, described above, to make direct child care subsidies
universally available for young children in lowerincome working families.
Simplifying and Improving Education
Tax Benefits. A significant portion of Federal
spending on higher education occurs through the
tax code. But navigating current higher education tax benefits is so complicated that the GAO
found that 27 percent of families who claimed
one benefit would have been better off claiming another, while 14 percent of eligible families
failed to claim any benefit at all. Higher education tax benefits also do not provide enough
help for low- and middle-income families that
struggle to afford college. Building on bipartisan congressional reform proposals, the Budget
proposes to simplify and better target higher
education tax benefits, including by consolidating six education tax benefits into just two. The
Budget would repeal or let expire duplicative and less effective provisions, including the
Lifetime Learning Credit, the tuition and fees
deduction, the student loan interest deduction
(for new borrowers), and Coverdell accounts (for
new contributions), and it would roll back a portion of the subsidy for 529 savings plan (for new
53
contributions). Meanwhile, it would make permanent and expand the American Opportunity
Tax Credit, including by indexing the maximum
credit amount for inflation, making the credit
available for a fifth year of higher education, providing a partial credit to part-time students, and
increasing the amount of the credit available to
low-income students without income tax liability. To help struggling borrowers, the Budget
would also eliminate tax on debt forgiven under
Pay-as-You-Earn or other income-based repayment plans. Overall, these reforms would cut
taxes for 8.5 million families and students and
simplify taxes for more than 25 million families
and students that claim education tax benefits.
Expanding Access to Workplace Savings
Opportunities. Workers with an easy way
to save for retirement through their employer
overwhelmingly do so, while tens of millions of
American workers without such access by and
large do not. Small business and part-time employees are especially unlikely to have access to
an employer retirement plan. The Budget proposes to automatically enroll workers without
access to employer-based retirement plans in
IRAs through payroll deposit contributions at
their workplace (with an option to opt out). This
proposal would give 30 million more workers
access to a workplace saving opportunity. The
Budget also proposes to expand the tax credits
available to small businesses who set up automatic enrollment IRAs, set up 401(k)s or other
employer plans, or start automatically enrolling
workers in their existing retirement plans.
Supporting Work and Addressing the
Challenges of Dual-Earner Couples. Two
earner couples face unique challenges in the
workforce. When both spouses work, the family
incurs additional costs: commuting; professional
expenses; child care; and increasingly, elder care.
On top of explicit Federal and State taxes, these
work-related costs can be quite burdensome and
can contribute to a sense that work is not worth
it. To address these challenges, the Budget proposes a new second earner credit of up to $500
for families where both spouses work. The new
credit would benefit 24 million couples.
54
Expanding the Earned Income Tax Credit
(EITC) for Workers without Children and
Non-Custodial Parents. The EITC is among
the Nation’s most effective tools for reducing
poverty and encouraging people to enter the
workforce. But because the EITC available to
them is so small, workers without children and
non-custodial parents miss out on these antipoverty and employment effects of the EITC. The
Budget would double the “childless worker” EITC
and make the credit available to workers with
earnings up to about 150 percent of the poverty
line. It would also expand eligibility to workers
age 21-24 and age 65-66, so that the EITC can
encourage employment and on-the-job experience for young adults, as well as to older workers,
harmonizing the EITC rules with ongoing increases in the Social Security full retirement age.
The proposal would directly reduce poverty and
hardship for 13.2 million low-income workers
struggling to make ends meet, and would encourage and support work.
Continuing EITC and Child Tax Credit
(CTC) Improvements that Benefit 16 Million
Working Families with Children. The Budget
starts from a baseline that makes permanent
the improvements to the EITC and Child Tax
Credit enacted in 2009 and extended in 2010
and 2013. The baseline also makes permanent
the American Opportunity Tax Credit, discussed
above. The EITC and CTC provisions benefit
16 million families with 29 million children and
have likely encouraged thousands of parents to
enter or remain in the workforce. In addition to
their direct effects in reducing poverty and supporting work, the EITC and the Child Tax Credit
have also been found to improve health and educational outcomes for the children whose families
receive them. For example, recent research suggests that the 2009 EITC and Child Tax Credit
expansions may have boosted college enrollment
by two to three percentage points for high school
seniors in eligible families.
INVESTING IN AMERICA’S FUTURE
Reforming Capital Gains Taxation,
Imposing a Fee on Large Financial
Firms, and Closing Tax Loopholes
Since the 1970s, income concentration in the
United States has surged. In the most recent
decade and for the highest income groups, much
of that surge resulted from growing concentration of capital income and wealth. Today, the top
one percent holds more than 40 percent of the
Nation’s wealth, and the top 0.1 percent holds
more than 20 percent—levels not seen since the
1930s. Meanwhile, the bottom 90 percent has lost
ground, with its share of wealth falling since the
mid-1980s, and its average wealth falling sharply
in the last decade.
A contributing factor in these shifts has been
falling tax rates on capital income. While the
fiscal cliff deal raised the total capital gains and
dividend tax rates to 23.8 percent for high-income
households, that is still well below tax rates on
earned income and tax rates on capital gains and
dividends in earlier decades. Meanwhile, current
rules let substantial capital income escape tax
altogether.
One of the largest holes in the existing system
is what is known as “stepped-up basis.” Under
current law, capital gains on assets held until
death are never subject to income taxes. Not
only do bequests to heirs go untaxed, but the basis of inherited assets is immediately increased
(“stepped up”) to the value at the date of death.
For example, suppose an individual bequeaths
stock worth $50 million to an heir, who immediately sells it. When purchased, the stock was
worth $10 million, so the capital gain is $40 million. However, the heir’s basis in the stock is the
$50 million when he inherited it—so he owes no
tax on the sale.
Each year, hundreds of billions in capital gains
escape income tax due to the non-taxation of gains
on bequests. Stepped-up basis perpetuates inequality of wealth and opportunity, since the vast
majority of the tax benefits accrue to the wealthiest of decedents and their heirs. It also creates a
more basic inequity. Retirees who need to spend
down their assets in retirement pay tax on their
THE BUDGET FOR FISCAL YEAR 2016
capital gains. But the small minority that can
afford to hold onto appreciated assets until death
can pass them onto their heirs tax-free.
The Budget would reform the taxation of capital income through two important changes. First,
it would increase the capital gains and dividend
rate to 28 percent (inclusive of the net investment
income tax), the rate at which capital gains were
taxed under President Reagan, for the highest-income households. Second, it would end stepped-up
basis by treating bequests and gifts as realization
events that would trigger tax liability for capital
gains. To ensure the proposal creates neither tax
nor compliance burdens for middle class families,
decedents would be allowed a $200,000 per couple ($100,000 per individual) exclusion for capital
gains income, along with a $500,000 per couple
($250,000 per individual) exclusion for personal
residences. Tangible personal property other
than art and similar collectibles (e.g., bequests or
gifts of furniture or other household items) would
also be excluded. In addition, family members
that inherited small, family-owned and operated
businesses would not owe tax on the gains unless
and until the asset were sold, and closely-held
businesses would have the option to pay tax on
gains over 15 years.
The proposed capital income reforms would
raise $208 billion over the first 10 years, with
larger revenue gains when fully implemented.
Not only is the proposal highly progressive, with
99 percent of the revenue coming from the top 1
percent, it would also improve the efficiency of
the tax system. By letting very wealthy investors
make their capital gains disappear for tax purposes at death, stepped-up basis creates strong
“lock-in” incentives to hold onto assets for generations, even when resources could be invested more
productively elsewhere. Eliminating stepped-up
basis would reduce lock-in and promote higher
productivity and growth by encouraging more efficient capital allocation.
The Budget would also impose a new fee on
large, highly-leveraged financial institutions.
55
Specifically, the Budget would raise $112 billion
over 10 years by imposing a seven basis point fee
on the liabilities of large U.S. financial firms—the
roughly 100 firms with assets over $50 billion.
This fee will complement other Administration
policies aimed at preventing future financial
crises and making the economy more resilient.
Even with the end of “too big to fail,” excessive leverage still creates risks for the broader economy.
Alongside capital requirements and other tools
that help rein in excessive leverage, a financial
fee would improve economic stability by attaching a direct cost to leverage for large firms. The
fee will also satisfy the statutory requirement for
the President to propose a means to recoup any
remaining costs of assistance provided through
the Department of the Treasury’s Troubled Asset
Relief Program.
The Budget would also close a number of inefficient, unintended, and unfair tax loopholes in the
individual tax code. For example, it would end
a loophole that lets some high-paid professional
avoid Medicare and Social Security payroll taxes,
costing the Trust Funds almost $10 billion a year
by the end of the decade. It would also prevent
wealthy individuals from using loopholes to accumulate huge amounts in tax-favored retirement
accounts. While tax-preferred retirement plans
are intended to help middle class workers prepare for retirement, loopholes in the tax system
have let some wealthy individuals convert these
accounts into tax shelters. The Budget would
prohibit contributions to and accruals of additional benefits in tax-preferred retirement plans
and IRAs once balances are about $3.4 million,
enough to provide an annual income of $210,000
in retirement.
The combination of the capital gains reform package, the financial fee, and closing tax
loopholes would pay for the pro-middle class, prowork tax reforms described above, as well as for
the complementary investments in child care access and quality, and for the Budget’s proposal to
partner with States to make community college
free for responsible students.
56
INVESTING IN AMERICA’S FUTURE
Making Sure Everyone Pays Their
Fair Share and Reducing the Deficit
As described in the first chapter, the President’s
Budget takes a number of steps to put the
Nation on a sound fiscal footing. Building on the
Affordable Care Act (ACA), it introduces additional health reforms that will help maintain the
historic slow-down in health care cost and price
growth over the last several years. It proposes
comprehensive immigration reform that reduces
deficits and strengthens Social Security, while
also boosting growth by raising productivity.
Even with proposed new investments, discretionary spending would still reach its lowest level on
record as a share of GDP.
But even with slower health care cost growth,
immigration reform, and spending restraint, an
aging population will put increasing pressures on
the budget over the next several decades. For example, by the end of the 10-year budget window
in 2025, the ratio of retirees to workers will be
almost 50 percent higher than it was at the beginning of the 2000s, and it will increase further over
the subsequent decade. Given these demographic shifts, the reality is that additional revenue is
needed to maintain the Nation’s commitments
to seniors without shortchanging investment in
future generations.
In addition to raising revenue to pay for tax
reforms that help middle class families and support work, as described above, the Budget would
also raise an additional $638 billion in revenue
for deficit reduction. Rather than obtaining
this additional revenue by raising tax rates, the
President’s tax reform proposals would reduce
the deficit by reforming tax breaks and closing
loopholes, making the tax code fairer, simpler
and more efficient. Specifically, the Budget
would:
• Limit the Value of Itemized Deductions and
Other Tax Preferences to 28 Percent. Currently, a millionaire who deducts a dollar of
mortgage interest enjoys a tax benefit that
is more than twice as generous as that received by a middle class family. The Budget
would limit the value of most tax deductions
and exclusions to 28 cents on the dollar, a
limitation that would affect only couples
with incomes over about $250,000 (singles
with incomes over about $200,000). The
limit would apply to all itemized deductions,
as well as other tax benefits, such as tax-exempt interest and tax exclusions for retirement contributions and employer-sponsored
health insurance.
• Observe the “Buffett Rule.” As in past years,
the Budget proposes to institute the Buffett
Rule, requiring that wealthy millionaires
pay no less than 30 percent of income—after charitable contributions—in taxes. This
proposal will act as a backstop to prevent
high-income households from using tax preferences to reduce their total tax bills to less
than what many middle class families pay.
Fixing America’s Broken Business
Tax System and Rebuilding Its
Infrastructure
In February 2012, the President proposed a
framework for business tax reform that would
help create jobs and spur investment, while eliminating loopholes that let companies avoid paying
their fair share. Consistent with that framework,
the Budget includes a reserve for long-run revenue neutral reform, while detailing a number
of specific proposals that the President believes
should be part of reform, including a detailed international tax reform plan that is new to this
year’s Budget.
Key features of the President’s plan include:
• Cutting the Corporate Tax Rate and Broad-
ening the Tax Base. The Budget would
lower the corporate tax rate to 28 percent,
with a 25 percent effective rate for domestic manufacturing, putting the United
States in line with major competitor countries and encouraging greater investment
here at home. The rate reduction would be
paid for by eliminating dozens of inefficient
tax expenditures and through additional
structural reforms—addressing accelerated depreciation and reducing the tax
preference for debt financed investment.
Together, these reforms would help achieve
THE BUDGET FOR FISCAL YEAR 2016
more neutral tax treatment of different industries, types of investment, and means
of financing, improving capital allocation
and contributing to economic growth.
• Improving Incentives for Research and Clean
Energy. The Budget would make permanent—and pay for—important research and
clean energy incentives that the Congress
routinely extends on a year-to-year basis, including the Research and Experimentation
Tax Credit, the Production Tax Credit, and
the Investment Tax Credit. It would also reform these incentives to make them simpler
and more efficient, for example by creating a
single formula for calculating the Research
and Experimentation Tax Credit and making the renewable energy Production Tax
Credit refundable so innovative, growing
firms can fully benefit.
• Simplifying and Cutting Taxes for Small
Business. The Budget includes new proposals to make tax filing simpler for small businesses and entrepreneurs so that they can
focus on growing their business rather than
filling out their tax returns. Building on
bipartisan proposals, the Budget would let
businesses with gross receipts of less than
$25 million—more than 99 percent of all
businesses—dispense with many of the tax
system’s most complex rules and instead pay
tax based on simpler, “cash” accounting. The
Budget would also permanently extend and
enhance Section 179 expensing to let small
businesses write off up to $1 million of investments in equipment up front, so that the
vast majority of firms would not have to deal
with depreciation rules. The net result is
that almost all small businesses would pay
taxes based on an income measure much
closer to their bank statement: deducting
their expenses—including funds reinvested
in their businesses—and paying tax based
on their cash flow profits.
• Reforming the International Tax System.
The Budget details the President’s full
plan for reforming and modernizing the
57
international business tax system. The
core of the President’s proposal is a 19
percent minimum tax on foreign earnings
that would require U.S. companies to pay
tax on all of their foreign earnings when
earned—with no loopholes or opportunities
for deferral—after which earnings could
be reinvested in the United States without additional tax. Other proposals in the
international reform plan would prevent
U.S. companies from avoiding tax through
“inversions”—transactions in which U.S.
companies buy smaller foreign companies,
then reorganize the combined firm to reduce U.S. tax liability—and prevent foreign
companies operating in the United States
from using excessive interest deductions to
“strip” earnings out of the United States
and avoid U.S. tax. The Department of the
Treasury has taken initial steps to reduce
the economic benefits of inversions, but the
President has been clear that the only way
to fully address the issue of inversions is
through action by the Congress, preferably
as part of broader tax reform.
• Devoting One-Time Savings from Interna-
tional Reform to Investment in Infrastructure. As part of transitioning to a reformed
international tax system, the Budget
would impose a one-time transition toll
charge of 14 percent on the up to $2 trillion of untaxed foreign earnings that U.S.
companies have accumulated overseas. As
explained above, the Budget would devote
the one-time revenue from this toll charge
to the Highway Trust Fund, financing the
President’s six-year Surface Transportation Reauthorization proposal.
Devoting one-time transition revenue to infrastructure investments is both pro-growth
(see above, The Case for Investing in Infrastructure in Today’s Economy) and fiscally responsible, since—unlike using this
temporary revenue for permanent tax cuts
or spending increases—devoting it to onetime investments will not increase longterm deficits.
58
INVESTING IN AMERICA’S FUTURE
Investing in a High-Performing Internal
Revenue Service
Middle class families and small businesses
deserve a simpler tax system. But they also deserve an IRS with the resources to answer the
phone when they call, promptly issue new guidance clarifying laws and regulations, and ensure
that those who try to cheat the system are held
accountable. Likewise, reforms to the business
and—especially—international tax system depend on an IRS that is capable of going toe-to-toe
with high-paid tax lawyers and accountants to
enforce the law and make sure corporations, the
wealthiest, and ordinary American workers all
play by the same rules.
Unfortunately, congressional Republicans
have insisted on cutting the IRS budget by
about 10 percent since 2010 (adjusted for inflation), severely compromising both customer
service and enforcement. The Budget would reinvest in taxpayer services, as well as other IRS
responsibilities. Specifically, the Budget’s $12.9
billion investment in the IRS would greatly improve services for taxpayers, including through
investments for digital services that will fundamentally change how taxpayers interact
with the IRS, such as by creating new online
tax filing status and payment options. It also
makes investments for the IRS to adequately
and fairly administer the tax code. More than
$650 million of the Budget’s IRS total is provided through a program integrity cap adjustment
for tax enforcement activities that return six
times their value in increased revenue.
FIXING AMERICA’S BROKEN IMMIGRATION SYSTEM
On November 20, 2014, the President announced a series of executive actions to begin to fix
the Nation’s broken immigration system. These
executive actions crack down on illegal immigration at the border; prioritize deporting felons,
not families; and allow certain undocumented
immigrants who register and pass criminal and
national security background checks to start paying their fair share of taxes and temporarily stay
in the United States without fear of deportation.
These actions are only a first step toward reform
of the system, and the Administration continues
to count on the Congress for the more comprehensive reform that only legislative changes can
provide.
The comprehensive reform supported by the
President and passed by the Senate in 2013
would fix the Nation’s broken immigration system by continuing to strengthen U.S. border
security, cracking down on employers who hire
undocumented workers, modernizing the Nation’s
legal immigration system, and providing a pathway to earned citizenship for hardworking men
and women who pay a penalty and taxes, learn
English, pass background checks, and go to the
back of the line.
In addition to contributing to a safer and more
just society, comprehensive immigration reform
will also boost economic growth, reduce deficits,
and strengthen Social Security. Common sense
immigration reform will strengthen the workforce by attracting and retaining the best and
brightest students whom are trained at U.S. universities, strengthening capital investment and
overall productivity, and increasing the number of
entrepreneurs starting companies in the United
States, thereby creating more jobs. Moreover,
by adding younger workers to the labor force,
reforming America’s broken legal immigration
system will help balance an aging population and
improve the economic and budget outlook as the
baby boom generation retires.
The Congressional Budget Office has estimated that the immigration bill that passed
with bipartisan support in the Senate would reduce the deficit by about $160 billion in the first
decade and by almost $1 trillion over 20 years.
Meanwhile, the Social Security Actuaries have
found that the Senate bill would reduce the
Social Security shortfall by $300 billion over the
first 10 years and would close eight percent of the
75-year Social Security shortfall.
59
THE BUDGET FOR FISCAL YEAR 2016
The Administration supports the bipartisan
Senate approach taken in 2013, and calls on the
Congress to act on comprehensive immigration
reform this year. While the President’s executive
actions will provide temporary relief while demanding accountability for those whose cases are
not an enforcement priority, the Administration
urges the Congress to act to permanently fix the
Nation’s broken immigration system.
Addressing the Root Causes of
Migration from Central America
The President’s Budget provides $1 billion to
support a long-term, comprehensive strategy for
Central America to minimize the pressures of
illegal immigration on the United States. The
Budget will enable concrete progress toward
achieving the President’s priority of advancing
security, prosperity, and economic growth in the
region. The Budget provides resources to focused
lines of effort that will take on the root causes
of the dangerous migration of unaccompanied
children and families, where Central American
migrants are extremely vulnerable to becoming
victims of violent crime or sexual abuse along
the journey. These lines of effort are designed
to achieve an economically-integrated Central
America that provides economic opportunities
to its people; more democratic, accountable,
transparent, and effective public institutions;
and a safe environment for its citizens to build
their lives in peace and stability. Investments
in the region also will allow the United States
to work with its partners to improve the capacity of Central American governments to receive
and reintegrate migrants and to target human
smugglers. These resources will complement
efforts by Central American governments, especially in El Salvador, Honduras, and Guatemala,
to accelerate longer-term reforms and improvements in the lives of ordinary citizens. They will
allow the United States to increase its coordination with regional governments as well as with
international financial institutions, the private
sector, civil society, and other international partners, to promote regional prosperity through
a sustained, well-coordinated plan to address
longstanding challenges to economic growth
in the region. Based on the U.S. Strategy for
Engagement in Central America, which focuses
on the interlocking themes of prosperity, security,
and good governance, the United States is ready
to support aspects of the “Alliance for Prosperity”
plan developed jointly by the governments of
El Salvador, Honduras, and Guatemala, while
working with other international stakeholders
and the private sector to define and accelerate
their support.
Securing the Borders and Enforcing
U.S. Immigration Laws
Our long-term investment in border security and immigration enforcement has
produced significant and positive results. Under
this Administration, the resources that the
Department of Homeland Security (DHS) dedicates to security at the Southwest border are at
an all-time high. Compared to 2008, today there
are 3,000 additional Border Patrol agents along
the Southwest border. Border fencing, unmanned
aircraft surveillance systems, and ground surveillance systems have more than doubled since
2008. Border apprehensions—a key indicator of
border security—are at their lowest levels since
the 1970s. Even this summer’s influx of unaccompanied children was met with an aggressive,
coordinated Federal response focused on heightened deterrence, enhanced enforcement, stronger
foreign cooperation, and greater capacity for
Federal agencies to ensure that the U.S. border remains secure. As a result of the Administration’s
efforts at the border, the size of the unauthorized population living in the United States has
stopped growing for the first time in 40 years.
The Budget continues the investment in border
security by maintaining U.S. Customs and Border
Protection (CBP) front line operations, funding
additional technology and infrastructure, and
expanding and enhancing intelligence and targeting capabilities. The Budget supports 21,370
Border Patrol Agents and 26,075 CBP Officers,
including over 2,300 new Officers supported by
proposed increases to user fees. The Budget includes over $373 million for the acquisition and
sustainment of technology and tactical infrastruc-
60
INVESTING IN AMERICA’S FUTURE
ture along U.S. borders, an increase of $90 million
over the current Continuing Resolution funding
levels for DHS and $11 million above the 2015
Budget. This includes $128 million to support
the deployment of new technology and tactical
infrastructure investments along the Southwest
border. These technology investments provide
CBP with increased situational awareness on the
border, as well as the ability to effectively respond
to border incursions. The Budget also provides
$97 million for recapitalization of aging non-intrusive inspection equipment at ports of entry,
which will help CBP more efficiently detect security threats and facilitate lawful trade and travel.
The Budget also funds an increase of $36 million
in CBP intelligence and targeting activities that
provide cutting-edge analytic support to Agents
and Officers in the field.
IMPROVING HEALTH CARE THROUGH ACA AND ADDITIONAL REFORMS
The President’s health plan provides hardworking, middle class Americans the economic
security they deserve. American families no longer need to worry about losing coverage due to
economic setbacks, such as lay-offs or job changes,
or due to pre-existing conditions, such as asthma.
The ACA also forces insurance companies to play
by the rules, prohibiting them from discriminating against anyone with a pre-existing condition,
dropping coverage due to illness, billing patients
into bankruptcy because of an illness or injury,
and limiting annual or lifetime benefits. Further,
as discussed in the first chapter, the ACA has taken historic and significant steps toward putting
the Nation back on a sustainable fiscal course,
while laying the foundation for a higher-quality,
more secure health care system. The ACA is improving the quality of care that Americans receive
and reducing cost growth by deploying innovative
new payment and delivery models that incentivize more efficient, higher-quality care.
Since the full implementation of the ACA began
in 2014, millions of people have enrolled in either
private insurance through the Health Insurance
Marketplace, or coverage through Medicaid and
the Children’s Health Insurance Program (CHIP).
As a result, the number of uninsured Americans
has dropped by an estimated 10 million. The
ACA is helping to enhance competition among
insurance companies, expand coverage choices,
and increase affordability, by keeping premiums
Health Care Costs Are Under Control
Annual price growth
14%
Health Care Goods and Services
12%
Non-Health Care Goods and Services
10%
8%
Record Low Health Care Price Growth
6%
4%
2%
0%
-2%
-4%
1981
1984
1987
1990
1993
1996
1999
2002
2005
2008
2011 2014*
*Annualized using data through 2014:Q3
Source: Department of Commerce, Bureau of Economic Analysis; Personal Consumption Expenditures data
with OMB calculations.
THE BUDGET FOR FISCAL YEAR 2016
low and offering tax credits to more Americans to
help them purchase coverage.
Supporting Implementation
of the Affordable Care Act
The Budget fully funds the ongoing implementation of ACA’s health insurance coverage
improvements through the operation of Health
Insurance Marketplaces and the premium tax
credits and cost sharing assistance to help make
coverage affordable, drive down long-term health
care costs, and improve care for millions of
citizens.
Preserving Coverage through CHIP. CHIP
currently serves over eight million children of
working parents who are not eligible for Medicaid.
The Budget proposes to extend funding for CHIP,
which ends in 2015, through 2019, ensuring continued, comprehensive, affordable coverage for
these children. The proposal is paid for through
an increase in tobacco taxes that will help reduce
youth smoking and save lives.
Strengthening Medicare and Medicaid
This year will mark the 50th anniversary of the
enactment of Medicare and Medicaid. Together,
Medicare and Medicaid provide affordable
health coverage to support longer, healthier lives
and economic security for the Nation’s seniors
and low-income working Americans and families. Today, Medicare provides about 55 million
Americans with dependable medical insurance.
State Medicaid programs provide health and
long-term care coverage to more than 68 million
low income Americans. The ACA and the Budget
strengthen the Medicare and Medicaid programs
through reforms that expand health coverage in
Medicaid, encourage high-quality and efficient
care, and continue the progress of reducing cost
growth.
Expanding Health Coverage by Improving
Access to Medicaid and CHIP Coverage and
Services. The Budget gives States the option to
streamline eligibility determinations for children
in Medicaid and CHIP and to maintain Medicaid
61
coverage for adults by providing one-year of continuous eligibility. The Budget expands access
to preventive benefits and tobacco cessation for
adults in Medicaid and ensures children in inpatient psychiatric treatment facilities have access
to comprehensive benefits.
Promoting Access to Medicaid Long-Term
Care Services and Supports (LTSS). The
Budget includes proposals that would expand
access to Medicaid home and community-based
services (HCBS) as an alternative to institutional
care for individuals with disabilities and elderly populations. First, the Budget expands and
simplifies eligibility to encourage more States to
provide HCBS in their Medicaid programs. The
Budget also includes a comprehensive long-term
care pilot for up to five States to test, at an enhanced Federal match rate, a more streamlined
approach to delivering LTSS to support greater
access and improve quality of care. In 2015, the
Administration will host the sixth White House
Conference on Aging to recognize the importance of these, and other key programs for older
Americans, as well as to look ahead to how to
improve and advance the quality of life for older
Americans in the next decade.
Improving Care Delivery for Low-Income
Medicare-Medicaid Beneficiaries. The Budget
proposes a budget-neutral pilot in a limited number of States to provide qualifying low-income
adults, under age 55, benefits under the Program
for All-Inclusive Care for the Elderly (PACE),
while promoting community services in line
with the integration of the landmark Olmstead
1
Supreme Court decision , supporting self-determination, serving people with disabilities in
the most integrated setting appropriate to their
needs, and achieving better health outcomes.
Under current law, PACE provides comprehensive long-term services to qualifying individuals
age 55 and older. Pilots will test whether PACE
programs can effectively serve a younger popula1 The U.S. Supreme Court’s 1999 landmark decision in Olmstead v.
L.C. (Olmstead) found the unjustified segregation of people with
disabilities is a form of unlawful discrimination under the Americans with Disabilities Act. Olmstead requires States to administer programs in the most integrated setting appropriate to the
needs of qualified individuals with disabilities.
62
tion without increasing costs. The Budget also
proposes to implement streamlined processes for
beneficiary appeals and joint Federal-State review of marketing materials for managed care
plans that integrate Medicare and Medicaid payment and services and serve Medicare-Medicaid
enrollees. These proposals address the sometimes
conflicting requirements in each program. In
addition, the Budget proposes to permanently authorize a demonstration that provides retroactive
drug coverage for certain low-income Medicare
beneficiaries through a single plan, establishing
a single point of contact for beneficiaries seeking
reimbursement for claims.
Encouraging High-Quality, Efficient Care
among Medicare Providers. The Budget
continues a set of proposals that build on initiatives included in ACA to help extend Medicare’s
solvency while encouraging provider efficiencies and improved patient care. This includes a
proposal to encourage efficient post-acute care
by adjusting payment updates and other payment modifications for certain post-acute care
providers. The Budget also proposes to better
align certain special payments to hospitals with
the cost of care and reduce Medicare bad debt
payments in a way that more closely matches
private sector standards. Additional proposals to
promote efficiency in the Medicare program include: improving payment accuracy for Medicare
Advantage; constraining Medicare cost growth;
better aligning payments to teaching hospitals
with patient care costs; and addressing excess
payments for Medicare Part B drugs to hospitals
and physicians. Together, these proposals would
save approximately $222 billion over 10 years.
Improving Health Outcomes for Children
and Youth in Foster Care. The Budget also
establishes a new Medicaid demonstration project in partnership with the Administration for
Children and Families to encourage States to provide evidence-based psychosocial interventions to
address the behavioral and mental health needs
of children in foster care and reduce reliance on
psychotropic medications, with the goal of improving overall health outcomes.
INVESTING IN AMERICA’S FUTURE
Reducing Cost Growth by Encouraging
Beneficiaries to Seek High-Value Services.
The Budget includes structural changes that will
encourage Medicare beneficiaries to seek highvalue health care services. To help improve the
financial stability of the Medicare program, the
Budget reduces the Federal subsidy of Medicare
costs for those beneficiaries who need that subsidy the least. The Budget includes several
modifications for new beneficiaries starting in
2019, such as a modified Part B deductible and
a modest copayment for certain home health
episodes. Research indicates that beneficiaries with Medigap plans that provide first, or
near-first-dollar coverage have less incentive to
consider the costs of health care services, thus
raising Medicare costs and Part B premiums for
all beneficiaries. The Budget applies a premium
surcharge for new beneficiaries beginning in 2019
if they choose such Medigap coverage. Together,
these proposals would save approximately $84
billion over 10 years.
Improving Quality and Lowering Drug
Costs for Federal Health Programs. The
Budget includes a number of proposals that lower
drug costs, while improving quality and reducing waste in the Medicare Part D program. The
Administration is deeply concerned with the rapidly growing prices of specialty and brand name
drugs. The Budget proposes to give the Secretary
of HHS the authority to negotiate drug prices for
biologics and high-cost drugs in Medicare Part D
to help ensure access to and affordability of these
treatments. This proposal is one of a range of potential solutions to address these growing costs,
and the Administration looks forward to working
with the Congress on this challenge. The Budget
also proposes to close the coverage gap for brand
drugs in the Part D benefit by 2017, three years
earlier than under current law, by increasing the
discounts offered by the pharmaceutical industry. In addition, the Budget proposes to align
Medicare payments for drugs with Medicaid policies for low-income beneficiaries. It also provides
the Secretary the authority to suspend coverage
and payment for questionable Part D prescriptions. The Budget also establishes a program
to reduce prescription drug abuse in Medicare.
63
THE BUDGET FOR FISCAL YEAR 2016
Together, these proposals will save Medicare $126
billion over 10 years. In addition, the Budget includes two proposals designed to increase access
to generic drugs and biologics by stopping companies from entering into anti-competitive deals
intended to block consumer access to safe and
effective generics, by awarding brand biologic
manufacturers seven years of exclusivity, rather
than 12 years under current law, and by prohibiting additional periods of exclusivity for brand
biologics due to minor changes in product formulations. These two proposals will save the Federal
Government $16 billion over 10 years, including
savings in Medicare and Medicaid.
Lowering Medicaid Drug Costs for States
and the Federal Government. The Budget
includes targeted policies to lower drug costs
in Medicaid. First, the Budget improves the
Medicaid drug rebate program by clarifying the
definition of brand drugs, collecting an additional
rebate for generic drugs whose prices grow faster
than inflation, clarifying the inclusion of certain
prenatal vitamins and fluorides in the rebate program, and taking actions to promote the integrity
of the rebate program. The Budget also corrects
a technical error to a rebate for new drug formulations, limits to 12 quarters the timeframe for
which manufacturers can dispute drug rebate
amounts, and excludes authorized generic drugs
from average manufacturer price calculations for
determining manufacturer rebate obligations for
brand drugs. In addition, the Budget improves
Medicaid drug pricing by calculating Medicaid
Federal upper limits based only on generic drug
prices. These proposals are projected to save the
Federal Government approximately $6.3 billion
over 10 years.
Cutting Waste, Fraud, and Abuse in
Medicare and Medicaid. The Administration
has made targeting waste, fraud, and abuse in
Medicare, Medicaid, and CHIP a priority and is
aggressively implementing new tools for fraud
prevention included in the ACA. In 2013, the
Health Care Fraud and Abuse Control program’s
law enforcement efforts produced a record-breaking $4.3 billion in judgments, settlements, and
recovery of taxpayer dollars from individuals
trying to defraud Federal health care programs
serving seniors and taxpayers. In addition, further development of the CMS Fraud Prevention
System, a predictive analytic model similar to
those used by private sector experts, continues
to support CMS’ efforts to identify and prevent
wasteful, abusive, and potentially fraudulent
billing activities. While these results indicate
progress, more remains to be done. Therefore,
the Budget proposes a series of policies to build
on these efforts that will save nearly $3 billion
over the next 10 years. Specifically, the Budget
proposes to implement new initiatives to reduce
fraud, waste, and abuse in Medicare, Medicaid,
and CHIP by:
• Requiring prior authorization for power mo-
bility devices and advanced imaging, which
could be expanded to other items and services at high risk of fraud and abuse;
• Directing States to track high prescribers
and utilizers of prescription drugs in Medicaid to identify aberrant billing and prescribing patterns;
• Supporting efforts to investigate and prose-
cute allegations of abuse or neglect of Medicaid beneficiaries in non-institutional health
care settings and in the territories; and
• Strengthening the Federal Government’s
ability to identify and act on fraud, waste,
and abuse through Medicaid Integrity
Program improvements and investments.
In addition, the Budget would simplify and
streamline State program integrity reporting
requirements by consolidating redundant error
rate measurement programs to create a streamlined audit program with meaningful outcomes,
while maintaining the Federal and State government’s ability to identify and address improper
Medicaid payments.
Health Care Delivery System Reforms
Since passage of the ACA, the Administration
has developed an aggressive agenda to reform the
Nation’s health care delivery system. This means
avoiding costly mistakes and readmissions, keep-
64
INVESTING IN AMERICA’S FUTURE
ing patients healthy, rewarding quality instead
of quantity, and creating the health information
technology infrastructure that enables new payment and delivery models to work. Such reforms
will help to further slow growth in health care
costs, and increase savings for Medicare and
Medicaid. Building on the lessons learned and
success from existing initiatives, the delivery
system reform agenda will continue to improve
health care quality and reduce costs using the following three strategies:
• Modify health care payment structures to reward providers for optimal care;
• Support practice redesign and create better
capacity to improve care delivery; and
• Improve access to information to encourage
data-driven decision-making by consumers,
providers, and businesses.
To encourage health care providers who deliver better care and better outcomes for their
patients, the Administration has set a goal for
2016 of making 30 percent of Medicare payments
through alternative payment models, which link
payments to delivery of efficient, high-quality,
coordinated health care rather than paying for
volume of health care services. By 2018, the
Administration’s goal is to make 50 percent of
Medicare payments to providers through alternative payment models.
To further align incentives and improve care
coordination, the Budget includes a proposal to
accelerate physician participation in high-quality and efficient health care delivery systems
by repealing the Medicare Sustainable Growth
Rate formula and reforming Medicare physician payments in a manner consistent with the
reforms included in recent bipartisan, bicameral
legislation.
The Budget encourages post-acute providers,
such as nursing homes and home health agencies, to deliver care efficiently by making a single
(bundled) payment for such services. It also includes proposals that will enhance the ability
of Accountable Care Organizations to increase
quality and reduce costs. In addition, the Budget
improves incentives for providers to deliver care
in the most appropriate ambulatory setting and
also reduces incentives for physicians to inappropriately order services from which they would
financially benefit.
The Budget establishes quality bonuses for the
highest rated Part D plans and modifies incentives in the Medicare prescription drug program
to encourage patient engagement in health care
decisions.
To improve transparency and distribution of
information, the Administration has improved
access to Federal data through the Open Data
Initiative, released Medicare data on cost and
quality, and invested in innovative ways to collect and share data, from the way we measure
the quality of care to the way health care is documented and communicated to consumers. The
Budget increases support to advance interoperable health IT as part of delivery system reform
while protecting patient privacy. The Budget supports the Office of the National Coordinator for
Health Information Technology (ONC) in developing standards and consensus around policies
that will help consumers and providers access
electronic health information when and where
they need it to make health care decisions, including development of interoperable mobile tools to
help consumers use their health information effectively. The Budget also expands Medicare data
sharing with qualified entities, which will enable
additional third party analysis of data, and may
lead to more transparent public discussion of care
practices improvement in health care quality and
efficiency, and/or reduce fraud, waste, and abuse
in the Medicare program.
Public Health, Safety, and Security
The Budget proposes a number of key investments and reforms to improve the Nation’s public
health system and to promote access to health
care services for vulnerable populations. Further,
the Budget invests in protecting the Nation’s public health system against global health security
challenges such as infectious diseases, antibioticresistant bacteria, and biohazard threats. Since
THE BUDGET FOR FISCAL YEAR 2016
the first cases of Ebola were reported in West Africa
in March 2014, the United States has mounted a
Government-wide response to contain and eliminate the epidemic at its source, while also taking
prudent measures to protect the American people. Emergency funding appropriated in 2014 in
response to the President’s proposal will mitigate
the epidemic in West Africa, enhance domestic
preparedness, speed the procurement and testing
of new vaccines and therapeutics, and accelerate
the Global Health Security Agenda. These activities will combat the spread of Ebola and will
help reduce the potential for future outbreaks of
infectious diseases that could follow a similarly
devastating, costly, and destabilizing trajectory.
The Budget continues to invest in these critical
programs to strengthen the Nation’s preparedness capabilities.
Prescription Drug and Heroin Abuse.
Every day, more than 100 people die as a result of drug overdose, and more than 6,700
are treated in emergency departments. Abuse
of prescription and illicit drugs, such as heroin, is an urgent public health concern. The
Budget increases funding for programs across
the Centers for Disease Control (CDC), the
Substance Abuse and Mental Health Services
Administration, the Agency for Healthcare
Research and Quality, and ONC to decrease the
rates of inappropriate prescription drug abuse.
The Budget increases funding for every State to
expand existing Prescription Drug Monitoring
Programs to improve clinical decision making,
interoperability, and effective public health
interventions. The Budget also includes funding to expand and improve the treatment for
people who use heroin and prescription opioids.
In addition, the Budget supports increased dissemination of naloxone by first responders in
an effort to prevent overdose deaths in high
risk communities.
Modernizing the Nation’s Food Safety
System. CDC has estimated that 48 million
foodborne illnesses occur each year from contaminated foods. The Budget includes $1.6 billion
in total program resources to bolster food safety
activities, including an increase of $301 million
65
for the Food and Drug Administration to implement new safety measures under the Food Safety
Modernization Act for domestic and imported
foods.
Investing in Native American Health
Care. The Budget provides the Indian Health
Service (IHS) with $5.1 billion, an increase of
$461 million over the 2015 enacted level, which
will expand health care services, and allow IHS
to make significant progress toward the construction of health care clinics in Indian Country. The
Budget proposes to fund contract support costs
through mandatory funds beginning in 2017.
The Administration intends to consult broadly with Tribes on this new approach prior to
implementation in 2017.
Combating Antibiotic Resistant Bacteria
(CARB). The Budget includes an increase of
more than $550 million above 2015 enacted levels across the Federal Government to prevent,
detect, and control illness and death related to
infections caused by antibiotic-resistant (AR)
bacteria. These resources will also help support
the advancement of therapeutics for the treatment of bacterial infections. The Budget also
fully implements the surveillance, prevention,
and stewardship activities outlined in the CARB
National Strategy. The investments will protect
patients and communities by implementing interventions that reduce the emergence and spread
of AR pathogens to prevent current antibiotic
resistant threats. By 2020, the United States, together with partners, will reduce the incidence of
overall Clostridium difficile infection in half and
reduce Carbapenem-resistant Enterobacteriaceae
infections acquired during hospitalization by 60
percent.
Preventing, Detecting, and Responding
to Infectious Diseases, Both Abroad and at
Home. The Ebola epidemic in West Africa underscores the need to urgently strengthen global
health security in countries around the world
that are not equipped to handle Ebola, including
the most vulnerable countries across Asia, the
Middle East and Africa that have poor infrastructure, limited capacity, high population density,
66
and major transport hubs. In addition, recent and
ongoing outbreaks of Plague, Marburg, Lassa fever, the Middle East Respiratory Syndrome, and
avian influenza clearly demonstrate the need to
immediately address global vulnerabilities. The
Budget continues to invest in the Global Health
Security Agenda, increases funding to eradicate
polio and for the U.S. contribution to Gavi, the
Vaccine Alliance, and creates a new PEPFAR
Impact Fund for targeted global HIV/AIDS efforts. The Budget also increases funding for
domestic preparedness efforts to more effectively
and efficiently respond to potential, future outbreaks here at home and dedicates funding for
States to develop HIV Plans to help them reach
the goals of the National HIV/AIDS Strategy.
Strengthening Preparedness for all
Health Threats, Including Naturally Occurring Hazards and Intentional Attacks. The
Budget includes $522 million to enhance the advanced development of next generation medical
countermeasures against chemical, biological,
radiological, and nuclear threats. The Budget
also more than doubles support for Bioshield by
providing $646 million to continue the Federal
Government’s long-term commitment to the acquisition of new medical countermeasures. The
Government response to Ebola has highlighted
the importance of sufficient funding and operational capabilities to facilitate an effective and
coordinated response to public health crises that
may not meet the current criteria for a national
disaster or public health emergency declaration,
such as those under the Stafford Act. Informed
by lessons learned from the Ebola response, the
Budget proposes additional funding for HHS to
strengthen the Nation’s capability to plan for and
respond to public health emergencies and enables
potential changes in structure and capabilities to
improve our public health emergency response.
The Budget includes $110 million to respond to
unanticipated public health emergencies through
support for domestic or international activities,
such as State and local response and emergency
staffing, hospital and containment facilities, infection control, laboratory equipment and supplies,
data gathering and analysis, countermeasures,
INVESTING IN AMERICA’S FUTURE
and other potential needs in such an incidence.
Within the total, there are resources for staff coordination and training, command and control,
and other related logistical needs.
Health Centers and Health Workforce
The Budget helps ensure Americans in need of
health care services are able to access them in a
timely manner. Health centers are a key component of the Nation’s health care safety net that
provide Americans with access to affordable comprehensive, high-quality, primary care services
regardless of their ability to pay. The Budget
also strengthens the primary care workforce by
providing increased resources for primary care
health care providers who train and practice in
areas where they are needed most.
Improving Access to Health Care Services.
Across the United States, 1,300 health centers
operate over 9,000 primary care sites that serve
as high-quality, dependable sources of primary
care services in communities. The Budget invests
$4.2 billion, including $2.7 billion in new mandatory resources, in the Health Centers program
in 2016 to support services for an estimated 28.6
million patients. This funding level will enable
health centers to expand services to 1.1 million
additional patients. In total, the Budget provides
$8.1 billion in new mandatory resources over
three years so that health centers can continue to
serve their patients.
Improving Access to High-Quality Health
Care Providers. The Budget includes new funding
to implement innovative policies to train new health
care providers and ensure that the future health
care workforce is prepared to deliver high-quality
and efficient health care services. The Budget invests $810 million in 2016 and $2.1 billion from
2017-2020 in the National Health Services Corps
to place and maintain 15,000 health care providers in the areas of the Nation that need them most.
To encourage and enhance training of primary care
practitioners and other physicians in high-need specialties, the Budget proposes $5.25 billion over 10
years to support 13,000 new medical school graduate residents through a new competitive graduate
THE BUDGET FOR FISCAL YEAR 2016
medical education program that incentivizes highquality physician training. To continue encouraging
provider participation in Medicaid, the Budget extends increased payments for primary care services
delivered by certain physicians through 2016, with
modifications to expand provider eligibility and better target primary care services.
As discussed in this chapter, the President’s
Budget makes balanced investments in health
care, infrastructure, clean energy, education, innovation, and research to grow the U.S. economy.
By investing in the military, the Budget enhances
America’s national security. These investments
will be fully paid for by cutting inefficient spending and by reforming tax benefits to make sure
everyone pays their fair share.
67
The President believes that investments in
the economy and national security must be done
together. We cannot abandon our security in service of our economy, and we cannot abandon our
economy in service of our security because harm
to one does harm to the other. That is why the
Budget provides a roadmap to make the investments needed both domestically and abroad.
As discussed in the next chapter, A Government
of the Future, the Budget also proposes to make
Government work better, by investing in effectiveness and efficiency; using Government data
to drive economic growth; and supporting the
people who work in Government.
A GOVERNMENT OF THE FUTURE
“We cannot win the future with the government of the past.”
—President Barack Obama, State of the Union Address, January 25, 2011
The President is committed to creating a
Government that makes a significant, tangible, and
positive difference in the economy and the lives of
the American people, and to driving lasting change
in how Government works. This Administration
has launched successful efforts to eliminate wasteful information technology (IT) spending, reduce
the Federal real property footprint, modernize and
improve citizen-facing services, and open tens of
thousands of Federal data sets to spur innovation
in the private sector. Yet, despite this progress,
public trust in government remains low and there
is more work to be done.
The Administration is ramping up its efforts to
restore this trust through investments that modernize and improve how the Government serves
citizens, and through initiatives that maximize
the impact of taxpayer dollars. Past investments
in management priorities have resulted in a
significant return. For example, an $11 million
investment funded the development and execution of the PortfolioStat initiative, a data-driven
review of agency IT portfolios. This work, along
with other OMB and technology reform and implementation efforts, has saved over $2.7 billion
in the past three years. This represents a return
on investment of nearly $245 for every $1 invested. In 2016, the Administration proposes over
$450 million to drive forward progress on crossagency management priorities. This includes new
funding to support the teams leading cross-agen-
cy priority goals and to promote Federal spending
transparency. It also increases support for ongoing initiatives—such as the U.S. Digital Service
(USDS), PortfolioStat, Freeze the Footprint, and
Open Data—that have already had an impact on
improving Government operations.
The Budget fully supports the President’s
Management Agenda, a comprehensive and
forward-looking plan to modernize and improve
government to ultimately deliver better, faster,
and smarter services to citizens and businesses. The President’s Management Agenda is
built on four pillars: Effectiveness—delivering
world-class customer service to citizens and businesses; Efficiency—enhancing productivity and
achieving cost savings across the Government;
Economic Growth—opening Government-funded
data and research to the public to spur innovation, entrepreneurship, economic growth, and job
opportunities; and People and Culture—unlocking the full potential of today’s Federal workforce
and building the workforce needed for tomorrow.
Since launching the Management Agenda
last year, the Administration has seen significant initial success in each of these four pillars.
The Administration launched the USDS, a small
team of our Nation’s digital experts working
to build the Federal Government’s capacity to
deliver world-class services to the American
people. We stepped up our focus on delivering
69
70
A GOVERNMENT OF THE FUTURE
better customer service, increased agency use of
shared services and strategic sourcing, ramped
up agency progress and compliance with the
Administration’s open data policy, and started
work on an ambitious plan for Senior Executive
Service (SES) reform.
In addition to the Management Agenda, the
Budget also supports the President’s plan to
reorganize the Federal Government so that it
does more for less, and is best positioned to assist businesses and entrepreneurs in the global
economy.
EFFECTIVENESS: DELIVERING WORLD-CLASS CUSTOMER
SERVICE FOR CITIZENS AND BUSINESSES
Government must be able to keep pace with the
innovation and user experiences that the American
people and businesses expect. Throughout 2014,
the Administration piloted new and innovative
approaches to increase the Government’s ability
to drive impact for Americans on national priorities, including initiatives that help veterans
find employment and help workers invest in safe
and affordable retirement accounts. The Budget
invests in scaling those pilot programs and processes that have proven successful. Ultimately, a
more effective Government will more efficiently
use taxpayer dollars to better deliver for citizens.
Ramping Up Smarter Information
Technology Delivery
The Administration has embarked on a comprehensive approach to fundamentally improve
the way that the Government delivers technology services to the public. Top technologists and
entrepreneurs are being recruited to work within
agencies on the highest priority projects. The
best processes are being leveraged to increase
oversight and accountability for IT spending. In
addition, several efforts are being piloted to improve IT procurement and ramp up Government
contracting with innovative companies.
People. Getting the best talent working inside of Government is a key component of the
Administration’s Smarter IT Delivery strategy.
In 2014, the Administration piloted the USDS by
recruiting a select group of private sector innovators, entrepreneurs, and engineers to Government
service. Since standing up, this team of America’s
best digital experts has worked in collaboration
with Federal agencies to implement cutting-edge
digital and technology practices on the Nation’s
highest impact programs, including the successful re-launch of HealthCare.gov in its second year,
the Veterans Benefits Management System, and
an improved process for online visa applications,
among others. In addition to their work on these
high priority projects, this small team of technical experts has worked to establish best practices
and recruit still more highly-skilled digital
service experts and engineers into Government.
Every agency in Government has citizen-facing
digital projects that are critical to its mission. Too
often, these services have been delivered over budget, behind schedule, and in ways that do not meet
citizen needs. Unsurprisingly, since the launch of
USDS in 2014, there has been significant demand
for its expertise, from project design and development to recruiting technical experts. To address
this problem, the Budget scales and institutionalizes this new approach to technology by providing
funding to 25 agencies for the development of their
own agency digital services teams. These small,
high-impact teams will drive the quality and effectiveness of the agencies’ most important digital
services. USDS will work closely with agencies
to stand up these teams by providing support for
hiring, training, and procurement.
Process. The Administration has made significant progress encouraging data-driven processes
to provide effective oversight of Government IT.
By establishing mechanisms such as PortfolioStat,
a data-based review of agency IT portfolios, we
have not only strengthened Federal IT, but made
it significantly more cost effective. PortfolioStat
has helped the Government achieve more than
$2.2 billion in savings over the past three years
while ensuring agencies are efficiently using taxpayer dollars to deliver effective and innovative
THE BUDGET FOR FISCAL YEAR 2016
solutions to the public. PortfolioStat promotes
the adoption of new technologies, such as cloud
computing and agile development practices. For
example, as a result of these continuing efforts,
the Federal Government now spends approximately 8.5 percent of its budget on provisioned
services such as cloud computing, on par with
leading private sector companies.
In addition, agencies involved in PortfolioStat
are becoming more effective in rapidly delivering
value in IT. For example, agencies have increased
their use of agile development practices and are
delivering IT capabilities 21 days (11 percent)
faster than they were in May 2013. Agile development is an incremental, fast-paced style of
software development that better meets evolving
user needs. Using agile development ultimately
increases the ability to deliver a better product,
faster.
In 2016, the Administration will continue to
use PortfolioStat to drive efficiencies in these
programs, and also will continue to revise and
encourage adoption of the TechFAR and Digital
Services Playbook, which were released to the
public in the fall of 2014. These tools provide clear
guidance to agencies on using agile development
and innovative contracting practices to deliver IT
services that work for 21st Century consumers.
Throughout 2016, the Administration will continue to scale up best practices by institutionalizing
them within the agency digital service teams.
Companies. The Government must work
with private sector innovators to ensure the best
use of cutting-edge technologies and practices.
Yet, too often, there are barriers to entry that
prevent agencies from contracting with these
firms. Over the past year, initial steps have been
taken to address this challenge. For example, the
Administration has piloted FBOpen, a tool that
helps small and innovative companies search
for opportunities to work with Government, and
launched an online national dialogue on procurement reform to solicit ideas for reducing
barriers to access. As part of the broader strategy to transform the Federal marketplace, the
Administration is piloting new initiatives in IT
71
acquisition. In 2016, these early pilots will be expanded to increase digital acquisition capability
within agencies, train agency personnel in digital
IT acquisitions, and test innovative contracting
models.
Delivering World-Class Customer Service
The Administration is continuing its efforts
to improve the quality, timeliness, and effectiveness of Federal services. A customer service
Community of Practice has been established to develop standards, practices, and tools for agencies
to improve their customer service. The Federal
Customer Service Awards program has also been
established to recognize individuals and teams
who provide outstanding customer service directly to the American people. The awards will begin
in the fall of 2015, and will support innovative
practices and provide performance incentives to
frontline employees.
Agencies are also increasing their focus on improving the most frequently used Government
services, and the Budget supports the introduction and scale-up of these programs. The Internal
Revenue Service (IRS) has launched IRS Direct
Pay, which provides taxpayers a no-fee electronic
payment option and allows them to establish installment agreements; built an e-Authentication
tool that provides taxpayers a user-friendly, lowcost way to securely access IRS online tools and
applications; and launched IRS2Go, a downloadable app that allows taxpayer self-service access to
IRS information and services on any device. Since
its release, it has been downloaded more than
5.4 million times. The Transportation Security
Administration (TSA) is continuing to improve
passenger experience at airports, including continuing to expand and improve TSA Pre-Check,
an expedited passenger screening program. TSA
is exploring new and innovative ways of collecting
and responding to customer feedback to provide
the best possible service while keeping U.S. airports safe. Going forward, the Administration will
build and expand on this progress by improving
the collection and use of customer feedback data
across Government to make tangible improvements in customer interactions.
72
A GOVERNMENT OF THE FUTURE
EFFICIENCY: INCREASING QUALITY AND VALUE IN CORE OPERATIONS
Over time, duplicative efforts have made
Government less effective, wasting taxpayer
dollars and making it harder for the American
people to navigate their Government. To address
this issue, the President has focused on improving Government efficiency. The Budget invests
in expanding shared services, simplifying Federal
contracting, continued benchmarking to drive
data-driven Federal management, and shrinking
the Federal real property footprint.
Expanding Shared Services to Increase
Quality and Savings
It will come as no surprise that most Federal
agencies have similar administrative functions that
require the investment of increasingly scarce resources. Human resources, financial management,
and payroll, for example, are common administrative functions that all agencies need, but not all
agencies are equally efficient at managing. By
creating Shared Service Providers (SSPs), and concentrating the delivery of administrative services
within a smaller number of agencies, duplicative
efforts can be reduced. Further, by giving this task
to agencies with the right expertise, we can free up
resources for mission critical activities, and deliver
cost-effective support to agencies.
The use of shared services has grown in recent
years, with smaller agencies leading the charge.
In 2014, cabinet-level agencies took steps to realize the benefit of shared service agreements.
For instance, in the Federal Government’s largest shared service arrangement to date, the
Department of Housing and Urban Development
(HUD) has begun transitioning all of its core financial management functions—as well as select
administrative and human-resource functions—
to the Department of the Treasury, with other
cabinet-level agencies expected to follow. To support greater adoption of shared services by all
agencies for a broad range of functions, the Office
of Management and Budget (OMB), in partnership with the Department of the Treasury’s Office
of Financial Innovation and Transformation, has
developed a new governance model for SSPs that
incorporates feedback from early adopters and
builds on lessons learned from shared services in
private sector companies.
The move to SSPs also supports the ability to
modernize agency financial systems to allow for
greater spending transparency. It will also allow more efficient implementation and adoption
of the Digital Accountability and Transparency
Act (DATA Act) of 2014. This Act requires the
creation and adoption of standard definitions for
Government spending data and the display of
that data on USASpending.gov. The Budget includes funding that will allow agencies to make
progress in implementing the DATA Act and
increase Federal spending transparency.
Buying as One through Category Management. Federal contracting is often seen as a
highly complex process that ultimately leads to
less innovation, higher costs, and weaker performance. Today, proposals for contracts are
lengthy, overly prescriptive, and laden with
Government-specific requirements. There is
also staggering duplication of contracts across
Government and very little information sharing between agencies on pricing or other
important contractual information. In order
to fundamentally improve how taxpayer dollars are used in the Federal contracting space,
the Administration is embarking on a comprehensive initiative to enhance collaboration and
cooperation and drive greater innovation and
improved performance. The category management initiative draws upon private sector
best practices to create categories of commonly
purchased items such as computers, software licenses, fuel for vehicle fleets, and human capital
training services that are each managed with
their own set of Government-wide strategies.
This new approach will build on the progress
made in the strategic sourcing initiative, leveraging the consolidated purchasing power of the
Government to buy smarter and reduce duplication. Increased use of strategic sourcing has
saved over $417 million since 2010, and reduced
some areas of contract duplication by up to 40
percent. The Budget better leverages resources
across categories to increase efficiencies, reduce
73
THE BUDGET FOR FISCAL YEAR 2016
duplicative contracts, and increase cost savings
for both Government and industry.
The category management approach is a
fundamental shift from the practice of handling purchasing, analyzing pricing, and
developing vendor relationships individually
within thousands of procurement units across
Government. Under category management,
the Administration will “buy as one” by creating common categories of products and services
across Government, and managing each category as a mini-business with its own set of
strategies. Each category will be led by a senior
team with expertise in its assigned category,
operating out of agencies identified as “centers
of excellence.” Strategic sourcing will continue to be one effective strategy that a category
manager may implement to drive down total
costs and improve overall performance for that
category. Bringing common spending under
management of knowledgeable category leaders, including collecting prices paid and other
key performance information to allow easy comparisons, will ensure that agencies get a more
competitive price and quality of performance
when they are buying similar commodities under similar circumstances. This will also free
up agency acquisition personnel to focus on
complex agency-specific procurements.
To complement these efforts, the Administration will propose legislation making it easier
for vendors seeking to bid on modestly-sized procurements and bringing more new companies into
the Federal marketplace. The Administration
will request authority to raise the simplified acquisition threshold from $150,000 to $500,000
in order to broaden the range of purchases that
can be accomplished with minimal complexity and Government-unique requirements. The
Administration will also seek new pilot authority allowing agencies to set aside work for new
small businesses and other firms that have
limited experience selling to the Government,
but can offer cutting-edge technology and more
creative solutions to address the Government’s
needs.
Shrinking the Federal Real Property
Footprint
The Federal Government is the largest property
owner in the United States. For example, the domestic building inventory contains almost 300,000
buildings requiring approximately $21 billion of
annual operation and maintenance expenditures,
including approximately $6.8 billion of annual lease
costs. As a result, there are numerous opportunities
to save by using Federal space more efficiently and
disposing of unneeded buildings, land, and structures. In 2012, the Administration issued a “Freeze
the Footprint” policy and directed agencies to freeze
the growth in their office and warehouse real estate
inventory. This led to a 10.2 million square foot reduction in Federal office and warehouse holdings in
2013. In 2015, the Administration will implement
a five-year national strategy to continue reducing
the size of the portfolio, and agencies will be required to set annual reduction targets for office and
warehouse space and annual disposal targets for all
building types to further reduce costs.
The Administration is also expanding the
General
Services
Administration
(GSA)
Consolidation Activities program, first proposed
and enacted in 2014. The Administration proposes to use $200 million in annual rental payments
collected from agencies, $130 million over the 2015
enacted level, to execute additional office space
consolidations. This will allow the Government
to more effectively use real property by relocating
Federal agencies into more efficient, lower cost or
consolidated locations that also enable improved
delivery of Government services. More than a
dozen consolidations were implemented in 2014,
the first year of the program, and the changes begun in that year alone will ultimately yield more
than $16 million in annual cost avoidance to the
taxpayer each year that the Government leases
or owns the properties involved. Over time, this
will result in significant avoided cost for this portfolio and will reduce the Federal real property
footprint by approximately 500,000 square feet.
In addition to these administrative actions, the
Budget includes a $57 million proposal to implement the Civilian Property Realignment Act
(CPRA). If enacted, CPRA would create an inde-
74
A GOVERNMENT OF THE FUTURE
pendent board of private and public sector real
estate experts that would perform Governmentwide, independent portfolio analysis and make
recommendations to the Congress on properties
that should be disposed, consolidated, co-located,
or reconfigured. Enactment of CPRA would help
consolidate Government operations, streamline
the disposal process, generate an estimated $1.2
billion in sales proceeds over 10 years, further reduce operations and maintenance costs associated
with excess buildings, and provide funds for real
property reinvestment.
The Benchmarking Initiative
The Benchmarking initiative is aimed at
improving the performance of Federal missionsupport functions, and identifying areas that
may be ripe for innovative thinking or new
efficiencies.
The Administration began the initiative in
2014 by measuring an initial set of five
administrative functions—acquisition, financial
management, human capital, IT management,
and real property—at major bureaus/components
within the 24 Chief Financial Officers Act Federal
agencies. Agencies were able to see for the first
time both how their internal bureaus compared
against each other, and how they performed
compared to peer agencies and the Governmentwide average. Results of this effort are already
being realized. For example, some agencies have
experienced as much as a 10-percent increase in
their reporting of contractor past performance,
a vital way in which the Federal Government
tracks the performance of its contractors. In
2015 and 2016, the Benchmarking program will
be expanded to include customer satisfaction
metrics and to make the results part of agency
performance reviews and strategic planning
exercises.
ECONOMIC GROWTH: INVESTING IN GOVERNMENT ASSETS TO FUEL
INNOVATION, JOB CREATION, AND ECONOMIC PROSPERITY
The Budget continues to invest in efforts to
open up Government-generated assets, including data and the results of federally funded
research and development— such as intellectual
property and scientific knowledge—to the public. Through these efforts, the Government can
empower citizens and businesses to increase the
return on investment with innovation, job creation and economic prosperity gained through
their use of open Government data and research
results. The use of this data and scientific knowledge has impacted the private sector, including
fueling innovative start-up companies and creating American jobs, increasing the transparency
of retirement plans, helping consumers uncover
fraudulent charges on their credit card bills, assisting potential homebuyers in making informed
housing decisions, and creating new life-changing
technologies, such as leading-edge vaccines.
Opening Data to Spark Innovation
The Administration places a high priority on
opening Government data as fuel for private
sector innovation and public use. Since 2009, the
Administration has released over 75,000 data
sets to the public, while continuing to protect
individual privacy, with over 67,000 of these data
sets released in the last year alone. These data sets
include everything from credit card complaints,
to weather and climate measurements, to what
different hospitals charge for different procedures.
In demonstrating its commitment to open data,
the Administration has developed performance
metrics to measure agency progress in reaching
open data goals, provided tools to make it easier
for Federal agencies to publish data, and released
guidance to agencies on how to engage with
the community to identify priority data sets for
release. The Administration continues to invest
in and support efforts to unlock Federal data
sets with a high potential for economic impact,
including in the areas of health care, energy,
education, employment, public safety, tourism,
THE BUDGET FOR FISCAL YEAR 2016
and agriculture. In addition, the Administration
is committed to fueling the open data ecosystem by
taking steps to connect agencies, entrepreneurs,
and other innovators. The Budget provides $16
million for E-Government initiatives in GSA’s
Federal Citizen Services Fund, supporting
important IT investments including open data
and digital Government initiatives.
While
emphasizing the opening of Federal data,
safeguarding the privacy, confidentiality, and
security of sensitive information is of the utmost
importance, and agencies are required to do
thorough reviews of their data prior to publication
to ensure no sensitive information is released.
Accelerating and Institutionalizing
Lab-to-Market Practices
As discussed in the chapter on Investing
in America’s Future, the Budget invests $146
billion in research and development (R&D)
across Government. The Federal Government’s
investment in R&D yields extraordinary longterm economic impact through the creation of
new knowledge, new jobs, and ultimately new
industries. The Federal R&D enterprise must
continue to support fundamental research
that is motivated primarily by an interest in
expanding the frontiers of human knowledge
and diffusing this knowledge through open
data and publications. At the same time, economic growth can be accelerated through more
effective transition of R&D results from the
laboratory to the marketplace, based on close
collaboration with industry.
75
The Budget reflects the Administration’s commitment to accelerating the transfer of the results
of federally funded research to the commercial
marketplace by proposing increased funding
for technology transfer from Federal labs in the
National Institute of Standards and Technology
(NIST) and for the National Science Foundation’s
(NSF) public-private Innovation Corps (I-Corps)
program. In response to the President’s 2011
Memorandum on Accelerating Technology
Transfer and Commercialization, the Budget proposes an additional $4 million for NIST efforts to
accelerate and expand technology transfer across
the Federal Government, which will enhance
the competitiveness of U.S. industry by sharing
innovations and knowledge from Federal laboratories. The Budget also proposes $30 million
for the public-private I-Corps program at NSF
aimed at bringing together the technological, entrepreneurial, and business know-how necessary
to bring discoveries ripe for innovation out of the
university lab.
Another example of federally funded R&D
powering marketplace innovation can be seen
in the Department of Energy’s (DOE) Office of
Energy Efficiency and Renewable Energy (EERE)
Lab-Corps program. This program empowers
National Laboratory teams to identify market
applications and private sector partners to commercialize high-impact new EERE technologies.
The initial Lab-Corps pilot will be completed by
the end of 2015, and in 2016, depending on the results of the pilot, DOE will expand the Lab-Corps
program to other laboratory partners.
PEOPLE AND CULTURE: UNLOCKING THE FULL POTENTIAL OF TODAY’S FEDERAL
WORKFORCE AND BUILDING THE WORKFORCE NEEDED FOR TOMORROW
In his December 2014 address to Federal Senior
Executives, President Obama said, “[W]e need
the best and brightest of the coming generations
to serve. [T]hose of us who believe government
can and must be a force for good…we’ve got to
work hard to make sure that government works.”
Through the Management Agenda’s focus on
People and Culture, the Administration is committed to undertaking executive actions that will
attract and retain the best talent to the Federal
workforce and foster a culture of excellence. The
Budget supports efforts to reform the Senior
Executive Service (SES) and improve employee
engagement in order to fully capitalize on the talents in today’s Federal workforce at all levels, and
recruit and develop the talent needed to continue
moving the Federal Government forward in the
21st Century.
76
Leading America’s Workforce
More than half of the Government’s SES
leaders are currently eligible to retire, and that
number will rise to 64 percent by 2016. The impending SES “retirement wave” provides a unique
opportunity to train the next generation of leaders. Agencies are piloting a number of reforms to
transform the SES in preparation for 21st Century
service. For example, the current hiring process
for SES can now take almost a year to complete,
so one pilot currently underway looks at accelerating hiring speeds. Another pilot focuses on
new performance management measures and
onboarding procedures to better prepare SES for
their new positions and support top performers.
In addition, agencies are improving their recruitment techniques to ensure the SES cadre better
reflects the diversity of the workforce they lead
and the American people they serve. To achieve
these goals, the Budget proposes new funding for
the Office of Personnel Management (OPM) to
strengthen SES hiring and accountability.
The Administration has launched two new efforts that will start in 2015 and continue into
2016 to support SES reform:
White House Advisory Group. In order for
SES reform to be successful, it cannot happen
in a vacuum. Regular, high-quality feedback is
needed from senior executives, the people who
are both charged with implementing the reforms
and best positioned to evaluate their impact on
the ground. The White House Advisory Group on
SES Reform was established to provide that direct feedback and advice on the core components
of the Administration’s efforts to improve the
SES corps. The Advisory Group members were
selected by their agency leadership as examples
of highly effective SES, Senior Level, and Senior
Technical professionals, as well as some aspiring SES, and will provide a broad set of advice on
the current and future state of the senior career
leadership. They will be charged with helping
improve the way the Government recruits, hires,
develops, and retains senior career leaders. They
will also advise on effective performance management and accountability mechanisms for the
SES. The breadth of experience of this group, as
A GOVERNMENT OF THE FUTURE
well as its close connections to SES in the field,
will ensure we are getting the best ideas directly
from the front lines.
White House Leadership Development
Program. As part of the President’s continued commitment to training and developing the
Government’s high performers and strengthening
the next generation of SES, the Administration
is launching the White House Leadership
Development Program. Through this program,
top civil servants and SES candidates will participate in rotational assignments to drive
progress on Cross-Agency Priority (CAP) Goals
and lead change across Departments and programs. Participants in the program will gain
valuable experience by playing a key role in addressing critical management challenges facing
the Federal Government and will gain valuable
experience to bring back to their agencies.
Employee Engagement
In both the private and public sector, an
employee’s investment in the mission of their organization is closely related to the organization’s
overall performance. Engaged employees display
greater dedication, persistence, and effort in their
work, and better serve their customers—whether
they are consumers or taxpayers. This makes
employee engagement a critical performance measurement for Federal agencies. Overall, employee
engagement levels in Government are at 63 percent, below the private sector average. Further,
wide variation exists across and within agencies, including among organizations that perform
similar functions. The Administration is committed to strengthening employee engagement, and
aims to increase engagement levels to 67 percent
by 2016. However, there is no single solution that
will guarantee positive results. Rather, it takes
actions at all levels of an organization to achieve
these targets. Recent Budgets have invested
in OPM to enhance its ability to measure employee engagement, most notably by making the
Federal Employee Viewpoint Survey (EVS) an
annual survey. From the EVS, OPM derives the
Employee Engagement Index, which measures
employees’ attitudes toward office leadership,
77
THE BUDGET FOR FISCAL YEAR 2016
their supervisors, and their workplace experience.
This allows agency and administration leadership
to closely follow changes in employee engagement
Government-wide and within particular organizations. In 2014, OPM released UnlockTalent.
gov, a dashboard providing managers with deep
insight into the data from the EVS results of
21,000 organizations. These data help managers
see in minute detail their employees’ attitudes
toward issues such as leadership, training, and
promotion, allowing agency leaders to tailor strategic plans that specifically address employee
needs. The Budget funds tools to enhance the
value of the EVS through UnlockTalent.gov and
other mechanisms that communicate this critical information about the Federal workforce to a
wider audience.
In December 2014, the Directors of OMB, OPM,
and the White House Presidential Personnel
Office jointly issued a memorandum laying out
the annual cycle for strengthening employee engagement and linking employee engagement to
mission outcome. Moving forward, agency Chief
Human Capital Officers and other senior officials
will facilitate and ensure distribution of EVS
results to all executives, supervisors/managers,
and employees at the component and office level,
within three months of the survey completion
date. The Administration has also clarified the
roles and responsibilities of agency heads, Deputy
Secretaries, component heads, Chief Human
Capital Officers, Performance Improvement
Officers, SES, and others in advancing employee engagement. For example, component heads
will review progress on workforce improvement
efforts at least quarterly, and SES will begin to
have some aspects of employee feedback incorporated into their performance plans.
Encouraging an Agile Workforce
Part of successfully engaging with employees
is ensuring an agile Federal workforce that can
put its large store of talent to the best possible
use, whether that is within their own office or
agency, or to address critical problems at other
agencies. To support this and encourage an engaged and flexible workforce, the Administration
is building innovative tools to share talent
across agencies. For example, the GovConnect
workforce agility program allows managers to
find employees outside their agencies that have
the necessary skills to manage special projects.
With GovConnect, managers can assemble virtual teams to work on new projects, or manage
in the face of crisis. This project is being piloted
throughout 2014 and 2015, and agencies will
begin adapting successful pilot models for their
own mission needs in 2016.
IMPROVING RESULTS: SETTING GOALS AND TRACKING PERFORMANCE
Improving Performance and
Accountability
The Administration is executing the
Management Agenda through CAP goals, which
are focused on improving coordination across
multiple agencies to address key performance improvement priorities. The CAP goals are part of
the performance improvement framework developed with the Congress through the Government
Performance and Results Act (GPRA) and the
GPRA Modernization Act.
Performance for
each CAP goal is regularly tracked throughout
the year and goal teams are held accountable
for results, publishing quarterly updates on
Performance.gov. While impressive progress has
been seen on CAP goal priorities, overall performance delivery across agency boundaries remains a challenge, and in many cases
significant management improvements require
investments that cut across agencies and budget accounts. The Budget proposes authority for
the OMB Director, with prior notification to the
Congress, to transfer up to $15 million to support
these crosscutting management initiatives. This
proposal institutionalizes a capability to fund
cross-agency efforts, rather than handling the
challenges on a case-by-case basis. More details
about the Federal Government’s specific performance framework can be found on Performance.
gov and in the Analytical Perspectives volume of
78
A GOVERNMENT OF THE FUTURE
the Budget. The Government can and should be
more effective and efficient, and this proposal will
provide a powerful tool to turn management reform ideas into real and lasting results for the
American people.
for statistical purposes, Federal agencies have
made notable progress. However, significant
challenges remain, including the need to update
both the legal framework around data access and
many agencies’ data infrastructure.
Using Evidence and Evaluation to
Drive Innovation and Outcomes
The Budget addresses these challenges
through a series of initiatives. First, it proposes
immediate action to improve access to Federal
data sets, most notably national Unemployment
Insurance (UI) earnings data, while adhering to
a robust framework of privacy, confidentiality,
and security protections. Among other benefits,
expanding access to UI data will make it possible to create consistent employment outcome
“scorecards” for federally-subsidized job training providers, a goal of both the Administration’s
job training review and the bipartisan Workforce
Innovation and Opportunity Act. Earnings data
can also be used to rigorously evaluate the effects of other program changes and interventions
on employment, wages, and upward mobility.
Another Budget proposal would expand statistical agency access to business tax data, improving
the quality and consistency of economic statistics from the U.S. Census Bureau (Census), the
Bureau of Economic Analysis, and the Bureau
of Labor Statistics. Second, the Budget makes
data infrastructure investments at Census, the
Department of Education, and elsewhere. These
investments will allow the Federal Government
to measure outcomes and test new approaches
more easily and cheaply across a range of Federal
programs. For example, the Census investments
would help Census work with States to obtain access to data from State-administered programs,
such as the Supplemental Nutrition Assistance
Program (SNAP) or the Special Supplemental
Nutrition Program for Women, Infants, and
Children (WIC), allowing new analysis of how
these programs are used and their effects; Census
would also improve its infrastructure for linking
data sets together. Finally, the Budget embraces
a proposal by Representative Paul Ryan and
Senator Patty Murray to establish a Commission
on Evidence-Based Policymaking, which will advise the Congress on additional ways to improve
access to data, while protecting privacy.
There is growing momentum for evidencebased approaches at all levels of government. The
Administration’s embrace of evidence-based approaches has resulted in important gains in areas
ranging from reducing veterans’ homelessness, to
improving educational outcomes, to improving
the effectiveness of international development
programs. The Budget proposes to take additional evidence-based approaches to scale: for
example, providing unemployed workers with
reemployment services that have been shown to
speed job placement; serving substantially more
public housing residents through HUD’s JobsPlus program, which has been shown to boost
earnings; and making major investments in high
quality early education and quality child care,
which have been shown to significantly improve
children’s outcomes. In addition, Members of
Congress from both parties, visionary governors
and State legislatures, action-oriented mayors,
and the non-profit and research communities are
promoting greater use of data and research in
policymaking and program management.
To enable future administrations and the
Congress—as well as State and local leaders—to
drive even more resources to policies backed by
strong evidence, the Budget proposes a series of
legislative changes and investments to accelerate
learning about what programs work and why.
Improving Access to Administrative Data.
One major focus of the Budget is increasing
availability of data that the Government already
collects through administering programs—also
known as “administrative data”—to answer
important questions about the effectiveness
of Federal programs and policies. Through the
Administration’s Open Data Initiative and recent
efforts to increase the use of administrative data
79
THE BUDGET FOR FISCAL YEAR 2016
Coupling Flexibility with Accountability
to Learn What Works. The Budget expands
the use of innovative, outcome-focused grant
designs that focus Federal dollars on effective
practices while also encouraging innovation in
service delivery. As discussed in the Investing
in America’s Future chapter, a new initiative,
the Upward Mobility Project, will allow up to
10 communities, States, or consortia of States
and communities to combine funds from up to
four block grant programs currently designed to
promote opportunity and economic development.
Upward Mobility Projects would test and validate
promising and evidence-based approaches to help
families become more self-sufficient, improve
children’s outcomes, and revitalize communities
so they can provide more opportunities for their
residents. The Budget provides $1.5 billion in
additional competitive funding over five years
to help support Upward Mobility Projects. This
initiative builds on prior Administration evidence
building and place-based efforts by coupling
greater flexibility in a discrete set of grant
programs with requirements to utilize evidencebased strategies or rigorously test innovative
approaches to evaluate their effectiveness.
Consistent with the focus on linking flexibility
and accountability, the Budget would also authorize up to 10 new Performance Partnership Pilots
for Disconnected Youth. Building on provisions
included in 2014 and 2015 appropriations bills,
this would create a third round of pilots letting
States, localities, and Tribes blend funding and
receive waivers under multiple youth-serving
programs in order to build evidence about more
effective ways to help vulnerable youth.
Doubling Down on Evidence-Building
Efforts. The Budget also doubles down on
Administration evidence efforts that are starting
to produce results, such as “tiered evidence”
competitive grant programs. Tiered evidence
programs focus resources on practices with
strong evidence, promote innovation by providing
smaller grants to test new, promising ideas, and
build evidence on both existing and new practices.
The Budget provides significant funding for tiered
evidence programs and other efforts that seek to
expand our evidence base in important areas.
Examples of these efforts include:
•Innovating to Improve Education Outcomes.
The Budget invests $300 million for the
Investing in Innovation Fund (i3), more than
double the 2015 investment, to provide better
information to States and school districts
on what works in key K-12 education areas
such as implementing college- and careerready standards, improving low-performing
schools, and improving the performance of
students in science, technology, engineering,
and mathematics (STEM). The Budget also
triples funding to $200 million for First in
the World, which focuses on building the
evidence base in higher education, with
particular emphasis on college completion.
•Energy
Assistance Innovation Fund. The
Budget requests $200 million for a Low Income
Home Energy Assistance Program Innovation
Fund to support State and utility partnerships
that test innovative strategies for serving lowincome beneficiaries. The competitive funds
may include strategies related to reducing
energy burden, supporting more efficient and
clean energy sources, and improving households’ ability to pay utility costs.
•Using Data and Evidence to Reduce Global
Poverty. The Budget provides $1.25 billion
over two years for the Millennium Challenge
Corporation, which uses competition, evidence-based interventions, and evaluation
to target international aid funding to where
it can have the largest impact.
•Building
Evidence to Inform Conservation
Programs. The Budget includes $10 million
over two years to build evidence on the incremental effect incentive payments and outreach efforts have on farmers’ willingness to
adopt conservation practices and to leverage
data and evidence to improve the efficiency
of private lands conservation programs.
•Supporting
Federal
Employees
with
Innovative Ideas. At the Department of
Health and Human Services (HHS), the
“Idea Lab” provides the support, resources
80
A GOVERNMENT OF THE FUTURE
and recognition for agency employees with
promising new ideas for improving agency
functions to pilot and develop their proposals. Funding in the Budget would enable
the Departments of Commerce, Education,
the Treasury, GSA, and the Small Business
Administration (SBA) to create their own
versions of an Idea Lab to drive the development of a culture of innovation that yields
results.
The Budget also continues support for State
and local Pay for Success initiatives, where philanthropic and private investors provide up-front
financing for effective preventive services, and
Government pays only if and when results are
achieved. The Budget reproposes a $300 million
Pay for Success Incentive Fund at the Department
of the Treasury, similar to bipartisan legislation
introduced in the House and Senate last year.
It will encourage innovation and accelerate the
use of evidence-based approaches by lowering
and sharing the risk associated with initial private investments and by enabling State and local
governments to attract additional investment in
services that result in Federal, State, and local
government savings. The Budget also proposes
to allocate up to $64 million of appropriations for
the Departments of Education and Justice and
the Corporation for National and Community
Service to support their Pay for Success projects.
Increasing Federal Evaluation Capacity.
The Budget proposes significant increases in
evaluation capacity to support key priorities. The
Budget’s major investments in preschool and child
care are accompanied by more than $60 million
for early childhood research and evaluation at
HHS, the creation of a new National Education
Research and Development Center for early education, and the launch of a new round of the Early
Childhood Longitudinal Study focused on birth
to kindergarten entry, both at the Department of
Education. These investments will yield crucial
information on children’s early life experiences
and help determine which models and practices
are most effective at improving child outcomes. In
addition, the Administration’s Native youth initiative, “Generation Indigenous,” environmental
conservation initiatives, child support reforms,
and health proposals are paired with investments
in high-quality evaluation. The Budget also reproposes $400 million for the Social Security
Administration, in partnership with other Federal
agencies, to test innovative strategies to help
people with disabilities remain in the workforce.
Building on an initial $35 million provided for this
purpose in 2015, this proposal will help build the
evidence base for future program improvements.
The Budget also supports the expansion of
the White House Social and Behavioral Sciences
Team (SBST), which is coordinated by the Office
of Science and Technology Policy and based
at GSA. SBST is already helping over a dozen
Federal agencies test the impact of behaviorallyinformed interventions on program impact and
efficiency using rapid, rigorous, and low-cost randomized control trials. For example, SBST helped
the Department of Education to test alternative
approaches to informing student loan borrowers
about their repayment options. This expansion
will allow the team to recruit additional experts
and expand services to more agencies. Also, to
improve the quality of Federal evaluations and
reduce waste from inefficient procurement processes, the Budget provides expanded legislative
flexibilities for certain agencies to spend funds
over longer periods of time for evaluations and
surveys. These flexibilities will allow agencies to better target funds to reflect changing
circumstances on the ground.
81
THE BUDGET FOR FISCAL YEAR 2016
REORGANIZING GOVERNMENT: REFORMING THE GOVERNMENT TO WIN
IN THE GLOBAL ECONOMY
The President is renewing his request for the
Congress to revive the reorganization authority given to nearly every President from Herbert
Hoover to Ronald Reagan. This authority would
allow the Administration to submit plans to
consolidate and reorganize Executive Branch
Departments and agencies for fast track consideration by the Congress, but only so long as the
result would be to reduce the size of Government
or cut costs, a new requirement for this type of
authority.
The following represents an ambitious set of
cross-Government consolidations intended to
serve as a blueprint for reorganizing and reforming the Government. The Administration will
continue to work with the Congress and stakeholders to identify opportunities to make the
Government more efficient and effective.
Economic Competitiveness
As the President first indicated in 2012, if
he is given Presidential reorganization authority, he would propose to consolidate a number of
agencies and programs into a new department
focused on fostering economic growth and driving job creation. This proposal would consolidate
six primary business and trade agencies, as
well as other related programs, integrating the
Government’s core trade and competitiveness
functions into one new department. Specifically,
the department would include the Department of
Commerce’s core business and trade functions,
SBA, the Office of the U.S. Trade Representative,
the Export-Import Bank, the Overseas Private
Investment Corporation, and the U.S. Trade and
Development Agency.
By bringing together the core tools to expand
trade and investment, grow small businesses,
and support innovation, the new department
would coordinate these resources to maximize
the benefits for businesses and the economy.
With more effectively aligned and deployed
trade promotion resources, strengthened trade
enforcement capacity, streamlined export finance
programs, and enhanced focus on investment
in the United States, the Government could
more effectively implement a strong, pro-growth
trade policy. This reorganization would also
bring together the core tools to help American
businesses compete in the global economy,
expand exports, and create more jobs at home.
Businesses will more easily and seamlessly be
able to access services in support of exports,
domestic competitiveness, and job creation.
Absent this authority, the Administration has
already taken numerous steps to begin streamlining Federal trade, business, and export-related
programs. This includes initiatives simplifying
the export control system to improve the competitiveness of U.S. businesses while maintaining
strong national security protections; encouraging foreign investment into the United States;
providing a one-stop online platform consolidating information on business- and export-related
programs, resources, and services from across
the Federal Government; and improving the
ability of private companies to adapt Federal
research for use in the marketplace by increasing Government-private sector partnerships and
simplifying licensing procedures. Agencies have
also begun to reorganize business-related offices
and staff to maximize the effectiveness of limited Federal resources and focus on increasing
export opportunities for American businesses,
particularly small businesses.
Food Safety
While the U.S. food safety system is among
the safest in the world, consolidating food safety
functions is an essential step to reforming the
Federal food safety system overall. More than
a dozen agencies are involved in overseeing the
safety of the Nation’s food supply, implementing
at least 30 statutes governing some part of food
safety. The Department of Agriculture’s (USDA)
Food Safety and Inspection Service (FSIS) and
food safety-related components of the Food and
Drug Administration (FDA) at HHS represent
approximately 80 percent of the Nation’s total
82
food safety system, and exemplify the fragmented
Federal system. While FDA is responsible for most
foods, FSIS is responsible for meat and poultry.
While FSIS oversees processed egg products,
FDA oversees shell eggs. FDA is responsible for
seafood, but FSIS is responsible for catfish. FDA
and FSIS can each have jurisdiction over the
same category of food at different points in the
food chain: a cheese pizza and its ingredients
are regulated solely by FDA, but both agencies
play roles in regulating the components and
manufacturing of a pepperoni pizza.
FSIS
inspects manufacturers of packaged open-face
meat or poultry sandwiches, while FDA inspects
manufacturers of closed-face meat or poultry
sandwiches.
Under FSIS jurisdiction, meat and poultry
products must be approved prior to marketing,
requiring continuous, visual inspection. In contrast, FDA conducts risk-based inspections to
enforce prevention-oriented food safety standards.
Fractured oversight and disparate
regulatory approaches are confusing. This division of responsibilities was not deliberately
designed, but rather evolved as the Congress
passed laws to address specific food safety concerns. The Administration has taken the lead
on food safety issues. The Administration
partnered with the Congress to transform food
safety oversight, and the President signed into
law the Food Safety Modernization Act (FSMA),
which strengthened FDA’s mandate to set and
enforce modern standards for preventing food
safety problems, ensure the safety of imported
food, and make more effective, risk-based use of
resources. The FSMA provided FDA mandatory
recall authority, in addition to a number of new
authorities and enforcement tools, to strengthen
the ability to swiftly remove contaminated food
from the market.
Food safety and the prevention, mitigation,
and response to foodborne illness outbreaks
are public health concerns, consistent with the
larger mission of HHS. The Budget proposes
to consolidate the FSIS and the food safety related components of the FDA to create a single
new agency within HHS. This new agency
A GOVERNMENT OF THE FUTURE
would be independent from FDA and have primary responsibility for food safety inspections,
enforcement, applied research, and outbreak response and mitigation. The new agency would
be charged with pursuing a modern, sciencebased food safety regulatory regime drawing on
best practices of both agencies, with strong enforcement and recall mechanisms, expertise in
risk assessment, and enforcement and research
efforts across all food types based on scientifically supportable assessments of threats to public
health. The agency would also serve as the central point for coordinating with State and local
entities and food safety stakeholders.
A single Federal food safety agency would provide focused, centralized leadership, a primary
voice on food safety standards and compliance
with those standards, and clear lines of responsibility and accountability that will enhance both
prevention of and responses to outbreaks of foodborne illnesses. It would rationalize the food
safety regulatory regime and allow the Federal
Government to better allocate resources and
responsibilities.
Science, Technology, Engineering,
and Mathematics
The Nation’s competitiveness depends on the
ability to improve and expand STEM learning in
the United States. Over the past two years, the
Administration has made considerable progress
toward creating a more cohesive framework for
delivering STEM education. Guided by the Federal
STEM Education Five-Year Strategic Plan and a
significant reorganization of programs, agencies
are increasing coordination, strengthening
partnerships, and identifying ways to leverage
existing resources to improve the reach of agency
assets. The number of different STEM programs
has been cut from over 220 to just under 140. The
Budget builds on these efforts and continues to
reduce fragmentation, ensuring that investments
are aligned with the Strategic Plan and support
effective programs with strategic approaches
to evaluation. The Budget invests $3 billion in
113 programs including $200 million for K-12
education in the Department of Education’s
THE BUDGET FOR FISCAL YEAR 2016
Math and Science Partnerships, $338 million for
graduate fellowships, $62 million for graduate
traineeships, and $135 million for improving
undergraduate education at the NSF.
Reforming the Tennessee Valley Authority
Since its creation in the 1930s during the
Great Depression, the federally-owned and operated Tennessee Valley Authority (TVA) has been
producing electricity and managing natural resources for a large portion of the Southeastern
United States. TVA’s power service territory includes most of Tennessee and parts of Alabama,
Georgia, Kentucky, Mississippi, North Carolina,
and Virginia, covering 80,000 square miles and
serving more than nine million people. TVA is a
self-financing Government corporation, funding
operations through electricity sales and bond financing. Since the Administration announced
in the 2014 President’s Budget its intentions to
undertake a strategic review of options for addressing TVA’s financial situation, the agency has
taken significant steps to improve its operating
and financial performance and has committed
to resolve its capital financing constraints. The
Administration supports TVA’s ongoing initiatives
and will continue to monitor TVA’s performance,
including the achievement of critical milestones
contemplated in TVA’s long-term financial plan and
the pursuit of efforts to enhance governance and
increase transparency of TVA’s decision-making
on important agency actions. While the strategic
review of TVA has concluded, the Administration
continues to believe that reducing or eliminating the Federal Government’s role in programs
such as TVA, which have achieved their original
objectives, can help mitigate risk to taxpayers. Other Actions
In addition to the high-profile reforms
described above, the Budget highlights a wide va-
83
riety of agency-level reforms and reorganizations
designed to drive efficiency and accountability
across Government. For instance, the Budget
includes $200 million for GSA’s Consolidation
Activities program to fund small projects that
save money by reducing or economizing space
(as discussed earlier in this chapter), and $15
million for DOE’s Federal Energy Efficiency
Fund, which leverages Federal capital investments to increase renewable energy use and
decrease energy consumption across the Federal
Government. As in previous years, the Budget
proposes the National Preparedness Grant
Program, which would strengthen and consolidate the Federal Emergency Management
Agency’s current fragmented preparedness
grants into a streamlined program that emphasizes collaboration and reduces the burden on
State, local, and tribal partners. The Budget proposes reforms to the Senior Community Service
Employment Program to better target the program to those most in need, promote long-term
unsubsidized employment for program participants in the private sector, and drive improved
performance outcomes through competition. The
Department of Homeland Security again proposes to transfer the Emergency Food and Shelter
Program to HUD, reducing fragmentation and
synchronizing efforts to reduce homelessness.
The Department of Defense continues to pursue
efficiencies, including a 20-percent reduction to
management and headquarters staff, divestiture of legacy platforms no longer required to
execute the defense strategy, and ongoing efforts to shutter unneeded facilities, including
administrative actions and requested legislative
authority for another round of Base Realignment
and Closure. Taken together with the largerscale reorganization proposals, these efforts
represent the President’s ongoing commitment
to promoting Government efficiency, preventing duplication, and making Government work
better and smarter for the American people.
CUTS, CONSOLIDATIONS, AND SAVINGS
As part of the President’s Management Agenda, the Administration will continue to build
upon successful efforts to maximize the value of
every taxpayer dollar by enhancing productivity
and efficiency and achieving cost savings across
the Government.
Consistent with the Management Agenda,
the Budget continues efforts such as reducing
administrative overhead, increasing the use of
shared services, increasing strategic sourcing
and category management, cutting improper
payments, saving on real estate costs, reforming military acquisition, and consolidating data
centers.
The Budget also continues efforts to reorganize
and consolidate Federal programs to reduce duplication and improve efficiency. The President
is renewing his request for the Congress to revive the reorganization authority given to nearly
every President from Herbert Hoover to Ronald
Reagan. In effect, the President is asking to have
the same authority that any business owner has
to reorganize or streamline operations to meet
changing circumstances and customer demand.
The Budget outlines a set of ambitious crossGovernment consolidations intended to serve as
a blueprint for reorganizing and reforming Government, including consolidating the six primary
business and trade agencies into a single agency
responsible for fostering economic growth; combining the two largest food-safety related agencies into a single agency responsible for inspections, enforcement, and outbreak prevention; and
continuing efforts to streamline science, technology, engineering, and mathematics (STEM)
programs across Government.
85
Further detail on all of these initiatives is provided in the chapter titled A Government of the
Future.
The Budget also continues to target unnecessary
or lower priority programs for reduction or elimination. In the President’s first six Budgets, the Administration identified, on average, more than 150 cuts,
consolidations, and savings averaging more than
$23 billion each year. Many of these proposals have
now been implemented, and the Budget builds on
this success by including 101 cuts, consolidations,
and savings proposals projected to save over $14
billion in 2016. While the Budget proposes increases in discretionary budget caps to make room for a
range of domestic and security investments, it still
includes discretionary cuts, consolidations, and savings proposals totaling $3.6 billion to further make
room for investments to help move the Nation forward. Savings from mandatory and program integrity proposals total $10.6 billion in 2016 and $609
billion over 10 years; about 70 percent of these savings are from health reform proposals. The Budget
shows that we can avoid the harmful spending cuts
known as sequestration, and instead invest in economic growth, mobility, and national security, while
still putting the Nation on a sustainable fiscal path.
Overall the Budget achieves about $1.8 trillion in
deficit reduction, primarily from reforms in health
programs, the tax code, and immigration.
Discretionary and mandatory cuts, consolidations, and savings proposals in this year’s Budget
are detailed on the following tables. Savings from
the Administration’s program integrity proposals,
totaling $110 billion through 2025, are detailed
in the Budget Process chapter of the Analytical
Perspectives volume.
86
CUTS, CONSOLIDATIONS, AND SAVINGS
Discretionary Cuts, Consolidations, and Savings
(Budget authority in millions of dollars)
2015
2016 Change
from 2015
2016
Cuts
317 Immunization Program, Department of Health and Human Services �������������������������������������������������������������������������������������������
Access to Recovery, Department of Health and Human Services ������������������������������������������������������������������������������������������������������
Area Health Education Centers, Department of Health and Human Services ������������������������������������������������������������������������������������
Beach Grants, Environmental Protection Agency �������������������������������������������������������������������������������������������������������������������������������
Centers for Disease Control and Prevention, Direct Healthcare Screenings, Department of Health and Human Services ����������������
Clean Water and Drinking Water State Revolving Funds (SRFs), Environmental Protection Agency �������������������������������������������������
Community Development Block Grant - Formula Funds, Department of Housing and Urban Development �������������������������������������
Community Economic Development Program, Department of Health and Human Services1 �������������������������������������������������������������
Diesel Emissions Reduction Grant Program, Environmental Protection Agency1 �������������������������������������������������������������������������������
Divestiture of the A–10 Fleet, Department of Defense ������������������������������������������������������������������������������������������������������������������������
Economic Impact Grants, Department of Agriculture1 �������������������������������������������������������������������������������������������������������������������������
Education Research Centers and Agricultural Research, Department of Health and Human Services1 ���������������������������������������������
Federal Prisoner Detention, Department of Justice1 ����������������������������������������������������������������������������������������������������������������������������
Foreign Military Financing, Department of State ���������������������������������������������������������������������������������������������������������������������������������
Global Fund to Fight AIDS, Tuberculosis, and Malaria, Department of State ��������������������������������������������������������������������������������������
Grants for Abstinence-Only Programs, Department of Health and Human Services ��������������������������������������������������������������������������
Grants-In-Aid for Airports, Department of Transportation1 �������������������������������������������������������������������������������������������������������������������
Great Lakes Restoration Initiative, Environmental Protection Agency ������������������������������������������������������������������������������������������������
Harry S. Truman Scholarship Foundation ��������������������������������������������������������������������������������������������������������������������������������������������
Health Care Services Grant Program, Department of Agriculture1 ������������������������������������������������������������������������������������������������������
Health Information Technology Research, Department of Health and Human Services ���������������������������������������������������������������������
High Energy Cost Grants, Department of Agriculture1 �������������������������������������������������������������������������������������������������������������������������
High Intensity Drug Trafficking Areas, Office of National Drug Control Policy 1 ������������������������������������������������������������������������������������
Impact Aid - Payments for Federal Property, Department of Education1 ���������������������������������������������������������������������������������������������
Innovative Approaches to Literacy (in Funds for the Improvement of Education Programs of National Significance), Department of
Education1 ���������������������������������������������������������������������������������������������������������������������������������������������������������������������������������������
International Forestry, Department of Agriculture1 �������������������������������������������������������������������������������������������������������������������������������
International Narcotics Control and Law Enforcement, Department of State ��������������������������������������������������������������������������������������
Joint Standoff Weapon (JSOW), Department of Defense �������������������������������������������������������������������������������������������������������������������
Low Priority Studies and Construction, Corps of Engineers ����������������������������������������������������������������������������������������������������������������
Mutual Self-Help Housing Grants, Department of Agriculture �������������������������������������������������������������������������������������������������������������
National Heritage Areas, Department of the Interior1 ��������������������������������������������������������������������������������������������������������������������������
National Wildlife Refuge Fund, Department of the Interior1 �����������������������������������������������������������������������������������������������������������������
Operation and Maintenance Work, Corps of Engineers ����������������������������������������������������������������������������������������������������������������������
Preventive Health and Health Services Block Grant, Department of Health and Human Services1 ����������������������������������������������������
PRIME Technical Assistance, Small Business Administration1 ������������������������������������������������������������������������������������������������������������
REACH, Department of Health and Human Services �������������������������������������������������������������������������������������������������������������������������
Research, Education and Extension Grants, Department of Agriculture:
611
38
30
10
263
2,356
3,000
30
30
810
10
51
1,407
5,881
1,350
5
3,350
300
1
3
28
10
245
67
561
.........
.........
.........
209
2,302
2,800
.........
10
428
.........
.........
1,384
5,807
1,107
.........
2,900
250
.........
.........
23
.........
193
.........
–50
–38
–30
–10
–55
–54
–200
–30
–20
–382
–10
–51
–23
–74
–244
–5
–450
–50
–1
–3
–5
–10
–52
–67
25
8
1,296
108
1,762
25
20
13
2,909
160
5
51
.........
4
1,194
21
1,269
10
11
.........
2,710
.........
.........
.........
–25
–4
–102
–87
–493
–15
–9
–13
–199
–160
–5
–51
Animal Health (Sec. 1433)1 �������������������������������������������������������������������������������������������������������������������������������������������������������������
4
.........
–4
Capacity Building: Non-Land Grant Colleges1 ��������������������������������������������������������������������������������������������������������������������������������
5
.........
–5
Farm Business Management and Benchmarking1 ��������������������������������������������������������������������������������������������������������������������������
1
.........
–1
Food Animal Residue Avoidance Database1 �����������������������������������������������������������������������������������������������������������������������������������
1
.........
–1
Methyl Bromide Transition Program1 �����������������������������������������������������������������������������������������������������������������������������������������������
2
.........
–2
Potato Breeding Research (Competitive) ���������������������������������������������������������������������������������������������������������������������������������������
1
.........
–1
Rural Health and Safety1 �����������������������������������������������������������������������������������������������������������������������������������������������������������������
2
.........
–2
Sungrants1 ��������������������������������������������������������������������������������������������������������������������������������������������������������������������������������������
3
.........
–3
Supplemental and Alternative Crops1 ���������������������������������������������������������������������������������������������������������������������������������������������
1
5
.........
.........
–1
–5
1
Rural Access to Emergency Devices, Department of Health and Human Services ����������������������������������������������������������������������������
87
THE BUDGET FOR FISCAL YEAR 2016
Discretionary Cuts, Consolidations, and Savings—Continued
(Budget authority in millions of dollars)
2015
2016 Change
from 2015
2016
Rural Community Facilities, Department of Health and Human Services1 ������������������������������������������������������������������������������������������
Rural Hospital Flexibility Grant Programs, Department of Health and Human Services ���������������������������������������������������������������������
Rural Multifamily Housing Preservation Grants, Department of Agriculture1 ���������������������������������������������������������������������������������������
State Criminal Alien Assistance Program, Department of Justice �������������������������������������������������������������������������������������������������������
State Indoor Radon Grant Program, Environmental Protection Agency ���������������������������������������������������������������������������������������������
Targeted Airshed Grants, Environmental Protection Agency ���������������������������������������������������������������������������������������������������������������
Urban and Community Forestry, Department of Agriculture ����������������������������������������������������������������������������������������������������������������
Water and Wastewater and Community Facilities Loan Guarantees, Department of Agriculture1 �������������������������������������������������������
Water Quality Research and Support Grants, Environmental Protection Agency1 ������������������������������������������������������������������������������
Women in Apprenticeship in Non-Traditional Occupations, Department of Labor1 ������������������������������������������������������������������������������
7
42
4
185
9
10
28
4
17
1
.........
26
.........
.........
.........
.........
24
.........
.........
.........
–7
–16
–4
–185
–9
–10
–4
–4
–17
–1
Total, Discretionary Cuts ������������������������������������������������������������������������������������������������������������������������������������������������������������������
26,600
23,242
–3,358
1,266
1,043
–223
Department of Agriculture - 4 Programs �������������������������������������������������������������������������������������������������������������������������������
[11]
.........
Department of Commerce - 6 Programs �������������������������������������������������������������������������������������������������������������������������������
[14]
.........
Department of Defense - 1 Program �������������������������������������������������������������������������������������������������������������������������������������
[25]
.........
Department of Energy - 2 Programs �������������������������������������������������������������������������������������������������������������������������������������
[5]
.........
Department of Health and Human Services - 2 Programs ����������������������������������������������������������������������������������������������������
[15]
.........
Environmental Protection Agency - 2 Programs ��������������������������������������������������������������������������������������������������������������������
[11]
.........
National Science Foundation - 1 Program �����������������������������������������������������������������������������������������������������������������������������
[6]
.........
Nuclear Regulatory Commission - 2 Programs ���������������������������������������������������������������������������������������������������������������������
[15]
40
.........
.........
20
[139]
Consolidations
National Preparedness Grant Program (NPGP), Department of Homeland Security �������������������������������������������������������������������������
Science, Technology, Engineering, and Mathematics (STEM) Reorganization, Multi-Agency
Consolidated and Eliminated Programs Total - 20 Programs
Section 4 and Rural Capacity Building, Department of Housing and Urban Development �����������������������������������������������������������������
Teacher and Principal Pathways, Department of Education ���������������������������������������������������������������������������������������������������������������
Transition to Teaching ���������������������������������������������������������������������������������������������������������������������������������������������������������������������
–20
[14]
.........
School Leadership ��������������������������������������������������������������������������������������������������������������������������������������������������������������������������
[16]
.........
Teacher Quality Partnerships ����������������������������������������������������������������������������������������������������������������������������������������������������������
[41]
.........
Total, Discretionary Consolidations ������������������������������������������������������������������������������������������������������������������������������������������������
1,306
1,063
–243
Office of National Drug Control Policy, Executive Office of the President �������������������������������������������������������������������������������������������
Senate Campaign Finance Reports Electronic Submission, Federal Election Commission ��������������������������������������������������������������
23
.........
20
.........
–3
.........
Total, Discretionary Savings �������������������������������������������������������������������������������������������������������������������������������������������������������������
23
20
–3
Total, Discretionary Cuts, Consolidations, and Savings ���������������������������������������������������������������������������������������������������������������
27,929
24,325
–3,604
Savings
1
This cut has been identified as a lower priority program activity for purposes of the GPRA Modernization Act, at 31 U.S.C. 1115(b)(10). Additional information regarding
this proposed cut is included in the respective agency’s Congressional Justification submission, where applicable.
88
CUTS, CONSOLIDATIONS, AND SAVINGS
Mandatory Cuts and Savings
(Outlays and receipts in millions of dollars)
2016
2017
2018
2019
2020
2016–2020 2016–2025
Cuts
Coal Tax Preferences, Department of Energy
Domestic Manufacturing Deduction for Hard Mineral Fossil Fuels1 �����������������������
–45
–48
–50
–53
–54
–250
Expensing of Exploration and Development Costs1 ����������������������������������������������
–40
–68
–70
–74
–77
–329
–694
Percent Depletion for Hard Mineral Fossil Fuels1 ��������������������������������������������������
–183
–299
–288
–278
–266
–1,314
–2,450
Royalty Taxation1 ���������������������������������������������������������������������������������������������������
–27
–1,129
–4
–54
–1,374
–4
–53
–1,560
–4
–54
–1,614
–5
–55
–1,650
–5
–243
–7,327
–22
–547
–15,999
–47
.........
.........
–367
–375
–376
–1,118
–3,069
Crop Insurance Program, Department of Agriculture ��������������������������������������������������
Geothermal Payments to Counties, Department of the Interior2 ���������������������������������
Gulf of Mexico Energy Security Act (GOMESA) Payments to States, Department of
the Interior2 �������������������������������������������������������������������������������������������������������������
Oil and Gas Company Tax Preferences, Department of Energy
–561
Increase Geological and Geophysical Amortization Period for Independent
Producers to Seven Years1 �������������������������������������������������������������������������������
–91
–341
–537
–532
–440
–1,941
–2,876
Repeal Credit for Oil and Gas Produced from Marginal Wells1 �����������������������������
.........
.........
.........
.........
.........
.........
.........
Repeal Deduction for Tertiary Injectants1 ��������������������������������������������������������������
–7
–10
–10
–10
–10
–47
–97
Repeal Domestic Manufacturing Tax Deduction for Oil and Natural Gas
Companies1 ������������������������������������������������������������������������������������������������������
–647
–1,115
–1,139
–1,173
–1,208
–5,282
–11,904
Repeal Enhanced Oil Recovery Credit1 �����������������������������������������������������������������
.........
.........
.........
.........
.........
.........
.........
Repeal Exception to Passive Loss Limitations for Working Interests in Oil and
Natural Gas Properties1 ������������������������������������������������������������������������������������
–9
–17
–19
–20
–20
–85
–185
Repeal Expensing of Intangible Drilling Costs �����������������������������������������������������
–2,267
–3,182
–2,351
–1,867
–1,566
–11,233
–15,495
Repeal Percentage Depletion for Oil and Natural Gas Wells1 �������������������������������
Offset Disability Benefits for Period of Concurrent Unemployment Insurance Receipt2 �����
Unrestricted Abandoned Mine Lands Payments, Department of the Interior2 �������������
–1,118
.........
–48
–1,790
–35
–35
–1,669
–172
–28
–1,585
–253
–34
–1,498
–252
–36
–7,660
–712
–181
–13,253
–2,019
–295
Total, Mandatory Cuts �����������������������������������������������������������������������������������������������
–5,615
–8,372
–8,317
–7,927
–7,513
–37,744
–69,491
–19
–9
–14
–21
–29
–92
–336
1
Savings
FECA Reform, Department of Labor ��������������������������������������������������������������������������
Federal Employee Health Benefits Program Reforms, Office of Personnel
Management �����������������������������������������������������������������������������������������������������������
Health Care (Medicaid Proposals), Department of Health and Human Services ��������
Health Care (Pharmaceuticals), Department of Health and Human Services3 �����������
Medicare Provider Payment Modifications, Department of Health and Human
Services3, 4 �������������������������������������������������������������������������������������������������������������
.........
–582
–810
–57
–857
–840
–139
–917
–1,020
–187
–962
–1,350
–238
–1,012
–1,630
–621
–4,328
–5,650
–2,987
–13,895
–16,040
–3,640
–12,420
–22,460
–28,000
–35,170
–101,690
–396,959
Total, Mandatory Savings �����������������������������������������������������������������������������������������
–5,051
–14,183
–24,550
–30,520
–38,079
–112,381
–430,217
Total, Mandatory Cuts and Savings �������������������������������������������������������������������������
–10,666
–22,555
–32,867
–38,447
–45,592
–150,125
–499,708
1
2
3
4
This cut has been identified as a lower priority program activity for purposes of the GPRA Modernization Act, at 31 U.S.C. 1115(b)(10). Additional information regarding
this proposed cut is included in the Governmental Receipts chapter of the Analytical Perspectives volume.
This cut has been identified as a lower priority program activity for purposes of the GPRA Modernization Act, at 31 U.S.C. 1115(b)(10). Additional information regarding
this proposed cut is included in the respective agency’s Congressional Justification submission, where applicable.
Medicare savings estimates do not include interactions.
In addition to the savings reported on this table, the Budget includes investments to reform Medicare physician payments and improve access to inpatient psychiatric
facility services, as well as an additional $83.8 billion in 10-year savings for Medicare Structural Reforms, as detailed on table S–9.
SUMMARY TABLES
89
4,653
518
4,135
4,886
554
4,332
2020
5,126
600
4,525
2021
5,372
626
4,746
2022
5,621
635
4,986
2023
5,875
639
5,236
2024
17.5%
20.3%
2.8%
74.1%
66.4%
Receipts ����������������������������������������������������������
Outlays �����������������������������������������������������������
Deficit �������������������������������������������������������
Debt held by the public ����������������������������������
Debt net of financial assets ���������������������������
Budget Totals as a Percent of GDP:
66.9%
75.1%
20.9%
3.2%
17.7%
66.5%
75.0%
21.3%
2.5%
18.7%
65.8%
74.6%
21.4%
2.3%
19.1%
65.3%
74.3%
21.5%
2.3%
19.1%
64.9%
74.1%
21.6%
2.4%
19.2%
64.6%
74.0%
21.7%
2.5%
19.3%
64.5%
74.0%
21.9%
2.6%
19.3%
64.4%
73.9%
21.9%
2.6%
19.4%
64.2%
73.7%
22.0%
2.5%
19.5%
63.9%
73.5%
22.0%
2.4%
19.6%
20162020
20162025
Totals
63.7%
73.3%
22.2%
2.5%
19.7%
21.5%
2.4%
19.1%
21.7%
2.5%
19.3%
6,165 22,180 50,338
687 2,488 5,674
5,478 19,692 44,664
2025
17,244 17,985 18,819 19,709 20,617 21,540 22,476 23,454 24,474 25,539 26,649 27,808
4,423
479
3,944
2019
Gross domestic product (GDP) ���������������������������
4,218
463
3,755
2018
11,455 12,038 12,512 12,974 13,453 13,970 14,524 15,124 15,749 16,384 17,022 17,709
3,999
474
3,525
2017
Debt net of financial assets ���������������������������
3,759
583
3,176
2016
12,780 13,506 14,108 14,705 15,315 15,959 16,635 17,349 18,085 18,830 19,577 20,371
3,506
485
Outlays �����������������������������������������������������������
Deficit �������������������������������������������������������
2015
Debt held by the public ����������������������������������
3,021
Receipts ����������������������������������������������������������
Budget Totals in Billions of Dollars:
2014
Table S–1. Budget Totals
(In billions of dollars and as a percent of GDP)
THE BUDGET FOR FISCAL YEAR 2016
91
535
*
–9
–6
–6
–*
.........
–4
.........
.........
–*
–1
.........
.........
.........
.........
–1
1
*
*
5
.........
.........
*
5
4
–*
.........
Total, tax reforms and investments to support working
families �����������������������������������������������������������������������������������
Additional investments in growing the economy and creating
opportunity:
Surface transportation reauthorization ����������������������������������������
Transition revenue from business tax reform 4 ������������������������������
Investments in early education and children’s health 5 ���������������
Tobacco tax financing ���������������������������������������������������������������������
Additional investments in education, innovation, infrastructure,
and security ���������������������������������������������������������������������������������
Additional mandatory and tax proposals ��������������������������������������
Debt service ������������������������������������������������������������������������������������
Total, additional investments ���������������������������������������������������
Additional deficit reduction from health, tax, and
immigration reform:
Health savings 6 ������������������������������������������������������������������������������
Reforms to high-income tax expenditures 7 �����������������������������������
Immigration reform �����������������������������������������������������������������������
Debt service ������������������������������������������������������������������������������������
Total, additional deficit reduction ��������������������������������������������
Subtotal, tax reforms, investments, and additional deficit
reduction �����������������������������������������������������������������������������������
Other changes to deficits:
Reductions in Overseas Contingency Operations �������������������������
Replacement of mandatory sequestration �������������������������������������
–11
11
–63
–23
6
–35
6
–*
–33
–*
37
–30
*
–8
3
–35
–8
3
.........
2
10
2.8%
3
Percent of GDP ����������������������������������������������������������������������������������������
2016
Proposals in the 2016 Budget: Tax reforms and investments to support working families:
Middle-class and pro-work tax reforms �����������������������������������������
Child care for all low- and moderate-income families with young
children ����������������������������������������������������������������������������������������
Partner with States to provide tuition-free quality community
college ������������������������������������������������������������������������������������������
Capital gains tax reform �����������������������������������������������������������������
Financial fee ������������������������������������������������������������������������������������
Proposals to address high-income tax avoidance 3 �������������������������
Debt service �������������������������������������������������������������������������������������
578
3.2%
Projected deficits in the adjusted baseline 1 �������������������������������������
2015
–29
18
–75
–54
–6
–46
–1
–1
–12
–1
54
–12
5
–11
10
–56
–9
1
–21
–11
–8
–*
4
26
2.8%
547
2017
–41
18
–58
–82
–17
–52
–10
–3
28
–1
56
15
8
–11
15
–54
–4
2
–18
–11
–9
–1
5
28
2.7%
556
2018
–48
19
–121
–106
–26
–58
–15
–7
–9
–1
56
–28
10
–11
17
–52
–6
3
–21
–11
–9
–1
6
28
3.1%
666
2019
–51
20
–152
–127
–35
–63
–17
–11
–22
–1
48
–33
8
–10
18
–50
–4
5
–22
–11
–10
–1
7
28
3.3%
739
2020
(Deficit increases (+) or decreases (–) in billions of dollars)
–53
21
–149
–147
–45
–68
–18
–16
–1
–2
40
–38
10
–10
19
–20
–1
6
–22
–12
–10
–1
8
29
3.3%
785
2021
–71
21
–268
–169
–54
–72
–20
–22
–100
–4
–20
–93
11
–9
16
.........
1
8
–22
–12
–11
–1
9
31
3.9%
947
2022
–81
27
–278
–193
–64
–77
–23
–29
–88
–7
–47
–46
12
–9
10
.........
3
9
–23
–12
–12
–1
11
31
3.8%
973
2023
Table S–2. Effect of Budget Proposals on Projected Deficits
–85
29
–278
–223
–75
–82
–29
–37
–62
–10
–59
–2
12
–8
6
.........
6
12
–24
–13
–13
–1
12
32
3.7%
981
2024
–87
1
–367
–249
–86
–86
–31
–46
–127
–13
–68
–53
11
–8
4
.........
10
13
–25
–13
–12
–1
14
33
4.1%
1,151
2025
–402
–638
–158
–173
–425
–39
96
–322
88
–95
116
–268
–13
60
–208
–112
–101
–8
78
277
3.4%
7,880
–180
86
–557
185
–470 –1,809
–391 –1,371
–78
–253
–37
–22
–48
–4
252
–89
31
–51
61
–248
–31
12
–91
–50
–42
–3
24
120
2.9%
3,044
2016–
2025
Totals
2016–
2020
92
SUMMARY TABLES
*
4
583
3.2%
Total, other changes to deficits �������������������������������������������������
Total proposals in the 2016 Budget ����������������������������������������
Resulting deficits in 2016 Budget �������������������������������������������������������
Percent of GDP ����������������������������������������������������������������������������������������
3
2
*
2.5%
474
–61
2016
2.3%
463
–84
–9
3
–*
2017
2.3%
479
–77
–20
3
–1
2018
2.4%
518
–148
–28
3
–1
2019
2.5%
554
–185
–33
1
–2
2020
2.6%
600
–184
–35
1
–4
2021
2.6%
626
–321
–54
1
–5
2022
2.5%
635
–338
–60
1
–7
2023
2.4%
639
–343
–65
1
–10
2024
2.5%
687
–464
–97
1
–13
2025
–397
18
–43
2016–
2025
2.4%
2,488
2.5%
5,674
–556 –2,206
–86
12
–4
2016–
2020
Totals
Debt held by the public in the 2016 Budget ��������������������������������� 13,506 14,108 14,705 15,315 15,959 16,635 17,349 18,085 18,830 19,577 20,371
Percent of GDP �������������������������������������������������������������������������������� 75.1% 75.0% 74.6% 74.3% 74.1% 74.0% 74.0% 73.9% 73.7% 73.5% 73.3%
* $500 million or less.
1
See Tables S–4 and S–7 for information on the adjusted baseline.
2
For total deficit reduction since January 2011, see Table S–3.
3
Includes proposals to limit the total accrual of tax-favored retirement benefits and conform SECA taxes for professional service businesses.
4
Business tax reform transition revenue finances the $126.5 billion in budget authority for new surface transportation investments (the PAYGO portion of the
reauthorization proposal) plus $111.9 billion of cash transfers necessary to ensure Transportation Trust Fund solvency for all programs proposed to be funded via the
Transportation Trust Fund over the six-year reauthorization period, leaving an additional $29.7 billion for deficit reduction.
5
Includes proposals to support Preschool for All, extend the Maternal, Infant, and Early Childhood Home Visiting program, and extend CHIP funding through 2019.
6
Includes all HHS health savings and OPM FEHBP savings.
7
Includes proposals to reduce the value of certain tax expenditures and implement the Buffett Rule by imposing a new “Fair Share Tax.”
Memorandum:
Debt held by the public in the adjusted baseline ������������������������ 13,502 14,159 14,828 15,505 16,286 17,134 18,018 19,066 20,140 21,216 22,459
Percent of GDP �������������������������������������������������������������������������������� 75.1% 75.2% 75.2% 75.2% 75.6% 76.2% 76.8% 77.9% 78.9% 79.6% 80.8%
*
*
Proposed Budget Control Act cap adjustment for disaster relief
and wildfires ��������������������������������������������������������������������������������
Debt service and indirect interest effects �������������������������������������
2015
(Deficit increases (+) or decreases (–) in billions of dollars)
Table S–2. Effect of Budget Proposals on Projected Deficits—Continued
THE BUDGET FOR FISCAL YEAR 2016
93
–3,355
–532
–185
–172
–888
–4,243
Subtotal, enacted deficit reduction excluding pending Joint Committee enforcement �����������������������������
Pending Joint Committee enforcement: 2
Discretionary cap reductions �����������������������������������������������������������������������������������������������������������������������������
Mandatory sequestration �����������������������������������������������������������������������������������������������������������������������������������
Debt service �������������������������������������������������������������������������������������������������������������������������������������������������������
Subtotal, pending Joint Committee enforcement ����������������������������������������������������������������������������������������
Total, deficit reduction achieved, excluding OCO ���������������������������������������������������������������������������������������������
–8
–13
Debt service ����������������������������������������������������������������������������������������������������������������������������������������������������������������
Total, tax reforms and investments to support working families ��������������������������������������������������������������������
–39
–425
Debt service ����������������������������������������������������������������������������������������������������������������������������������������������������������������
Total, additional investments ����������������������������������������������������������������������������������������������������������������������������
–402
–638
–158
–173
–1,371
–1,809
185
18
41
244
–5,808
Health savings �����������������������������������������������������������������������������������������������������������������������������������������������������������
Reforms to high-income tax expenditures ����������������������������������������������������������������������������������������������������������������
Immigration reform ���������������������������������������������������������������������������������������������������������������������������������������������������
Debt service ����������������������������������������������������������������������������������������������������������������������������������������������������������������
Total, additional deficit reduction ���������������������������������������������������������������������������������������������������������������������
Subtotal, tax reforms, investments, and additional deficit reduction �����������������������������������������������������������
Other changes to deficits: 1
Replacement of mandatory sequestration ����������������������������������������������������������������������������������������������������������������
Proposed Budget Control Act cap adjustment for disaster relief and wildfires ����������������������������������������������������
Debt service and indirect interest effects �����������������������������������������������������������������������������������������������������������������
Total, other changes to deficits ��������������������������������������������������������������������������������������������������������������������������
Grand total, achieved and proposed deficit reduction excluding OCO ��������������������������������������������������������
Additional deficit reduction from health, tax, and immigration reform:
–386
Investment proposals and offsets 4 ���������������������������������������������������������������������������������������������������������������������������
Additional investments in growing the economy and creating opportunity:
–5
Tax reform and investment proposals 3 ��������������������������������������������������������������������������������������������������������������������
Tax reforms and investments to support working families:
–1,634
–97
–776
–848
2016–2025
Enacted deficit reduction excluding pending Joint Committee enforcement:
Discretionary savings 1 ��������������������������������������������������������������������������������������������������������������������������������������
Mandatory savings ���������������������������������������������������������������������������������������������������������������������������������������������
Revenues ������������������������������������������������������������������������������������������������������������������������������������������������������������
Debt service �������������������������������������������������������������������������������������������������������������������������������������������������������
Deficit reduction achieved through January 2015, excluding Overseas Contingency Operations
(OCO):
(Deficit reduction (–) or increase (+) in billions of dollars)
Table S–3. Cumulative Deficit Reduction
94
SUMMARY TABLES
–2,212
–158
Immigration reform ���������������������������������������������������������������������������������������������������������������������������������������������������
–1,016
–557
–354
–1,927
Enacted reduction in OCO funding ��������������������������������������������������������������������������������������������������������������������������
Proposed reductions in OCO �������������������������������������������������������������������������������������������������������������������������������������
Debt service ����������������������������������������������������������������������������������������������������������������������������������������������������������������
Total, savings in overseas contingency operations (OCO) �������������������������������������������������������������������������������
1
Excludes savings from reductions in OCO.
2
Consists of mandatory sequestration for 2016–2024 and discretionary cap reductions for 2016–2021.
3
See Table S–2 for details on tax reform and investment proposals.
4
See Table S–2 for details on additional investment proposals.
Memorandum, savings in Overseas Contingency Operations (OCO):
–3,438
Enacted receipt increases and 2016 Budget tax proposals �������������������������������������������������������������������������������������
2016–2025
Enacted outlay reductions and 2016 Budget spending proposals ��������������������������������������������������������������������������
Memorandum, revenue and outlay effects of achieved and proposed deficit reduction:
(Deficit reduction (–) or increase (+) in billions of dollars)
Table S–3. Cumulative Deficit Reduction—Continued
THE BUDGET FOR FISCAL YEAR 2016
95
891
529
329
627
2,375
845
505
301
504
2,156
229
.........
.........
3,506
Subtotal, mandatory programs ������
Net interest ��������������������������������������������������
Adjustments for disaster costs 2 �������������������
Joint Committee enforcement 3 �������������������
Total outlays �����������������������������������������
1,395
321
736
224
55
9
93
19
34
99
37
3,021
485
229
256
514
–30
Individual income taxes �������������������������������
Corporation income taxes ����������������������������
Social insurance and retirement receipts:
Social Security payroll taxes ���������������
Medicare payroll taxes �������������������������
Unemployment insurance ��������������������
Other retirement ����������������������������������
Excise taxes ��������������������������������������������������
Estate and gift taxes ������������������������������������
Customs duties ���������������������������������������������
Deposits of earnings, Federal Reserve
System ������������������������������������������������������
Other miscellaneous receipts ����������������������
Total receipts ����������������������������������������
Deficit ��������������������������������������������������������������
Net interest ��������������������������������������������������
Primary deficit �����������������������������������������
On-budget deficit ������������������������������������������
Off-budget deficit / surplus (–) ���������������������
Receipts:
1,147
1,121
Subtotal, appropriated programs ���
Mandatory programs:
Social Security ��������������������������������������
Medicare �����������������������������������������������
Medicaid ������������������������������������������������
Other mandatory programs �����������������
–12
590
349
229
578
45
3,175
94
37
20
96
766
234
56
9
342
1,477
.........
3,753
2
229
589
558
2015
596
525
Appropriated (“discretionary”) programs:
Defense �������������������������������������������������
Non-defense ������������������������������������������
Outlays:
2014
3
532
251
283
535
43
3,430
77
39
21
100
797
244
55
9
433
1,610
–67
3,964
6
283
2,548
938
585
344
680
1,194
631
563
2016
12
535
183
364
547
59
3,577
48
42
23
105
839
257
54
10
434
1,707
–97
4,124
8
364
2,623
991
596
364
672
1,227
659
568
2017
30
527
127
429
556
58
3,743
39
45
24
107
880
270
53
11
441
1,814
–103
4,299
8
429
2,730
1,051
608
382
690
1,234
665
569
2018
49
617
173
493
666
60
3,910
41
48
26
109
920
284
50
11
448
1,915
–106
4,577
9
493
2,932
1,116
675
403
739
1,248
673
576
2019
(In billions of dollars)
78
662
180
560
739
63
4,094
46
50
27
112
958
295
51
11
455
2,026
–107
4,834
9
560
3,101
1,184
727
423
767
1,271
687
585
2020
93
692
165
619
785
63
4,308
52
53
29
115
1,010
311
52
12
466
2,146
–108
5,093
10
619
3,278
1,253
782
447
797
1,293
699
595
2021
114
833
266
681
947
65
4,530
56
56
30
118
1,060
326
53
13
481
2,271
–55
5,477
10
681
3,516
1,325
875
473
843
1,324
717
607
2022
Table S–4. Adjusted Baseline by Category 1
144
829
229
744
973
67
4,753
61
58
32
121
1,107
341
56
13
496
2,400
–38
5,725
10
744
3,654
1,402
906
501
845
1,355
734
621
2023
173
809
180
801
981
70
4,981
65
62
34
125
1,159
357
57
14
510
2,529
–33
5,963
10
801
3,797
1,483
934
531
848
1,388
752
635
2024
208
943
294
857
1,151
72
5,206
68
65
36
129
1,208
372
58
15
521
2,661
–3
6,357
10
857
4,073
1,569
1,038
567
899
1,420
770
650
2025
171
2,872
915
2,129
3,044
282
18,755
251
224
121
533
4,395
1,351
262
53
2,212
9,072
–479
21,798
40
2,129
13,934
5,280
3,190
1,916
3,549
6,174
3,315
2,860
902
6,978
2,049
5,832
7,880
619
42,532
553
517
283
1,141
9,939
3,058
539
119
4,686
21,078
–716
50,412
90
5,832
32,252
12,312
7,725
4,434
7,781
12,955
6,987
5,968
20162025
Totals
20162020
96
SUMMARY TABLES
606
586
2015
642
2016
657
2017
671
2018
686
2019
701
2020
716
2021
734
2022
752
2023
770
2024
789
2025
3,357
20162020
7,117
20162025
Totals
Non-defense ��������������������������������������������������
523
529
537
547
559
572
584
596
611
626
641
657
2,798
5,930
Total, appropriated funding �����������������
1,129
1,115
1,179
1,203
1,230
1,257
1,285
1,313
1,345
1,377
1,411
1,446
6,155 13,046
1
See Table S-7 for information on adjustments to the Balanced Budget and Emergency Deficit Control Act (BBEDCA) baseline.
2
These amounts represent a placeholder for major disasters requiring Federal assistance for relief and reconstruction. Such assistance might be provided in the form of
discretionary or mandatory outlays or tax relief. These amounts are included as outlays for convenience.
3
Consists of mandatory sequestration for 2016-2024 and discretionary cap reductions for 2016-2021.
4
Excludes discretionary cap reductions for Joint Committee enforcement.
Defense ���������������������������������������������������������
Memorandum, budget authority for
appropriated programs: 4
2014
(In billions of dollars)
Table S–4. Adjusted Baseline by Category 1—Continued
THE BUDGET FOR FISCAL YEAR 2016
97
891
530
333
628
.........
2,381
845
505
301
504
.........
2,156
229
.........
3,506
Subtotal, mandatory programs ���������������������
Net interest �����������������������������������������������������������������
Adjustments for disaster costs 1 ����������������������������������
Total outlays ��������������������������������������������������������
93
19
34
99
37
.........
3,021
485
229
256
514
–30
Customs duties ������������������������������������������������������������
Deposits of earnings, Federal Reserve System ����������
Other miscellaneous receipts �������������������������������������
Allowance for immigration reform �����������������������������
Total receipts �������������������������������������������������������
Deficit �����������������������������������������������������������������������������
Net interest �����������������������������������������������������������������
Primary deficit / surplus (–) ����������������������������������
On-budget deficit ���������������������������������������������������������
Off-budget deficit / surplus (–) ������������������������������������
736
224
55
9
Social insurance and retirement receipts:
Social Security payroll taxes �����������������������������
Medicare payroll taxes ���������������������������������������
Unemployment insurance �����������������������������������
Other retirement �������������������������������������������������
Estate and gift taxes ���������������������������������������������������
321
Corporation income taxes �������������������������������������������
Excise taxes �����������������������������������������������������������������
1,395
Individual income taxes ����������������������������������������������
Receipts:
1,146
1,121
Subtotal, appropriated programs ������������������
Mandatory programs:
Social Security �����������������������������������������������������
Medicare ��������������������������������������������������������������
Medicaid ���������������������������������������������������������������
Other mandatory programs ��������������������������������
Allowance for immigration reform ���������������������
–13
595
353
229
583
.........
3,176
45
94
37
20
96
766
234
56
9
342
1,478
2
3,759
229
589
558
2015
596
525
Appropriated (“discretionary”) programs:
Defense ����������������������������������������������������������������
Non-defense ���������������������������������������������������������
Outlays:
2014
–3
477
191
283
474
2
3,525
43
77
38
21
112
801
245
56
9
473
1,646
6
3,999
283
2,543
938
583
351
662
8
1,168
605
563
2016
9
454
102
361
463
12
3,755
59
48
42
30
120
844
259
60
10
500
1,770
8
4,218
361
2,674
992
584
364
723
11
1,175
594
581
2017
26
453
55
424
479
28
3,944
59
39
45
33
122
885
273
60
11
503
1,887
8
4,423
424
2,822
1,051
585
382
785
18
1,169
582
586
2018
(In billions of dollars)
43
475
34
483
518
39
4,135
60
41
47
36
124
926
287
57
11
507
2,000
9
4,653
483
2,988
1,115
645
404
800
24
1,172
581
592
2019
70
484
10
544
554
45
4,332
63
46
50
39
126
964
298
58
11
513
2,118
9
4,886
544
3,151
1,182
689
427
825
28
1,182
588
594
2020
84
516
4
597
600
47
4,525
64
52
52
42
129
1,017
314
59
12
493
2,244
10
5,126
597
3,325
1,251
735
450
860
29
1,194
595
599
2021
Table S–5. Proposed Budget by Category
105
521
–23
649
626
55
4,746
66
56
55
46
131
1,067
330
64
13
490
2,374
10
5,372
649
3,511
1,323
820
476
858
35
1,202
608
594
2022
134
501
–65
700
635
64
4,986
68
61
58
49
134
1,114
345
66
13
505
2,508
10
5,621
700
3,693
1,400
842
504
907
41
1,218
621
597
2023
162
476
–106
744
639
77
5,236
70
65
61
54
137
1,166
361
68
14
519
2,643
10
5,875
744
3,879
1,481
857
534
959
48
1,241
633
608
2024
199
488
–99
785
687
87
5,478
72
68
64
59
141
1,215
376
70
15
530
2,781
10
6,165
785
4,105
1,566
954
567
962
56
1,265
646
619
2025
146
2,342
392
2,096
2,488
126
19,692
285
251
222
159
605
4,420
1,362
291
53
2,496
9,421
40
22,180
2,096
14,177
5,278
3,086
1,928
3,796
89
5,867
2,951
2,916
830
4,844
103
5,571
5,674
456
44,664
625
553
514
409
1,278
9,999
3,088
619
119
5,033
21,972
90
50,338
5,571
32,691
12,298
7,294
4,459
8,342
298
11,986
6,053
5,933
20162025
Totals
20162020
98
SUMMARY TABLES
1
606
523
586
528
2015
612
543
2016
573
565
2017
584
575
2018
592
584
2019
598
590
2020
610
601
2021
622
586
2022
635
599
2023
648
612
2024
661
625
2025
2,959
2,856
20162020
6,135
5,878
20162025
Totals
Total, appropriated funding ��������������������������
1,129 1,114 1,155 1,138
1,159
1,176
1,188
1,211
1,208
1,234
1,260
1,286
5,815 12,013
These amounts represent a placeholder for major disasters requiring Federal assistance for relief and reconstruction. Such assistance might be provided in the form of
discretionary or mandatory outlays or tax relief. These amounts are included as outlays for convenience.
Memorandum, budget authority for
appropriated programs:
Defense ����������������������������������������������������������������
Non-defense ���������������������������������������������������������
2014
(In billions of dollars)
Table S–5. Proposed Budget by Category—Continued
THE BUDGET FOR FISCAL YEAR 2016
99
5.0
2.9
1.9
3.5
.........
13.2
4.9
2.9
1.7
2.9
.........
12.5
1.3
.........
20.3
Subtotal, mandatory programs ���������
Net interest �����������������������������������������������������
Adjustments for disaster costs 1 ����������������������
Total outlays ��������������������������������������������
8.1
1.9
4.3
1.3
0.3
0.1
0.5
0.1
0.2
0.6
0.2
.........
17.5
2.8
1.3
1.5
3.0
-0.2
Individual income taxes ����������������������������������
Corporation income taxes �������������������������������
Social insurance and retirement receipts:
Social Security payroll taxes �����������������
Medicare payroll taxes ���������������������������
Unemployment insurance �����������������������
Other retirement �������������������������������������
Excise taxes �����������������������������������������������������
Estate and gift taxes ���������������������������������������
Customs duties ������������������������������������������������
Deposits of earnings, Federal Reserve System��
Other miscellaneous receipts �������������������������
Allowance for immigration reform �����������������
Total receipts �������������������������������������������
Deficit �����������������������������������������������������������������
Net interest �����������������������������������������������������
Primary deficit / surplus (–) ����������������������
On-budget deficit ���������������������������������������������
Off-budget deficit / surplus (–) ������������������������
Receipts:
6.4
6.5
Subtotal, appropriated programs ������
Mandatory programs:
Social Security �����������������������������������������
Medicare ��������������������������������������������������
Medicaid ���������������������������������������������������
Other mandatory programs ��������������������
Allowance for immigration reform ���������
-0.1
3.3
2.0
1.3
3.2
.........
17.7
0.2
0.5
0.2
0.1
0.5
4.3
1.3
0.3
0.1
1.9
8.2
*
20.9
1.3
3.3
3.1
2015
3.5
3.0
Appropriated (“discretionary”) programs:
Defense ����������������������������������������������������
Non-defense ���������������������������������������������
Outlays:
2014
–*
2.5
1.0
1.5
2.5
*
18.7
0.2
0.4
0.2
0.1
0.6
4.3
1.3
0.3
0.1
2.5
8.7
*
21.3
1.5
13.5
5.0
3.1
1.9
3.5
*
6.2
3.2
3.0
2016
*
2.3
0.5
1.8
2.3
0.1
19.1
0.3
0.2
0.2
0.2
0.6
4.3
1.3
0.3
0.1
2.5
9.0
*
21.4
1.8
13.6
5.0
3.0
1.8
3.7
0.1
6.0
3.0
2.9
2017
0.1
2.2
0.3
2.1
2.3
0.1
19.1
0.3
0.2
0.2
0.2
0.6
4.3
1.3
0.3
0.1
2.4
9.2
*
21.5
2.1
13.7
5.1
2.8
1.9
3.8
0.1
5.7
2.8
2.8
2018
0.2
2.2
0.2
2.2
2.4
0.2
19.2
0.3
0.2
0.2
0.2
0.6
4.3
1.3
0.3
0.1
2.4
9.3
*
21.6
2.2
13.9
5.2
3.0
1.9
3.7
0.1
5.4
2.7
2.7
2019
(As a percent of GDP)
0.3
2.2
*
2.4
2.5
0.2
19.3
0.3
0.2
0.2
0.2
0.6
4.3
1.3
0.3
0.1
2.3
9.4
*
21.7
2.4
14.0
5.3
3.1
1.9
3.7
0.1
5.3
2.6
2.6
2020
0.4
2.2
*
2.5
2.6
0.2
19.3
0.3
0.2
0.2
0.2
0.5
4.3
1.3
0.3
0.1
2.1
9.6
*
21.9
2.5
14.2
5.3
3.1
1.9
3.7
0.1
5.1
2.5
2.6
2021
0.4
2.1
-0.1
2.7
2.6
0.2
19.4
0.3
0.2
0.2
0.2
0.5
4.4
1.3
0.3
0.1
2.0
9.7
*
21.9
2.7
14.3
5.4
3.3
1.9
3.5
0.1
4.9
2.5
2.4
2022
0.5
2.0
-0.3
2.7
2.5
0.3
19.5
0.3
0.2
0.2
0.2
0.5
4.4
1.3
0.3
0.1
2.0
9.8
*
22.0
2.7
14.5
5.5
3.3
2.0
3.6
0.2
4.8
2.4
2.3
2023
Table S–6. Proposed Budget by Category as a Percent of GDP
0.6
1.8
-0.4
2.8
2.4
0.3
19.6
0.3
0.2
0.2
0.2
0.5
4.4
1.4
0.3
0.1
1.9
9.9
*
22.0
2.8
14.6
5.6
3.2
2.0
3.6
0.2
4.7
2.4
2.3
2024
0.7
1.8
-0.4
2.8
2.5
0.3
19.7
0.3
0.2
0.2
0.2
0.5
4.4
1.4
0.3
0.1
1.9
10.0
*
22.2
2.8
14.8
5.6
3.4
2.0
3.5
0.2
4.5
2.3
2.2
2025
0.1
2.3
0.4
2.0
2.4
0.1
19.1
0.3
0.2
0.2
0.2
0.6
4.3
1.3
0.3
0.1
2.4
9.1
*
21.5
2.0
13.7
5.1
3.0
1.9
3.7
0.1
5.7
2.9
2.8
0.3
2.1
0.1
2.4
2.5
0.2
19.3
0.3
0.2
0.2
0.2
0.6
4.3
1.3
0.3
0.1
2.2
9.5
*
21.7
2.4
14.1
5.3
3.1
1.9
3.6
0.1
5.3
2.7
2.6
20162025
Averages
20162020
100
SUMMARY TABLES
3.0
Non-defense ���������������������������������������������
2.9
3.3
2015
2.9
3.3
2016
2.9
2.9
2017
2.8
2.8
2018
2.7
2.7
2019
2.6
2.7
2020
2.6
2.6
2021
2.4
2.5
2022
2.3
2.5
2023
2.3
2.4
2024
2.2
2.4
2025
2.8
2.9
20162020
2.6
2.7
20162025
Averages
Total, appropriated funding ��������������
6.6
6.2
6.1
5.8
5.6
5.5
5.3
5.2
4.9
4.8
4.7
4.6
5.7
5.3
*0.05 percent of GDP or less.
1
These amounts represent a placeholder for major disasters requiring Federal assistance for relief and reconstruction. Such assistance might be provided in the form of
discretionary or mandatory outlays or tax relief. These amounts are included as outlays for convenience.
3.5
Defense ����������������������������������������������������
Memorandum, budget authority for
appropriated programs:
2014
(As a percent of GDP)
Table S–6. Proposed Budget by Category as a Percent of GDP—Continued
THE BUDGET FOR FISCAL YEAR 2016
101
2,543
283
6
3,999
Subtotal, mandatory programs �������������������������������������
Net interest ��������������������������������������������������������������������������������
Adjustments for disaster costs 1 �������������������������������������������������
Total outlays ������������������������������������������������������������������������
1,646
473
801
245
56
9
112
21
38
77
43
2
3,525
474
283
191
477
–3
Individual income taxes �������������������������������������������������������������
Corporation income taxes ����������������������������������������������������������
Social insurance and retirement receipts:
Social Security payroll taxes ���������������������������������������������
Medicare payroll taxes �������������������������������������������������������
Unemployment insurance ���������������������������������������������������
Other retirement �����������������������������������������������������������������
Excise taxes ��������������������������������������������������������������������������������
Estate and gift taxes ������������������������������������������������������������������
Customs duties ���������������������������������������������������������������������������
Deposits of earnings, Federal Reserve System �������������������������
Other miscellaneous receipts ����������������������������������������������������
Allowance for immigration reform ��������������������������������������������
Total receipts �����������������������������������������������������������������������
Deficit ���������������������������������������������������������������������������������������������
Net interest ��������������������������������������������������������������������������������
Primary deficit / surplus (–) �������������������������������������������������
On-budget deficit ������������������������������������������������������������������������
Off-budget deficit / surplus (–) ���������������������������������������������������
Receipts:
938
583
351
662
8
9
440
99
351
449
12
3,646
58
46
41
30
117
819
251
59
10
485
1,719
7
4,095
351
2,596
963
567
354
702
11
1,141
1,168
Subtotal, appropriated programs ����������������������������������
Mandatory programs:
Social Security ���������������������������������������������������������������������
Medicare ������������������������������������������������������������������������������
Medicaid �������������������������������������������������������������������������������
Other mandatory programs ������������������������������������������������
Allowance for immigration reform �������������������������������������
2017
577
564
2016
605
563
Appropriated (“discretionary”) programs:
Defense ��������������������������������������������������������������������������������
Non-defense �������������������������������������������������������������������������
Outlays:
24
427
51
399
451
26
3,712
55
37
42
31
115
833
257
56
10
473
1,776
8
4,163
399
2,656
989
551
360
739
17
1,100
548
552
2018
39
433
31
441
472
36
3,771
55
37
43
33
113
844
261
52
10
463
1,824
8
4,243
441
2,725
1,017
588
368
730
22
1,069
530
540
2019
62
428
9
481
490
40
3,829
56
41
44
34
112
852
264
51
10
453
1,872
8
4,319
481
2,785
1,045
609
377
729
25
1,045
520
525
2020
(In billions of constant dollars, adjusted for population growth)
72
442
3
511
514
40
3,877
55
44
45
36
110
871
269
51
10
423
1,922
8
4,392
511
2,849
1,071
630
386
737
25
1,023
510
513
2021
87
433
–19
539
520
46
3,943
55
47
46
38
109
886
274
53
10
407
1,972
8
4,462
539
2,917
1,099
681
396
712
29
998
505
493
2022
108
403
–52
564
511
52
4,017
54
49
47
40
108
898
278
53
11
407
2,021
8
4,528
564
2,975
1,127
678
406
731
33
981
500
481
2023
Table S–7. Proposed Budget in Population- and Inflation-Adjusted Dollars
127
372
–82
581
499
60
4,091
55
51
48
42
107
911
282
53
11
405
2,065
8
4,590
581
3,031
1,157
670
418
749
38
970
495
475
2024
151
370
–75
595
520
66
4,152
55
51
49
44
107
921
285
53
11
402
2,108
8
4,672
595
3,111
1,187
723
430
729
42
958
489
469
2025
102
SUMMARY TABLES
1,155
Total, appropriated funding ������������������������������������������
1,105
556
548
2017
1,091
550
541
2018
1,073
540
533
2019
1,050
529
521
2020
1,037
523
515
2021
1,003
517
487
2022
994
512
482
2023
984
506
478
2024
974
501
474
2025
Memorandum, index of population growth and inflation �
1.00
1.03
1.06
1.10
1.13
1.17
1.20
1.24
1.28
1.32
1
These amounts represent a placeholder for major disasters requiring Federal assistance for relief and reconstruction. Such assistance might be provided in the form of
discretionary or mandatory outlays or tax relief. These amounts are included as outlays for convenience.
612
543
Memorandum, budget authority for appropriated
programs:
Defense ��������������������������������������������������������������������������������
Non-defense �������������������������������������������������������������������������
2016
(In billions of constant dollars, adjusted for population growth)
Table S–7. Proposed Budget in Population- and Inflation-Adjusted Dollars—Continued
THE BUDGET FOR FISCAL YEAR 2016
103
.........
.........
.........
.........
Reflect incremental cost of funding existing Pell maximum
grant award �������������������������������������������������������������������������������
Reflect Postal Service default on retiree health benefit
payments ����������������������������������������������������������������������������������
Subtotal ����������������������������������������������������������������������������������
.........
.........
.........
Reflect Joint Committee enforcement ���������������������������������������
Subtotal ����������������������������������������������������������������������������������
.........
.........
Add placeholder for future emergency costs �����������������������������
Total adjustments ������������������������������������������������������������������
13
*
13
–9
*
–10
60
–47
–*
–47
.........
–61
–2
–59
.........
59
–59
8
–9
–67
–103
36
9
–1
1
7
1
617
2018
–45
–4
–41
.........
59
–59
9
–12
–70
–106
36
32
–1
1
9
22
711
2019
–46
–6
–40
.........
59
–59
9
–12
–72
–107
35
35
–1
1
11
24
785
2020
–50
–8
–42
.........
59
–59
10
–13
–75
–108
33
36
–1
1
12
24
835
2021
2
–9
11
.........
60
–60
10
–13
–22
–55
32
37
–1
1
12
24
945
2022
19
–9
28
.........
62
–62
10
–14
–6
–38
32
37
–1
1
13
24
953
2023
2025
26
–8
33
.........
63
–63
10
–14
–*
–33
33
38
–1
1
14
24
58
–6
64
.........
64
–64
10
–14
31
–3
34
38
–1
1
15
24
956 1,093
2024
–13
–196
.........
296
–296
40
–42
–292
–461
169
99
3
7
41
47
3,253
20162020
–52
–101
.........
604
–604
90
–110
–365
–698
333
285
–1
11
108
166
8,034
20162025
7,880
.........
Debt service on adjustments ��������������������������������������������������������
60
.........
–60
8
–6
–56
–89
34
7
–1
3
5
.........
594
2017
Adjusted baseline deficit �������������������������������������������������������������
485
578
535
547
556
666
739
785
947
973
981 1,151
3,044
*$500 million or less.
1
The baseline permanently continues the tax benefits provided to individuals and families that were extended only through taxable year 2017 under ATRA.
2
Includes adjustments for discretionary program integrity funding and associated mandatory benefit savings.
3
Consists of mandatory sequestration for 2017-2024 and discretionary cap reductions for 2016-2021.
4
These amounts represent a placeholder for major disasters requiring Federal assistance for relief and reconstruction.
.........
Total program adjustments ����������������������������������������������������������
58
.........
–60
6
–3
–28
–56
28
15
6
1
9
.........
544
2016
–154
.........
Subtotal ����������������������������������������������������������������������������������
–58
2
.........
.........
.........
.........
11
6
.........
5
.........
565
2015
Totals
–209
57
.........
Add outlays to mandatory category ���������������������������������������������
–57
Remove outlays from appropriated category �������������������������������
Reclassify surface transportation outlays:
4
Remove non-recurring emergency costs ��������������������������������������
Adjustments for emergency and disaster costs:
3
Set discretionary budget authority at cap levels 2 ����������������������
Adjustments for provisions contained in the Budget
Control Act:
.........
Prevent reduction in Medicare physician payments �������������������
485
Continue tax benefits provided under the American Taxpayer
Relief Act 1 ����������������������������������������������������������������������������������
Adjustments for current policy:
BBEDCA baseline deficit �������������������������������������������������������������
2014
(Deficit increases (+) or decreases (–) in billions of dollars)
Table S–8. Bridge from Balanced Budget and Emergency Deficit
Control Act (BBEDCA) Baseline to Adjusted Baseline
104
SUMMARY TABLES
–4
.........
–30
–20
.........
.........
.........
9
.........
.........
.........
.........
.........
.........
.........
.........
.........
.........
178
Total, Agriculture ������������������������������������������
.........
.........
.........
Total, Commerce �������������������������������������������
41
.........
–1,143
–418
–16
123
.........
.........
.........
.........
.........
.........
.........
Total, Education ��������������������������������������������
–1,233
130
50
.........
.........
Education:
Support Preschool for All �����������������������������������
Enact Teaching for Tomorrow ����������������������������
Partner with States to provide tuition-free
quality community college �����������������������������
Extend Pell CPI Increase �����������������������������������
Reform student loan Income-Based Repayment
plans 2 �������������������������������������������������������������
Reform and expand Perkins loan program �������
Enact student aid reforms ���������������������������������
Implement College Opportunity and
Graduation Bonus Program ��������������������������
.........
.........
.........
Commerce:
Enact Scale-Up Manufacturing Initiative ��������
Expand National Network of Manufacturing
Institutes ��������������������������������������������������������
–984
–1,129
190
.........
178
2016
Agriculture:
Reduce premium subsidies for harvest price
revenue protection and improve prevented
planting coverage �������������������������������������������
Reauthorize Secure Rural Schools ��������������������
Enact Food Safety and Inspection Service
(FSIS) fee ��������������������������������������������������������
Enact biobased labeling fee �������������������������������
Enact Grain Inspection, Packers, and
Stockyards Administration (GIPSA) fee �������
Enact Animal Plant and Health Inspection
Service (APHIS) fee ����������������������������������������
Enact NRCS Conservation user fee ������������������
Establish RHS Guaranteed Underwriting
System fee �������������������������������������������������������
Increase funding for Supplemental Nutrition
Assistance Program (SNAP) Employment &
Training 1 ���������������������������������������������������������
Create State option to improve SNAP access
for elderly ��������������������������������������������������������
Outyear mandatory effects of discretionary
changes to the Conservation Stewardship
Program ����������������������������������������������������������
Mandatory Initiatives and Savings:
2015
923
360
–678
–1,138
–57
951
.........
1,235
250
253
90
163
–1,350
–54
21
13
.........
–27
.........
–30
–4
.........
–1,374
105
2017
4,826
481
–940
–944
–58
2,401
226
3,110
550
555
190
365
–1,555
–54
34
25
.........
–27
.........
–30
–4
.........
–1,560
61
2018
9,314
671
–1,331
–830
–83
3,477
1,104
5,456
850
645
280
365
–1,628
–54
41
25
.........
–28
.........
–30
–5
.........
–1,614
37
2019
13,500
684
–1,612
–736
–73
4,822
2,055
7,360
1,000
755
390
365
–1,687
–54
48
25
.........
–29
.........
–30
–5
.........
–1,650
8
2020
17,482
692
–1,683
–652
–50
6,408
3,044
8,773
950
390
390
.........
–1,715
–54
54
25
.........
–30
.........
–30
–5
.........
–1,675
.........
2021
(Deficit increases (+) or decreases (–) in millions of dollars)
20,640
702
–1,703
–623
–21
7,653
4,095
9,787
750
290
290
.........
–1,744
–54
60
25
.........
–31
.........
–30
–5
.........
–1,709
.........
2022
Table S–9. Mandatory and Receipt Proposals
24,055
709
–1,727
–602
14
9,443
5,208
10,560
450
200
200
.........
–1,768
–54
67
25
.........
–32
.........
–30
–5
.........
–1,739
.........
2023
27,050
719
–1,850
–584
37
11,914
6,389
10,275
150
100
100
.........
–1,796
–54
74
25
.........
–33
.........
–30
–5
.........
–1,773
.........
2024
28,473
727
–1,910
–560
61
13,175
7,624
9,356
.........
.........
.........
.........
–1,794
–54
80
25
.........
–34
.........
–30
–5
.........
–1,776
.........
2025
27,330
2,319
–5,704
–4,066
–287
11,692
3,385
17,291
2,700
2,208
950
1,258
–7,204
–216
153
88
.........
–131
.........
–150
–22
.........
–7,327
401
145,030
5,868
-14,577
-7,087
-246
60,285
29,745
66,042
5,000
3,188
1,930
1,258
-16,021
-486
488
213
---
-291
---
-300
-47
---
-15,999
401
2016-2020 2016-2025
Totals
THE BUDGET FOR FISCAL YEAR 2016
105
–15
.........
.........
Total, Energy �������������������������������������������������
Health and Human Services:
HHS health savings:
Medicare providers:
Encourage delivery system reform:
Reform Medicare physician
payments to promote participation
in high-quality and efficient health
care delivery systems ���������������������
Make permanent the Medicare
primary care incentive payment in
a budget neutral manner ���������������
Encourage efficient care by
improving incentives to provide
care in the most appropriate
ambulatory setting �������������������������
Allow ACOs to pay beneficiaries
for primary care visits up to the
applicable Medicare cost sharing
amount ��������������������������������������������
Allow CMS to assign beneficiaries
to Federally Qualified Health
Centers and Rural Health Clinics
participating in the Medicare
Shared Savings Program ������������������
Expand basis for beneficiary
assignment for Accountable
Care Organizations to include
Nurse Practitioners, Physician
Assistants, and Clinical Nurse
Specialists ���������������������������������������
Establish quality bonus payments for
high-performing Part D plans �������
Implement bundled payment for
post-acute care �������������������������������
–204
.........
430
.........
.........
.........
.........
.........
.........
.........
260
.........
.........
.........
.........
.........
.........
.........
–219
.........
.........
2016
Energy:
Enact nuclear waste management program �����
Reauthorize special assessment from domestic
nuclear utilities 3 �������������������������������������������
Establish Southwestern Power Administration
Purchase Power Drought Fund ���������������������
2015
.........
.........
.........
.........
.........
–430
.........
770
–223
–15
–208
.........
2017
.........
.........
.........
.........
.........
–1,160
.........
980
–208
5
–213
.........
2018
.........
.........
.........
–10
.........
–2,050
.........
1,720
–143
–15
–218
90
2019
–430
.........
–10
–10
.........
–3,100
.........
5,190
–55
–2
–223
170
2020
–1,020
.........
–10
–10
.........
–3,730
.........
5,660
172
.........
–228
400
2021
(Deficit increases (+) or decreases (–) in millions of dollars)
–1,690
.........
–10
–10
.........
–4,130
.........
6,420
287
.........
–233
520
2022
–1,890
.........
–10
–10
.........
–4,520
.........
6,680
522
.........
–238
760
2023
–2,040
.........
–10
–10
.........
–4,950
.........
6,980
–1,614
24
–244
–1,394
2024
Table S–9. Mandatory and Receipt Proposals—Continued
–2,190
.........
–10
–20
.........
–5,430
.........
9,160
500
–15
–249
764
2025
–430
.........
–10
–20
.........
–6,740
.........
9,090
–848
–42
–1,066
260
–9,260
.........
–60
–80
.........
-29,500
---
43,990
-981
-33
-2,258
1,310
2016-2020 2016-2025
Totals
106
SUMMARY TABLES
Implement value-based purchasing
for skilled nursing facilities
(SNFs), home health agencies
(HHAs), ambulatory surgical
centers (ASCs), hospital outpatient
departments (HOPDs), and
community mental health centers
(CMHCs) �����������������������������������������
Establish a hospital-wide
readmissions measure �������������������
Extend accountability for hospitalacquired conditions ������������������������
Expand sharing Medicare data with
qualified entities ����������������������������
Improve beneficiary access:
Eliminate the 190-day lifetime limit
on inpatient psychiatric facility
services �������������������������������������������
Expand coverage of dialysis services
for beneficiaries with acute kidney
injury ����������������������������������������������
Bad debts:
Reduce Medicare coverage of bad
debts ������������������������������������������������
Graduate medical education:
Better align graduate medical
education payments with patient
care costs ����������������������������������������
Better align payments to rural providers
with the cost of health care:
Reduce Critical Access Hospital
(CAH) payments from 101%
of reasonable costs to 100% of
reasonable costs �����������������������������
Prohibit CAH designation for
facilities that are less than 10
miles from the nearest hospital �����
Cut waste, fraud, and improper
payments in Medicare:
Reduce waste, fraud, and abuse in
Medicare �����������������������������������������
Drug rebates and additional Part D
savings:
Align Medicare drug payment
policies with Medicaid policies for
low-income enrollees ����������������������
.........
.........
.........
.........
400
–10
–370
–1,000
–110
–50
110
.........
.........
.........
.........
.........
.........
.........
.........
.........
.........
.........
.........
2016
.........
2015
–3,630
112
–60
–130
–1,270
–1,250
–20
400
.........
.........
.........
.........
2017
–8,680
34
–70
–150
–1,390
–2,440
–20
450
.........
.........
.........
.........
2018
–226
–70
–170
–1,570
–3,370
–20
450
.........
.........
.........
.........
2020
–298
–80
–180
–1,680
–3,590
–20
500
.........
.........
.........
.........
2021
–329
–80
–190
–1,790
–3,840
–20
550
.........
.........
.........
.........
2022
–348
–90
–200
–1,910
–4,100
–20
550
.........
.........
.........
.........
2023
–375
–100
–220
–2,030
–4,360
–20
600
.........
.........
.........
.........
2024
–399
–100
–230
–2,150
–4,660
–30
650
.........
.........
.........
.........
2025
–9,480 –11,000 –12,730 –14,100 –16,480 –19,200 –20,830
–102
–70
–150
–1,470
–3,100
–20
450
.........
.........
.........
.........
2019
(Deficit increases (+) or decreases (–) in millions of dollars)
Table S–9. Mandatory and Receipt Proposals—Continued
–32,790
–72
–320
–710
–6,700
–10,530
–90
2,150
.........
.........
.........
.........
–116,130
–1,821
–770
–1,730
–16,260
–31,080
–200
5,000
.........
.........
.........
.........
2016-2020 2016-2025
Totals
THE BUDGET FOR FISCAL YEAR 2016
107
Accelerate manufacturer discounts
for brand drugs to provide relief
to Medicare beneficiaries in the
coverage gap �����������������������������������
Suspend coverage and payment for
questionable Part D prescriptions
and incomplete clinical
information �������������������������������������
Establish authority for a program to
prevent prescription drug abuse in
Medicare Part D �����������������������������
Require mandatory reporting of other
prescription drug coverage �������������
Allow the Secretary to negotiate
prices for biologics and high cost
prescription drugs ��������������������������
Encourage efficient post-acute care:
Adjust payment updates for certain
post-acute care providers ���������������
Encourage appropriate use of
inpatient rehabilitation hospitals
(IRFs) by requiring that 75
percent of IRF patients require
intensive rehabilitation services ���
Additional provider efficiencies:
Exclude certain services from the inoffice ancillary services exception ��
Modify the documentation
requirement for face-to-face
encounters for durable medical
equipment, prosthetics, orthotics,
and supplies (DMEPOS) claims ����
Modify reimbursement of Part B
drugs �����������������������������������������������
Improve payment accuracy for Medicare
Advantage (MA):
Increase the minimum MA coding
intensity adjustment ����������������������
Align employer group waiver plan
payments with average MA plan
bids ��������������������������������������������������
Other Medicare:
Clarify calculation of the late
enrollment penalty for Medicare
Part B premiums �����������������������������
.........
.........
.........
–10
.........
–1,600
–170
.........
.........
–320
.........
.........
.........
.........
.........
.........
.........
.........
.........
.........
.........
.........
.........
.........
.........
2016
.........
2015
.........
–530
–440
–570
.........
–350
–200
–3,400
.........
–30
.........
.........
–110
2017
.........
–680
–1,060
–620
.........
–540
–210
–4,970
.........
–40
.........
.........
–430
2018
.........
–740
–2,020
–660
.........
–590
–210
–6,690
.........
–40
.........
.........
–700
2019
.........
–50
.........
.........
–1,360
2021
.........
–60
.........
.........
–1,470
2022
.........
–60
.........
.........
–1,380
2023
.........
–70
.........
.........
–1,250
2024
.........
–70
.........
.........
–1,480
2025
.........
–780
–3,260
–710
.........
–640
–220
.........
–810
–4,730
–770
.........
–680
–230
.........
–840
–5,470
–830
.........
–730
–240
.........
–870
–5,900
–890
.........
–780
–240
.........
–920
–6,360
–970
.........
–830
–250
.........
–990
–7,000
–1,040
.........
–880
–260
–8,510 –10,600 –13,270 –15,590 –17,390 –20,050
.........
–50
.........
.........
–1,250
2020
(Deficit increases (+) or decreases (–) in millions of dollars)
Table S–9. Mandatory and Receipt Proposals—Continued
.........
–2,730
–6,780
–2,880
.........
–2,120
–1,010
–25,170
.........
–170
.........
.........
–2,490
.........
–7,160
–36,240
–7,380
.........
–6,020
–2,230
–102,070
.........
–480
.........
.........
–9,430
2016-2020 2016-2025
Totals
108
SUMMARY TABLES
Interactions ���������������������������������������������������
Medicaid and other:
Medicaid:
Limit Medicaid reimbursement of
durable medical equipment based
on Medicare rates ���������������������������
Rebase future Medicaid
Disproportionate Share Hospital
(DSH) allotments ���������������������������
Reduce waste, fraud, and abuse in
Medicaid �����������������������������������������
Strengthen the Medicaid Drug
Rebate program ������������������������������
Exclude brand-name and authorized
generic drug prices from Medicaid
Federal upper limit (FUL) �������������
Increase access to and transparency
of Medicaid drug pricing data �������
Create demonstration to address
over-prescription of psychotropic
medications for children in foster
care �������������������������������������������������
Allow States to develop age-specific
health home programs �������������������
Clarify the Medicare Fraction in the
Medicare DSH statute �������������������
Strengthen the Independent
Payment Advisory Board (IPAB)
to reduce long-term drivers of
Medicare cost growth ���������������������
Total, Medicare providers ������������������
Medicare structural reforms:
Increase income-related premiums
under Medicare Parts B and D �����������
Modify the Part B deductible for new
beneficiaries �����������������������������������������
Introduce a Part B premium surcharge
for new beneficiaries who purchase
near first-dollar Medigap coverage �����
Introduce home health co-payments for
new beneficiaries ���������������������������������
Encourage the use of generic drugs by
low-income beneficiaries ���������������������
Total, Medicare structural reforms ���
.........
2017
.........
2018
.........
2019
.........
2020
.........
2021
.........
2022
.........
2023
.........
2024
.........
2025
.........
–54
–247
–30
6
114
200
.........
.........
.........
.........
.........
.........
.........
.........
.........
.........
.........
–305
.........
.........
.........
.........
.........
45
.........
.........
.........
.........
100
206
6
–60
–467
–85
.........
–330
93
–550
–550
.........
.........
.........
.........
90
219
6
–80
–482
–116
.........
–355
153
–770
–770
.........
.........
.........
.........
90
226
6
–80
–502
–116
.........
–380
633
–850
–3,100
–20
–90
–50
–2,090
90
233
6
–80
–522
–115
.........
–410
858
–920
–7,050
–50
–220
–70
–5,790
–110
–530
–400
–150
–710
–860
–190
–910
–990
–230
–1,140
–1,090
–9,450 –11,350 –13,600 –16,260
80
91
.........
–90
–552
–111
.........
–435
1,776
90
–11
.........
–90
–592
–111
.........
–465
1,225
90
–11
.........
–90
–657
–111
.........
–495
4,525
90
–9
.........
–90
–722
–107
.........
–530
2,903
90
–6
.........
–90
–817
–112
–3,290
–565
6,137
–990 –1,070 –1,150 –1,230 –1,330
–9,590 –11,560 –14,220 –16,920 –20,050
–80
–370
–280
–7,870
.........
.........
.........
.........
.........
–752 –1,059 –4,311 –5,693 –9,065
–2,700 –11,138 –20,996 –25,932 –29,756 –37,170 –43,188 –52,369 –59,468 –67,074
.........
2016
.........
.........
260
.........
2015
(Deficit increases (+) or decreases (–) in millions of dollars)
Table S–9. Mandatory and Receipt Proposals—Continued
570
998
30
-330
-2,220
-486
---
-1,780
1,782
-3,090
-11,470
–70
–310
–120
–7,880
.........
–90,522
.........
1,010
1,052
30
-780
-5,560
-1,038
-3,290
-4,270
18,348
-8,860
-83,810
–830
–3,970
–3,740
–66,410
–20,880
–349,791
.........
2016-2020 2016-2025
Totals
THE BUDGET FOR FISCAL YEAR 2016
109
Improve and extend Money
Follows the Person Rebalancing
Demonstration through 2020 ��������
Provide home and community-based
services (HCBS) to children
eligible for psychiatric residential
treatment facilities ������������������������
Allow full Medicaid benefits for
individuals in a home and
community-based services (HCBS)
state plan option ����������������������������
Expand eligibility for the 1915(i)
HCBS State plan option ����������������
Expand eligibility under the
Community First Choice option ����
Pilot comprehensive long-term care
State plan option ����������������������������
Permanently extend Express Lane
Eligibility (ELE) for children ���������
Create State option to provide
12-month continuous Medicaid
eligibility for adults 3 ���������������������
Allow pregnant women choice of
Medicaid eligibility category ���������
Expand State flexibility to provide
benchmark benefit packages ���������
Require full coverage of preventive
health and tobacco cessation
services for adults in traditional
Medicaid �����������������������������������������
Require coverage of EPSDT for
children in inpatient psychiatric
treatment facilities ������������������������
Extend Qualified Individuals (QI)
program through CY 2016 �������������
Extend Transitional Medical
Assistance (TMA) program
through CY 2016 ����������������������������
Total, Medicaid ��������������������������������
Medicare-Medicaid enrollees:
Ensure retroactive Part D coverage
of newly-eligible low-income
beneficiaries �������������������������������������
Establish integrated appeals process
for Medicare-Medicaid enrollees ���
.........
.........
1
26
238
.........
30
299
.........
.........
95
30
775
1,075
2,253
.........
.........
.........
.........
.........
.........
.........
.........
.........
.........
.........
.........
.........
370
825
1,195
.........
.........
2016
.........
2015
.........
.........
730
1,120
200
35
92
.........
.........
238
65
.........
255
54
2
79
.........
2017
.........
.........
20
1,550
.........
35
87
.........
.........
723
105
748
296
85
4
165
.........
2018
.........
.........
.........
1,331
.........
40
81
.........
.........
410
160
782
319
119
4
172
.........
2019
.........
.........
.........
1,300
.........
40
76
.........
.........
378
105
816
343
156
4
180
.........
2020
.........
.........
.........
1,243
.........
45
71
.........
.........
455
115
851
368
163
4
188
.........
2021
(Deficit increases (+) or decreases (–) in millions of dollars)
.........
.........
.........
1,236
.........
45
67
.........
.........
519
130
888
395
171
4
196
.........
2022
.........
.........
.........
373
.........
50
64
.........
.........
574
145
.........
424
180
5
205
.........
2023
.........
.........
.........
293
.........
50
61
.........
.........
537
150
.........
455
189
5
214
.........
2024
Table S–9. Mandatory and Receipt Proposals—Continued
.........
.........
.........
–3,015
.........
55
60
.........
.........
580
165
.........
488
198
5
224
.........
2025
---
---
1,825
7,554
975
180
431
---
---
2,048
465
2,346
1,451
440
15
596
---
---
---
1,825
7,684
975
425
754
---
---
4,713
1,170
4,085
3,581
1,341
38
1,623
---
2016-2020 2016-2025
Totals
110
SUMMARY TABLES
Create pilot to expand PACE
eligibility to individuals between
ages 21 and 55 ��������������������������������
Allow for Federal/State coordinated
review of Duals Special Need Plan
marketing materials ����������������������
Total, Medicare-Medicaid enrollees ���
Pharmaceutical savings:
Prohibit brand and generic drug
manufacturers from delaying the
availability of new generic drugs
and biologics �����������������������������������
Modify length of exclusivity to
facilitate faster development of
generic biologics �������������������������������
Total, pharmaceutical savings �������
Allow CMS to reinvest civil monetary
penalties recovered from home health
agencies ������������������������������������������������
Allow CMS to assess a fee on Medicare
providers for payments subject to the
Federal Levy Program �������������������������
Invest in CMS quality measurement �����
Reauthorize Special Diabetes Program ���
Extend Health Centers ���������������������������
Total, Medicaid and other ������������������
Medicare appeals:
Provide Office of Medicare Hearings
and Appeals and Department
Appeals Board authority to use RAC
collections ���������������������������������������������
Establish Medicare appeals refundable
filing fee �����������������������������������������������
Remand appeals to the redetermination
level with the introduction of new
evidence ������������������������������������������������
Sample and consolidate similar claims
for administrative efficiency ���������������
Increase minimum amount in controversy
for administrative law judge (ALJ)
adjudication of claims to equal amount
required for judicial review �������������������
Establish magistrate adjudication for
claims with amount in controversy
below new ALJ amount in controversy
threshold ������������������������������������������������
.........
.........
.........
–810
.........
–810
1
.........
30
180
1,350
3,004
127
.........
.........
.........
.........
.........
.........
.........
.........
.........
.........
.........
.........
.........
.........
.........
1,195
.........
.........
.........
.........
.........
.........
2016
.........
2015
.........
.........
.........
.........
.........
127
.........
30
266
2,538
3,115
1
30
–840
–870
.........
.........
.........
2017
.........
.........
.........
.........
.........
127
.........
30
291
2,619
3,471
1
–90
–1,020
–930
.........
.........
.........
2018
.........
.........
.........
.........
.........
127
.........
.........
116
1,323
1,421
1
–340
–1,350
–1,010
.........
.........
.........
2019
.........
.........
.........
.........
.........
127
.........
.........
34
162
–133
1
–540
–1,630
–1,090
.........
.........
.........
2020
.........
.........
.........
.........
.........
127
.........
.........
9
81
–476
1
–640
–1,810
–1,170
.........
.........
.........
2021
(Deficit increases (+) or decreases (–) in millions of dollars)
.........
.........
.........
.........
.........
127
.........
.........
4
27
–682
1
–690
–1,950
–1,260
.........
.........
.........
2022
.........
.........
.........
.........
.........
127
.........
.........
.........
.........
–1,736
1
–760
–2,110
–1,350
.........
.........
.........
2023
.........
.........
.........
.........
.........
127
.........
.........
.........
.........
–1,926
1
–760
–2,220
–1,460
.........
.........
.........
2024
Table S–9. Mandatory and Receipt Proposals—Continued
.........
.........
.........
.........
.........
127
.........
.........
.........
.........
–5,314
1
–740
–2,300
–1,560
.........
.........
.........
2025
.........
.........
.........
.........
.........
635
--90
887
7,992
10,878
5
-940
-5,650
-4,710
-----
---
.........
.........
.........
.........
.........
1,270
--90
900
8,100
744
10
-4,530
-16,040
-11,510
-----
---
2016-2020 2016-2025
Totals
THE BUDGET FOR FISCAL YEAR 2016
111
5,010
262
5,312
3,660
.........
3,660
.........
Provide CMS Program Management
implementation funding ���������������������������
Annual reduction to discretionary spending
limits (non-add) ����������������������������������������
Extend CHIP funding through 2019 3 ��������������
Promote Family Based Care ������������������������������
Provide enhanced funding for Tribes to
implement Title IV-E programs ���������������������
Establish Title IV-E funding for prevention
and permanency services �������������������������������
Expand eligibility through age 23 for Chafee
Foster Care Independence Program ��������������
Modernize child support and create a Child
Support Research Fund ���������������������������������
Reauthorize Family Connection Grants ������������
Repurpose Temporary Assistance for Needy
Families (TANF) Contingency Fund to
support Pathways to Jobs initiative ��������������
Reauthorize the Personal Responsibility
Education Program (PREP) ���������������������������
Reauthorize Health Profession and
Opportunity Grants ���������������������������������������
Nonscoreable reclassification �����������������������
Total, provide mandatory funding for
tribal contract support costs ���������������
.........
130
78
27
30
.........
150
.........
.........
2
4
.........
.........
.........
.........
.........
.........
.........
.........
.........
.........
.........
.........
.........
.........
.........
.........
.........
60
5,873
.........
5,115
25
40
.........
Provide CMS Program Management
implementation funding for Physician
Payment Reform ���������������������������������������
Total, HHS health savings 4 �������������������
Provide mandatory funding for tribal contract
support costs:
PAYGO effects �����������������������������������������������
.........
127
.........
.........
2016
Expedite procedures for claims with no
material fact in dispute �����������������������
Total, Medicare appeals ���������������������
Health workforce investments:
Create a competitive, value-based
graduate medical education program ���
Extend the Medicaid primary care
payment increase through CY 2016
and include additional providers ��������
Invest in the National Health Service
Corps ������������������������������������������������������
Total, health workforce investments ���
2015
75
508
788
.........
280
.........
127
2018
.........
518
916
.........
398
.........
127
2019
.........
524
989
.........
465
.........
127
2020
.........
262
749
.........
487
.........
127
2021
.........
37
552
.........
515
.........
127
2022
.........
16
554
.........
538
.........
127
2023
.........
5
570
.........
565
.........
127
2024
.........
.........
587
.........
587
.........
127
2025
47
24
.........
169
10
.........
41
30
–731
4,049
43
800
731
69
78
57
.........
269
3
.........
41
28
–745
4,018
19
925
745
180
85
74
.........
290
1
.........
51
5
–760
4,159
1
1,100
760
340
81
75
.........
360
.........
.........
57
4
–775
–625
–19
775
775
.........
39
73
.........
396
.........
.........
58
4
–790
150
–29
790
790
.........
7
51
.........
438
.........
.........
56
4
–806
.........
–39
806
806
.........
.........
18
.........
436
.........
.........
61
4
–822
.........
–41
822
822
.........
.........
1
.........
433
.........
.........
84
4
–839
.........
–43
839
839
.........
.........
.........
.........
305
.........
.........
108
4
–856
.........
–38
856
856
.........
180
210
90
30
30
.........
.........
.........
.........
–5,941 –16,942 –25,845 –34,935 –44,554 –53,526 –63,119 –74,714 –85,587
300
487
1,932
1,280
165
.........
127
2017
(Deficit increases (+) or decreases (–) in millions of dollars)
Table S–9. Mandatory and Receipt Proposals—Continued
295
232
.........
1,238
14
.........
220
94
–3,011
11,731
122
3,600
3,011
589
570
–77,790
400
2,299
9,937
6,290
1,348
.........
635
341
375
.........
3,246
14
.........
587
114
–7,124
11,881
–68
7,713
7,124
589
600
–399,290
400
2,619
12,949
6,290
4,040
.........
1,270
2016-2020 2016-2025
Totals
112
SUMMARY TABLES
.........
–54
.........
.........
.........
.........
.........
.........
.........
.........
.........
.........
.........
.........
.........
.........
.........
.........
Homeland Security:
Reform the aviation passenger security user
fee to more accurately reflect the costs of
aviation security ���������������������������������������������
Increase customs user fees ��������������������������������
Increase immigration inspection user fees �������
Increase Express Consignment Courier fees ����
Total, Homeland Security �����������������������������
Housing and Urban Development:
Provide funding for grants to reduce local
barriers to housing development �������������������
Interior:
Provide a fair return to taxpayers for the use of
public resources:
Enact Federal oil and gas management
reforms ��������������������������������������������������������
Reform hardrock mining on public lands ����
Repeal geothermal payments to counties ����
Enact offshore revenue reform ���������������������
Total, provide a fair return to taxpayers
for the use of public resources ������������
Ensure industry is held responsible for legacy
pollution and risks to safety:
Establish an abandoned mine lands (AML)
hardrock reclamation fund 3 ���������������������
Increase coal AML fee to pre–2006 levels 3 ���
Terminate AML payments to certified States ��
Fund AML reclamation and economic
revitalization ���������������������������������������������
20
55
–34
–49
–4
.........
–50
6
–195
–195
.........
.........
.........
10,409
.........
.........
.........
2,969
825
300
.........
.........
.........
5,115
1
.........
Total, Health and Human Services ��������������
2016
Support demonstration to address overprescription of psychotropic drugs
for children in foster care (funding in
Administration for Children and Families) ����
Expand access to high-quality, affordable care
for young children ������������������������������������������
Establish LIHEAP Contingency Fund ��������������
Fund Upward Mobility Project ��������������������������
Provide researcher access to National
Directory of New Hires (NDNH) �������������������
Extend and expand the Maternal, Infant, and
Early Childhood Home Visiting Program �����
2015
95
–26
–36
–200
–126
.........
–4
–2
–120
30
–200
–200
.........
.........
.........
4,635
105
.........
3,889
1,049
300
20
2017
555
.........
5,599
800
300
71
2019
895
.........
6,639
726
300
52
2020
1,055
.........
7,709
694
.........
28
2021
1,395
.........
9,205
697
.........
16
2022
6
1,555
.........
10,787
713
.........
2023
1
1,895
.........
12,476
729
.........
2024
1
2,055
.........
14,422
745
.........
2025
140
–35
–27
–150
–500
–367
–4
–4
–125
45
–350
–350
.........
.........
.........
170
–36
–17
–100
–535
–375
–5
–5
–150
81
–600
–600
.........
.........
.........
200
–30
–9
–50
–556
–376
–5
–5
–170
81
–625
–625
.........
.........
.........
145
–27
–1
.........
–574
–378
–5
–6
–185
51
–650
–650
.........
.........
.........
105
–25
51
.........
–591
–380
–5
–6
–200
6
–675
–675
.........
.........
.........
60
–10
37
.........
–616
–385
–5
–11
–215
.........
–680
–680
.........
.........
.........
30
–1
27
.........
–640
–393
–5
–17
–225
.........
–690
–690
.........
.........
.........
.........
.........
16
.........
–684
–415
–5
–24
–240
.........
–700
–700
.........
.........
.........
–5,203 –12,754 –25,615 –33,587 –40,890 –48,758 –58,295 –67,129
395
.........
4,632
919
300
55
2018
(Deficit increases (+) or decreases (–) in millions of dollars)
Table S–9. Mandatory and Receipt Proposals—Continued
660
–161
–138
–500
–1,771
–1,118
–22
–16
–615
243
–1,970
–1,970
.........
.........
.........
–28,528
1,970
.........
23,728
4,319
1,500
199
1,000
–224
–8
–500
–4,876
–3,069
–47
–80
–1,680
300
–5,365
–5,365
.........
.........
.........
–277,187
9,925
.........
78,327
7,897
1,500
251
2016-2020 2016-2025
Totals
THE BUDGET FOR FISCAL YEAR 2016
113
156
.........
.........
.........
Reauthorize the Federal Land Transaction
Facilitation Act of 2000 (FLTFA) ��������������
Permanently reauthorize the Federal Lands
Recreation Enhancement Act (FLREA) ���
246
.........
.........
.........
.........
.........
.........
.........
.........
.........
.........
.........
Extend the Palau Compact of Free
Association ������������������������������������������������
Extend funding for Payments in Lieu of
Taxes (PILT) ����������������������������������������������
856
.........
.........
.........
Total, Interior ������������������������������������������������
Labor:
Unemployment Insurance reform: 5
Strengthen Unemployment Insurance (UI)
system solvency 3, 6 ������������������������������������������
.........
1,020
363
.........
Improve coal miner retiree health and
pension benefits ����������������������������������������
Total, maintain commitments to
communities and insular territories ����
452
41
95
.........
Provide funding for a National Park Service
Centennial Initiative ��������������������������������
Total, conserve natural resources for
future generations and provide
recreation access to the public ������������
Maintain commitments to communities and
insular territories:
Provide mandatory funding for tribal
contract support costs:
PAYGO effects ������������������������������������������
Nonscoreable reclassification ������������������
Total, provide mandatory funding for
tribal contract support costs ����������
Annual reduction to discretionary
spending limits (non-add) �������������������
.........
–5
–28
.........
2016
Total, ensure industry is held
responsible for legacy pollution and
risks to safety ��������������������������������������
Conserve natural resources for future
generations and provide recreation access to
the public:
Establish dedicated funding for Land
and Water Conservation Fund (LWCF)
programs ���������������������������������������������������
2015
–3,634
1,218
635
375
.........
29
–212
231
19
212
876
360
.........
–6
522
–167
2017
–3,618
1,635
717
380
.........
20
–285
317
32
285
1,490
500
.........
–10
1,000
–72
2018
–3,457
1,582
738
385
.........
18
–292
335
43
292
1,362
405
.........
–12
969
17
2019
–3,601
1,320
714
389
.........
17
–297
308
11
297
1,051
140
.........
–3
914
111
2020
–3,901
1,152
709
389
.........
16
–304
304
.........
304
900
.........
.........
.........
900
117
2021
(Deficit increases (+) or decreases (–) in millions of dollars)
–6,485
1,163
723
404
.........
10
–309
309
.........
309
900
.........
.........
.........
900
131
2022
–6,313
1,102
731
408
.........
7
–316
316
.........
316
900
.........
.........
.........
900
87
2023
–6,648
1,054
738
411
.........
5
–322
322
.........
322
900
.........
.........
.........
900
56
2024
Table S–9. Mandatory and Receipt Proposals—Continued
–7,100
972
740
411
.........
.........
–329
329
.........
329
900
.........
.........
.........
900
16
2025
–14,310
6,775
3,660
1,892
452
125
–1,086
1,191
105
1,086
5,025
1,500
.........
–36
3,561
–139
–44,757
12,218
7,301
3,915
452
163
–2,666
2,771
105
2,666
9,525
1,500
.........
–36
8,061
268
2016-2020 2016-2025
Totals
114
SUMMARY TABLES
.........
18,490
.........
Treasury:
Establish a Pay for Success Incentive Fund �����
Authorize Treasury to locate and recover assets
of the United States and to retain a portion
of amounts collected to pay for the costs of
recovery �������������������������������������������������������������
Increase delinquent Federal non-tax debt
collections by authorizing administrative
bank garnishment for non-tax debts �������������
Increase levy authority for payments to Medicare
providers with delinquent tax debt 3 ����������������
Allow offset of Federal income tax refunds to
collect delinquent State income taxes for
out-of-state residents �������������������������������������
Reduce costs for States collecting delinquent
income tax obligations �����������������������������������
.........
3,056
.........
.........
9,285
.........
Total, Labor ���������������������������������������������������
Transportation:
Invest in surface transportation
reauthorization �����������������������������������������������
Transfer to achieve trust fund solvency (nonadd) �����������������������������������������������������������������
.........
1,920
221
.........
.........
–34
–3
.........
500
.........
.........
.........
.........
–5
1,125
.........
.........
–32
30
.........
.........
–34
.........
–3
105
.........
.........
179
.........
29
–19
.........
.........
2,520
.........
Modernize UI ��������������������������������������������
Reform the Federal Employees’ Compensation
Act �������������������������������������������������������������������
Improve Pension Benefit Guaranty
Corporation (PBGC) solvency ������������������������
Extend the Trade Adjustment Assistance
program ����������������������������������������������������������
Implement cap adjustments for UI program
integrity 3, 6 ������������������������������������������������������
Outlays from discretionary cap adjustment
(non-add) ��������������������������������������������������������
Improve UI program integrity (mandatory
SIDES) 3, 6 ���������������������������������������������������������
Create Connecting for Opportunity program ���
Allow use of prisoner database for UI program
integrity 3, 6 ������������������������������������������������������
Expand Foreign Labor Certification fees ����������
Create an Apprenticeship Training Fund ���������
Provide High-Growth Sector Training and
Credentialing Grants �������������������������������������
Establish Paid Leave Partnership Initiative ����
3, 6
2,776
2016
.........
Improve UI Extended Benefits 3, 6 �����������������
2015
.........
.........
–50
–32
–3
21
18,394
9,622
5,340
2,160
664
–7
.........
500
–10
1,125
35
–96
209
179
–9
1,740
2,519
2017
.........
.........
–50
–32
–3
10
18,584
14,565
2,139
1,568
664
–8
.........
500
–15
375
40
–110
274
–1,194
–14
520
3,197
2018
.........
.........
–51
–32
–3
24
18,692
16,516
3,263
1,520
664
–7
.........
500
–15
375
45
–121
345
–1,460
–21
450
4,490
2019
.........
.........
–52
–32
–3
40
18,831
17,707
1,984
1,472
.........
–7
.........
.........
–16
.........
50
–131
397
–1,823
–29
110
5,612
2020
.........
.........
–54
–32
–3
56
18,910
18,837
2,120
1,472
.........
–8
.........
.........
–16
.........
55
–138
459
–2,139
–34
–40
6,465
2021
(Deficit increases (+) or decreases (–) in millions of dollars)
.........
.........
–54
–32
–3
46
.........
15,640
–1,469
1,472
.........
–7
.........
.........
–13
.........
60
–147
533
–2,589
–41
.........
5,808
2022
.........
.........
–56
–32
–3
42
.........
9,528
–1,621
1,472
.........
–7
.........
.........
–14
.........
65
–160
569
–3,025
–49
.........
5,906
2023
.........
.........
–56
–32
–3
24
.........
6,003
–1,849
1,472
.........
–7
.........
.........
–14
.........
70
–173
592
–3,402
–56
.........
6,387
2024
Table S–9. Mandatory and Receipt Proposals—Continued
.........
.........
–57
–32
–3
8
.........
4,115
–2,975
1,472
.........
–7
.........
.........
–13
.........
75
–181
600
–3,731
–64
.........
6,049
2025
.........
.........
–237
–160
–15
124
92,991
61,466
22,011
8,640
2,213
–32
.........
2,000
–61
3,000
200
–492
1,330
–4,119
–92
5,340
18,594
.........
.........
–514
–320
–30
300
111,901
115,589
16,217
16,000
2,213
–68
.........
2,000
–131
3,000
525
–1,291
4,083
–19,005
–336
5,300
49,209
2016-2020 2016-2025
Totals
THE BUDGET FOR FISCAL YEAR 2016
115
216
–432
667
.........
.........
.........
.........
Total, Treasury ����������������������������������������������
.........
4
3
1
.........
–38
–26
4
1
.........
–2
.........
2
2
.........
.........
.........
.........
.........
.........
.........
.........
.........
.........
.........
.........
.........
.........
.........
.........
Total, Veterans Affairs ����������������������������������
Corps of Engineers:
Reform inland waterways funding 3 ������������������
–113
–85
–36
.........
Veterans Affairs:
Extend round-down of cost of living
adjustments (compensation) ��������������������������
Extend round-down of cost of living
adjustments (education) ��������������������������������
Provide burial receptacles for certain new
casketed gravesites ����������������������������������������
Improve housing grant program �����������������������
Increase cap on vocational rehabilitation
contract counseling ����������������������������������������
Extend supplemental service disabled veterans
insurance coverage �����������������������������������������
Clarify evidentiary threshold at which VA is
required to provide medical examination �����
Cap Post–9/11 GI Bill benefits for flight
training �����������������������������������������������������������
Expand eligibility for Montgomery GI Bill
refund ��������������������������������������������������������������
Extend authorization of work-study activities ���
Pro-rate GI Bill benefit usage for certification
tests �������������������������������������������������������������������
Modernize the definition of Automobile
Adaptive Equipment (AAE) ���������������������������
Eliminate reductions of special monthly
compensation for hospitalized veterans ��������
Restore the eligibility of certain veterans for
special aid and attendance allowance �����������
Reissue VA benefit payments to all victims of
fiduciary misuse ���������������������������������������������
–268
–12
.........
2016
Provide authority to contact delinquent
debtors via their cell phones ��������������������������
Reauthorize the State Small Business Credit
Initiative ���������������������������������������������������������
Implement tax enforcement program integrity
cap adjustment 3 ���������������������������������������������
Outlays from discretionary cap adjustment
(non-add) ��������������������������������������������������������
2015
–113
–129
2
2
.........
–2
.........
4
1
–27
–39
.........
1
1
3
–1
–74
–792
1,039
–1,451
735
–12
2017
–113
–172
2
2
1
–2
.........
4
1
–28
–41
.........
1
7
3
–1
–121
–2,488
1,403
–2,926
525
–12
2018
–113
–217
2
2
1
–2
.........
5
1
–30
–42
.........
1
2
3
–1
–159
–4,544
1,781
–4,476
6
–12
2019
–113
–252
2
2
1
–2
.........
5
1
–31
–43
1
1
1
3
–1
–192
–6,148
2,170
–6,095
6
–12
2020
–113
–267
2
3
.........
–2
1
4
1
–33
–44
.........
1
4
1
–1
–204
–7,520
2,232
–7,481
6
–12
2021
(Deficit increases (+) or decreases (–) in millions of dollars)
–113
–279
2
3
1
–1
1
4
1
–35
–46
.........
1
4
1
–1
–214
–8,524
2,276
–8,475
6
–12
2022
–113
–290
2
3
1
–1
1
4
1
–36
–47
1
1
5
1
–1
–225
–9,138
2,329
–9,077
.........
–12
2023
–113
–307
2
3
1
–1
1
4
2
–39
–48
1
1
.........
1
–1
–234
–9,582
2,382
–9,503
.........
–12
2024
Table S–9. Mandatory and Receipt Proposals—Continued
–113
–319
2
3
1
–1
1
5
2
–41
–50
1
1
2
1
–2
–244
–9,915
2,437
–9,819
.........
–12
2025
–565
–855
10
10
3
–10
.........
22
5
–142
–203
1
5
15
15
–4
–582
–14,240
7,060
–15,380
1,488
–60
–1,130
–2,317
20
25
7
–16
5
43
12
–326
–438
4
10
30
20
–10
–1,703
–58,919
18,716
–59,735
1,500
–120
2016-2020 2016-2025
Totals
116
SUMMARY TABLES
–4
.........
.........
.........
Total, Environmental Protection Agency �����
Executive Office of the President:
Promote Spectrum Relocation Fund flexibility 7 ����
International Assistance Programs:
Mandatory effects of discretionary proposal
to implement 2010 International Monetary
Fund (IMF) agreement (non-scoreable) ��������
315
83
.........
.........
.........
.........
.........
.........
.........
.........
.........
Total, Other Defense–Civil Programs ����������
Office of Personnel Management (OPM):
Streamline Federal Employee Health Benefit
Plan (FEHBP) pharmacy benefit contracting ��
Provide FEHBP benefits to domestic partners ����
Expand FEHBP plan types ��������������������������������
Adjust FEHBP premiums for wellness �������������
Total, Office of Personnel Management �������
Social Security Administration (SSA):
Provide dedicated, mandatory funding for
program integrity:
Administrative costs �������������������������������������
Annual reduction to discretionary spending
limits (non-add) ����������������������������������������
Allow SSA to use commercial databases to
verify wages in SSI �����������������������������������������
Benefit savings ����������������������������������������������
Total, provide dedicated, mandatory
funding for program integrity �������������
–3
.........
.........
.........
.........
.........
.........
.........
.........
.........
.........
.........
.........
.........
.........
.........
324
–71
.........
Other Defense–Civil Programs:
Increase TRICARE pharmacy copayments �������
Increase annual premiums for TRICARE-ForLife (TFL) enrollment ������������������������������������
Increase TRICARE pharmacy copayments
(accrual effects) ����������������������������������������������
Increase annual premiums for TFL enrollment
(accrual effects) ����������������������������������������������
–224
50
.........
.........
.........
.........
2016
–4
2015
.........
Environmental Protection Agency:
Eliminate statutory cap on pre-manufacture
notice fee ���������������������������������������������������������
Enact confidential business information
management fee ���������������������������������������������
Create Clean Power State Incentive Fund �������
.........
–273
1,567
–238
1,805
–64
–59
–7
–1
3
309
85
328
–15
–89
.........
–45
1,660
–2
1,670
–8
2017
.........
–273
–275
–2,003
1,728
–133
–124
6
–3
–12
272
87
343
–43
–115
.........
–75
990
–2
1,000
–8
2018
–71
–273
–1,487
–3,163
1,676
–169
–143
18
–4
–40
23
89
361
–83
–344
.........
–100
182
.........
190
–8
2019
–36
–273
–2,320
–3,902
1,582
–209
–153
29
–7
–78
–61
92
382
–111
–424
.........
–160
182
.........
190
–8
2020
–24
–273
–2,957
–4,532
1,575
–257
–164
40
–9
–124
–124
97
403
–141
–483
.........
–190
182
.........
190
–8
2021
(Deficit increases (+) or decreases (–) in millions of dollars)
–21
–273
–3,763
–5,394
1,631
–309
–176
54
–10
–177
–220
103
426
–173
–576
.........
–230
182
.........
190
–8
2022
–19
–273
–4,026
–5,714
1,688
–384
–187
69
–14
–252
–322
109
451
–206
–676
.........
–200
182
.........
190
–8
2023
–17
–273
–4,203
–5,950
1,747
–478
–200
85
–19
–344
–435
115
476
–240
–786
.........
–50
182
.........
190
–8
2024
Table S–9. Mandatory and Receipt Proposals—Continued
–18
–273
–4,988
–6,796
1,808
–587
–213
103
–21
–456
–480
123
505
–276
–832
.........
.........
182
.........
190
–8
2025
–107
–1,092
–2,515
–9,306
6,791
–575
–479
46
–15
–127
867
436
1,729
–255
–1,043
–224
–330
3,010
–4
3,050
–36
–206
–2,457
–22,452
–37,692
15,240
–2,590
–1,419
397
–88
–1,480
–714
983
3,990
–1,291
–4,396
–224
–1,000
3,920
–4
4,000
–76
2016-2020 2016-2025
Totals
THE BUDGET FOR FISCAL YEAR 2016
117
.........
.........
5
.........
20
18
5
45
.........
.........
.........
.........
.........
.........
.........
.........
–225
–1,234
.........
.........
1
.........
.........
.........
.........
.........
.........
.........
.........
.........
.........
.........
.........
.........
1
.........
769
Total, Social Security Administration ����������
Other Independent Agencies:
Federal Communications Commission:
Enact Spectrum License User Fee and
allow the FCC to auction predominantly
domestic satellite services ������������������������
Postal Service:
Enact Postal Service financial relief and
reform:
PAYGO effect �������������������������������������������
88
–5
.........
.........
.........
2016
Expand authority to require authorization to
verify financial information for overpayment
waiver requests 8 ��������������������������������������������
Hold fraud facilitators liable for overpayments 8 ���
Allow Government-wide use of CBP entry/exit
data to prevent improper payments ��������������
Clarify penalties and prohibitions for
misleading Internet advertising ��������������������
Allow Social Security benefits for same sex
married couples ����������������������������������������������
Lower electronic wage reporting threshold to
five employees �������������������������������������������������
Move from annual to quarterly wage reporting Improve collection of pension information from
States and localities ���������������������������������������
Establish workers compensation information
reporting ���������������������������������������������������������
Extend SSI time limits for qualified refugees ����
Conform treatment of State and local
government earned income tax credit (EITC)
and child tax credit (CTC) for SSI 9 ��������������
Terminate step-child benefits in the same
month as step-parent 10 ���������������������������������
Allow SSA to electronically certify certain RRB
payments ��������������������������������������������������������
Use the Death Master File to prevent Federal
improper payments ����������������������������������������
Offset DI benefits for period of concurrent UI
receipt 3, 6 �������������������������������������������������������
Eliminate aggressive SSA claiming strategies ����
Reauthorize and expand demonstration
authority for DI and SSI ��������������������������������
Reallocate payroll taxes to address DI trust
fund reserve depletion �����������������������������������
2015
–2,182
–325
1,707
.........
70
–35
.........
.........
.........
.........
.........
5
50
28
.........
30
8
.........
.........
–16
.........
2017
–2,353
–425
–239
.........
105
–172
.........
.........
.........
.........
.........
.........
.........
24
.........
90
9
.........
–2
–17
–1
2018
–4,226
–550
–2,193
.........
115
–253
.........
.........
.........
.........
.........
.........
.........
–351
.........
–131
11
.........
–7
–18
–1
2019
–4,399
–550
–3,483
.........
60
–252
.........
.........
.........
.........
.........
.........
.........
–776
.........
–138
13
.........
–14
–19
–1
2020
–4,472
–550
–4,479
.........
.........
–253
.........
.........
.........
.........
.........
.........
.........
–1,047
.........
–168
13
.........
–22
–20
–1
2021
(Deficit increases (+) or decreases (–) in millions of dollars)
–4,495
–550
–5,450
.........
.........
–260
.........
.........
.........
.........
.........
.........
.........
–1,142
.........
–224
14
.........
–33
–20
–1
2022
–4,419
–550
–5,699
.........
.........
–264
.........
.........
.........
.........
.........
.........
.........
–1,085
.........
–257
14
.........
–40
–21
–1
2023
–4,344
–550
–5,868
.........
.........
–261
.........
.........
.........
.........
.........
.........
.........
–1,075
.........
–260
14
.........
–43
–22
–1
2024
Table S–9. Mandatory and Receipt Proposals—Continued
–4,318
–550
–6,691
.........
.........
–269
.........
.........
.........
.........
.........
.........
.........
–1,054
.........
–301
14
.........
–52
–22
–1
2025
–14,394
–2,075
–4,120
.........
350
–712
.........
.........
.........
.........
.........
10
95
–1,057
.........
–129
46
.........
–23
–75
–3
–36,442
–4,825
–32,307
.........
350
–2,019
.........
.........
.........
.........
.........
10
95
–6,460
.........
–1,339
115
.........
–213
–180
–8
2016-2020 2016-2025
Totals
118
SUMMARY TABLES
769
Middle-class and pro-work tax reforms:
Reform child care tax incentives 11 ��������������������
Simplify and better target tax benefits for
education 11 �������������������������������������������������������
Tax proposals:
Total, mandatory initiatives and savings ��������
Total, Multi-Agency ��������������������������������������
Multi-Agency:
Enact immigration reform 3 ������������������������������
Establish a consolidated TRICARE program
(mandatory effects in Coast Guard, Public
Health Service, and National Oceanic and
Atmospheric Administration) ������������������������
Auction or assign via fee 1675–1680 megahertz ���
Reconcile OPM/SSA retroactive disability
payments ��������������������������������������������������������
Index the $750 benefit protection threshold for
inflation �����������������������������������������������������������
Establish hold harmless for Federal poverty
guidelines ��������������������������������������������������������
Adjust payment timing ��������������������������������������
Mandatory effects of proposal to authorize
additional Afghan SIVs ����������������������������������
–87
.........
Total, Other Independent Agencies �������������
.........
.........
.........
1,890
6
.........
.........
.........
......... –37,600
4,024
5
.........
–9,342
.........
6,069
6 –29,709
.........
9
1
.........
.........
.........
1,861
4,191
23,132
–1,057
21
.........
–7
–80
6,000
.........
864
–136
373
2
2
.........
1,050
3,403
2018
–448
–495
595
2
2
.........
.........
4,226
2019
218
–65
831
2
2
.........
.........
4,399
2020
460
–50
1,058
2
2
.........
.........
4,472
2021
550
–60
1,158
2
2
.........
.........
4,495
2022
625
–60
1,233
2
2
.........
.........
4,419
2023
619
–40
1,207
2
2
.........
.........
4,344
2024
474
–40
1,062
2
2
.........
.........
4,318
2025
18
.........
.........
21
–48
–14
.........
19
.........
.........
27
–48
–15
.........
40
–48
–17
.........
18
17
.........
.........
......... –48,900
33
–48
–17
.........
15
.........
.........
46
–48
–19
.........
4,753
4,429
42,777
16
.........
.........
60
–48
–21
.........
19,901 –30,993
16
.........
48,900
53
–48
–20
.........
4,660
4,639
5,027
4,841
5,242
5,052
5,730
5,292
5,878
5,532
6,337
5,615
6,205
6,257
–6,326 –19,678 –26,070 –90,053 –55,765 –26,168 –86,980
27,422 –15,023 –17,017 –18,014 –68,908 –23,006
20
.........
37,600
14
–48
–14
–150
–1,000 –10,000 –15,000 –17,000 –18,000 –20,000 –23,000 –29,000 –31,000
1,408
–63
153
2
2
.........
1,641
3,823
2017
.........
–546
33
.........
.........
.........
3
3
–270
769
.........
.........
964
2016
.........
2015
Promote RRB program integrity ������������������
Total, Railroad Retirement Board ��������������
National Infrastructure Bank:
Create infrastructure bank ��������������������������
Civilian Property Realignment Board:
Dispose of unneeded real property ��������������
Non-scoreable effect ��������������������������������
Total, enact Postal Service financial
relief and reform ����������������������������
Railroad Retirement Board (RRB):
Amend Railroad Retirement Act and the
Railroad Unemployment Insurance Act
to include a felony charge for fraud ���������
(Deficit increases (+) or decreases (–) in millions of dollars)
Table S–9. Mandatory and Receipt Proposals—Continued
16,306
22,124
30,563
–35,384
78
.........
.........
1,961
–144
–49
–230
–37,000
1,496
–846
1,985
11
11
.........
2,421
16,815
45,698
49,872
–254,473
–156,404
160
.........
.........
2,193
–384
–143
–230
–158,000
4,224
–1,096
7,703
21
21
.........
2,421
38,863
2016-2020 2016-2025
Totals
THE BUDGET FOR FISCAL YEAR 2016
119
39
.........
5
.........
460
44
2,067
3,265
.........
.........
.........
.........
.........
.........
.........
2,542
2,542
Total, middle-class and pro-work tax
reforms ������������������������������������������������������
Loophole closers:
Require current inclusion in income of accrued
market discount and limit the accrual
amount for distressed debt ����������������������������
Require that the cost basis of stock that is a
covered security must be determined using
an average cost basis method ������������������������
Tax carried (profits) interests as ordinary
income �������������������������������������������������������������
Total, reforms to capital gains taxation,
upper-income tax benefits, and the
taxation of financial institutions ��������������
26,174
2,978
593
9,007
6,256
.........
55
.........
5
235
993
2017
27,792
724
599
9,104
6,297
.........
54
.........
3
240
1,589
2018
27,614
.........
588
9,383
6,350
.........
53
.........
–4
245
1,700
2019
28,498
.........
605
9,502
6,481
.........
52
.........
–14
250
1,754
2020
29,359
.........
620
9,727
6,612
.........
50
.........
–30
255
1,831
2021
30,502
.........
631
9,872
6,716
.........
47
.........
–51
260
2,005
2022
31,203
.........
642
9,936
6,804
.........
44
.........
–74
265
2,176
2023
32,268
.........
653
10,127
6,921
.........
40
.........
–105
270
2,410
2024
33,322
.........
678
10,306
7,047
.........
34
.........
–142
276
2,661
2025
–6,671
93 –1,178 –2,810 –3,695 –3,872 –4,008 –4,177 –4,351 –4,507
–5,644 –11,084 –10,978 –11,208 –11,470 –11,734 –12,003 –12,280 –12,562 –12,851
–4
.........
–1,294
.........
.........
.........
–2,417
–69
–12
–2,421
–209
–20
–2,316
–353
–27
–2,204
–507
–34
–2,094
–597
–41
–1,692
–620
–49
–1,271
–645
–58
–1,036
–673
–68
–953
–702
–78
–3,634 –49,391 –77,728 –80,789 –90,461 –96,535–100,987–106,666–112,549–118,436–124,558
.........
.........
......... –28,028 –46,032 –50,592 –54,995 –59,478 –63,843 –68,379 –72,914 –77,231 –81,734
–3,634 –9,048 –20,705 –18,041 –21,448 –21,892 –21,538 –22,276 –23,178 –24,292 –25,466
10,071
162
.........
Reforms to capital gains taxation, upper-income
tax benefits, and the taxation of financial
institutions:
Reduce the value of certain tax expenditures ���
Reform the taxation of capital income ��������������
Implement the Buffett Rule by imposing a new
“Fair Share Tax” ���������������������������������������������
Impose a financial fee ����������������������������������������
.........
.........
2016
Provide for automatic enrollment in IRAs,
including a small employer tax credit,
increase the tax credit for small employer
plan start-up costs, and provide an additional
tax credit for small employer plans newly
offering auto-enrollment 11 �������������������������������
Expand penalty-free withdrawals for long-term
unemployed ����������������������������������������������������
Require retirement plans to allow long-term
part-time workers to participate �������������������
Facilitate annuity portability ����������������������������
Simplify minimum required distribution rules Allow all inherited plan and IRA balances to
be rolled over within 60 days �������������������������
Expand EITC for workers without qualifying
children 11 ��������������������������������������������������������
Simplify the rules for claiming the EITC for
workers without qualifying children 11 ����������
Provide a second-earner tax credit 11 �����������������
Extend exclusion from income for cancellation
of certain home mortgage debt ����������������������
2015
(Deficit increases (+) or decreases (–) in millions of dollars)
Table S–9. Mandatory and Receipt Proposals—Continued
–10,652
–1,138
–97
–394,904
–14,261
–50,384
–239,125
–91,134
120,149
6,967
2,429
39,063
25,844
.........
253
.........
–5
1,132
6,036
–17,698
–4,375
–391
–958,100
–35,176
–111,814
–603,226
–207,884
276,803
6,967
5,653
89,031
59,944
.........
468
.........
–407
2,458
17,119
2016-2020 2016-2025
Totals
120
SUMMARY TABLES
–1,418
–4,465
.........
–589
–145
–126
.........
.........
.........
.........
.........
.........
.........
Total, loophole closers �����������������������������������
581
46
132
4
144
.........
.........
60
.........
57
117
Total, incentives for job creation, clean
energy, and manufacturing ����������������������
–218
–249
–851
–6,622
–23
–2,213
–400
2018
–233
–254
–865
–6,977
–24
–2,287
–567
2019
–249
–260
–879
–7,372
–38
–2,438
–737
2020
–266
–265
–892
–7,837
–49
–2,634
–786
2021
–283
–270
–907
–8,371
–50
–2,785
–748
2022
–302
–275
–922
–8,837
–51
–3,183
–694
2023
–323
–281
–936
–9,248
–67
–3,396
–640
2024
–345
–287
–951
–8,554
–79
–3,702
–583
2025
857
–76
9
329
.........
–197
792
867
–82
10
341
.........
–209
807
–23
–1,054
.........
–267
–23
–1,198
.........
–279
–24
–1,359
.........
–303
–25
–1,574
.........
–337
–27
–1,892
.........
–356
–29
–2,294
.........
–383
–31
–2,637
.........
–407
–32
–3,073
.........
–438
–34
–3,273
.........
–467
.........
1,025
–71
9
302
.........
–6
791
.........
1,343
–67
7
286
5
299
813
.........
.........
1,512
–61
7
270
26
418
852
.........
.........
1,657
–59
6
252
61
507
890
.........
1,764
–54
6
227
80
567
938
.........
1,778
–22
6
195
77
512
1,010
......... –14,611 –15,938 –17,310 –18,723 –20,444 –22,230 –24,261 –26,612 –29,182
1,926
76
5
164
76
475
1,130
.........
1,511
604
.........
Incentives for job creation, clean energy, and
manufacturing:
Designate Promise Zones 11 ��������������������������������
Provide a tax credit for the production of
advanced technology vehicles ������������������������
Provide a tax credit for medium- and heavyduty alternative-fuel commercial vehicles ����
Modify and extend the tax credit for the
construction of energy-efficient new homes ���
Reduce excise taxes on LNG to bring into
parity with diesel 12 ����������������������������������������
Enhance and modify the conservation
easement deduction ����������������������������������������
Modify estate and gift tax provisions:
Restore the estate, gift, and generationskipping transfer (GST) tax parameters in
effect in 2009 ��������������������������������������������������
Require consistency in value for transfer and
income tax purposes ���������������������������������������
Modify transfer tax rules for grantor retained
annuity trusts (GRATs) and other grantor
trusts �����������������������������������������������������������������
Limit duration of GST tax exemption ���������������
Extend the lien on estate tax deferrals where
estate consists largely of interest in closely held
business �����������������������������������������������������������
–201
–245
–830
–6,268
–14
–1,987
–237
2017
–8,128 –12,280 –13,226 –13,903 –14,718 –15,461 –15,775 –16,238 –16,668 –16,234
–87
.........
2016
Require non-spouse beneficiaries of
deceased IRA owners and retirement plan
participants to take inherited distributions
over no more than five years �������������������������
Limit the total accrual of tax-favored
retirement benefits �����������������������������������������
Conform SECA taxes for professional service
businesses �������������������������������������������������������
Limit Roth conversions to pre-tax dollars ��������
Eliminate deduction for dividends on stock of
publicly-traded corporations held in ESOPs Repeal exclusion of net unrealized appreciation
in employer securities ������������������������������������
Disallow the deduction for charitable
contributions that are a prerequisite for
purchasing tickets to college sporting events ���
2015
(Deficit increases (+) or decreases (–) in millions of dollars)
Table S–9. Mandatory and Receipt Proposals—Continued
–95
–5,185
.........
–1,186
–66,582
8,636
85
27
970
340
2,642
4,572
–62,255
–1,027
–1,153
–4,014
–31,704
–99
–10,343
–2,028
–248
–18,354
.........
–3,237
–189,311
14,240
–272
69
2,498
371
2,947
8,627
–142,631
–2,546
–2,531
–8,622
–74,551
–395
–26,043
–5,479
2016-2020 2016-2025
Totals
THE BUDGET FOR FISCAL YEAR 2016
121
–1,108
.........
.........
.........
.........
Provide for reciprocal reporting of
information in connection with the
implementation of FATCA ������������������������
Improve mortgage interest deduction
reporting ����������������������������������������������������
.........
.........
Increase information sharing to administer
excise taxes 12 ���������������������������������������������
Provide authority to readily share
information about beneficial ownership
information of U.S. companies with law
enforcement �����������������������������������������������
Strengthen tax administration:
.........
Increase certainty with respect to worker
classification ����������������������������������������������
.........
.........
Provide an exception to the limitation on
disclosing tax return information to
expand TIN matching beyond forms
where payments are subject to backup
withholding �����������������������������������������������
Require Form W–2 reporting for employer
contributions to defined contribution
plans ����������������������������������������������������������
Improve compliance by businesses:
25
–389
.........
24
–428
.........
2022
22
–517
.........
2023
21
–618
.........
2024
19
–724
.........
2025
–1,527
–1,552
–1,575
–1,596
–1,620
–168
–2,160
–9,860
–1,643
–176
–2,205
–9,403
–1,669
–177
–2,259
–8,850
–1,695
–181
–2,307
–8,342
–1,701
–191
–2,363
–7,830
.........
–4
–85
.........
–104
.........
.........
–16
–1
–9
–420
.........
–160
.........
.........
–39
–2
–13
–818
.........
–171
.........
.........
–65
–9
–14
–978
.........
–182
.........
.........
–89
–6
–16
–1,063
.........
–192
.........
.........
–93
–4
–17
–1,155
.........
–203
.........
.........
–97
–3
–18
–1,250
.........
–213
.........
.........
–101
–3
–18
–1,356
.........
–222
.........
.........
–106
–3
–19
–1,465
.........
–231
.........
.........
–110
–3
–19
–1,580
.........
–240
.........
.........
–115
......... –11,232 –14,551 –14,450 –14,478 –14,188 –13,808 –13,427 –12,955 –12,525 –12,085
Reduce the tax gap and make reforms:
Expand information reporting:
Improve information reporting for certain
businesses and contractors �����������������������
Total, other revenue raisers �������������������������
–105
–150
–155
–160
–165
–1,585 –2,048 –2,080 –2,110 –2,126
–8,434 –10,826 –10,663 –10,633 –10,301
.........
.........
.........
28
–320
.........
2021
......... –16,001 –17,562 –19,184 –20,951 –23,083 –25,340 –27,831 –30,752 –33,661
29
–217
.........
2020
.........
31
–155
.........
2019
Total, modify estate and gift tax provisions 32
–78
.........
2018
Other revenue raisers:
Increase and modify Oil Spill Liability Trust
Fund financing 12 �������������������������������������������
Reinstate Superfund taxes 12 ����������������������������
Increase tobacco taxes and index for inflation 12 ���
Make unemployment insurance surtax
permanent 6 ����������������������������������������������������
.........
.........
.........
2017
.........
.........
.........
2016
Modify GST tax treatment of Health and
Education Exclusion Trusts ���������������������������
Simplify gift tax exclusion for annual gifts �������
Expand applicability of definition of executor ����
2015
(Deficit increases (+) or decreases (–) in millions of dollars)
Table S–9. Mandatory and Receipt Proposals—Continued
–18
–56
–3,364
.........
–809
.........
.........
–302
–68,899
–7,358
–735
–9,949
–50,857
–73,698
120
–770
.........
–34
–147
–10,170
.........
–1,918
.........
.........
–831
–133,699
–15,686
–1,628
–21,243
–95,142
–214,365
231
–3,446
.........
2016-2020 2016-2025
Totals
122
SUMMARY TABLES
.........
.........
.........
.........
.........
.........
.........
.........
.........
Improve investigative disclosure statute �����
Allow the IRS to absorb credit and debit
card processing fees for certain tax
payments ���������������������������������������������������
Provide the IRS with greater flexibility to
address correctable errors 11 ��������������������
Enhance electronic filing of returns �������������
Improve the whistleblower program ������������
Index all civil tax penalties for inflation �����
Extend IRS authority to require truncated
Social Security Numbers on Form W–2 ���
Combat tax-related identity theft ����������������
Allow States to send notices of intent to
offset Federal tax refunds to collect State
tax obligations by regular first-class mail
instead of certified mail ����������������������������
.........
.........
.........
.........
.........
.........
–30
–2
.........
.........
–1
–14
.........
.........
Extend statute of limitations for
assessment for overstated basis and
State adjustments �������������������������������������
.........
.........
.........
Facilitate tax compliance with local
jurisdictions �����������������������������������������������
.........
.........
.........
Make repeated willful failure to file a tax
return a felony ��������������������������������������������
–1
Explicitly provide that the Department of
the Treasury and IRS have authority to
regulate all paid return preparers 11 �������
.........
Expand IRS access to information in the
National Directory of New Hires for tax
administration purposes ��������������������������
–190
180
.........
Revise offer-in-compromise application
rules �����������������������������������������������������������
–442
.........
.........
Streamline audit and adjustment
procedures for large partnerships ������������
2016
Rationalize tax return filing due dates so
they are staggered 11 ��������������������������������
Increase oversight and due diligence of tax
return preparers:
Extend paid preparer EITC due diligence
requirements to the child tax credit ��������
.........
Impose liability on shareholders to collect
unpaid income taxes of applicable
corporations �����������������������������������������������
2015
–32
.........
–173
.........
.........
.........
.........
.........
.........
–62
–2
.........
.........
–1
.........
.........
–1
–252
–463
2017
–34
.........
–181
.........
.........
.........
.........
.........
.........
–64
–2
.........
.........
–1
.........
.........
–2
–249
–484
2018
–38
.........
–190
.........
.........
.........
.........
.........
–1
–65
–2
–1
–77
–2
–1
.........
–2
–242
–505
2019
–41
.........
–196
.........
.........
.........
.........
.........
–1
–65
–2
–1
–90
–2
–1
.........
–2
–236
–528
2020
–45
.........
–199
.........
.........
.........
.........
.........
–1
–67
–2
–1
–103
–2
–1
.........
–2
–238
–550
2021
(Deficit increases (+) or decreases (–) in millions of dollars)
–49
.........
–207
.........
.........
.........
.........
.........
–1
–68
–2
–1
–118
–2
–1
.........
–2
–243
–574
2022
–53
.........
–215
.........
.........
.........
.........
.........
–2
–71
–2
–2
–135
–2
–2
.........
–2
–248
–600
2023
–58
.........
–221
.........
.........
.........
.........
.........
–2
–72
–2
–2
–155
–2
–2
.........
–2
–253
–626
2024
Table S–9. Mandatory and Receipt Proposals—Continued
–63
.........
–228
.........
.........
.........
.........
.........
–2
–75
–2
–2
–178
–2
–2
.........
–2
–256
–652
2025
–159
.........
–560
.........
.........
.........
.........
.........
–2
–286
–10
–2
–167
–7
–2
.........
–8
–1,169
–2,422
–427
.........
–1,630
.........
.........
.........
.........
.........
–10
–639
–20
–10
–856
–17
–10
.........
–18
–2,407
–5,424
2016-2020 2016-2025
Totals
THE BUDGET FOR FISCAL YEAR 2016
123
.........
.........
.........
.........
.........
.........
–10
24
.........
296
15
88
.........
60
447
381
88
.........
.........
.........
.........
.........
.........
.........
.........
.........
.........
.........
.........
.........
.........
.........
.........
.........
Total, simplify the tax system ����������������������
Trade initiatives:
Extend Generalized System of Preferences
(GSP) 12 �����������������������������������������������������������
Extend African Growth and Opportunity Act
(AGOA) 12 ��������������������������������������������������������
–709
.........
.........
–26
.........
.........
.........
.........
2016
.........
.........
Simplify the tax system:
Modify adoption credit to allow tribal
determination of special needs ����������������������
Repeal non-qualified preferred stock designation ��
Repeal preferential dividend rule for publicly
traded and publicly offered REITs ����������������
Reform excise tax based on investment income
of private foundations ������������������������������������
Remove bonding requirements for certain
taxpayers subject to Federal excise taxes on
distilled spirits, wine, and beer ����������������������
Simplify arbitrage investment restrictions ������
Simplify single-family housing mortgage bond
targeting requirements ����������������������������������
Streamline private business limits on
governmental bonds ���������������������������������������
Repeal technical terminations of partnerships Repeal anti-churning rules of section 197 ��������
Repeal special estimated tax payment
provision for certain insurance companies ���
Repeal the telephone excise tax 12 ���������������������
Increase the standard mileage rate for
automobile use by volunteers ������������������������
Consolidate contribution limitations for charitable
deductions and extend the carryforward period
for excess charitable contribution deduction
amounts �������������������������������������������������������������������
Exclude from gross income subsidies from
public utilities for purchase of water runoff
management ����������������������������������������������������
Provide relief for certain accidental dual citizens��
Enhance administrability of the appraiser
penalty �������������������������������������������������������
Total, reduce the tax gap and make
reforms ��������������������������������������������
Increase the penalty applicable to paid
tax preparers who engage in willful or
reckless conduct ����������������������������������������
2015
120
164
597
.........
103
49
47
.........
349
1
–16
99
1
.........
2
6
.........
.........
–44
–1,615
.........
.........
2017
133
.........
574
.........
55
5
48
.........
308
3
–18
198
3
.........
10
5
.........
.........
–43
–2,087
.........
–1
2018
147
.........
597
.........
23
6
49
.........
266
5
–20
281
5
.........
18
5
.........
.........
–41
–2,399
.........
–1
2019
162
.........
631
.........
24
6
50
.........
225
7
–22
338
7
.........
28
6
.........
.........
–38
–2,536
.........
–1
2020
178
.........
665
.........
25
6
51
.........
208
9
–24
370
10
.........
38
6
.........
1
–35
–2,688
.........
–1
2021
(Deficit increases (+) or decreases (–) in millions of dollars)
195
.........
1,119
.........
26
482
52
.........
161
11
–26
378
12
.........
46
6
.........
1
–30
–2,854
.........
–1
2022
215
.........
1,796
.........
28
1,168
53
.........
128
13
–28
378
17
.........
58
6
.........
1
–26
–3,040
.........
–1
2023
235
.........
2,401
.........
29
1,801
55
.........
80
15
–29
378
20
.........
68
6
.........
1
–23
–3,226
.........
–1
2024
Table S–9. Mandatory and Receipt Proposals—Continued
256
.........
2,946
.........
30
2,379
56
.........
31
17
–31
378
22
.........
76
7
.........
1
–20
–3,422
.........
–1
2025
650
545
2,846
.........
265
154
209
.........
1,444
16
–86
940
16
.........
58
22
.........
.........
–192
–9,346
.........
–3
1,729
545
11,773
.........
403
5,990
476
.........
2,052
81
–224
2,822
97
.........
344
53
.........
5
–326
–24,576
.........
–8
2016-2020 2016-2025
Totals
124
SUMMARY TABLES
.........
.........
.........
.........
.........
.........
.........
.........
.........
.........
.........
.........
.........
.........
.........
.........
.........
.........
.........
.........
.........
.........
.........
.........
256
2025
Reform the U.S. international tax system:
Restrict deductions for excessive interest of
members of financial reporting groups ���������
Provide tax incentives for locating jobs and
business activity in the United States and
remove tax deductions for shipping jobs
overseas ����������������������������������������������������������
Repeal delay in the implementation of
worldwide interest allocation ������������������������
Extend the exception under subpart F for
active financing income ����������������������������������
Extend the look-through treatment of
payments between related CFCs �������������������
Impose a 19-percent minimum tax on foreign
income �������������������������������������������������������������
Impose a 14-percent one-time tax on
previously untaxed foreign income 13 ������������
Limit shifting of income through intangible
property transfers ������������������������������������������
Disallow the deduction for excess non-taxed
reinsurance premiums paid to affiliates �������
Addendum, Reserve for long-run revenueneutral business tax reform:
488
.........
.........
–88
–346
.........
.........
.........
–616
–167
.........
838
7,006
–667
–201
.........
880
7,356
2,400
–708
–237
.........
924
7,724
2,496
24
–744
–275
.........
971
8,110
2,596
25
–6,034
–784
–315
.........
1,019
8,516
1,055
25
–6,637
–829
–361
.........
1,070
8,942
.........
27
–7,301
–863
–413
.........
1,124
9,389
.........
28
–8,031
–897
–473
.........
1,180
9,858
.........
29
–8,834
10,351
.........
31
–9,718
34,277
11,152
107
–23,605
–934
–542
.........
–3,081
–968
.........
–92,343
4,081
.........
2,308
23
–5,485
......... –11,881 –19,710 –19,873 –20,246 –20,633 –21,200 –21,799 –22,675 –23,478 –24,481
1,352
.........
22
–4,987
–7,388
–3,072
.........
–205,976
9,733
81,333
12,207
247
–64,126
–693,981 –1,690,883
4,101
13
.........
–4,533
–268,129
–268,129
.........
.........
.........
.........
.........
2,274
–724,544 –1,436,410
–248,268
–248,268
.........
.........
.........
.........
.........
1,195
2016-2020 2016-2025
Totals
1,239
–2,566
.........
5,094 –100,863 –126,469 –109,480 –169,063 –188,106 –170,244 –220,956 –194,139 –172,014 –239,549
.........
.........
.........
.........
.........
235
2024
Grand total �������������������������������������������������������������������
.........
.........
.........
.........
.........
215
2023
–975 –91,521 –149,601 –152,257 –162,737 –168,428 –144,174 –130,903 –138,374 –145,846 –152,569
.........
.........
.........
.........
.........
195
2022
Total, tax proposals ����������������������������������������������������
.........
.........
.........
.........
.........
.........
178
2021
.........
.........
.........
.........
.........
.........
162
2020
......... –34,559 –56,407 –54,420 –52,434 –50,448 –19,861
.........
.........
.........
.........
147
2019
......... –34,559 –56,407 –54,420 –52,434 –50,448 –19,861
.........
.........
.........
133
2018
Total, other initiatives ����������������������������������
.........
.........
.........
284
2017
.........
469
2016
.........
.........
2015
Other initiatives:
Allow offset of Federal income tax refunds to
collect delinquent State income taxes for
out-of-state residents �������������������������������������
Authorize the limited sharing of business tax
return information to improve the accuracy
of important measures of the economy ���������
Eliminate certain reviews conducted by the
U.S. Treasury Inspector General for Tax
Administration �����������������������������������������������
Modify indexing to prevent deflationary
adjustments �����������������������������������������������������
Extend reserve depletion date for Social
Security’s Disability Insurance program ������
Impose a 14-percent one-time tax on
previously untaxed foreign income ���������������
Total, trade initiatives ����������������������������������
(Deficit increases (+) or decreases (–) in millions of dollars)
Table S–9. Mandatory and Receipt Proposals—Continued
THE BUDGET FOR FISCAL YEAR 2016
125
–113
.........
.........
359
305
.........
.........
24
7,224
Total, simplification and tax relief for small
business �����������������������������������������������������
7,529
796
–596
170
.........
3,552
403
.........
.........
.........
17,417
5,812
.........
Incentives for manufacturing, research, and
clean energy:
Enhance and make permanent research
incentives ����������������������������������������������������������
Extend and modify certain employment tax
credits, including incentives for hiring
veterans ����������������������������������������������������������
Modify and permanently extend renewable
electricity production tax credit and
investment tax credit 11 ���������������������������������
Modify and permanently extend the deduction
for energy-efficient commercial building
property ����������������������������������������������������������
Provide a carbon dioxide investment and
sequestration tax credit 11 �����������������������������
10,941
7,200
.........
256
869
885
9,290
13,518
328
446
.........
3,809
8,935
–311
–201
174
294
2,323
950
10,356
9,401
218
440
.........
1,443
7,300
–530
–215
–102
–2,699
1,094
302
2,775
997
11,389
7,624
174
434
.........
762
6,254
–769
–230
–105
–2,890
–279
1,149
298
3,283
1,033
12,396
6,794
148
431
206
507
5,502
–1,031
–246
–105
–3,094
–293
–1,043
2020
600
290
3,695
1,074
13,387
6,840
102
428
710
492
5,108
–1,317
–264
–105
–3,312
–308
–1,089
2021
466
280
4,075
1,121
14,370
7,277
113
426
1,277
493
4,968
–1,630
–283
–105
–3,543
–323
–1,119
2022
495
270
4,524
1,167
15,352
7,694
76
423
1,811
488
4,896
–1,970
–304
–105
–3,789
–339
–1,168
2023
521
260
4,991
1,210
16,336
8,229
60
419
2,342
479
4,929
–2,340
–326
–106
–4,051
–356
–1,220
2024
–350
–106
–4,330
–374
–1,274
2025
–1,008
–462
–12,651
–1,274
–4,445
541
252
5,513
1,255
17,327
8,794
26
415
2,869
472
5,012
2,417
1,320
8,654
4,661
50,960
54,754
1,173
2,110
206
12,333
38,932
5,040
2,672
31,452
10,488
127,732
93,588
1,550
4,221
9,215
14,757
63,845
–238,285
–12,754
–2,535
–989
–31,676
–2,974
–10,315
2016-2020 2016-2025
–92,954
–116
.........
–95
–2,519
–266
–999
2019
......... –11,396 –19,145 –19,837 –20,780 –21,796 –24,716 –27,254 –29,116 –31,014 –33,231
–55
–1,449
.........
.........
–253
–956
2018
–2,754
–183
.........
–914
2017
Totals
–2,743
–533
2016
.........
2015
Simplification and tax relief for small
business:
Expand and permanently extend increased
expensing for small business �������������������������
Expand simplified accounting for small
business and establish a uniform definition
of small business for accounting methods ����
Eliminate capital gains taxation on
investments in small business stock �������������
Increase the limitations for deductible new
business expenditures and consolidate
provisions for start-up and organizational
expenditures ���������������������������������������������������
Expand and simplify the tax credit provided to
qualified small employers for non-elective
contributions to employee health insurance 11 ���
Modify tax rules for dual capacity taxpayers ���
Tax gain from the sale of a partnership
interest on look-through basis �����������������������
Modify sections 338(h)(16) and 902 to limit
credits when non-double taxation exists �������
Close loopholes under subpart F �����������������������
Restrict the use of hybrid arrangements that
create stateless income ����������������������������������
Limit the ability of domestic entities to
expatriate ����������������������������������������������������������
Total, reform the U.S. international tax
system ��������������������������������������������������
(Deficit increases (+) or decreases (–) in millions of dollars)
Table S–9. Mandatory and Receipt Proposals—Continued
126
SUMMARY TABLES
18
.........
28
25
.........
5
–3
.........
4
120
.........
6
.........
.........
.........
.........
.........
.........
.........
6
Total, incentives for investment in
infrastructure ��������������������������������������������
181
1
.........
Eliminate fossil fuel tax preferences:
1
.........
Incentives for investment in infrastructure:
Provide America Fast Forward Bonds and
expand eligible uses 11 �����������������������������������
Allow current refundings of State and local
governmental bonds ���������������������������������������
Repeal the $150 million non-hospital bond
limitation on all qualified 501(c)(3) bonds ����
Increase national limitation amount for qualified
highway or surface freight transfer facility
bonds ��������������������������������������������������������������������
Provide a new category of qualified private
activity bonds for infrastructure projects
referred to as qualified public infrastructure
bonds ���������������������������������������������������������������
Modify qualified private activity bonds for
public education facilities ������������������������������
Modify treatment of banks investing in taxexempt bonds ��������������������������������������������������
Repeal tax-exempt bond financing of
professional sports facilities ��������������������������
Allow more flexible research arrangements for
purposes of private business use limits ��������
Modify tax-exempt bonds for Indian tribal
governments ���������������������������������������������������
Exempt foreign pension funds from the
application of FIRPTA �����������������������������������
128
9
.........
8,066
3,990
Total, incentives to promote regional
growth ��������������������������������������������������������
80
35
119
87
.........
18
.........
2016
.........
2015
Incentives to promote regional growth:
Modify and permanently extend the New
Markets tax credit ������������������������������������������
Reform and expand the Low-Income Housing
tax credit ���������������������������������������������������������
Provide additional tax credits for investment
in qualified property used in a qualifying
advanced energy manufacturing project �������
Provide new Manufacturing Communities tax
credit ���������������������������������������������������������������
Extend the tax credit for second generation
biofuel production �������������������������������������������
Total, incentives for manufacturing,
research, and clean energy ������������������
433
206
12
.........
–11
38
.........
117
60
1
5
5
331
42
289
11,748
119
256
73
2017
699
216
12
.........
–23
131
.........
251
93
3
5
11
621
130
491
14,895
149
457
192
2018
965
227
12
1
–35
225
.........
386
125
5
5
14
953
233
720
18,431
163
600
1,111
2019
1,232
238
12
1
–47
317
.........
524
153
7
5
22
1,313
345
968
19,789
175
683
772
2020
1,455
250
12
1
–60
405
.........
638
167
9
5
28
1,667
441
1,226
20,068
183
745
94
2021
(Deficit increases (+) or decreases (–) in millions of dollars)
1,608
263
12
3
–72
493
.........
695
163
11
5
35
2,011
541
1,470
21,240
158
784
–14
2022
1,689
276
12
3
–85
574
.........
714
136
13
5
41
2,246
641
1,605
22,562
113
689
–48
2023
1,736
290
12
3
–97
630
.........
733
96
16
5
48
2,371
751
1,620
23,790
65
447
–40
2024
Table S–9. Mandatory and Receipt Proposals—Continued
1,708
304
12
4
–109
616
.........
751
55
17
5
53
2,446
860
1,586
25,014
18
145
–37
2025
3,510
1,007
52
2
–119
716
.........
1,303
459
16
21
53
3,346
759
2,587
72,929
686
2,083
2,148
11,706
2,390
112
16
–542
3,434
.........
4,834
1,076
82
46
258
14,087
3,993
10,094
185,603
1,223
4,893
2,103
2016-2020 2016-2025
Totals
THE BUDGET FOR FISCAL YEAR 2016
127
.........
.........
.........
.........
.........
.........
.........
.........
Repeal credit for oil and natural gas
produced from marginal wells 14 ��������������
Repeal expensing of intangible drilling
costs �����������������������������������������������������������
Repeal deduction for tertiary injectants ������
Repeal exception to passive loss limitations
for working interests in oil and natural
gas properties ��������������������������������������������
Repeal percentage depletion for oil and
natural gas wells ���������������������������������������
Repeal domestic manufacturing deduction
for oil and natural gas production �����������
–4,139
–40
.........
.........
.........
.........
Repeal percentage depletion for hard
mineral fossil fuels ������������������������������������
Repeal capital gains treatment for royalties
��������������������������������������������������������������������
–4,434
.........
.........
Reform the treatment of financial and
insurance industry products:
Require that derivative contracts be marked to
market with resulting gain or loss treated as
ordinary ����������������������������������������������������������
–2,926
–45
–295
.........
.........
Repeal domestic manufacturing deduction
for the production of coal and other hard
mineral fossil fuels ������������������������������������
Subtotal, eliminate coal preferences �
Total, eliminate fossil fuel tax
preferences ����������������������������������
–27
–183
–91
.........
Increase geological and geophysical
amortization period for independent
producers to seven years ��������������������������
Subtotal, eliminate oil and natural
gas preferences �������������������������������
Eliminate coal preferences:
Repeal expensing of exploration and
development costs �������������������������������������
–647
–1,118
–9
–7
–2,267
.........
.........
.........
2016
Treat publicly-traded partnerships for fossil
fuels as C corporations �����������������������������������
Eliminate oil and natural gas preferences:
Repeal enhanced oil recovery credit 14 ��������
2015
–4,769
–6,924
–48
–469
–54
–299
–68
–6,455
–341
–1,115
–1,790
–17
–10
–3,182
.........
.........
.........
2017
–4,138
–6,186
–50
–461
–53
–288
–70
–5,725
–537
–1,139
–1,669
–19
–10
–2,351
.........
.........
.........
2018
–2,731
–5,646
–53
–459
–54
–278
–74
–5,187
–532
–1,173
–1,585
–20
–10
–1,867
.........
.........
.........
2019
–1,733
–5,194
–54
–452
–55
–266
–77
–4,742
–440
–1,208
–1,498
–20
–10
–1,566
.........
.........
.........
2020
–1,186
–4,976
–57
–446
–58
–254
–77
–4,530
–337
–1,242
–1,375
–20
–10
–1,243
.........
.........
–303
2021
(Deficit increases (+) or decreases (–) in millions of dollars)
–731
–4,388
–59
–436
–61
–241
–75
–3,952
–226
–1,280
–1,246
–20
–10
–848
.........
.........
–322
2022
–531
–4,080
–62
–424
–61
–228
–73
–3,656
–147
–1,321
–1,122
–20
–10
–695
.........
.........
–341
2023
–535
–4,008
–65
–412
–62
–214
–71
–3,596
–125
–1,366
–994
–20
–10
–723
.........
.........
–358
2024
Table S–9. Mandatory and Receipt Proposals—Continued
–516
–3,925
–68
–398
–62
–199
–69
–3,527
–100
–1,413
–856
–20
–10
–753
.........
.........
–375
2025
–16,297
–28,384
–250
–2,136
–243
–1,314
–329
–26,248
–1,941
–5,282
–7,660
–85
–47
–11,233
.........
.........
.........
–19,796
–49,761
–561
–4,252
–547
–2,450
–694
–45,509
–2,876
–11,904
–13,253
–185
–97
–15,495
.........
.........
–1,699
2016-2020 2016-2025
Totals
128
SUMMARY TABLES
–108
–6
–69
–63
–30
–1
–48
–480
–85
.........
.........
.........
.........
.........
.........
.........
.........
.........
.........
Total, other revenue changes and loophole
closers ��������������������������������������������������������
–112
–87
–43
–17
–82
–993
–97
–7
–338
–2,005
–1,491
–7,866
–5,674
–27
–159
–676
–43
2017
–112
–92
–44
–32
–86
–1,062
–102
–7
–499
–2,026
–1,501
–7,812
–5,187
–29
–252
–722
–46
2018
–112
–95
–45
–33
–90
–1,137
–105
–7
–531
–2,048
–1,511
–8,012
–3,935
–30
–364
–762
–48
2019
–112
–97
–46
–34
–94
–1,216
–108
–7
–596
–2,070
–889
–7,908
–3,099
–32
–492
–792
–50
2020
–112
–99
–47
–35
–98
–1,301
–110
–8
–593
–2,094
–266
–8,070
–2,731
–34
–641
–816
–54
2021
–112
–100
–48
–36
–103
–1,389
–112
–8
–395
–2,119
–278
–7,752
–2,468
–36
–809
–836
–56
2022
–112
–102
–49
–38
–108
–1,483
–114
–10
–198
–2,145
–291
–7,644
–2,449
–37
–980
–843
–58
2023
–112
–104
–51
–40
–113
–1,581
–116
–10
–139
–2,174
–304
–7,931
–2,644
–39
–1,160
–849
–61
2024
–112
–106
–52
–42
–118
–1,687
–118
–10
–141
–2,202
–317
–7,592
–2,838
–40
–1,357
–862
–63
2025
–61,213
–533
–434
–208
–117
–400
–4,888
–481
–34
–2,072
–8,808
–6,135
–37,103
–21,309
–133
–1,332
–3,337
–210
–123,964
–1,093
–945
–455
–308
–940
–12,329
–1,051
–80
–3,538
–19,542
–7,591
–76,092
–34,439
–319
–6,279
–7,543
–502
2016-2020 2016-2025
Totals
Total, reserve for long-run revenue-neutral
business tax reform ������������������������������������������ 11,238 –1,249 –18,851 –18,969 –16,114 –14,138 –15,226 –14,426 –13,748 –14,215 –14,529
–69,321 –141,465
Note: For receipt effects, positive figures indicate lower receipts. For outlay effects, positive figures indicate higher outlays. For net costs, positive figures indicate higher
deficits.
1
For 2016, the additional funding is proposed as a discretionary change in mandatory programs (CHIMP).
2
Last summer, the President took action within his existing authority to implement eligibility expansions to income-based repayment plans proposed in the 2015 Budget.
However, the Administration continues to seek to work with the Congress to create a unified, simple, and better targeted PAYE program. The Budget would use the
resulting savings presented in this table to help students and expand college access.
3
The estimates for this proposal include effects on receipts. The receipt effects included in the totals above are as follows:
–7,797 –13,138 –13,375 –13,726 –13,177 –12,833 –12,452 –12,294 –12,675 –12,497
–659
.........
–3,414
.........
–743
–15
.........
.........
–65
.........
–5,505
–385
.........
.........
–23
2016
.........
2015
Other revenue changes and loophole closers:
Repeal LIFO method of accounting for
inventories ������������������������������������������������������
Repeal lower-of-cost-or-market inventory
accounting method �����������������������������������������
Modify like-kind exchange rules for real
property and collectibles ��������������������������������
Modify depreciation rules for purchases of
general aviation passenger aircraft ��������������
Expand the definition of substantial builtin loss for purposes of partnership loss
transfers ����������������������������������������������������������
Extend partnership basis limitation rules to
nondeductible expenditures ���������������������������
Limit the importation of losses under related
party loss limitation rules �����������������������������
Deny deduction for punitive damages ���������������
Conform corporate ownership standards ����������
Tax corporate distributions as dividends ����������
Repeal FICA tip credit ���������������������������������������
Repeal the excise tax credit for distilled spirits
with flavor and wine additives 12 ������������������
Modify rules that apply to sales of life
insurance contracts ����������������������������������������
Modify proration rules for life insurance
company general and separate accounts ������
Expand pro rata interest expense disallowance
for corporate-owned life insurance ����������������
Conform net operating loss (NOL) rules of
life insurance companies to those of other
corporations ����������������������������������������������������
Total, reform the treatment of financial
and insurance industry products ��������
(Deficit increases (+) or decreases (–) in millions of dollars)
Table S–9. Mandatory and Receipt Proposals—Continued
THE BUDGET FOR FISCAL YEAR 2016
129
.........
.........
.........
.........
.........
.........
.........
.........
.........
.........
.........
.........
.........
.........
Extend CHIP funding through 2019 �������������������������
Establish an AML hardrock reclamation fund ���������
Increase coal AML fee to pre–2006 levels �����������������
Strengthen Unemployment Insurance (UI) system
solvency ������������������������������������������������������������������
Improve UI Extended Benefits ����������������������������������
Modernize UI ��������������������������������������������������������������
Implement cap adjustments for UI program
integrity ������������������������������������������������������������������
Improve UI program integrity (mandatory SIDES) ����
Allow use of prisoner database for UI program
integrity ������������������������������������������������������������������
Increase levy authority for payments to Medicare
providers with delinquent tax debt �����������������������
Implement tax enforcement program integrity cap
adjustment �������������������������������������������������������������
Reform inland waterways funding ����������������������������
Offset DI benefits for period of concurrent UI
receipt ���������������������������������������������������������������������
.........
–113
–432
–34
.........
.........
.........
.........
–52
.........
–49
.........
–24
.........
–204
.........
–113
–1,451
–50
.........
.........
.........
.........
–201
–3,634
–50
–200
–351
–51
–208
2017
2017
.........
–113
–2,926
–50
.........
1
4
–200
–208
–3,618
–51
–200
–750
–103
–213
2018
2018
2
–113
–4,476
–51
1
2
12
–120
–269
–3,457
–52
–200
–835
–224
–218
2019
2019
6
–113
–6,095
–52
2
2
20
–40
–363
–3,601
–52
–200
–515
–203
–223
2020
2020
11
–113
–7,481
–54
2
3
34
–40
–443
–3,901
–52
–200
.........
–204
–228
2021
2021
16
–113
–8,475
–54
3
6
45
.........
–483
–6,485
.........
–200
.........
–212
–233
2022
2022
23
–113
–9,077
–56
3
6
55
.........
–448
–6,313
.........
–200
.........
–222
–238
2023
2023
38
–113
–9,503
–56
4
7
67
.........
–462
–6,648
.........
–200
.........
–229
–244
2024
2024
42
–113
–9,819
–57
4
9
78
.........
–483
–7,100
.........
–200
.........
–241
–249
2025
2025
8
–565
–15,380
–237
3
5
36
–360
–1,093
–14,310
–254
–800
–2,475
–581
–1,066
138
–1,130
–59,735
–514
19
36
315
–400
–3,412
–44,757
–306
–1,800
–2,475
–1,689
–2,258
2016-2020 2016-2025
Totals
2016-2020 2016-2025
Totals
2015
2016
2017
2018
2019
2020
2021
2022
2023
2024
2025
2016-2020 2016-2025
Totals
Enact immigration reform �����������������������������������������
......... –2,000 –12,000 –28,000 –39,000 –45,000 –47,000 –55,000 –64,000 –77,000 –87,000 –126,000 –456,000
Total receipt effects of mandatory proposals ����
......... –2,908 –18,309 –36,427 –48,998 –56,427 –59,666 –71,185 –80,580 –94,339 –105,129 –163,069 –573,968
4
Health savings in Table S-2 includes all HHS health savings and OPM FEHBP savings.
5
Unemployment insurance reform also includes the proposal to make the unemployment insurance surtax permanent. On net, the package reduces the deficit by $5.9
billion over 10 years.
6
Revenues are net of the 20% Treasury offset.
7
Deficit savings achieved through the increased value of monetized spectrum achieved via targeted investments that will enhance Federal spectrum efficiency and create
more opportunity for spectrum sharing.
8
This proposal also saves less than $500,000 in SSI over 10 years.
9
This proposal costs less than $500,000 in each year and over 5 and 10 years.
10
Savings of $1 million over 5 years and $4 million over 10 years.
11
The estimates for this proposal include effects on outlays. The outlay effects included in the totals above are as follows:
.........
Create State option to provide 12-month continuous
Medicaid eligibility for adults �������������������������������
2016
2015
Reauthorize special assessment from domestic
nuclear utilities ������������������������������������������������������
2016
2015
(Deficit increases (+) or decreases (–) in millions of dollars)
Table S–9. Mandatory and Receipt Proposals—Continued
130
SUMMARY TABLES
.........
.........
.........
.........
.........
.........
.........
.........
.........
.........
Simplify and better target tax benefits for
education ����������������������������������������������������������������
Provide for automatic enrollment in IRAs,
including a small employer tax credit, increase
the tax credit for small employer plan start-up
costs, and provide an additional tax credit for
small employer plans newly offering autoenrollment ��������������������������������������������������������������
Expand EITC for workers without qualifying
children �������������������������������������������������������������������
Simplify the rules for claiming the EITC for
workers without qualifying children ���������������������
Provide a second-earner tax credit ����������������������������
Designate Promise Zones ������������������������������������������
Provide the IRS with greater flexibility to address
correctable errors ���������������������������������������������������
Rationalize tax return filing due dates so they are
staggered ����������������������������������������������������������������
Explicitly provide that the Department of the
Treasury and IRS have authority to regulate all
paid return preparers ��������������������������������������������
Total, outlay effects of receipt proposals �����������
.........
.........
Modify and permanently extend renewable
electricity production tax credit and investment
tax credit ����������������������������������������������������������������
Provide a carbon dioxide investment and
sequestration tax credit �����������������������������������������
.........
.........
76
–2
1,196
–22
–26
12
.........
26
276
.........
.........
932
2016
.........
20
68
–14
9,670
–22
–53
28
732
522
5,519
127
1,862
969
2017
.........
47
32
–15
12,778
–22
–54
29
729
527
5,553
195
4,822
1,014
2018
729
63
23
–17
12,843
–23
–55
31
750
517
5,600
200
4,774
1,066
2019
728
71
21
–18
13,062
–23
–55
32
740
532
5,709
209
4,829
1,107
2020
170
78
11
–20
13,594
–23
–56
34
761
545
5,825
212
5,177
1,139
2021
Provide America Fast Forward Bonds and expand
eligible uses ������������������������������������������������������������
.........
306
1,397
3,006
4,689
6,438
8,244
12
Revenues are net of the 25% Treasury offset.
13
The effect of this proposal on receipts is shown above under tax proposals.
14
This provision is estimated to have zero receipt effect under the Administration’s current economic projections.
6
Expand and simplify the tax credit provided
to qualified small employers for non-elective
contributions to employee health insurance ��������
Addendum, reserve for long-run revenueneutral business tax reform:
.........
Reform child care tax incentives �������������������������������
2015
(Deficit increases (+) or decreases (–) in millions of dollars)
10,101
28
83
10
–21
14,046
–24
–57
35
768
555
5,914
215
5,471
1,190
2022
11,994
48
90
8
–23
14,499
–24
–59
37
770
565
5,997
220
5,785
1,231
2023
13,911
65
95
8
–25
14,881
–25
–60
38
762
574
6,090
225
6,075
1,227
2024
Table S–9. Mandatory and Receipt Proposals—Continued
15,845
76
101
4
–27
15,117
–25
–62
41
767
596
6,198
229
6,135
1,265
2025
15,836
1,457
201
220
–66
49,549
–112
–243
132
2,951
2,124
22,657
731
16,287
5,088
75,931
1,844
648
261
–182
121,686
–233
–537
317
6,779
4,959
52,681
1,832
44,930
11,140
2016-2020 2016-2025
Totals
THE BUDGET FOR FISCAL YEAR 2016
131
1,035
Total, Base Discretionary Funding �������������������
–4
.........
.........
521
510
1,031
92
6
1
.........
*
99
1,129
Non-Defense Category Reclassifications:
Surface Transportation Programs ����������������
Program Integrity �����������������������������������������
Contract Support Costs ���������������������������������
Proposed Discretionary Policy by Category:
Defense Category ������������������������������������������
Non-Defense Category ����������������������������������
Total, Base Discretionary Funding �������������������
Discretionary Cap Adjustments and Other
Funding (not included above): 3
Overseas Contingency Operations 4 ��������������
Disaster Relief �����������������������������������������������
Program Integrity �����������������������������������������
Wildfire Suppression �������������������������������������
Other Emergency/Supplemental Funding ���
Total, Cap Adjustments and Other ��������������������
Grand Total, Discretionary Budget Authority ���
–90
+74
2016
1,155
68
58
7
2
1
.........
1,087
561
526
–4
.........
.........
+38
+37
1,017
523
493
2016
Joint Committee Reductions ���������������������������������
1,114
87
73
7
1
.........
5
1,027
522
506
–4
.........
.........
*
–2
1,033
522
512
2015
2016 Budget Proposed Addback to caps ���������������
Memorandum: Current Law and Proposed
Changes to Existing BBEDCA Caps: 5
.........
.........
Proposed Cap Changes: 2
Defense Category ������������������������������������������
Non-Defense Category ����������������������������������
Discretionary Policy Changes to Baseline
Caps:
521
514
Discretionary Adjusted Baseline by Category: 1
Defense Category ������������������������������������������
Non-Defense Category ����������������������������������
2014
Actual Enacted Request
+74
–91
2017
1,138
29
27
.........
1
1
.........
1,108
573
535
–4
–*
–1
+37
+37
1,040
536
504
2017
+70
–91
2018
1,159
30
27
.........
2
1
.........
1,129
584
545
–4
–*
–1
+35
+35
1,065
549
516
2018
+60
–90
2019
1,176
30
27
.........
2
1
.........
1,146
592
554
–4
–*
–1
+30
+30
1,092
562
530
2019
(Budget authority in billions of dollars)
+44
–89
2020
1,188
30
27
.........
3
1
.........
1,157
598
559
–5
–*
–1
+22
+22
1,119
576
543
2020
+40
–88
2021
1,211
31
27
.........
3
1
.........
1,180
610
570
–5
–*
–1
+20
+20
1,146
590
556
2021
Outyears
+362
–539
20162021
1,208
4
.........
.........
3
1
.........
1,204
622
582
–5
–*
–1
–38
–16
1,264
660
604
2022
1,234
4
.........
.........
3
1
.........
1,230
635
595
–5
–*
–1
–41
–18
1,295
676
619
2023
1,260
4
.........
.........
3
1
.........
1,256
648
608
–5
–*
–1
–45
–21
1,327
693
635
2024
1,286
4
.........
.........
3
1
.........
1,281
661
620
–5
–*
–1
–49
–23
1,360
710
650
2025
6,075
5,651
6,084
5,694
–46
–2
–10
+9
+102
235
191
7
25
11
.........
5,815 12,013
188
165
7
11
5
.........
5,628 11,778
2,908
2,720
–22
–1
–4
+162
+160
5,333 11,726
2,746
2,587
2016–
2025
Totals
2016–
2020
Table S–10. Funding Levels for Appropriated (“Discretionary”) Programs by Category
132
SUMMARY TABLES
* $500 million or less.
1
The discretionary funding levels from OMB’s adjusted baseline are consistent with the caps in the Balanced Budget and Emergency Deficit Control Act of 1985
(BBEDCA), as amended, with separate categories of funding for “defense” (or Function 050) and “non-defense” for 2015–2021. These baseline levels assume Joint
Committee enforcement cap reductions are in effect through 2021. For 2022 through 2025, programs are assumed to grow at current services growth rates with Joint
Committee enforcement no longer in effect, consistent with current law. The levels shown here for the non-defense category do not include the reclassification of surface
transportation programs shown later in the table.
2
The 2016 Budget provides a detailed request for 2016 at the cap levels requested in the 2015 Budget and, after 2016, continues the 2015 Budget framework of providing
additional investments in both defense and non-defense programs above the baseline levels that include Joint Committee enforcement. In addition, the 2015 Enacted
levels are illustratively adjusted to reflect the 2015 Request for the Department of Homeland Security since the programs and activities in the Department were under a
short-term continuing resolution at the time the 2016 Budget was developed.
3
Where applicable, amounts in 2014 through 2025 are existing or proposed cap adjustments designated pursuant to Section 251(b)(2) of BBEDCA, as amended. The
2016 Budget proposes new cap adjustments for program integrity and wildfire suppression activities. For 2017 through 2025, the cap adjustment levels for wildfire
suppression are a placeholder that increase at the policy growth rates in the President’s Budget. The existing disaster relief cap adjustment ceiling (which is determined
one year at a time) would be reduced by the amount provided for wildfire suppression activities under the cap adjustment for the preceding fiscal year. The amounts will
be refined in subsequent Budgets as data on the average costs for wildfire suppression are updated annually.
4
The 2016 Budget includes placeholder amounts of nearly $27 billion per year for Government-wide OCO funding from 2017 to 2021. The placeholder amounts continue
to reflect a total OCO budget authority cap from 2013 to 2021 of $450 billion, in line with previous years’ policy, but do not reflect any specific decisions or assumptions
about OCO funding in any particular year. These amounts do not reflect the Administration’s intent to transition all enduring costs currently funded in the OCO budget
to the base budget beginning in 2017 and ending by 2020. Those amounts will be refined in subsequent Budgets as the Administration develops its OCO transition plan.
5
Under Joint Committee enforcement, the current law defense and non-defense discretionary caps specified in BBEDCA are estimated to be reduced by a combined $539
billion over the 2016 through 2021 period. The 2016 Budget proposes to restore approximately two-thirds of those reductions.
(Budget authority in billions of dollars)
Table S–10. Funding Levels for Appropriated (“Discretionary”) Programs by Category—Continued
THE BUDGET FOR FISCAL YEAR 2016
133
11.7
27.3
12.0
42.9
13.6
12.7
63.3
5.7
8.2
2.0
17.6
7.2
0.9
8.9
Interior ������������������������������������������������������
Justice ��������������������������������������������������������
Labor ����������������������������������������������������������
State and Other International Programs Transportation ������������������������������������������
Treasury ����������������������������������������������������
Veterans Affairs ����������������������������������������
Corps of Engineers ������������������������������������
Environmental Protection Agency �����������
General Services Administration �������������
National Aeronautics & Space
Administration ��������������������������������������
National Science Foundation �������������������
Small Business Administration ���������������
Social Security Administration 3 ���������������
1,030.8
34.2
Housing and Urban Development ������������
Subtotal, Base Discretionary Funding ��
39.8
Homeland Security 4 ����������������������������������
.........
79.8
Allowances 5 �����������������������������������������������
11.2
Health & Human Services 3 ����������������������
1.0
27.2
Energy �������������������������������������������������������
National Nuclear Security
Administration 2 ������������������������������
18.8
67.3
Education ��������������������������������������������������
Other Agencies ������������������������������������������
11.4
496.0
Defense 2 �����������������������������������������������������
Corporation for National & Community
Service ���������������������������������������������������
27.3
8.3
0.9
1,027.4
.........
19.0
1.1
9.0
0.9
7.3
18.0
–0.4
8.1
5.5
65.1
12.2
13.8
40.1
11.9
27.3
12.1
34.8
38.2
80.2
67.1
496.1
8.8
1.1
24.3
Commerce ��������������������������������������������������
Census Bureau ������������������������������������
23.8
2015
Agriculture ������������������������������������������������
Base Discretionary Funding by
Agency: 1
2014
–23.1
20.0
1.2
9.4
0.7
7.9
18.9
0.3
8.8
4.8
74.8
14.0
14.6
47.2
13.4
29.4
12.9
41.8
41.6
86.3
11.5
29.3
71.7
547.3
10.3
1.8
25.2
2017
–22.7
20.4
1.2
9.6
0.7
8.0
19.3
0.3
8.9
4.9
76.4
14.3
14.9
48.1
13.6
30.0
13.1
42.6
42.2
88.0
11.7
29.9
72.7
556.4
10.7
2.1
25.5
2018
–21.7
20.6
1.2
9.7
0.7
8.1
19.5
0.3
9.0
5.0
78.0
14.5
15.1
48.6
13.7
30.3
13.3
43.0
42.5
88.8
12.2
30.6
73.2
564.4
11.9
3.2
25.7
2019
–26.5
20.8
1.3
9.8
0.7
8.2
19.7
0.3
9.1
5.0
79.6
14.8
15.2
48.9
13.8
30.6
13.4
43.4
43.0
89.7
12.3
31.0
73.7
570.0
15.5
6.7
26.0
2020
–21.5
21.1
1.3
10.0
0.8
8.4
20.1
0.3
9.3
5.1
81.2
15.1
15.5
49.9
14.1
31.2
13.7
44.2
43.8
91.5
12.6
31.6
74.7
581.4
10.6
1.6
26.5
2021
Outyears
–21.1
21.6
1.3
10.2
0.8
8.5
20.5
0.3
9.5
5.2
83.2
15.5
15.8
50.8
14.3
31.9
14.0
45.0
44.8
93.3
12.8
32.2
75.8
593.0
10.4
1.2
27.1
2022
–19.5
22.0
1.3
10.4
0.8
8.7
20.9
0.3
9.7
5.3
85.2
15.8
16.2
51.9
14.6
32.5
14.2
45.8
45.7
95.2
13.1
32.8
76.8
604.9
10.7
1.3
27.6
2023
–18.3
22.4
1.4
10.6
0.8
8.9
21.3
0.3
9.9
5.4
87.3
16.2
16.5
52.9
14.8
33.1
14.5
46.7
46.6
97.1
13.3
33.5
77.9
617.0
10.8
1.3
28.2
2024
58.3
15.2
125.9
20162020
112.0
22.1
264.0
20162025
–18.1
22.9
1.4
10.8
0.8
9.1
21.7
0.3
10.1
5.5
89.4
16.5
16.8
53.9
15.1
33.8
14.8
47.5
47.5
99.0
13.6
34.2
79.0
–93.9
101.8
6.1
48.1
3.6
39.9
95.8
1.9
44.4
24.5
379.0
70.4
74.2
239.0
67.7
135.2
65.6
211.8
210.4
432.6
60.3
150.7
362.0
–192.4
211.8
12.8
100.1
7.6
83.5
200.2
3.4
92.8
51.1
805.3
149.5
155.0
498.4
140.6
297.8
136.7
441.1
438.8
908.9
125.7
315.1
746.3
629.3 2,772.4 5,798.1
11.3
1.5
28.7
2025
Totals
1,086.8 1,108.4 1,129.3 1,146.2 1,157.1 1,180.0 1,203.8 1,229.7 1,255.6 1,281.5 5,627.7 11,778.3
.........
20.0
1.2
9.6
0.7
7.7
18.5
0.8
8.6
4.7
70.2
12.8
14.3
46.3
13.2
14.9
12.9
41.0
41.2
79.9
12.6
29.9
70.7
534.3
9.8
1.5
23.5
2016
Actual Enacted Request
(Budget authority in billions of dollars)
Table S–11. Funding Levels for Appropriated (“Discretionary”) Programs by Agency
134
SUMMARY TABLES
9.3
.........
5.4
0.1
2.8
2.5
6.5
.........
0.9
.........
.........
.........
0.9
5.6
.........
5.6
.........
.........
.........
.........
0.2
0.2
.........
.........
Program Integrity ��������������������������������������
Health & Human Services �����������������
Labor ���������������������������������������������������
Treasury ����������������������������������������������
SSA ������������������������������������������������������
Disaster Relief ���������������������������������������������
Agriculture ������������������������������������������
Homeland Security 4 ���������������������������
Small Business Administration ���������
Wildfire Suppression 8 ��������������������������������
Agriculture ������������������������������������������
Interior ������������������������������������������������
Other Emergency Funding �����������������������
Defense �����������������������������������������������
Health & Human Services �����������������
State and Other International
Programs ����������������������������������������
.........
.........
.........
.........
1.1
0.9
0.2
6.9
.........
6.7
0.2
2.3
0.4
*
0.7
1.2
.........
7.0
58.0
50.9
.........
2016
.........
.........
.........
.........
1.1
0.9
0.2
.........
.........
.........
.........
1.5
0.4
*
1.0
.........
26.7
.........
26.7
.........
.........
2017
.........
.........
.........
.........
1.1
0.9
0.2
.........
.........
.........
.........
1.9
0.4
*
1.4
.........
26.7
.........
26.7
.........
.........
2018
.........
.........
.........
.........
1.1
0.9
0.2
.........
.........
.........
.........
2.3
0.5
*
1.8
.........
26.7
.........
26.7
.........
.........
2019
.........
.........
.........
.........
1.1
0.9
0.2
.........
.........
.........
.........
2.7
0.5
*
2.2
.........
26.7
.........
26.7
.........
.........
2020
.........
.........
.........
.........
1.1
0.9
0.2
.........
.........
.........
.........
2.8
0.5
0.1
2.2
.........
26.7
.........
26.7
.........
.........
2021
Outyears
.........
.........
.........
.........
1.2
0.9
0.2
.........
.........
.........
.........
2.8
0.5
0.1
2.3
.........
.........
.........
.........
.........
.........
2022
.........
.........
.........
.........
1.2
1.0
0.2
.........
.........
.........
.........
2.9
0.5
0.1
2.3
.........
.........
.........
.........
.........
.........
2023
.........
.........
.........
.........
1.2
1.0
0.2
.........
.........
.........
.........
3.0
0.6
0.1
2.4
.........
.........
.........
.........
.........
.........
2024
.........
.........
.........
.........
1.2
1.0
0.2
.........
.........
.........
.........
3.1
0.6
0.1
2.4
.........
.........
.........
.........
.........
.........
2025
.........
.........
.........
.........
5.5
4.4
1.0
6.9
.........
6.7
0.2
10.6
2.2
0.2
7.0
1.2
106.7
7.0
164.7
50.9
.........
20162020
.........
.........
.........
.........
11.4
9.2
2.2
6.9
.........
6.7
0.2
25.1
4.9
0.5
18.6
1.2
133.3
7.0
191.3
50.9
.........
20162025
Totals
Grand Total, Discretionary Funding ����� 1,129.5
1,114.3
1,154.9 1,137.6 1,158.9 1,176.2 1,187.5 1,210.5 1,207.8 1,233.8 1,259.8 1,285.8 5,815.3 12,013.0
* $50 million or less.
1
Amounts in the actual and enacted years of 2014 and 2015 exclude changes in mandatory programs enacted in appropriations bills since those amounts have been rebased
as mandatory, whereas amounts in 2016 are net of these proposals.
2
The Department of Defense (DOD) levels in 2017–2025 include funding that will be allocated, in annual increments, to the National Nuclear Security Administration
(NNSA). Current estimates by which DOD’s budget authority will decrease and NNSA’s will increase are, in millions of dollars: 2017: $1,602; 2018: $1,665; 2019: $1,698;
2020: $1,735; 2017–2025: $15,910. DOD and NNSA are reviewing NNSA’s outyear requirements and these will be included in future reports to the Congress.
3
Funding from the Hospital Insurance and Supplementary Medical Insurance trust funds for administrative expenses incurred by the Social Security Administration that
support the Medicare program are included in the Health and Human Services total and not in the Social Security Administration total.
4
The 2015 Enacted levels are illustratively adjusted to reflect the 2015 Request for the Department of Homeland Security since the programs and activities in the
Department were under a short-term continuing resolution at the time the 2016 Budget was developed.
.........
.........
.........
6.5
0.1
6.4
.........
1.5
0.4
.........
.........
1.1
73.5
64.2
.........
91.9
85.2
0.2
2015
Overseas Contingency Operations ����
Defense �����������������������������������������������
Homeland Security 4 ���������������������������
State and Other International
Programs ����������������������������������������
Overseas Contingency Operations
Outyears 7 ����������������������������������������
Discretionary Cap Adjustments and
Other Funding (not included above): 6
2014
Actual Enacted Request
(Budget authority in billions of dollars)
Table S–11. Funding Levels for Appropriated (“Discretionary”) Programs by Agency—Continued
THE BUDGET FOR FISCAL YEAR 2016
135
8
7
6
5
The 2016 Budget includes allowances, similar to the Function 920 allowances used in Budget Resolutions, to represent amounts to be allocated among the respective
agencies to reach the proposed defense and non-defense caps for 2017 and beyond. These levels are determined for illustrative purposes but do not reflect specific policy
decisions.
Where applicable, amounts in 2014 through 2025 are existing or proposed cap adjustments designated pursuant to Section 251(b)(2) of the BBEDCA, as amended.
The 2016 Budget includes placeholder amounts of nearly $27 billion per year for Government-wide OCO funding from 2017 to 2021. The placeholder amounts continue
to reflect a total OCO budget authority cap from 2013 to 2021 of $450 billion, in line with previous years’ policy, but do not reflect any specific decisions or assumptions
about OCO funding in any particular year. These amounts do not reflect the Administration’s intent to transition all enduring costs currently funded in the OCO budget
to the base budget beginning in 2017 and ending by 2020. Those amounts will be refined in subsequent Budgets as the Administration develops its OCO transition plan.
For 2017 through 2025, the cap adjustment levels are a placeholder that increase at the policy growth rates in the President’s Budget. The existing disaster relief cap
adjustment ceiling (which is determined one year at a time) would be reduced by the amount provided for wildfire suppression activities under the cap adjustment for the
preceding fiscal year. Those amounts will be refined in subsequent Budgets as data on the average costs for wildfire suppression are updated annually.
(Budget authority in billions of dollars)
Table S–11. Funding Levels for Appropriated (“Discretionary”) Programs by Agency—Continued
136
SUMMARY TABLES
3.7
2.2
3.1
1.5
1.5
Percent change, nominal GDP, year/year ���������������������������
Real GDP, percent change, year/year ���������������������������������
Real GDP, percent change, Q4/Q4 ��������������������������������������
GDP chained price index, percent change, year/year ��������
Consumer Price Index, percent change, year/year ���������
2.4
10-year Treasury notes �������������������������������������������������������
2.6
*
1.7
1.5
2.1
2.2
3.7
17,394
2014
2.8
0.4
1.4
1.4
3.0
3.1
4.6
18,188
2015
3.3
1.5
1.9
1.6
3.0
3.0
4.7
19,039
2016
3.7
2.4
2.1
1.8
2.7
2.8
4.7
19,933
2017
4.0
2.9
2.2
2.0
2.5
2.6
4.6
20,847
2018
4.3
3.2
2.3
2.0
2.3
2.4
4.4
21,770
2019
4.5
3.3
2.3
2.0
2.3
2.3
4.3
22,717
2020
Projections
4.5
3.4
2.3
2.0
2.3
2.3
4.3
23,705
2021
4.5
3.4
2.3
2.0
2.3
2.3
4.3
24,736
2022
4.5
3.5
2.3
2.0
2.3
2.3
4.3
25,812
2023
4.5
3.5
2.3
2.0
2.3
2.3
4.3
26,934
2024
4.5
3.5
2.3
2.0
2.3
2.3
4.3
28,106
2025
Unemployment rate, civilian, percent 3 �������������������������������
7.4
6.2
5.4
5.1
4.9
4.9
5.0
5.1
5.2
5.2
5.2
5.2
5.2
*0.05 percent or less.
Note: A more detailed table of economic assumptions appears in Chapter 2, “Economic Assumptions and Interactions with the Budget,” in the Analytical Perspectives volume
of the Budget.
1
Based on information available as of mid-November 2014.
2
Seasonally adjusted CPI for all urban consumers.
3
Annual average.
4
Average rate, secondary market (bank discount basis).
0.1
91-day Treasury bills 4 ���������������������������������������������������������
Interest rates, percent: 3
2
16,768
Nominal level, billions of dollars ����������������������������������������
Gross Domestic Product (GDP):
Actual
2013
(Calendar years)
Table S–12. Economic Assumptions 1
THE BUDGET FOR FISCAL YEAR 2016
137
–1
–6
1
Net purchases of non-Federal securities by the
National Railroad Retirement Investment
Trust (NRRIT) �������������������������������������������������
144
726
313
797
834
7
1,082
Change in other factors ���������������������������������������������������
Total, change in debt subject to statutory
limitation ��������������������������������������������������������������
17,768
13
17,781
Debt issued by Treasury ��������������������������������������������������
Adjustment for discount, premium, and coverage 3 ��������
Total, debt subject to statutory limitation 4 �������������
Debt Subject to Statutory Limitation, End of Year:
1
278
15
18,615
18,600
107
797
Change in debt held by Government accounts ���������������
726
144
–*
313
–*
Change in debt held by the public ����������������������������������
Changes in Debt Subject to Statutory Limitation:
.........
114
–*
96
8
121
12
Net change in other financial assets and
liabilities 2 ��������������������������������������������������������
Subtotal, changes in financial assets and
liabilities ����������������������������������������������������
Seigniorage on coins �������������������������������������������������
Total, other transactions affecting
borrowing from the public �������������������������
Total, requirement to borrow from the
public (equals change in debt held
by the public) ������������������������������������
42
583
3.2%
70
485
2.8%
Unified budget deficit �����������������������������������������
As a percent of GDP ��������������������������������������
353
229
2015
Other transactions affecting borrowing from the public:
Changes in financial assets and liabilities: 1
Change in Treasury operating cash balance�������
Net disbursements of credit financing accounts:
Direct loan accounts ��������������������������������������
Guaranteed loan accounts ����������������������������
Troubled Asset Relief Program (TARP)
equity purchase accounts ��������������������������
256
229
Unified budget deficit:
Primary deficit (+)/surplus (–) ���������������������������������
Net interest ���������������������������������������������������������������
Financing:
Actual
2014
17
19,323
19,307
708
2
104
602
602
128
128
–*
.........
–1
–*
132
–3
.........
474
2.5%
191
283
2016
18
20,087
20,068
763
2
165
596
596
134
134
–*
.........
–1
–*
137
–3
.........
463
2.3%
102
361
2017
19
20,864
20,845
778
2
165
610
610
131
131
–*
.........
–1
–*
133
–1
.........
479
2.3%
55
424
2018
(Dollar amounts in billions)
21
21,637
21,616
773
3
126
644
644
127
127
–*
.........
–1
–*
129
–2
.........
518
2.4%
34
483
2019
22
22,412
22,389
775
2
97
676
676
121
122
–*
.........
–1
–*
125
–2
.........
554
2.5%
10
544
2020
Estimate
24
23,214
23,191
803
2
86
714
714
114
114
–*
.........
–1
–*
119
–4
.........
600
2.6%
4
597
2021
Table S–13. Federal Government Financing and Debt
25
23,956
23,931
742
2
4
736
736
110
111
–*
.........
–1
–*
117
–5
.........
626
2.6%
–23
649
2022
26
24,720
24,693
763
2
16
746
746
111
111
–*
.........
–*
–*
119
–8
.........
635
2.5%
–65
700
2023
27
25,501
25,474
781
1
33
747
747
108
108
–*
.........
–1
–*
117
–8
.........
639
2.4%
–106
744
2024
27
26,269
26,242
768
*
–26
794
794
107
108
–*
.........
–*
–*
116
–8
.........
687
2.5%
–99
785
2025
138
SUMMARY TABLES
74.1%
As a percent of GDP ��������������������������������������������
1,161
1,065
2
1
96
25
–23
Guaranteed loan accounts ����������������������������������
TARP equity purchase accounts ������������������������
Government-sponsored enterprise preferred stock ���
Non-Federal securities held by NRRIT �������������������
Other assets net of liabilities �����������������������������������
*
96
24
–23
7
1,293
200
14,108
75.0%
5,225
14,108
19,334
19,307
27
2016
*
96
23
–23
4
1,430
200
14,705
74.6%
5,390
14,705
20,095
20,068
27
2017
–*
96
22
–23
3
1,564
200
15,315
74.3%
5,555
15,315
20,870
20,845
25
2018
–*
96
22
–23
2
1,693
200
15,959
74.1%
5,681
15,959
21,640
21,616
24
2019
–*
96
21
–23
–*
1,818
200
16,635
74.0%
5,778
16,635
22,413
22,389
24
2020
Estimate
–*
96
20
–23
–4
1,936
200
17,349
74.0%
5,864
17,349
23,213
23,191
23
2021
–*
96
19
–23
–10
2,053
200
18,085
73.9%
5,868
18,085
23,953
23,931
22
2022
–1
96
19
–23
–17
2,173
200
18,830
73.7%
5,885
18,830
24,715
24,693
22
2023
–1
96
18
–23
–26
2,290
200
19,577
73.5%
5,917
19,577
25,494
25,474
21
2024
–1
96
18
–23
–34
2,406
200
20,371
73.3%
5,891
20,371
26,262
26,242
21
2025
Total, financial assets net of liabilities ��������������
1,324
1,469
1,597
1,731
1,862
1,989
2,111
2,225
2,335
2,447
2,555
2,663
Debt held by the public net of financial
assets ����������������������������������������������������������
11,455 12,038 12,512 12,974 13,453
13,970
14,524
15,124
15,749
16,384
17,022
17,709
As a percent of GDP ���������������������������������
66.4%
66.9%
66.5%
65.8%
65.3%
64.9%
64.6%
64.5%
64.4%
64.2%
63.9%
63.7%
* $500 million or less.
1
A decrease in the Treasury operating cash balance (which is an asset) is a means of financing a deficit and therefore has a negative sign. An increase in checks
outstanding (which is a liability) is also a means of financing a deficit and therefore also has a negative sign.
2
Includes checks outstanding, accrued interest payable on Treasury debt, uninvested deposit fund balances, allocations of special drawing rights, and other liability
accounts; and, as an offset, cash and monetary assets (other than the Treasury operating cash balance), other asset accounts, and profit on sale of gold.
3
Consists mainly of debt issued by the Federal Financing Bank (which is not subject to limit), Treasury securities held by the Federal Financing Bank, the unamortized
discount (less premium) on public issues of Treasury notes and bonds (other than zero-coupon bonds), and the unrealized discount on Government account series
securities.
4
Legislation enacted February 15, 2014, (P.L. 113-83) temporarily suspends the debt limit through March 15, 2015.
5
Treasury securities held by the public and zero-coupon bonds held by Government accounts are almost all measured at sales price plus amortized discount or less
amortized premium. Agency debt securities are almost all measured at face value. Treasury securities in the Government account series are otherwise measured at face
value less unrealized discount (if any).
6
At the end of 2014, the Federal Reserve Banks held $2,451.7 billion of Federal securities and the rest of the public held $10,328.1 billion. Debt held by the Federal Reserve
Banks is not estimated for future years.
*
96
25
–23
10
200
158
13,506
75.1%
Less financial assets net of liabilities:
Treasury operating cash balance ����������������������������
Credit financing account balances:
Direct loan accounts �������������������������������������������
Debt held by the public ����������������������������������������������������
12,780
5,015
12,780
Debt Held by the Public Net of Financial Assets:
18,628
17,794
Total, gross Federal debt ������������������������������������
Held by:
Debt held by Government accounts ������������������������
Debt held by the public 6 ������������������������������������������
5,121
13,506
18,600
27
2015
17,768
26
Gross Federal debt: 5
Debt issued by Treasury ������������������������������������������
Debt issued by other agencies ���������������������������������
Debt Outstanding, End of Year:
Actual
2014
(Dollar amounts in billions)
Table S–13. Federal Government Financing and Debt—Continued
THE BUDGET FOR FISCAL YEAR 2016
139
OMB CONTRIBUTORS TO THE 2016 BUDGET
The following personnel contributed to the preparation of this publication. Hundreds, perhaps thousands, of others throughout the Government also deserve credit for their valuable contributions.
A
Andrew Abrams
Chandana L. Achanta
Brenda Aguilar
Shagufta Ahmed
Steven Aitken
David W. Alekson
Emily R. Alinikoff
Victoria L. Allred
Lois E. Altoft
Jessica A. Andreasen
Benton T. Arnett
Aviva R. Aron-Dine
Anna R. Arroyo
Jeramie T. Ashton
Emily E. Askew
Scott B. Astrada
Lisa L. August
Renee Austin
Kristin B. Aveille
B
Peter Babb
Michelle B. Bacon
Jessie W. Bailey
Paul W. Baker
Carol A. Bales
Pratik S. Banjade
Avital Bar-Shalom
Taylor J. Barnard
Bethanne Barnes
Patti A. Barnett
Jody M. Barringer
Mary Barth
Sarah O. Bashadi
Kheira Z. Benkreira
Joseph J. Berger
Sam K. Berger
Elizabeth A. Bernhard
Jamie L. Berryhill
Mathew C. Blum
James Boden
Erin Boeke Burke
Cassie L. Boles
Melissa B. Bomberger
Cole A. Borders
Ariel V. Boyarsky
William J. Boyd
Mollie Bradlee
Bing Bradshaw
Joshua Brammer
Michael Branson
Alex M. Brant
Joseph F. Breighner
Eric J. Bremen
Andrea M. Brian
Candice M. Bronack
Jonathan M. Brooks
Andrew R. Brown
Dustin S. Brown
Jamal T. Brown
James A. Brown
Michael T. Brunetto
Robert W. Buccigrosso
Paul Bugg
Tom D. Bullers
Scott H. Burgess
Ben Burnett
Ryan M. Burnette
John D. Burnim
John C. Burton
Mark Bussow
C
Steven Cahill
Jeffrey B. Cahoon
Emily E. Cain
Gregory J. Callanan
Erin L. Campbell
Mark F. Cancian
Eric Cardoza
Matthew B. Carney
Todd S. Carolin
J. Kevin Carroll
William S. S. Carroll
Scott D. Carson
Alexandra M. Casiano
Mary I. Cassell
Daniel E. Chandler
Maureen M. CharanDanzot
James Chase
Anita Chellaraj
Yungchih Chen
Robert G. Chun
Edward K. Chung
Deidre A. Ciliento
Michael Clark
Beth F. Cobert
Michael L. Cohen
William P. Cole
Victoria W. Collin
Debra M. Collins
Kelly T. Colyar
Jose A. Conde
Sarah Haile Coombs
Justin P. Cormier
Martha B. Coven
Catherine E. Crato
Joseph Crilley
Rose Crow
141
Albert T. Crowley
Juliana Crump
Craig Crutchfield
David M. CruzGlaudemans
Edna Falk Curtin
C. Tyler Curtis
William Curtis
D
D. Michael Daly
Neil B. Danberg
Lisa E. Danzig
Kristy L. Daphnis
Alexander J. Daumit
Joanne Chow
Davenport
Kenneth L. Davis
Margaret B. DavisChristian
Chad J. Day
Carolyn M. Dee
Brian C. Deese
John H. Dick
Julie Allen Dingley
Derek M. Donahoo
Angela M. Donatelli
Paul S. Donohue
Shaun L. S. Donovan
Bridget C. Dooling
Vladik Dorjets
Lisa Cash Driskill
Julia M. Druhan
Robin DuddyTenbrunsel
Francis J. DuFrayne
Laura E. Duke
Matthew S. Dunn
142
LIST OF CONTRIBUTORS
E
Jacqueline A. Easley
Russell J. Edmiston
Jeanette Edwards
Emily M. Eelman
Christopher J. Elliott
Tonya L. Ellison-Mays
Noah Engelberg
Michelle A. Enger
Leandra English
Mark T. Erwin
Edward V. Etzkorn
Yasmine S. Evans
F
Chris Fairhall
Robert Fairweather
Michael C. Falkenheim
Michael-Kourosh B.
Fallahkhair
Shao W. Fang
Kara L. Farley-Cahill
Christine E.
Farquharson
Kira R. Fatherree
Andrew R. Feldman
Patricia A. Ferrell
Lesley A. Field
Mary S. Fischietto
E Holly Fitter
John Joseph
Fitzpatrick
Darlene B. Fleming
Ibrahima Fofana
Daniel E. Folliard
Tera L. Fong
Harvey D. Fort
Nicholas A. Fraser
Elizabeth A. Frederick
Marc P. Freiman
Farrah B. Freis
Nathan J. Frey
Patrick J. Fuchs
Tamara L. Fucile
G
Germaine G. Gabriel
Janice Gallant
Marc Garufi
Thomas O. Gates
Benjamin Patrick
O’Hora Geare
Jeremy J. Gelb
Brian Gillis
Janelle R. Gingold
Joshua S. Glazer
Porter O. Glock
Ja’Cia D. Goins
Melanie R. Goldberg
Jeffrey D. Goldstein
Oscar Gonzalez
Thomas W.
Grannemann
Kathleen A. Gravelle
Richard E. Green
Aron Greenberg
Hester C. Grippando
Andrea L. Grossman
H
Michael B. Hagan
Erika S. Hamalainen
William F. Hamele
Christina L. Hansen
Jennifer L. Hanson
Anetra L. Harbor
Linda W. Hardin
Derek M. Hardison
Dionne Hardy
Julian J. Harris
Letetia M. Harris
Patsy W. Harris
Brian A. HarrisKojetin
Nicholas R. Hart
Paul Harvey
Ryan Bensussan
Harvey
Tomer Hasson
Alyson M. Hatchett
Kyle W. Hathaway
David Haun
Laurel S. Havas
Nora K. Hawkins
Nichole M. Hayden
Mark Hazelgren
Margaret A. Heins
Jeffrey K. Hendrickson
John David Henson
Kevin W. Herms
Alexander G.
Hettinger
Gretchen T. Hickey
Michael J. Hickey
Cortney J. Higgins
Mary Lou Hildreth
Amanda M. Hill
Andrew D. Hire
Thomas E. Hitter
Jennifer E. Hoef
Joanne Cianci Hoff
Adam Hoffberg
Stuart Hoffman
James S. Holm
Glenn L. Holmes
Brian R. Hooker
Shannon C. Horn
Daniel Hornung
Lynette HornungKobes
Brian M. Hoxie
Grace Hu
Jamie W. Huang
Rhea A. Hubbard
Kathy M. Hudgins
Jeremy D. Hulick
Alexander T. Hunt
Lorraine D. Hunt
James C. Hurban
Jaki Mayer Hurwitz
I
Adrian B. Ilagan
Tae H. Im
Mason C. Ingram
Janet E. Irwin
Patrick N. Issa
Paul Iwugo
J
Antoine L. Jackson
Brian M. Jacob
Laurence R. Jacobson
Erica L. Jacquez
Varun M. Jain
Carol Jenkins
Carol S. Johnson
Katherine B. Johnson
Kim I. Johnson
Michael D. Johnson
Bryant A. Jones
Danielle Y. Jones
Denise Bray Jones
Joshua S. Jones
Lisa M. Jones
Othni A. Jones
Hee Jun
K
Paul A. Kagan
Richard E. Kane
Jacob H. Kaplan
Michele D. Kaplan
Jenifer Liechty
Karwoski
Regina L. Kearney
Daniel J. Keenaghan
Matthew J. Keeneth
Ioanna Kefalas
Grace Kelemen
Hunter S. Kellett
Nancy B. Kenly
Amanda R. Kepko
Alper A. Kerman
Meshach E. Keye
Paul E. Kilbride
James H. Kim
Jennifer M. Kim
Barry King
Kelly Kinneen
Carole Kitti
Benjamin W. Klay
Sarah B. Klein
Kevin E. Kobee
John Kraemer
THE BUDGET FOR FISCAL YEAR 2016
Lori A. Krauss
Joydip Kundu
Alexander K. Kwon
L
Christopher D. LaBaw
Jonathan S. Lachman
Michael R. Lachowicz
Leonard L. Lainhart
Chad A. Lallemand
Lawrence L. Lambert
Daniel LaPlaca
Derek B. Larson
Eric P. Lauer
Jessie L. LaVine
Mary A. Lazzeri
Donald H. Leathem
Allina Lee
Jessica K. Lee
Karen F. Lee
Sarah S. Lee
Susan E. Leetmaa
Bryan León
Jeremy L. León
Andrea Leung
Malissa C. Levesque
John C. Levock
Matthew Alan Lewis
Sheila Lewis
Wendy L. Liberante
Daniel L. Lichliter
Richard Alan
Lichtenberger
Sara R. Lichtenstein
Kristina E. Lilac
Jennifer M. Lipiew
Patrick Locke
Aaron M. Lopata
Sara R. López
Alexander W. Louie
Adrienne Lucas
Gideon F. Lukens
Sarah Lyberg
M
Chi T. Mac
Deborah L. Macaulay
Ryan J. MacMaster
John S. MacNeil
David A. Mader
Natalia Mahmud
Claire A. Mahoney
Lesley R. Maloney
Dominic J. Mancini
Robert Mann
Sharon Mar
Celinda A. Marsh
Brendan A. Martin
Kathryn E. Martin
Rochelle W. Martinez
Richard K. Mattick
Andrew Mayock
Shelly McAllister
George H. McArdle
Scott J. McCaughey
Alexander J.
McClelland
Connor G. McCrone
Timothy D. McCrosson
Anthony W. McDonald
Christine A. McDonald
Katrina A. McDonald
Renford A. McDonald
Luther C. McGinty
Kevin J. McKernin
Christopher McLaren
Robin J. McLaughry
Megan B. McPhaden
William J. McQuaid
William J. Mea
Aalok S. Mehta
Dinesh Mehta
Inna L. Melamed
Patrick J. Mellon
Barbara A. Menard
Flavio Menasce
Jose A. Mendez
Jessica Nielsen Menter
P. Thaddeus
Messenger
Ashley E. Miller
Julie L. Miller
143
Kimberly Miller
Susan M. Minson
Asma Mirza
RaShawn L. Mitchell
Rehana I. Mohammed
Cindy H. Moon
Martha Moorehouse
Todd M. Muehlenbeck
James S. Mulligan
Christian G. Music
Hayley W. Myers
Kimberley L Myers
N
Jennifer M. Nading
Jeptha E. Nafziger
Larry J. Nagl
Anna M. Naimark
Teresa B. Nankivell
Barry Napear
Ashley M. Nathanson
Allie R. Neill
Kimberly P. Nelson
Melissa K. Neuman
Betsy A. Newcomer
Joanie F. Newhart
John D. Newman
Kimberly Armstrong
Newman
Melanie R. Newman
Teresa O. Nguyen
Brian A. Nichols
John T. Nichols
Tim H. Nusraty
Joseph B. Nye
O
Erin O’Brien
Devin L. O’Connor
Matthew J. O’Kane
Brendan J. O’Meara
Justin M. Oliveira
Paul Oliver
Somer Omar
Farouk Ophaso
Allison B. Orris
Jared L. Ostermiller
Tyler J. Overstreet
D. Brooke Owens
Adeniran O. Oyebade
P
Benjamin J. Page
Heather C. Pajak
Jennifer E. Park
Sangkyun Park
Sharon Parrott
John C. Pasquantino
Arati N. Patel
Terri B. Payne
Jacqueline M. Peay
Falisa L. Peoples-Tittle
Michael A. Perz
Andrea M. Petro
Stacey Que-Chi Pham
Carolyn R. Phelps
Karen A. Pica
Joseph Pipan
Jeffrey M. Pitts
Alisa M. Ple-Plakon
Kimberly A. Pohland
Rachel C. Pollock
Aaron W. Pollon
Mark J. Pomponio
Ruxandra Pond
Sarah R. Porter
Celestine M. Pressley
Larrimer S. Prestosa
Jamie M. Price
Daniel M. Proctor
Robert Purdy
R
Lucas R. Radzinschi
Latonda Glass Raft
Moshiur Rahman
Maria S. Raphael
Jeff Reczek
Julia G. Reed
Mark A. Reger
Rudolph G. Regner
Paul B. Rehmus
Sean C. Reilly
Thomas M. Reilly
144
LIST OF CONTRIBUTORS
Scott D. Renda
Richard J. Renomeron
Julianna P. Rice
Keri A. Rice
Shannon A. Richter
Kyle Stayton Riggs
Emma K. Roach
Benjamin T. Roberts
Beth Higa Roberts
Donovan Robinson
Marshall J. Rodgers
Juan C. Rodriguez
Alexandra N. Rogers
Meredith B. Romley
Dan T. Rosenbaum
David J. Rowe
Mario Roy
Danielle R. Royal
Brian Rozental
Joshua Rubin
Trevor H. Rudolph
Anne E. Rung
Latisha M. Russell
S
Fouad P. Saad
Preeya Saikia
John Asa Saldivar
Dominic K. Sale
Mark S. Sandy
Subu Sangameswar
Katherin Monica
Santoro
Matthew R. Sarge
Lisa Schlosser
Tricia Schmitt
Grant M. Schneider
Andrew M. Schoenbach
Daniel K. Schory
Margo Schwab
Nancy E. Schwartz
Mariarosaria
Sciannameo
Jasmeet K. Seehra
Robert B. Seidner
Will Sellheim
Patricia Moore Shaffer
Shahid N. Shah
Dianne Shaughnessy
Paul Shawcross
Howard A. Shelanski
Melissa Shih
Gary F. Shortencarrier
Sara R. Sills
Samantha E.
Silverberg
Brandon A. Simons
John L. S. Simpkins
Daniel Liam Singer
Whitney O. Singletary
Benjamin J. Skidmore
Jack Smalligan
Curtina O. Smith
Jennifer A. Smith
Stannis M. Smith
Silvana Solano
Roderic A. Solomon
David A. Spett
Kathryn B. Stack
Travis C. Stalcup
Scott R. Stambaugh
Melanie A. Stansbury
Nora Stein
Lamar R. Stewart
Gary R. Stofko
Carla B. Stone
Thomas J. Suarez
Claire D. Suh
Kevin J. Sullivan
Sarah Sullivan
Jessica L. Sun
Erin Sutton
Jennifer A. Swartz
Ben Sweezy
Aaron L. Szabo
T
Teresa A. Tancre
Naomi Taransky
Benjamin K. Taylor
Myra L. Taylor
Nathaniel Nana Kojo
Taylor
Amanda L. Thomas
Judith F. Thomas
Latina D. Thomas
Payton A. Thomas
Will Thomas
Courtney B.
Timberlake
John R. Tindel
Philip Tizzani
Thomas Tobasko
Richard W. Toner
Rosanna Torres
Pizarro
Mariel E. Townsend
Gil M. Tran
Natalie Trochimiuk
Lily C. Tsao
Donald L. Tuck
Melissa H. Turner
Benjamin J. Turpen
U
Christian Unkenholz
Darrell J. Upshaw
Taylor J. Urbanski
V
Matthew J. Vaeth
Ofelia M. Valeriano
Amanda L. Valerio
Cynthia Vallina
Haley Van Dyck
Sarita Vanka
Steven L. VanRoekel
David W. Varvel
Areletha L. Venson
Alexandra Ventura
Patricia A. Vinkenes
Sara M. Vitolo
Dean R. Vonk
Ann M. Vrabel
W
James A. Wade
Katherine K. Wallman
Heather V. Walsh
Kan Wang
Tim Wang
Sharon A. Warner
Geovette E.
Washington
Gini S. Waters
Gary Waxman
Mark A. Weatherly
Bess Weaver
Jeffrey A. Weinberg
Sharon K. Weiner
David Weisshaar
Philip R. Wenger
Max W. West
Michael S. Wetklow
Arnette C. White
Catherine E. White
Kamela White
Kim S. White
Sherron R. White
Chad S. Whiteman
Mary Ellen Wiggins
Shimika Wilder
Calvin L. Williams
Debra (Debbie) L.
Williams
Monique C. Williams
Paul A. Winters
Julia B. Wise
Julie Wise
Elizabeth D. Wolkomir
Raymond J.M. Wong
Charles E.
Worthington
Lauren E. Wright
Sophia M. Wright
William Wu
Steven N. Wynands
Y
Abra S. Yeh
Melany N. Yeung
Carl H. Young, III
Z
Ali A. Zaidi
Charles H. Zhou
Gail S Zimmerman
Rita R. Zota
Budget of the U.S. Government, FY 2016
Stock number: 041-001-00709-1
ISBN number: 978-0-16-092678-5
Price: $37.00
Appendix-Budget of the U.S. Government, FY 2016
Stock number: 041-001-00710-5
ISBN number: 978-0-16-092679-2
Price: $78.00
Analytical Perspectives-Budget of the U.S. Government, FY 2016
Stock number: 041-001-00711-3
ISBN number: 978-0-16-092680-8
Price: $55.00
The Federal Budget on CD-ROM-Budget of the U.S. Government, FY 2016
Stock number: 041-001-00712-1
ISBN number: 978-0-16-092681-5
Price: $28.00
Order Processing Code:
3605
Qty
Easy Secure Internet:
Toll Free: 866 512–1800
DC Area: 202 512–1800
Fax:
202 512–2104
bookstore.gpo.gov
Mail:US Government Publishing Office
P.O. Box 979050
St. Louis, MO 63197–9000
Stock Number
ISBN Number
Publication Title
Unit Price
041-001-00709-1
978-0-16-092678-5
Budget of the U.S. Government, FY 2016
$37.00
041-001-00710-5
978-0-16-092679-2
Appendix-Budget of the U.S. Government, FY 2016
$78.00
041-001-00711-3
978-0-16-092680-8
Analytical Perspectives-Budget of the U.S. Government, FY 2016
$55.00
041-001-00712-1
978-0-16-092681-5
The Federal Budget on CD-ROM-Budget of the U.S. Government, FY 2016
$28.00
Total Price
Total Order
Check Method of Payment
Personal Name
Company Name
(Please type or Print)
❑
Check payable to Superintendent of Documents
❑
SOD Deposit Account
❑
VISA
❑
MasterCard
❑
Discover/NOVUS
❑
American Express
Street Address
(EXPIRATION DATE
Thank you for your order!
City, State, Zip Code
Daytime Phone Including Area Code
AUTHORIZING SIGNATURE
01/15
I S B N 978-0-16-092678-5
90000
For sale by the Superintendent of Documents,
Internet: bookstore.gpo.gov Phone: toll free (866
Fax: (202) 512-2104 Mail: Stop IDCC, W
I S B N 978-0-16-09
9
780160 926785
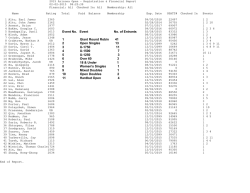
© Copyright 2026