
Download (1MB) - Munich Personal RePEc Archive
M PRA Munich Personal RePEc Archive Employment of ICT specialists in the EU (2004-2012) Anna Sabadash DG ESTAT, DG JRC, UNIPV November 2014 Online at http://mpra.ub.uni-muenchen.de/61644/ MPRA Paper No. 61644, posted 27. January 2015 20:20 UTC INSTITUTE FOR PROSPECTIVE TECHNOLOGICAL STUDIES DIGITAL ECONOMY WORKING PAPER 2014-01 Employment of ICT specialists in the EU (2004-2012) Anna Sabadash 2014 Report EUR XXXXX EN European Commission Joint Research Centre Institute for Prospective Technological Studies Contact information Address: Edificio Expo. c/ Inca Garcilaso, 3. E-41092 Seville (Spain) E-mail: [email protected] Tel.: +34 954488318 Fax: +34 954488300 http://ipts.jrc.ec.europa.eu http://www.jrc.ec.europa.eu This publication is a Working Paper by the Joint Research Centre of the European Commission. It results from the Digital Economy Research Programme at the JRC Institute for Prospective Technological Studies, which carries out economic research on information society and EU Digital Agenda policy issues, with a focus on growth, jobs and innovation in the Single Market. The Digital Economy Research Programme is co-financed by the Directorate General Communications Networks, Content and Technology. Legal Notice Neither the European Commission nor any person acting on behalf of the Commission is responsible for the use which might be made of this publication. Europe Direct is a service to help you find answers to your questions about the European Union Freephone number (*): 00 800 6 7 8 9 10 11 (*) Certain mobile telephone operators do not allow access to 00 800 numbers or these calls may be billed. A great deal of additional information on the European Union is available on the Internet. It can be accessed through the Europa server http://europa.eu/. JRC XXXXX EUR XXXXX EN ISBN XXXXXXXXX (pdf) ISSN XXXX-XXXX (online) doi:10.2791/XXXXXX Luxembourg: Publications Office of the European Union, 2014 © European Union, 2014 Reproduction is authorised provided the source is acknowledged. Printed in Spain ACKNOWLEDGEMENTS This paper is part of the JRC/IPTS Digital Economy Research Programme, co-financed by the Directorate General Communications Networks, Content and Technology (CONNECT) and the Institute for Prospective Technological Studies (IPTS).1 The author wishes to thank the following colleagues for their longstanding support, valuable input and comments: Bertin Martens (JRC-IPTS) for his guidelines and fruitful discussion, Martin Ulbrich (DG CONNECT) for his insightful editing of the various aspects of this study, Marc Bogdanowicz (JRC-IPTS) and Yannis Maghiros (JRC-IPTS) for their encouragement and support to this project, Konstantinos Giannakouris (DG ESTAT), Michaela Grell (DG ESTAT), Smaranda Pantea (DG ENTR), Andrea De Panizza (OECD) and all participants of the DG CNECT – DG JRC/IPTS Workshop on "ICT Skills, Jobs and Growth" for their constructive comments and suggestions. Special thanks are due to the LFS helpdesk of the DG ESTAT: Michaela Kotecka for her professional assistance in generating data extractions and her valuable comments on the technical descriptions, and Herve Rennie and Martin Teichgraber for their comments on the EU Labour Force Survey data descriptions. Finally, thorough checking and editing of the text by Patricia Farrer is gratefully acknowledged. 1 IPTS is one of the seven research institutes of the European Commission’s Joint Research Centre (JRC). The views and opinions in this report are the author’s and do not necessarily reflect those of the JRC or the European Commission. 1 Abstract This study examines the evolution of the number of ICT-skilled workers employed in industry sectors in the EU28 over the period 2000-2012. Data are taken from the Eurostat Labour Force Statistics. It introduces a novel definition of ICT specialists that combines occupations and skills taxonomies. For the period prior to the introduction of the Standard Classification of Occupations (ISCO-08) it starts from the OECD definition but includes a wider range of ICT occupations. From 2011 onwards it adopts the thematic view for ICT occupations proposed by the ILO (2012). It confirms that employment of ICT specialists in the EU27 has been resilient to the economic downturn and uncertainty in global labour markets, and was able to maintain a growth path of 4.3% per year over the period 2000-2012, more than 7 times higher than average growth of total employment over the same period. Though ICT employment evolved cyclically it never turned negative. This rapid growth in ICT employment confirms the increasing importance of ICT technologies in the global economy. 2 Table of Contents 1 INTRODUCTION ............................................................................................................................ 7 2 DEFINING ICT SPECIALISTS ...................................................................................................... 9 2.1 DEFINITION .............................................................................................................................. 9 2.2 OPERATIONALIZATION OF THE DEFINITION IN ISCO OCCUPATIONS. ............................... 11 3 DATA AND METHOD ................................................................................................................. 14 3.1 METHOD BASED ON COMBINING OCCUPATIONS AND EDUCATION DATA ........................... 14 3.2 EU LFS ................................................................................................................................... 15 3.3 APPLICATION OF THE OCCUPATIONS/EDUCATION METHODOLOGY TO DATA ................... 16 4 RESULTS ...................................................................................................................................... 18 4.1 THE ADDED VALUE OF THE OCCUPATIONS/EDUCATION METHOD: CONFRONTING OUR RESULTS WITH THE OECD AND ILO MEASURES OF ICT SPECIALISTS....................................... 18 4.2 ICT SPECIALISTS IN TOTAL ECONOMY ................................................................................. 19 4.3 DISTRIBUTION OF WORKERS AMONG ICT-SPECIALISED OCCUPATIONS ........................... 23 4.4 ICT SPECIALISTS IN SECTOR GROUPS................................................................................... 26 CONCLUSIONS ................................................................................................................................. 33 REFERENCES..................................................................................................................................... 34 ANNEXES ........................................................................................................................................... 36 3 List of Acronyms ICT – Information and Communication Technologies ILO – International Labour Organization ISCED – International Standard Classification of Education ISCO – International Standard Classification of Occupations ISIC – International Standard Industrial Classification LFS – Labour Force Survey OECD – Organization of Economic Development 4 List of Boxes Box 1 OECD Definition of ICT Employment and ICT specialists ....................................................... 12 Box 2 The ICT sector operational definition adopted by the PREDICT Project at JRC-IPTS* .. 30 List of Figures Figure 1 Employment of ICT specialists in absolute terms and as a share of the total employment (broad definition), 2004-2012 ........................................................................................... 23 Figure 2 ICT specialists and total employment growth in 2005-2012, % ................................... 23 Figure 3 Share of ICT specialists in total employment in 27 EU countries, % ........................... 25 Figure 4 Distribution of workers among ICT occupations, 2004-2012, %................................... 26 Figure 5 ICT professionals and ICT technicians in ISCO-88 and ISCO-08, % .............................. 28 Figure 6 Distribution of the ICT specialists in the EU-27 among sector groups, 2004-2012 (1000s) .................................................................................................................................................................. 31 Figure 7 Distribution of the ICT specialists in the EU-27 among sector groups, %.................. 32 Figure 8 Distribution of ICT specialists among sector groups with different ICT intensities, EU-27 in 2004-2012, % ................................................................................................................................. 33 Figure 9 Share of ICT specialists in total employment in sector groups, EU-27 in 20042012, %................................................................................................................................................................. 34 List of Tables Table 1 Definition of ICT specialists across studies (ISCO-88) ........................................................ 11 Table 2 Definition of ICT specialists across studies (ISCO-08) ........................................................ 13 Table 3 Measure of ICT specialists using different estimation approaches................................ 19 Table 4 Grouping of 1-digit NACE industries into seven major sector groups ........................... 26 List of Annexes A 1: Grouping of 2- and 3-digit NACE industries with respect to the use of ICT ....................... 36 A 2: ICT specialists and total employment in 2000-2012 (ICT-1 from Table 3) ....................... 38 A 3: ICT specialists and total employment in 2000-2012 (ICT-3 from Table 3) ....................... 38 A 4: ICT specialists, 1000s (ICT-1 from Table 3) ................................................................................... 39 A 5: ICT specialists, % of total employment (ICT-1 from Table 3).................................................. 40 A 6: ICT specialists, 1000s (ICT-3, from Table 3) .................................................................................. 41 A 7: ICT specialists, % of total employment (ICT-3 from table 3) .................................................. 42 A 8: ICT specialists, 1000s (ISCO-08 codes applied to ISCO-88 using ILO correspondence tables and own estimation) ........................................................................................................................... 43 A 9: ICT specialists, 1000s (ISCO-08 codes applied to ISCO-88 using ILO correspondence tables and own estimation) ........................................................................................................................... 44 A 10: Distribution of ICT specialists among sector groups, 2012, % ............................................. 45 A 11: ICT specialists in 2012, 1000s.......................................................................................................... 47 A 12: ICT specialists in 2012, 1000s.......................................................................................................... 48 A 13: ILO thematic view for ICT occupations (based on ISCO-08) .................................................. 49 A 14: The OECD ICT sector definition ......................................................................................................... 50 5 1 Introduction Labour market statistics are crucial for monitoring EU employment policies. However, it is only in recent years that attention has been drawn to ICT skills and the employment of ICT specialists. The Agenda for New Skills and Jobs (2010)2 – part of the Europe 2020 overall strategy – addresses structural change in the labour market and suggests concrete actions to adapt European workers’ eskills to the changing working environment. In April 2012, the European Commission presented new measures and identified key opportunities for a job-rich recovery in its Employment package3. One of the objectives of the European employment policy is to ensure that EU workers acquire the necessary higher-end skills in order to prevent the loss of key ICT jobs to other regions of the world4. The growing awareness of policy-makers of the importance of employment of ICT specialists was reflected in the Grand Coalition for Digital Jobs5, launched by the European Commission in April 2013. This multi-stakeholder partnership aims to address the shortfall in the number of European citizens with ICT professional skills. Other EU policies also recommended intensification of efforts, for example, the Digital Agenda for Europe6, the e-Skills Strategy7, the Employment Package8, the Opening up Education Initiative9, the Rethinking Education Strategy10, the Youth Opportunities Initiative11, and the EU Skills Panorama12. In order to ensure that EC policies have an effective impact and take full advantage of the investments into ICT professional skills, policy initiatives need to be supported by reliable official data-based evidence and a well-grounded conceptual framework to define and measure employment dynamics for ICT specialists in Europe. This study is an attempt to further refine the definition of ICT specialists in the data and to monitor its dynamics in the EU27. It proposes a novel methodological approach that allows to better capture ICT professional skills (i.e. ICT specialists) in the EU Labour Force Survey (LFS) data. While ICT is often used in relation to skills and employment in policy and research papers, it is easy to get confused between different terms and definitions. This paper operates with the definitions adopted by the Organization of Economic Development (OECD) and the International Labour Organization (ILO), and in doing so offers a clear distinction between several categories that – if used carelessly – may create conceptual and methodological misunderstandings. By ICT employment we mean persons employed in occupations where they use ICT skills to various degrees and across all industries (as opposed to employment in the ICT sectors only). ICT employment consists of two sub-categories, ICT specialists and ICT users. In our study, we focus exclusively on ICT specialists (as opposed to the wider category of ICT users). 2 3 4 5 6 7 8 9 10 11 12 EC (2010b), http://ec.europa.eu/social/main.jsp?catId=958&langId=en EC COM(2012d) http://eurlex.europa.eu/LexUriServ/LexUriServ.do?uri=CELEX:52012DC0173:EN:NOT SWD(2012) 96 final http://ec.europa.eu/digital-agenda/en/digital-jobs-0 http://ec.europa.eu/digital-agenda/ http://ec.europa.eu/enterprise/sectors/ict/e-skills/index_en.htm http://ec.europa.eu/commission_2010-2014/andor/headlines/news/2012/04/20120418_en.htm http://europa.eu/rapid/press-release_SPEECH-12-933_en.htm http://ec.europa.eu/education/news/rethinking_en.htm http://ec.europa.eu/social/main.jsp?catId=1006 http://euskillspanorama.ec.europa.eu/ 6 This study further develops the approach described in Sabadash (2012) to operationalize the definition of ICT specialists and to combine occupations and skills taxonomies. In order to capture ICT specialists for the period prior to the introduction of the latest International Standard Classification of Occupations (ISCO-08) occupations, we build our definition on the official OECD (2004) definition. However, compared to the OECD (2004, 2010 and 2012) we depart from a rather restrictive definition of ICT specialists and include a wider range of ICT occupations as recommended by Hunter (2006). For the period from 2011 onwards, in the absence of an official definition of ICT specialists in terms of ISCO-08 occupations, this study adopts the thematic view for ICT occupations proposed by ILO (2012). To our knowledge, this paper is the first attempt to carry out an empirical application of the latest ILO thematic view on ICT occupations. 7 2 Defining ICT specialists 2.1 Definition To our knowledge, the most widely accepted official definition of ICT employment is the one introduced by OECD (2004). The OECD (2004) distinguishes between two types of ICT employment: employment in the ICT sector and ICT-skilled employment. The concept of ICT skilled employment is further developed by discriminating between its several components: ICT specialists, advanced users, and basic users (see Box1). The first category of ICT-skilled employment covers those who supply ICT tools, and is used by the OECD studies for what they call narrow measure of ICT-skilled employment. The second and third categories of the ICT-skilled employment cover those who use ICT tools. The sum of all three categories is used in the OECD studies for the broad measure of ICTskilled employment. Box 1 OECD Definition of ICT Employment and ICT specialists ICT employment 1. ICT sector employment, defined as “employment in industries traditionally identified as belonging to the ICT sector (all occupations, even those with no use of ICTs)”; and 2. ICT skilled employment, defined as “employment in occupations that use ICTs to various degrees across all industries”. ICT-skilled employment 1. ICT specialists, who have the ability to develop, operate and maintain ICT systems. ICTs constitute the main part of their job. 2. Advanced users: competent users of advanced, and often sector-specific, software tools. ICTs are not the main job but a tool. 3. Basic users: competent users of generic tools (e.g. Word, Excel, Outlook, PowerPoint) needed for the information society, e-government and working life. Here too, ICTs are a tool, not the main job. Source: OECD (2004) The OECD definition of ICT skilled employment (and its different components) has been applied in several studies which aim to capture the dynamics of ICT-specific labour: for example, the OECD (2004, 2010, and 2012) applied it to the ISCO-88 occupations and Empirica (2013) applied it to the ISCO-08 occupations. We use the same general approach, i.e. work with occupations that use ICTs to various degrees across industries (as opposed to ICT sector employment only13). This study focuses exclusively on ICT specialists as defined by the OECD (2004) (Box 1). The distinction between ICT specialists and ICT users is important from both the conceptual and the methodological standpoint. Conceptually, these two categories capture two different aspects of the need for ICT skills: ICT specialists are involved in the production of ICT goods and services, while ICT 13 See OECD (2004) for a definition and Predict project of JRC-IPTS http://is.jrc.ec.europa.eu/pages/ISG/PREDICT.html for an operationalization of the definition. 8 users enable diffusion of ICT-based technological innovations across all economic sectors (and also all spheres of consumption). Methodologically, these two types of skills are not equally reflected in the primary sources of European employment statistics regulated by international standard classifications. While ICT specialists can be identified with a fair degree of accuracy using ISCO on its own (see for example OECD, 2004 and 2010, Empirica, 2013), or in combination with International Standard Classification of Education, ISCED (as in this study), ICT users can be identified in ISCO occupations only in those exceptional cases where technological developments have led to new ways of organizing work (Hunter, 2006). This happens mainly because the need for ICT-using skills among the general workforce not only varies significantly from one job to another (even within the same ISCO occupational category), but also evolves swiftly over time. For example, as described in Hunter (2006), though nursing professionals had little requirement for general skills in the use of ICT in the past, nowadays they are often required to exchange patient and diagnostic information electronically within and between hospitals and are increasingly more involved in the advanced use of ICT and ICT-enabled tools. We diverge from OECD (2004 and 2010) by extending the range of occupations included into the definition of ICT specialists. In doing so we build our method on Hunter (2006) for the data prior to 2011 and on the thematic view for ICT occupations proposed by the ILO (2012) for the data from 2011 onwards. We further develop the methodology described in Sabadash (2013) in combining ICT occupations and ICT skills taxonomies14. The ICT occupations taxonomy is based on the concept of job, defined as a set of tasks and duties executed by a person. The primary underlying data for the ICT occupations taxonomy are supplied by the ISCO. The ICT skills taxonomy is based on the ICTrelated field of formal education, defined in terms of ISCED. Obviously, there are connections between ISCO occupations and ISCED fields but it should be remembered that they classify different statistical units using different criteria. ISCO classifies occupations using the set of tasks and duties while ISCED classifies educational programs by subject content. The method that allows applying our definition of ICT specialists using the combined ISCO-based occupations and ISCEDbased skills taxonomies on the LFS data is described in Section 3 of this study. 14See more in Sabadash (2013) 9 2.2 Operationalization of the definition in ISCO occupations. ISCO-88 A methodology to measure ICT specialists based on ISCO-88 was initially devised by the OECD (2004) and implemented to generate employment estimates in OECD (2004 and 2010). This methodology uses four ISCO-88 occupations: Computing professionals (213), Computer associate professionals (312), Optical and electronic equipment operators (313), and Electrical and electronic equipment mechanics and fitters (724). To our knowledge, the only other attempt to lay methodological grounds for defining ICT specialists in ISCO-88 was made in the 2006 ILO Discussion Paper by D. Hunter. On top of the OECD (2004) measure, Hunter (2006) recommends including the ISCO-88 group Computing services department managers (1236), and indicates a number of other groups in ISCO-88 that can be considered ICT occupations such as Information technology trainers (2359), Electronics fitters (7242) and Electronics mechanics and servicers (7243). Recently, another attempt to estimate ICT specialists using ISCO-88 was undertaken by Empirica (2013). This study applied a rather restricted measure to monitor the dynamics of what they call "core ICT employment"15 in the 27 EU Member States, which included two ISCO-88 occupations, Computer professionals (213) and Computer associate professionals (312). Table 1 Definition of ICT specialists across studies (ISCO-88) This study ICT Terminology used: specialists 1236 Computing services managers x 213 Computing professionals x 2144 Electronics and telecommunications engineers x 2359 Information technology trainers x 3114 Electronics and telecommunications engineering x technicians 312 Computer associate professionals x 313 Optical and electronics equipment operators x 724 Electrical and electronic equipment mechanics and fitters 7241 Electrical mechanics, fitters and services 7242 Electronics fitters x 7243 Electronics mechanics and servicers x 7244 Telegraph and telephone installers and servicers 7245 Electrical line installers, repairers and cable jointers 8283 Electronic equipment assemblers x OECD (2004) ICT specialists x Hunter (2006) ICT occupations x x Empirica (2013) Core ICT employment x x x x x x x x x x x x x x x Though we use the OECD (2004) definition of ICT specialists, in this study we depart from a narrow OECD measure and include a wider range of ICT occupations from ISCO-88, mainly based on Hunter (2006). Additionally, unlike the OECD (2004), we exclude Telegraph and telephone installers and servicers (7244) and Electrical line installers, repairers and cable jointers (7245). A comparison of our suggested definition of the ICT specialists against the definitions applied in other studies are presented in Table 1. 15 Empirica (2013), p. 22 10 ISCO-08 In July 2012, the ILO released the International Standard Classification of Occupations (ISCO-08) Volume 1: Structure, Group Definitions and Correspondence Tables. This document introduces thematic views for certain groups of occupations (including ICT) where there is a need for a standardized approach to the aggregation of occupational data according to a particular theme. The ILO thematic views represent an alternative way of aggregating data, according to an aspect of skills specialization, independently from the skills level and other criteria used to design the main structure of ISCO. More specifically, in Chapter 3.3, the ILO (2012) thematic views for ICT occupations identify professional and associate professional occupations in ICT as major subgroups, and suggest the inclusion of a number of other unit groups that primarily involve the production of ICT goods and services (see Box A1 in Annexe). The guiding principle for inclusion of occupations into this thematic view is their primary involvement in the production of ICT goods and services. On the other hand, it is proposed that occupations which require specialized skills in using ICT only as a tool, not involved in the production of ICT goods and services, be excluded. This reasoning further reinforces our belief that ICT users (either advanced or basic) cannot be accurately identified through the ISCO-based occupations. Based on the ILO thematic views for ICT occupations, we develop our measure of ICT-skilled employment by including three occupations in addition to the ones recommended by ILO: Electronics engineering technicians (3114), Electronics Mechanics and Servicers (7421) 16, Electrical and Electronic Equipment Assemblers (8212). 16 In a majority of countries, the numbers of workers reported in the EU LFS for the ISCO-08 occupation 742 Electronics and Telecommunications Installers and Repairers (which includes two subgroups, 7421 Electronics Mechanics and Servicers and 7422 ICT installers and servicers) is rather high compared both to other ICT occupations in ISCO-08 and to the corresponding occupational group in ISCO-88. In order to reduce the overestimation bias, we include into our definition of the ICT specialists only those workers in occupation 742 who have a relevant field of education (Computer Science or Computer Use) 11 Table 2 Definition of ICT specialists across studies (ISCO-08) This study Terminology used: 133 ICT Service Managers 2152 Electronic Engineers 2153 Telecommunication Engineers 2166 Graphic and multimedia designers 2356 Information Technology Trainers 2421 Management and organisation analysts 2434 ICT Sales Professionals 25 ICT professionals 251 Software and multimedia developers and analysts 2511 Systems analysts 2512 Software developers 2513 Web and multimedia developers 2514 Application programmers 2519 Software and multimedia developers and analysts not elsewhere classified 252 Database specialists and systems administrators 2521 Database designers and administrators 2522 Systems administrators 2523 Computer network professionals 2529 Database and network professionals not elsewhere classified 3114 Electronics engineering technicians 3139 Process control technicians not elsewhere classified 3155 Air traffic safety electronics technicians 3211 Medical imaging and therapeutic equipment technicians 3252 Medical records and health information technicians 35 Information and communications technicians 351 ICT operations and user support technicians 3511 ICT operations technicians 3512 ICT user support technicians 3513 Computer network and systems technicians 3514 Web technicians 352 Communications technicians 3521 Broadcasting and audio-visual technicians 3522 Telecommunications engineering technicians 742 Electronics and Telecommunications Installers and Repairers 7421 Electronics Mechanics and Servicers 7422 ICT installers and servicers 8212 Electrical and electronic equipment assemblers 12 ICT specialists x x x x x OECD (2013) ICTrelated occup-s x x x ILO (2012) Occup-s involved in the provision of goods and services related to ICT x x x x x Empirica (2013) ICT workforce x x x x x x x x x x x x x x x x x x x x x x x x x x x x x x x x x x x x x x x x x x x x x x x x x x x x x x x x x x x x x x x x x x x x x x x x x x x x x x x x x x x x x x x x x x x x x x x x x x x x x x x x x x x 3 3.1 Data and Method Method based on combining occupations and education data Applying the definition of ICT specialists that contains ISCO occupations at the 4-digit level of aggregation to data on employment at EU level inevitably leads to an important practical problem: about one third of the EU Member States does not collect data on occupations at the 4-digit level of aggregation. One way to get round this practical problem is to limit the definition of ICT specialists to the 3-digit ISCO codes, provision of which is mandatory for EU Member States. This approach would achieve comparability between countries but it would inevitably lead to under-estimation (when some ICTrelevant 4-digit occupations are left out) or over-estimation (when the whole 3-digit group containing both ICT and non-ICT occupations is included). Another way of dealing with the problem is to produce estimates for the missing data based on the available country-year observations. However, country- and year-specific aspects (reflecting both labour demand and supply factors that influence the employment dynamics of these specific occupations) would need to be carefully taken into account to ensure reliable results. While methodologically interesting, this approach could turn into a very challenging task due to the lack of a comprehensive set of variables capable of fully capturing country- and year-specific factors of labour demand and supply. Moreover, this approach may still produce inconsistent estimates of total ICT-skilled employment if the share of the missing occupations is significant. We therefore suggest a third way of applying a definition of ICT specialists to European harmonized data. When information on the occupation of a person is not available at 4-digit level, we propose using the corresponding 3-digit group and filtering it by the variable that captures the field of education. For example, in order to identify the 4-digit occupations group 3114 (Electronics Engineering Technicians) in ISCO-08, we use the 3-digit ISCO-08 code 311 (Physical and engineering technicians) and select only those workers from this group who have ICT-specific education. This method has the virtue of being easily applied to data without involving the need for complex estimation techniques. It could, however, be criticized on the grounds that there is no perfect match between field of education and type of occupation. Indeed, one's choice of occupation can be influenced by many factors besides education: competition on the labour market (Peri and Sparber, 2011), availability of vacancies, monetary and non-monetary benefits (Xu, 2013), family socioeconomic background (Weidman, 1984), personal aptitudes, life context and social contacts (Bentolila et al, 2010), spatial segregation (Mookherjee et al, 2010), and others. Besides, occupational trajectories may be affected by on-the-job and off-the-job training. However, educational attainment still remains a key variable in all empirical studies looking at occupational outcomes. Moreover, it is reasonable to assume that in a highly specialized segment of the labour market such as ICT, the field of education is instrumental in the occupational choices. Moreover, as has been shown in Ahola (1999), there is a fair degree of compatibility between educational and occupational structures in European countries at aggregate level. We believe that the methodology that we suggest provides a straightforward and reliable way of detecting ICT occupations at the finest level of ISCO aggregation using the available harmonized official data on EU employment and taking into account its constraints. 13 3.2 EU LFS The data used in this report comes from the EU Labour Force Survey (LFS), which is the main source for labour market statistics in Europe17. Our analysis covers 27 EU countries: Austria, Belgium, Bulgaria, Cyprus, Czech Republic, Denmark, Estonia, Finland, France, Germany, Greece, Hungary, Ireland, Italy, Latvia, Lithuania, Luxembourg, Malta, Netherlands, Poland, Portugal, Romania, Slovakia, Slovenia, Spain, Sweden, and the United Kingdom. The EU LFS is survey-based and uses only a sample of population. As a result, LFS data are subject to the usual types of errors associated with sampling techniques and interviews18: sampling errors, non-sampling errors, measurement errors, processing errors and non-response are calculated for each country and documented in Eurostat (2009). Subject to Eurostat's quality screening, figures on employment fulfil the Eurostat requirements concerning reliability. Regardless of the sampling method or which age groups are interviewed, the data records at Eurostat are representative for the population aged 15-74 (16-74 in Iceland, Italy, Norway, Spain, and the UK)19. While, as a rule, perfect comparability between countries would be difficult to achieve, even if there was a single direct survey (carried out at the same time, using the same questionnaire and a single method of recording), the degree of comparability of the EU LFS results is considerably higher than that of any other existing set of individual-level statistics on employment in the EU. This is due to the recording of the same set of characteristics in each country, a close correspondence between the EU list of questions and the national questionnaires, the use of the same definitions for all countries, the use of common classifications (NACE for economic activity, ISCO for occupations, and ISCED for education) and the data being centrally processed by Eurostat. The data extractions were provided by Eurostat and are based on the quarterly sample survey. The extractions are based on the best sample available for a given year and the variables requested and correspond either to one single quarter (generally second quarter), or to a sub-sample distributed along the year (sample size is usually equivalent to one reference quarter). The inclusion of the variable that describes the field of education among the employment characteristics of the respondents (which is collected only on an annual basis) resulted in the use of the yearly data in this report. The EU LFS achieved sample sizes of approximately 1.8 million individuals each quarter, with the quarterly sampling rates varying between 0.2% and 1.5% in each country. The data extractions cover the population in private households in the EU and candidate countries, and provide employment characteristics of people aged 15 and over. We provide the main set of estimates of ICT specialists using occupations/education data for the 9 year period from 2004 till 2012. The lower bound of our timeframe is determined by the availability of data in the field of education based on the International Standard Classification of Education (ISCED)20. All data tables and charts run to 2012, which was the most recent year for which data was available when the present analysis was conducted. 3.3 Application of the occupations/education methodology to data In order to highlight the main employment trends of ICT specialists per country and over the whole sample, we use the number of people working in local units (number of persons employed, weighted per 1000 workers). Persons in employment are defined based on the ILO international standards and comprise people: Two other frequently used source for employment statistics are national accounts and enterprise statistics. 18 "EU labour force survey" - Statistics Explained (2013/12/0) http://epp.eurostat.ec.europa.eu/statistics_explained/index.php/EU_labor_force_survey 19 http://epp.eurostat.ec.europa.eu/cache/ITY_SDDS/EN/lfsq_esms.htm 20 http://www.uis.unesco.org/Education/Pages/international-standard-classification-of-education.aspx 17 14 aged 15 year and over; who during the reference week worked, even if they did so for just one hour a week, for pay, profit or family gain; who were not at work but had a job or business from which they were temporarily absent because of, e.g., illness, holidays, industrial dispute or education and training. The number of ICT specialists and their share in total employment were constructed using the occupational and educational level of disaggregation over one- and two-digit industries using the method described above. ISCO-based occupations Information on occupations was drawn from the ISCO classification21 which is the only standardised classification of occupations implemented in the EU Labour Force Survey. ISCO provides comparable data for most European countries. However, usage of ISCO introduces several drawbacks when applied to mapping of ICT specialists. The first drawback is related to the fact that it is less detailed than the classifications available for countries such as, for example, the United States or Australia. This shortcoming is specifically referred to in OECD (2004), and resulted in the exclusion of occupations such as electronic engineers from the OECD narrow definition, despite the fact that these workers may be heavily involved in jobs relating to production of ICT hardware. As a result, studies based on the OECD narrow definition of ICT occupations are likely to underestimate the number of ICT specialists22. The second drawback is related to the break in the time series. Two versions of ISCO were applied for the corresponding sub-periods, ISCO-88 until 2010 and ISCO-08 from 2011 onwards. Since the transition of the EU Labour Force Survey to ISCO-08 in the first quarter of 2011, the national statistical offices stopped collecting ISCO-88-based information for reasons of survey cost. At the same time, due to the absence of one-to-one correspondence tables between ISCO-88 and ISCO08, the new classification was not applied by the LFS Unit of Eurostat to re-construct the old series retrospectively. For this reason, mapping between the two categories of ICT specialists based on different ISCO classifications is not advisable. While we favour the use of two separate measures constructed as described in the previous chapter (Table 1 and 2) corresponding to two sub-periods (2004-1010 and 2011-2012), we provide a tentative re-construction of the series of ICT specialists for the period 2004-2010 in terms of ISCO-08 occupations. To this end, we use the ILO official correspondence tables between ISCO-88 and ISCO-08, and perform estimations where one-to-one correspondence between the two versions of ISCO is absent. ISCED-based education In order to capture ICT specialists in the occupational groups that include both ICT and non-ICT occupations, we select workers that categorise their education in the field defined in ISCED-97 as Computing (48). This category comprises two sub-groups, Computer science (481) and Computer use (482), and covers all types of education related to computer system design, computer programming, data processing, networks, and operating systems dealing with software development (those related to the hardware development are classified with the engineering fields). While implementing the ISCED 1997 classification in the LFS started in 1998, many countries were still not collecting information in the field of education in 2003 (Austria, Belgium, Hungary, Ireland, Latvia, Malta, Poland, Portugal, Romania, Sweden, the UK). From 2004 onwards, the majority of countries provided information on the field of education in their national Labour Force Surveys, with 21 22 http://www.ilo.org/public/english/bureau/stat/isco/isco08/index.htm See OECD (2004), p. 220 for several more examples of the shortcomings related to the use of ISCO-88. 15 only several breaks in series in specific years: in 2004 for Czech Republic, Hungary, Malta and Turkey, in 2005 for Czech Republic, Malta and Spain, and in 2007 for Ireland. 16 4 4.1 Results The added value of the occupations/education method: confronting our results with the OECD and ILO measures of ICT specialists For the sake of comparison with other studies that estimate employment of ICT specialists, and in order to demonstrate the added value of our method we start from presenting the results of applying the occupations/education methodology to the OECD (2004) narrow definition23 of ICT-skilled employment and to the ILO (2012) thematic view on ICT specialists. We then estimate the number of ICT specialists by applying the occupations/education methodology to the definition developed in Section 2. The occupations/education methodology restricts the period of analysis to 9 years, from 2004 till 2012. However, we believe that this measure captures ICT specialists better from the data and reflects the dynamics of ICT professionals with greater accuracy. Table 3 shows the impact of using the occupations/education method. Here, employment of ICT specialists (as the number of persons employed and as a share of total employment) is calculated applying ICT-specific education filters to three different definitions: ICT-1 corresponds to the OECD narrow definition of ICT-skilled employment for 2004-2010 (excluding group 724 Electrical and electronic equipment mechanics and fitters 24) and ILO thematic view on ICT specialists for 2011-2012 (augmented by group 133 ICT service managers),25 ICT-2 adds ISCO-88 group 724 Electrical and electronic equipment mechanics and fitters and ISCO-08 group 742 Electronics and telecommunication installers and repairers to ICT-1, An ICT-specific education filter is applied to these two ISCO groups in order to separate ICT specialists from electricians. The purpose of reporting the ICT-2 estimates is to show the added value of using our methodology in applying the existing OECD and ILO approaches to the LFS data at 4-digit level of aggregation. ICT-3 shows estimation results derived from applying the occupations/education methodology to our suggested definition26 (see column "This study" in Tables 1 and 2 in Section 2). Analysis in the remainder of the report is based on the definition of ICT specialists that corresponds to ICT-3 in Table 3. Remember, that OECD narrow measure of ICT-skilled employment covers those who supply the ICT tools (ICT specialists in Box 1); OECD broad measure of ICT-skilled employment covers those who supply and those who use ICT tools (the sum of ICT specialists, ICT advanced and ICT basic users in Box1). See OECD (2004) for more details. 24 We exclude group 724 Electrical and electronic equipment mechanics and fitters because it contains a considerable number of electrical equipment mechanics and fitters who have little use for ICT-specific skills in their work (the need for these skills is especially high in sectors such as mining and electricity production). Inclusion of the entire group 724 would therefore lead to a serious overestimate of the number of ICT workers 25 ISCO-88 codes 213, 312 and 313 and ISCO-08 codes 133, 251, 252, 351 and 352 26 ISCO-88 codes 1236, 213, 2144, 2359, 3114, 312, 313, 7242, 7243, 8283, ISCO-08 codes 133, 2152, 2153, 2166, 2356, 2434, 25, 3114, 35, 7421, 7422, 8212 23 17 Table 3 Measure of ICT specialists using different estimation approaches ICT employment, 1000s year ICT-1 ICT-2 ICT-3 2004 2005 2006 2007 2008 2009 2010 2011 2012 3,744.4 4,073.2 4,274.3 4,465.3 4,568.7 4,609.7 4,676.1 4,944.9 5,154.4 3771.0 4103.8 4317.5 4499.8 4609.3 4650.7 4713.4 5276.2 5676.3 3967.7 4370.1 4632.4 4835.4 4958.4 5023.8 5066.0 5748.1 6124.7 4.2 diff-ce between ICT-1 and ICT-3 223.3 296.9 358.2 370.1 389.7 414.1 389.9 803.2 970.3 share in total, % ICT-1 ICT-2 ICT-3 1.8 1.9 2.0 2.0 2.1 2.1 2.2 2.3 2.4 1.8 2.0 2.0 2.1 2.1 2.1 2.2 2.4 2.6 1.9 2.1 2.2 2.2 2.2 2.3 2.4 2.7 2.8 ICT specialists in total economy Changes in the total employment of ICT specialists Over the period 2004-2012, the labour dynamics of ICT specialists was characterised by rapid and steady employment growth (Figure 1). Employment of ICT specialists has been growing steadily since 2004 (Figure 1), and has risen by 54% over a 9 year period. It has increased by 2 million people: from 4.1 million in 2004 to 6.1 million in 2012. This corresponds to an increase in the share of ICT specialists in total employment from 2.0% in 2004 to 2.8% in 2012. This growing tendency is even more remarkable in the context of the fairly modest growth in total employment in the EU over the same period. On average, growth in the employment of ICT specialists over the 9 year period was 5.1%, which is almost 10 times higher than the average growth of total employment over the same period. Similarly to total employment, employment of ICT specialists evolved cyclically. , The dip in employment in 2009 reflects a period of recession during the financial crisis of 2007-2008. However, though the growth of the numbers of ICT specialists reflected the general trend of the cyclical fluctuations in total employment, it never turned negative. Figure 2 shows the growth of ICT-specialised employment over the period 2004-2012. 18 Figure 1 Employment of ICT specialists in absolute terms and as a share of the total employment (broad definition), 2004-2012 7000 3,0% 6000 2,5% 1000s 5000 2,0% 4000 1,5% 3000 % 1000s 1,0% 2000 1000 0,5% 0 0,0% 2004 2005 2006 2007 2008 2009 2010 2011 2012 Source: EU LFS Figure 2 ICT specialists and total employment growth in 2005-2012, % 15,00 13,00 11,00 9,00 % 7,00 5,00 3,00 1,00 -1,00 -3,00 years ICT total Source: EU LFS Ranking of countries with respect to the share of ICT specialists in total employment At the EU-27 level, countries can be grouped into three categories with respect to the share of ICT specialists in total employment: 19 - those with an above average share of ICT specialists in total employment at the beginning and at the end of the 2004-2012 period (Figure 3, panel a), - those with a below average share of ICT specialists in total employment at the beginning and at the end of the 2004-2012 period (Figure 3, panel b), - those whose ICT share in total employment was below average in 2004 but above average in 2012, or vice versa (Figure 3, panel c1 and c2). As can be seen from Figure 3, panel a, in 2004, the Netherlands led the ranking of countries with respect to the share of ICT specialists in total employment (with the ICT specialists corresponding to 3.9% of total employment). However, in 2012, the Netherlands lost its position to Sweden. According to the latest data available, Sweden (4.8%) is the absolute leader with regards to the share of ICT specialists in total employment, closely followed by Finland (4.7%) and the UK (4.2%). In 2004, countries with the smallest share of ICT specialists in total employment (below 1%) were Romania (0.7%), Greece (0.9%), Bulgaria (0,9%) and Lithuania (0.9%). Though these countries had increased their shares of ICT specialists in total employment over the 9 years, they still remained in the bottom part of the ranking compared to other Member States (Figure 3, panel b). Panels c1 and c2 report the estimates for countries whose share of ICT specialists in total employment was either below or above the EU-27 average at different points in time. The first group of countries (Estonia and Czech Republic) showed an improvement and increased their share of ICT specialists by 2012 to overcome the EU average (panel c1). In particular, Estonia managed to increase its share of ICT specialists in total employment more than 3-fold over the 9 year period, and in 2012 it reached 3.3% (which is 15% above the EU-27 average). The second group of countries (Slovenia, France and Italy) showed a deterioration against the EU average: their corresponding shares of ICT specialists in total employment were above the EU-27 average in 2004, and fell below the EU-27 average in 2012 (panel c2). While the situation in France could be classified as stagnating (its ICT share in total employment has increased by only 0.1 p.p.), Slovenia and Italy increased the shares of their ICT specialists by 0.6 p.p. and 0.5 p.p. correspondingly. 20 Figure 3 Share of ICT specialists in total employment in 27 EU countries, % (a) leaders EU 2004 SE UK 2012 LU 2004 IE MT AT 0,0 1,0 2,0 3,0 4,0 5,0 (b) followers EU 2004 EU 2012 HU ES SK CY PL PT LV LT BG GR RO 2012 2004 0,0 1,0 2,0 3,0 4,0 5,0 c1) fluctuating around average: improving EU 2004 EU 2012 EE CZ Series2 Series1 0 1 2 3 4 5 c2) fluctuating around average: deteriorating EU 2004 EU 2012 SI IT FR 2012 2004 0,0 1,0 2,0 3,0 Note: For Romania the estimate corresponds to 2005 instead of 2004. 21 4,0 5,0 4.3 Distribution of workers among ICT-specialised occupations ICT occupational design in the EU-27 has been driven by the frequent emergence of new technologies requiring new skills and new ways of working. Overall, the distribution of workers among ICT occupations was stable throughout the whole 9 year period from 2004 (Figure 4). Due to the break in the time series caused by the implementation of the new ISCO-08 ranking of occupations in the EU Labour Force Survey in 2011, we could not monitor the exactly same occupations throughout the whole period, and had to look at two subsets of ICT occupations for the separate periods 2004-2010 and 2011-2012. Figure 4 Distribution of workers among ICT occupations, 2004-2012, % 2004 2007 50,6 48,4 2008 2009 11,6 4,8 2,9 5,3 12,2 30,1 31,1 2,9 2,7 5,2 12,2 12,6 5,2 2,5 5,3 2006 32,8 31,2 12,7 2005 47,2 48,6 48,0 31,6 2,4 4,5 2,3 2,1 3,5 12,5 13,1 32,6 33,0 48,1 48,3 (a) ISCO-88 ICT occupations 2010 1236 Computing services managers 213 Computing professionals 312 Computer associate professionals 313 Optical & electronics equipment operators Other ICT occupations 53,3 12,5 26,9 2011 3,4 3,9 10,0 3,9 4,3 27,0 54,8 (b) ISCO-08 ICT occupations 2012 133 ICT Service Managers 25 ICT professionals 35 Information and communications technicians 742 Electronics & Telecommunications Installers & Repairers Other ICT occupations In 2004-2010, the biggest share among ICT specialists was occupied by computing professionals or computing associate professionals: these two groups accounted for over 80% of all ICT specialists in our sample. The third biggest occupational group was optical and electronic equipment operators with an average of 12% of all ICT specialists over a period of 2004-2010. 22 In 2011-2012, the absolute majority of ICT specialists were employed as ICT professionals. Among the two other major ICT specialist occupational groups, the share of information and communication technicians remained stable over the two-years period and amounted to 27%. The share of electronics and telecommunications installers & repairers increased from 10% in 2011 to 12.5% in 2012 One general observation of the dynamics of the ICT occupational groups is that when looking at the shares of three major subgroups of ICT specialists the occupational design remained remarkably stable over the 9 years independently from the classification applied. Another observation is that, independently from the version of ISCO applied, the biggest share of the ICT specialists in our sample (almost half of all workers) is employed in high-skilled jobs: computing professionals or computing associate professionals in ISCO-88, and ICT professionals in ISCO-08. As explained in sections 3.3, there is no one-to-one correspondence between two versions of ISCO, which makes a re-construction of the old series (prior to 2011) by applying the latest ISCO classification a rather challenging task. However, mapping between the two definitions of ICT specialists based on different ISCO classifications is highly desirable for policy advising as it provides a consistent picture of the distribution of the ICT specialists between different professional groups. To this end, we estimate the number of ICT specialists by applying the definition based on ISCO-08 to the ISCO-88 occupations, i.e. we re-construct the series of ICT specialists for the period 20042010 in terms of ISCO-08 occupations. We use the ILO correspondence tables between ISCO-08 and ISCO-88 at 4-digit level of aggregation 27 and perform estimations where one-to-one correspondence between the two versions of ISCO is not possible. This approach makes the jump in the time series in 2011 somewhat smoother (see Table A8 in Annex). We would like to stress that this exercise may be subject to critics from the methodological point of view because change of ISCO to a newer version does not simply changes the names of the similar ICT occupational groups but performs a deeper restructuring of the classifications which involves regrouping of old occupations and introduction of the new ones. For this reason, we believe that the use of two separate measures corresponding to two sub-periods (2004-1010 and 2011-2012) is a more reliable approach compared to the mapping between the two categories of ICT specialists based on different ISCO classifications28 We suggest to map ICT specialists group of occupations in different ISCO versions by sorting of the most represented ICT occupations into two broader groups – ICT professionals and ICT technicians – based on the description of tasks and duties defined by ILO29. We construct these groups as follows: - - ICT professionals correspond to the occupational group 213 Computing professionals in ISCO-88 and to the occupational group 205 ICT professionals in ISCO-08. ICT technicians correspond to groups 312 Computer associate professionals and 313 Optical and electronics equipment operators in ISCO-88 and to groups 350 Information and communication technicians and 742 Electronics and telecommunication installers and repairers. 27 ISCO-08 Structure and correspondence with ISCO-88, http://www.ilo.org/public/english/bureau/stat/isco/isco08/index.htm 28 see more discussion on this issue in Section 3.3, and in the note to Table A8 in Annex. 29 http://www.ilo.org/public/english/bureau/stat/isco/intro.htm 23 2004 2005 2006 2007 ICT professionals 2008 ICT technicians 2009 2010 2011 7,3 7,7 8,2 37,0 39,3 53,3 54,8 50,6 8,2 41,7 48,4 43,3 7,9 7,7 47,2 45,0 48,6 43,7 7,7 48,0 44,3 6,8 5,6 48,1 45,1 48,3 46,1 Figure 5 ICT professionals and ICT technicians in ISCO-88 and ISCO-08, % 2012 Other ICT occupations While providing a rather aggregated view on the distribution of ICT specialists between specific occupations, this approach allows to conclude that higher skilled ICT professionals are steadily growing in number, while the groups of ICT technicians is decreasing during the period of observation. 24 4.4 ICT specialists in sector groups Grouping sectors into ICT-producing and ICT-using In order to monitor distribution of ICT specialists among sectors and groups of sectors, we use 1and 2-digit NACE classification. First, we present the distribution of ICT specialists among 1-digit NACE sectors aggregated into seven sectors. We further amended this grouping to include the NACE Rev. 2, which allows us to cover the years after 2008 (Table 4). Table 4 Grouping of 1-digit NACE industries into seven major sector groups Sector groups NACE Rev.1 NACE Rev.2 1 Agriculture, Forestry, Fishing A, B A 2 Mining and Electricity, Water Supply (and Waste C, E B, D, E management from 2008 onwards) 3 Manufacturing D C 4 Construction F F 5 Trade, Tourism, Transport G, H, I G, H, I 6 Business services J, K J, K, M, N 7 Other services L, M, N, O, P, Q O, P, Q, R, S, T, U Note: correspondence with NACE Rev.2 is compiled using Eurostat aggregate tables, http://ec.europa.eu/eurostat Second, we report ICT employment separately in the ICT sector, and sectors that use ICT more and less intensively. Grouping of industries into ICT sector (with the distinction between manufacturing and services) is based on the 2002 OECD definition for the NACE Rev.1.1 and on the 2006-07 OECD definition for the NACE Rev. 2 (OECD 2011), adapted to the data aggregation requirements (See Box A2 in Annex). In this report, we use the operational definition devised in Turlea et al (2011) for the period 20042008 (based on NACE Rev.1.1) and in PREDICT Project of JRC-IPTS30 for the period 2009-2011 (based on NACE Rev.2). This includes sectors as described in Box 2 below. Grouping of sectors into more and less ICT-intensive can be done by adopting one of several possible measures of ICT use by industry known in economic literature31: the ratio of ICT capital to a number of workers, share of ICT investment in total investment, share of ICT capital in output, share of ICT capital in total capital, and the share of the flow of capital services from ICT in total capital services. The latter measure has an advantage over the others as the service flow per unit of ICT capital can be quite different from the flow from a unit of non-ICT capital: being a short-lived asset, ICT provides more services per unit of stock than long-lived assets. As explained in van Ark and McGuckin (2003a), the flow of capital services is calculated by estimating the user cost for each type of capital. These can be relatively high for ICT capital because of high rates of depreciation. Thus a simple measure of ICT’s share of total assets may understate the flow of services from it, and will not take into account possibly high returns on ICT capital in particular industries (like, for example, the oil extraction industry, where a small investment in ICT has fundamentally changed the technology of exploring oil reserves). 30 31 http://is.jrc.ec.europa.eu/pages/ISG/PREDICT.html van Ark and McGuckin (2003a) 25 Box 2 The ICT sector operational definition adopted by the PREDICT Project at JRC-IPTS* (a) based on NACE Rev.1.1 ICT Manufacturing 30: Manufacture of office, accounting and computing machinery 32: Manufacture of radio, television and communication equipment and apparatus 33: Manufacture of medical, precision and optical instruments, watches and clocks ICT Services 64: Post and telecommunications 72: Computer and related activities (b) based on NACE Rev. 2 ICT Manufacturing 261 Manufacture of electronic components and boards 262 Manufacture of computers and peripheral equipment 263 Manufacture of communication equipment 264 Manufacture of consumer electronics ICT Services 582 Software publishing 610 Telecommunications 620 Computer programming, consultancy and related activities 631 Data processing, hosting and related activities; web portals 951 Repair of computers and communication equipment *Prospective Insights on R&D in ICT (PREDICT) is a research projects financed by the DG CONNECT and carried out by the Information Society Unit of the JRC-IPTS. Source: Turlea et al (2011) and PREDICT Following Stiroh (2002), Inklaar et al (2003), van Ark et al (2003a and 2003b), and O'Mahony and van Ark (2003), we use the ranking of sectors with respect to the share of the flow of capital services from ICT in total capital services by applying an arbitrary cut-off point at the median point of ICT use distribution. We base our grouping on van Ark et al. (2003a), who provide a more refined classification of ICTusing industries compared to Stiroh (2002) and Inklaar et al (2003) 32. We depart from their approach on two points. First, we define ICT-producing manufacturing and services based on the operational definition adopted by the PREDICT Project of the JRC-IPTS (Box 8). Following the terminology applied by PREDICT (which is based on the OECD official definition), we call these sectors ICT manufacturing and ICT services. Second, we include education, health and social work sectors in the analysis. Unlike Stiroh (2002), who also considers these sectors but allocates them to the group that uses ICT more intensively, we include them in the group that uses ICT less intensively. This choice is based on the reasoning provided in van Ark et al (2003a): even though 32 van Ark et al. (2003a), pp. 6-7. 26 education, health and social work sectors are above the median share of ICT services in total capital services, they use little capital and their value added largely consists of labour income33. Distribution of ICT specialists among sector groups In 2004-2012, the industries that employed the largest numbers of ICT specialists in EU-27 were business services. This group of industries employed over half of all ICT-skilled specialists during the whole period; in 2012, the share of business services in total employment of ICT specialists reached 60.5%. The share of business industries showed a marked growth tendency over the 9 year period from 2004. The only deviation from this trend occurred in 2008, when ICT specialists in business sectors contracted by 6%34. However, this share expanded by 24% the year after. Figure 6 Distribution of the ICT specialists in the EU-27 among sector groups, 2004-2012 (1000s) 3 500,000 7 000,000 3 000,000 6 000,000 2 500,000 5 000,000 2 000,000 4 000,000 1 500,000 3 000,000 1 000,000 2 000,000 500,000 1 000,000 0,000 0,000 Agriculture, Forestry, Fishing Construction Other services Business services Mining, Electricity, Water, Waste Trade, Tourism, Transport Manufacturing total Note: Left-hand scale = ICT specialists by sector; right-hand scale = total The share of manufacturing in total employment of ICT specialists remained stable over the whole period and fluctuated around 15%. The share of ICT specialists in the group of sectors classified as "other services" (public administration, health, education, activities of households and extraterritorial organisations) was relatively high, 13% in 2012. Though numbers of ICT specialists in trade, tourism and transport declined, they remained at a relatively high level (at around 8%). Agriculture, mining, electricity, water and waste management sectors overall employed a negligible share of ICT-specific employment compared to other sectors. 33 34 van Ark et al. (2003a) This can be attributed to the break in series due to the application of NACE Rev.2 27 Figure 7 Distribution of the ICT specialists in the EU-27 among sector groups, % (a) 2004 0,1 1,2 1,4 51,1 12,7 15,0 18,0 (b) 2012 0,1 59,4 1,6 2,7 7,8 12,9 14,6 Agriculture, Forestry, Fishing Construction Other services Business services Mining, Electricity, Water, Waste Trade, Tourism, Transport Manufacturing The EU-27 aggregate numbers (Figures 6-7) hide the country differences in the distribution of ICT specialists among groups of sectors (see Table A2, in Appendix). Thus, while business sectors invariably show the highest share of ICT employment in all countries, country-specific estimates range from 48.8% in Romania to 69.8% in France. A remarkable diversity in the share of ICT specialists in total employment is observed in manufacturing: it is quite high in countries such as Germany (23.8%), Romania (20.3) and Italy (19.9%), while it is insignificant in Cyprus (1.9%) and Luxembourg (5.1%). In part, such country differences in distributing the ICT specialists among groups of sectors are related to the sectorial composition of national economies, and in part they can be attributed to the country position in the general ICT advancement compared to other Member States. If we look at the distribution of ICT specialists in the EU-27 among sectors with different intensity of ICT use (Figure 8), we find that the biggest share of ICT specialists is employed in the service sectors, while the manufacturing industries clearly lag behind. The absolute leader among this group of sectors is ICT services, where the share of ICT specialists reached 55% in 2012. These figures point to the service-oriented composition of the EU economy, where services provide employment to the majority of ICT professionals (as well as to workers with other occupations). 28 Figure 8 Distribution of ICT specialists among sector groups with different ICT intensities, EU-27 in 2004-2012, % 40 30 20 10 0 2004 2005 2006 2007 ICT services Services, non-intens ICT use Manuf., non-intens ICT use Other sectors, non-intens ICT use 2008 2009 2010 2011 Services, intens ICT use Manuf., intens ICT use ICT manufacturing 2012 Source: EU LFS Additionally, we look at the share of ICT specialists in the total number of workers employed in each of the above sectors (Figure 9). We look at four sector groups: ICT services, ICT manufacturing, ICTsuing services and ICT-using manufacturing35. Here, again, ICT services appear to be the most intensive users of ICT-specialised employment. Moreover, the share of ICT specialists in ICT services employment was growing rapidly from a little over a quarter in 2004 to more than half of total employment in that sector in 2012. However the annual growth pattern came in two growth spurts: a 15 percentage point jump in 2009 and another 8 percentage point jump in 2011. These growth spurts may be attributed to the breaks in series in the NACE and ISCO classifications. ICT manufacturing also increased its share of ICT specialists, though at a slower pace than ICT services. In 2012, 17% of all employed in ICT manufacturing had ICT-specific occupations. 35 Due to the relatively small share of ICT specialists (around 1.5%) in the total employment of the ICT-using sectors we re-aggregate the sector groups as following: Services that use ICT intensively and Services that use ICT less intensively are aggregated into the group ICT-using services; Manufacturing that use ICT intensively and Manufacturing that use ICT less intensively are aggregated into the group ICT-using manufacturing; the group of Other sectors that use ICT less intensively is omitted. 29 Figure 9 Share of ICT specialists in total employment in sector groups, EU-27 in 2004-2012, % % 50 40 30 20 10 0 2004 2005 2006 ICT services 2007 2008 ICT-using services 2009 2010 2011 ICT manufacturing 2012 ICT-usnig manufacturing Source: EU LFS. In the remaining sector groups, the share of ICT specialists averaged around 1.5%. The share of ICT specialists in ICT-using services grew moderately from 2.9% in 2004 to 3.4% in 2012. By 2012 it reached 2.4% in more intensively ICT-using services and 1% in less intensively ICT-using services. In ICT-using manufacturing, however, the share of ICT specialists doubled over 9 years (from 2.5% in 2004 to 5.5% in 2012) and in 2012 reached 3.8% for the manufacturing sectors that use ICT more intensively and 1.7% in manufacturing sectors that used ICT less intensively. These observations indirectly support the findings of Sabadash and Hagsten (2014) who showed that ICT-specialised human capital became relatively more important for productivity gains in manufacturing, while generally skilled workers are relatively more important in services. The fact that the share of ICT specialists appears to be relatively low in the ICT-using sectors can be attributed to the fact that ICT has become a general purpose technology, and that most of the ICT innovations in production and business procedures can now be operated by generally skilled workers. While the general level of ICT literacy is becoming increasingly important at practically all stages of production and distribution, it is often acquired through learning-by-doing and, as a rule, it is resistant to measurement in official statistics. In particular, general ICT literacy remains beyond the ISCO-based classification of occupations and, hence, is not reflected in our estimates. As explained in Section 2.1 of this study, we do not aim to estimate all ICT-skilled employment but only the ICT-specialized workforce, and we believe that the EU Labour Force Survey is not the right tool to capture general ICT skills in data. A similar line of reasoning is adopted in Hagsten and Sabadash (2014). They distinguished between ICT-specialised and generally skilled human capital when studying the factors that contribute to productivity gains at firm level, and showed that the productivity gains from ICT-specific and general skills differ between countries and sectors. 30 Conclusions This paper builds on existing studies that define and measure ICT employment in the EU. It proposes a new methodology and insights for defining and measuring employment of ICT specialists. Based on ILO (2012), we develop a definition of ICT specialists that includes ICT-specific occupations based on their primary involvement in the production of ICT goods and services. It excludes those occupations which require skills in using ICT only as a tool, and which are not involved in the production of ICT goods and services. We believe that the ISCO-based design of the EU LFS can accurately identify ICT specialists but not ICT users, either advanced or basic. While several ways of operationalizing the OECD (2004) definition of ICT specialists have already been applied to the EU LFS data (see for example, OECD, 2004 and 2010, and Empirica, 2013), the novelty of our approach consists in combining ISCO and ISCED categories – a tool that allows to map the ICT-specialist workforce with greater precision. We believe that the methodology we suggest provides a straightforward and reliable way of detecting ICT occupations at the finest level of ISCO aggregation, using the available harmonized official data on EU employment and taking into account its constraints. Estimates of ICT-specialised employment generated using our approach confirm the findings of previous studies. Employment of ICT specialists in the EU27 has been resilient to the downturn and uncertainty in global labour markets, and seems to be able to maintain a growth path. On average, growth in the employment of ICT specialists over the 12-year period 2000-2012 was 4.3%, which is more than 7 times higher than average growth of total employment over the same period. Similarly to total employment, ICT employment has evolved cyclically. However, ICT employment growth never turned negative. The rapid growth in total ICT employment (which to some extent reflects the total number of job vacancies) confirms the increasing importance of ICT technologies in the global economy. 31 References Ahola, S. (1999) The Matching of Educational and Occupational Structures in Finland and Sweden. CEDEFOP: Thesaloniki. BENTOLILA, S., MICHELACCI, C. and SUAREZ, J. (2010), Social Contacts and Occupational Choice. Economica, 77: 20–45 European Commission (2012d) Towards a job-rich recovery – COM(2012) 173 final European Commission (2012e) Exploiting the employment potential of ICTs, SWD(2012) 96 final, accompanying the document COM(2012) 173 final Towards a job-rich recovery European Ecommission (2013) Press Lease, EC launches Grand Coalition for Digital Jobs, IP/13/182, 4 March. http://europa.eu/rapid/press-release_IP-13-182_en.htm Eurostat (1996) The European Union Labour Force Survey, Methods and Definitions Eurostat (2009) Quality Report of the European Union Labor Force Survey http://epp.eurostat.ec.europa.eu/portal/page/portal/product_details/publication?p_product_code =KS-RA-09-015 Husing, T., Korte, W.B., Fonstad, N., Lanvin, B., Cattaneo, G., Kolding, M., Lifonti, R. and van Welsum, D. (2013) e_Leadership: e-Skills for Competitiveness and Innovation, Final Report of the study "eSkills VISION" (Vision, Roadmap and Foresight Scenarios for Europe 2012-2020), Empirica, Bonn. ILO (2012) International Standard Classification of Occupations: ISCO-08. Structure, group definitions and correspondence tables, Volume I, ILO, Geneva Mookherjee, D., Ray, D. and Napel, S. (2010), Aspirations, Segregation, and Occupational Choice. Journal of the European Economic Association, 8: 139–168 OECD (2001), Measuring Capital – OECD Manual: Measurement of Capital Stocks, Consumption of Fixed Capital and Capital Services, Paris. OECD (2004) Information Technology Outlook OECD (2010) Information Technology Outlook OECD (2011) Guide to Measuring the Information Society OECD (2012) ICT Skills and Employment, New Competencies and Jobs for a Greener and Smarter Economy OECD (2013) ICT Jobs and Skills. New Estimates and the Work Ahead, DSTI/ICCP/IIS(2013)6, Paris PERI, G. and SPARBER, C. (2011), Highly Educated Immigrants and Native Occupational Choice. Industrial Relations: A Journal of Economy and Society, 50: 385–411 Sabadash A. (2012) ICT Employment Statistics in Europe: Measuring Methodology (2012) No JRC76385, JRC-IPTS Working Papers, Institute for Prospective and Technological Studies, Joint Research Centre 32 The 2011 Report on R&D in ICT in the European Union. Geomina Turlea, Daniel Nepelski, Giuditta de Prato, Jean Paul Simon, Anna Sabadash, Juraj Stancik, Wojciech Szewczyk, Paul Desruelle, Marc Bogdanowicz Van Ark, B., Melka, J. Mulder, N., Timmer, M.P. and Ypma, G., (2002b) “ICT Investment and Growth Accounts for the European Union, 1980-2000,” GGGD Research Memorandum, no. GD-56, downloadable from: www.eco.rug.nl/ggdc/pub/online/gd56(online).pdf Van Ark, Robert Inklaar and Robert H. McGuckin (2003a) 'Changing Gear’ Productivity, ICT and Service Industries: Europe and the United States, in Jens F. Christensen and Peter Maskell (eds.) The Industrial Dynamics of the New Digital Economy, Edward Elgar,Cheltenham. Weidman, J. C. (1984) Impacts of campus experiences and parental socialization on undergraduates' career choices, Research in Higher Education, Volume 20, Issue 04, pp 445476 Xu, Y. J. (2013) Career Outcomes of STEM and Non-STEM College Graduates: Persistence in Majored-Field and Influential Factors in Career Choices, Research in Higher Education, Volume 05, Issue 01, pp: 349-382 33 Annexes A 1: Grouping of 2- and 3-digit NACE industries with respect to the use of ICT ISIC Rev.3 ICT-using manufacturing Wearing apparel, dressing and dying of fur Printing and publishing NACE Rev.1.1 18 22 Machinery and equipment 29 Electrical machinery and apparatus, excluding insulated wire* Manufacture of other transport equipment Miscellaneous manufacturing and recycling 31 35 3637 ICT-using services Wholesale trade 51 Retail trade 52 Financial intermediation 65 Insurance and pension funding 66 Activities related to financial intermediation Renting of machinery and equipment 67 Research and development Professional business services 73 741743 71 Less-intensive ICT-using manufacturing Food products, beverages and 15tobacco 16 Textiles Leather, leather products and footwear 17 19 Wood and products of wood and cork 20 Pulp, paper and paper products 21 Coke, refined petroleum products and nuclear fuel Chemicals and chemical products 23 24 NACE Rev.2 Manufacture of wearing apparel; dressing and dyeing of fur Publishing, printing and reproduction of recorded media Manufacture of machinery and equipment n.e.c. Manufacture of electrical machinery and apparatus n.e.c. Manufacture of other transport equipment Manufacture of furniture; manufacturing n.e.c. Recycling 18 22 13.2, 14.1, 14.2 18, 58.1, 59.2 29 332 31 332 35 30 36 332 37 383 Wholesale trade and commission trade, except of motor vehicles and motorcycles Retail trade, except of motor vehicles and motorcycles; repair of personal and household goods Financial intermediation, except insurance and pension funding Insurance and pension funding, except compulsory social security Activities auxiliary to financial intermediation Renting of machinery and equipment without operator and of personal and household goods Research and development Other business activities 51 46 52 47, 95.2, 13.3 65 64 66 65 67 66 71 77 73 74 72 02.4, 64.2, 69, 70, 71, 74.2, 74.9, 85.6 Manufacture of food products and beverages Manufacture of tobacco products Manufacture of textiles Tanning and dressing of leather; manufacture of luggage, handbags, saddlery, harness and footwear Manufacture of wood and of products of wood and cork, except furniture; manufacture of articles of straw and plaiting materials Manufacture of pulp, paper and paper products Manufacture of coke, refined petroleum products and nuclear fuel Manufacture of chemicals and chemical products 15 16 17 19 10 11 12 13, 32.5 15.1 20 16, 41.2 21 17 23 19, 21.2 24 19.1, 20, 26.8 34 Rubber and plastic products 25 Manufacture of rubber and plastic products 25 22, 32.5, 33.2, 41.2 Non-metallic mineral products 26 26 23, 33.2, 23.4 Basic metals 27 Manufacture of other non-metallic mineral products Manufacture of basic metals 27 24.1, 24.2, 24.3, 24.4 Fabricated metal products 28 28 33.2 Motor vehicles, trailers and semitrailers 34 Manufacture of fabricated metal products, except machinery and equipment Manufacture of motor vehicles, trailers and semi-trailers 34 33.2 Sale, maintenance and repair of motor vehicles and motorcycles; retail sale of automotive fuel Hotels and restaurants 50 45 55 Land transport; transport via pipelines Water transport 60 55 56 49 61 50 Air transport 62 51 Supporting and auxiliary transport activities; activities of travel agencies Real estate activities Public administration and defence; compulsory social security Education Health and social work Sewage and refuse disposal, sanitation and similar activities Activities of membership organizations n.e.c. Recreational, cultural and sporting activities 63 52, 79, 74.9 70 75 41, 68 84, 81.1 80 85 90 85 86, 87, 88, 75 37, 38.1, 38.2, 39 94 Other service activities Activities of households as employers of domestic staff Extra-territorial organizations and bodies 93 95 1.62, 59, 60, 90, 91, 92, 93, 74.2, 78.1, 79.9 96 97 99 99 Agriculture, hunting and forestry; Fishing Mining and quarrying 01-02, 05 10-14 01-03 Electricity, gas, steam and air conditioning supply Construction 40-41 35, 36 45 41-43 Less-intensive ICT-using services Repairs 50 Hotels and restaurants 55 Transport and storage 6063 Real estate activities Public administration and defense; compulsory social security Education Health and social work Other community, social and personal services 70 75 80 85 9093 Private households with employed 95 persons Extra-territorial organizations and 99 bodies Less-intensive ICT-using other sectors Agriculture, hunting, forestry and 01fishing 05 Mining and quarrying 1014 Electricity, gas and water supply 4041 Construction 45 91 92 05-09 Source: groups based on ISIC Rev.3 are adopted from van Ark et al. (2003a), correspondence to the NACE Rev.1.1 and NACE Rev.2 is based on the Eurostat official classifications and correspondence tables. 35 A 2: ICT specialists and total employment in 2000-2012 (ICT-1 from Table 3) year employment, 1000s total share of ICT. in total, % ICT employment growth, % total ICT 2000 202,019.2 3,140.0 1.6 2001 204,314.5 3,602.2 1.8 1.1 14.7 2002 204,396.2 3,614.2 1.8 0.0 0.3 2003 205,734.2 3,638.5 1.8 0.7 0.7 2004 206,518.6 3,744.4 1.8 0.4 2.9 2005 210,340.4 4,073.2 1.9 1.9 8.8 2006 214,416.6 4,274.3 2.0 1.9 4.9 2007 218,645.8 4,465.3 2.0 2.0 4.5 2008 221,306.8 4,568.7 2.1 1.2 2.3 2009 217,282.3 4,609.7 2.1 -1.8 0.9 2010 215,989.3 4,676.1 2.2 -0.6 1.4 2011 216,346.1 4,944.9 2.3 0.2 5.7 2012 216,082.0 5,154.4 2.4 -0.1 4.2 Note: employment of ICT specialists is calculated based on the narrow definition for the sake of longer time series. Source: EU LFS A 3: ICT specialists and total employment in 2000-2012 (ICT-3 from Table 3) total ICT share of ICT in total, % 2004 206,518.60 4,102.25 2005 2006 2007 2008 2009 2010 2011 210,340.40 214,416.60 218,645.80 221,306.80 217,282.30 215,989.30 216,346.10 216,082.00 employment, 1000s year 2012 Source: EU LFS employment growth, % total ICT 2.0 0.0 0.0 4,526.85 4,813.67 5,029.45 5,159.84 5,234.86 5,277.22 5,748.11 2.2 2.2 2.3 2.3 2.4 2.4 2.7 1.9 1.9 2.0 1.2 -1.8 -0.6 0.2 10.4 6.3 4.5 2.6 1.5 0.8 8.9 6,124.71 2.8 -0.1 6.6 36 A 4: ICT specialists, 1000s (ICT-1 from Table 3) country 2000 2001 2002 2003 2004 2005 2006 2007 2008 2009 2010 EU27 AT BE BG CY CZ DE DK EE ES FI FR GR HU IE IT LT LU LV MT NL PL PT RO SE SI SK UK 3140.027 64.95288 66.72568 20.13948 2.81276 78.1567 625.5527 72.04022 5.2147 194.0546 50.41029 412.177 23.88116 39.35369 23.65211 241.3223 10.32668 2.94942 10.13758 0 280.2122 122.7722 45.93631 0 153.5914 12.52069 23.25805 557.876 3602.157 70.13387 81.23671 24.12222 3.82928 86.9995 695.7768 69.4594 5.21547 222.3282 56.31381 486.256 22.58968 53.23924 25.69281 277.9786 10.09416 4.11798 9.13186 0 285.5137 135.2127 59.51556 0 166.9664 11.78289 27.45255 711.198 3614.24 76.57655 83.45366 23.49255 3.33225 95.73686 671.1928 75.00155 11.42126 232.2534 61.25105 485.166 31.13396 57.47097 28.78023 311.4181 6.10107 3.49965 10.26995 3.271 282.0772 140.8846 56.64383 0 165.0873 13.7688 28.12389 656.832 3638.53 75.46852 74.14079 22.77137 4.12002 94.71308 685.4869 82.20278 5.60793 217.5273 64.54225 468.666 28.46641 68.04096 29.06282 316.5356 8.68441 3.5417 11.85629 1.962 296.7799 149.7769 55.0541 0 149.5448 18.19408 27.37845 678.405 3744.439 70.31646 93.35759 27.52559 4.02456 82.65799 664.6215 77.60118 5.08512 257.6103 65.18888 471.083 33.93555 65.66565 29.51186 394.8558 12.47904 4.77167 12.28032 2.702 287.7793 138.6178 56.84979 0 145.9974 18.73156 28.32213 692.867 4073.232 78.10772 90.03761 29.99047 4.499215 94.85211 754.358 75.37959 5.429862 300.203 67.901 531.8205 32.97156 62.69621 28.48731 401.5753 9.703629 4.42408 14.43338 2.98725 297.8594 173.8121 62.78339 46.77065 160.5821 18.78782 38.42961 684.349 4274.28 78.76176 94.28255 32.65731 4.514573 104.7152 753.0237 83.62251 8.430058 333.572 70.60376 562.447 34.43633 70.79494 28.13468 441.2555 10.38948 4.42113 13.83957 2.496 268.5858 204.5324 67.66926 68.45031 164.7062 21.70141 46.8596 699.377 4465.302 78.4312 105.5683 35.0834 5.719162 115.9344 822.6132 85.33064 10.24381 395.4355 71.59113 483.621 37.86951 67.57475 27.15509 453.4873 10.53384 4.768815 14.39482 3.31375 289.9019 224.5336 72.75646 74.90906 171.9907 20.45742 52.29367 729.79 4568.695 85.56327 98.26498 35.98058 5.565272 129.8478 813.1547 92.2338 10.88239 400.0988 82.43996 531.529 39.02403 70.69074 27.33616 468.434 14.68318 6.50734 14.7194 3.28425 298.4424 228.3772 63.48536 77.22074 178.9868 21.15952 46.62317 724.16 4609.698 90.58898 104.4098 37.61574 4.65252 131.3828 830.379 88.74753 10.81981 366.2386 77.40791 555.411 46.13527 68.34574 32.49919 461.4722 15.73117 7.34397 14.18141 3.08625 299.6443 242.0615 66.80079 80.98266 185.8997 21.13944 48.55469 718.1661 4676.128 88.79971 122.4447 35.24205 4.832005 138.8951 875.6479 92.25079 12.67516 384.8368 75.92106 546.932 47.10885 67.97619 33.81123 444.8581 12.96354 7.77572 14.41051 3.2495 307.4966 231.1848 69.46127 75.3983 190.5114 21.6113 45.70471 724.1291 37 2011 2012 4944.9 5154.421 105.1555 137.3881 47.03652 5.58154 107.3606 145.9175 40.95543 6.070175 118.6906 121.6646 846.4409 96.21077 15.83266 365.1426 85.18836 508.368 36.51315 65.35717 891.6021 105.8262 17.90411 335.0904 96.63439 505.359 37.44442 79.05527 52.36466 55.43447 438.3727 14.81091 6.83442 16.79822 4.2095 457.7154 16.13979 8.4552 14.41038 4.75375 299.915 303.0068 224.7833 58.01605 79.11204 185.7686 22.05776 255.6644 65.83807 84.54317 195.8712 19.46152 50.78111 44.86286 1058.17 1137.38 A 5: ICT specialists, % of total employment (ICT-1 from Table 3) country 2000 2001 2002 2003 2004 2005 2006 2007 2008 2009 2010 2011 2012 EU27 AT BE BG CY CZ DE DK EE ES FI FR GR HU IE IT LT LU LV MT NL PL PT RO SE SI SK UK 2.0 2.0 2.2 1.1 1.3 2.2 2.0 3.0 1.3 1.7 2.9 2.2 0.8 1.8 1.4 1.9 0.7 2.3 1.3 1.6 3.3 1.4 1.3 0.7 3.7 2.3 2.0 2.4 2.0 1.9 2.4 1.1 1.5 2.4 2.2 3.0 1.6 1.9 2.9 1.9 0.8 1.7 1.3 2.0 0.7 2.4 1.3 2.1 3.5 1.5 1.4 0.8 3.8 2.1 2.2 2.5 2.1 2.1 2.2 1.1 1.5 2.6 2.1 3.2 1.7 2.0 3.3 2.1 0.9 1.8 1.3 2.0 1.0 3.2 1.3 2.1 3.5 1.4 1.2 0.8 3.9 2.1 1.9 2.5 2.1 2.2 2.4 1.2 1.2z 2.7 2.2 3.2 1.8 1.9 3.2 2.2 1.0 1.8 1.7 2.0 1.1 3.4 1.4 1.9 3.5 1.5 1.3 0.9 4.1 2.2 2.1 2.5 2.2 2.2 2.7 1.2 1.2 2.8 2.3 3.4 2.2 2.1 3.1 2.1 1.1 1.8 1.8 1.9 1.0 3.5 1.5 2.0 3.7 1.5 1.4 0.8 4.2 2.2 2.0 2.5 2.3 2.5 3.0 1.6 1.4 2.4 2.1 3.6 2.6 2.0 3.4 2.0 0.9 1.7 2.8 1.9 1.2 3.0 1.9 2.5 3.6 1.4 1.2 0.9 4.0 2.4 2.2 3.6 2.4 2.6 3.2 1.4 1.6 2.5 2.2 3.9 2.9 1.9 3.9 2.0 1.0 2.0 3.0 2.0 1.3 3.6 1.6 2.8 3.6 1.6 1.4 0.9 4.2 2.1 1.9 3.9 1.6 1.8 1.6 0.7 1.0 1.7 1.7 2.7 0.9 1.3 2.1 1.8 0.6 1.0 1.4 1.2 0.7 1.6 1.1 0.0 3.6 0.8 0.9 0.0 3.7 1.4 1.1 2.0 1.8 1.9 2.0 0.9 1.2 1.9 1.9 2.6 0.9 1.4 2.3 2.1 0.6 1.4 1.5 1.3 0.7 2.2 0.9 0.0 3.5 0.9 1.2 0.0 3.8 1.3 1.3 2.6 1.8 2.1 2.1 0.8 1.1 2.0 1.9 2.7 2.0 1.4 2.5 2.0 0.7 1.5 1.6 1.4 0.4 1.9 1.0 2.2 3.4 1.0 1.1 0.0 3.8 1.5 1.3 2.4 1.8 2.0 1.8 0.8 1.3 2.0 1.9 3.0 1.0 1.3 2.7 1.9 0.7 1.7 1.6 1.4 0.6 1.9 1.2 1.3 3.7 1.1 1.1 0.0 3.4 2.0 1.3 2.4 1.8 1.9 2.3 0.9 1.2 1.8 1.9 2.8 0.9 1.4 2.7 1.9 0.8 1.7 1.6 1.8 0.9 2.5 1.2 1.9 3.6 1.0 1.1 0.0 3.4 2.0 1.3 2.5 1.9 2.0 2.1 1.0 1.3 2.0 2.1 2.7 0.9 1.6 2.8 2.1 0.8 1.6 1.5 1.8 0.7 2.3 1.4 2.0 3.7 1.2 1.2 0.5 3.7 2.0 1.7 2.4 38 A 6: ICT specialists, 1000s (ICT-3, from Table 3) country 2004 2005 2006 2007 2008 2009 2010 2011 2012 EU27 AT BE BG CY CZ DE DK EE ES FI FR GR HU IE IT LT LU LV MT NL PL PT RO SE SI SK UK 3967.719 72.0263 101.0535 27.75602 4.38497 82.65799 704.7892 78.66894 6.19716 257.6103 71.5569 497.115 39.20132 70.8933 40.9338 416.4944 12.89069 4.98086 12.28032 2.765 295.335 140.3242 63.72671 0 148.1611 19.02556 28.93843 767.952 4370.1 79.61093 98.3546 30.5225 4.720965 94.85211 807.0936 78.07279 5.910105 300.203 74.37767 568.0637 38.20338 69.60354 41.0434 427.5435 10.7889 4.55689 15.2735 3.414 305.7352 191.0847 68.33652 60.0786 163.0265 19.01795 38.988 771.623 4632.439 81.01803 103.6526 33.19235 5.033605 106.7482 812.9024 86.16681 8.502442 366.0405 77.21358 598.482 40.81244 77.65086 30.78982 469.0736 11.19808 4.59502 14.80659 2.796 278.3853 225.2875 70.9639 90.34509 168.781 21.91985 48.00684 798.075 4835.381 81.05103 115.7081 36.23707 6.11498 117.5901 884.4048 88.30502 11.16528 431.0969 77.24919 526.689 45.25572 73.95917 27.15509 483.1506 11.87405 4.887745 15.4883 3.427 300.1261 244.1546 78.98888 99.45437 176.9704 20.91186 53.51651 820.449 4958.432 87.71588 107.8568 36.87178 5.909203 131.7999 891.7913 95.47173 12.00028 436.5027 88.69805 561.285 46.18571 76.91373 37.95636 493.2622 17.22199 6.576925 15.40733 3.79475 307.9541 253.8991 70.85436 103.0639 185.0132 22.39879 47.3171 814.7094 5023.826 92.88749 113.883 38.75091 5.211392 133.4383 900.4797 91.84866 11.8447 411.0707 86.57716 605.241 53.47945 76.37366 41.83759 484.5124 18.01393 7.54018 15.00996 3.51125 307.366 271.5234 72.82878 94.25561 191.1591 22.40028 48.63786 824.1432 5066.017 92.29151 134.425 36.43752 5.369483 141.0318 931.8273 93.88745 13.34367 418.4531 82.55235 597.564 53.77972 75.4071 42.09522 469.2164 14.94668 8.1541 15.47991 3.72625 319.5357 256.7199 76.49275 88.56143 195.4848 22.66396 46.30304 830.2664 5748.104 6124.714 124.2146 159.3833 54.19414 8.054635 123.2392 167.2961 49.77945 8.209476 142.4014 141.7485 1027.517 99.52592 17.56098 468.5801 103.9427 556.95 50.54002 87.26875 1217.769 109.1773 20.20508 423.7083 117.3105 549.127 51.15189 103.1875 68.708 69.1271 533.811 20.09004 7.55126 17.72358 4.77375 555.7639 21.86358 9.46337 15.19407 5.3095 Source: EU LFS 39 322.3166 326.9969 281.9589 70.42097 105.5672 215.9979 26.51981 58.51247 1113.928 316.0058 78.86416 121.0893 224.6254 23.97786 52.02866 1222.495 A 7: ICT specialists, % of total employment (ICT-3 from table 3) country 2004 2005 2006 2007 2008 2009 2010 2011 2012 EU27 AT BE BG CY CZ DE DK EE ES FI FR GR HU IE IT LT LU LV MT NL PL PT RO SE SI SK UK 1.9 2.0 2.4 0.9 1.3 1.8 2.0 2.9 1.0 1.4 3.0 2.0 0.9 1.8 2.2 1.9 0.9 2.6 1.2 1.9 3.6 1.0 1.2 0.0 3.4 2.0 1.3 2.7 2.1 2.1 2.3 1.0 1.4 2.0 2.2 2.8 1.0 1.6 3.1 2.3 0.9 1.8 2.1 1.9 0.7 2.4 1.5 2.3 3.8 1.4 1.3 0.7 3.8 2.0 1.8 2.7 2.2 2.1 2.4 1.1 1.4 2.2 2.2 3.1 1.3 1.9 3.1 2.4 0.9 2.0 1.5 2.0 0.7 2.4 1.4 1.8 3.4 1.5 1.4 1.0 3.8 2.3 2.1 2.8 2.2 2.0 2.6 1.1 1.6 2.4 2.3 3.1 1.7 2.1 3.1 2.1 1.0 1.9 1.3 2.1 0.8 2.4 1.4 2.2 3.6 1.6 1.5 1.1 3.9 2.1 2.3 2.8 2.2 2.1 2.4 1.1 1.5 2.6 2.3 3.3 1.8 2.2 3.5 2.2 1.0 2.0 1.8 2.1 1.1 3.3 1.4 2.4 3.6 1.6 1.4 1.1 4.0 2.2 1.9 2.8 2.3 2.3 2.6 1.2 1.4 2.7 2.3 3.3 2.0 2.2 3.5 2.4 1.2 2.0 2.1 2.1 1.3 3.4 1.5 2.2 3.6 1.7 1.4 1.0 4.2 2.3 2.1 2.8 2.3 2.3 3.0 1.2 1.4 2.9 2.4 3.5 2.3 2.3 3.4 2.3 1.2 2.0 2.2 2.1 1.2 3.7 1.6 2.3 3.8 1.7 1.5 1.0 4.3 2.3 2.0 2.9 2.7 3.0 3.5 1.8 2.0 2.9 2.6 3.7 2.9 2.6 4.2 2.2 1.2 2.3 3.7 2.3 1.6 3.3 2.1 2.8 3.9 1.8 1.5 1.2 4.7 2.8 2.5 3.8 2.8 2.9 3.7 1.7 2.1 2.9 3.0 4.1 3.2 2.5 4.7 2.1 1.4 2.7 3.8 2.4 1.7 4.0 1.7 3.1 3.9 2.0 1.7 1.3 4.8 2.6 2.2 4.2 Source: EU LFS 40 A 8: ICT specialists, 1000s (ISCO-08 codes applied to ISCO-88 using ILO correspondence tables and own estimation) country EU-27 AT BE BG CY CZ DE DK EE ES FI FR GR HU IE IT LT LU LV MT NL PL PT RO SE SI SK UK 2004 2005 2006 2007 2008 2009 2010 2011 2012 4102.253 74.81746 103.1022 28.19023 4.69115 82.65799 714.424 80.58854 7.76771 257.6103 73.12639 519.637 42.42447 74.1743 47.16023 442.4486 13.24296 5.07034 13.56211 2.916 301.5433 141.442 70.57758 4526.85 84.50122 100.9874 30.99334 4.984272 94.85212 818.9503 78.88034 6.675738 300.203 75.68719 589.5197 42.73897 74.18512 46.64206 452.0902 10.90886 4.82754 15.77255 3.60075 311.3661 201.1295 75.07128 66.533 165.2109 19.3516 39.49453 811.692 4813.672 83.5444 107.2997 34.17128 5.221245 108.6106 825.2189 87.84332 9.319243 383.2202 79.49952 622.69 46.08543 82.74128 31.58231 496.7585 12.62027 4.69965 16.09269 2.86475 285.0322 236.8372 76.28623 96.3185 172.3096 22.78468 48.293 835.727 5029.454 83.31411 118.0129 37.26288 6.570783 118.0477 899.7272 89.71987 11.45328 448.4701 80.3009 555.086 50.26693 81.474 27.15509 506.7946 12.65476 4.981005 15.99171 3.45475 307.9185 262.0195 81.89149 106.1384 181.3291 21.52045 54.39819 863.5 5159.842 90.60799 111.5839 37.6229 6.796602 132.9352 903.8181 97.24924 12.9659 463.6285 91.7512 581.871 52.68075 83.85774 41.74377 518.9925 18.88017 6.723713 15.68622 3.96575 316.6682 270.5081 74.94105 109.9213 189.4535 22.67905 48.23941 854.0699 5234.863 96.87934 117.3311 39.25799 5.81689 135.0554 913.4447 93.40825 12.99353 439.1814 88.54718 629.685 59.10986 82.3664 45.04216 507.7939 18.77621 7.7051 15.5574 3.59225 318.2652 290.9185 78.1866 99.06202 195.5677 22.46692 49.4924 869.3595 5277.219 94.97186 137.5938 38.38375 5.88783 142.9402 946.0288 95.09914 14.06164 437.4358 84.98967 627.497 61.09105 82.47479 45.31258 490.6449 15.63143 8.42796 15.87703 3.87525 329.6946 278.2526 81.41833 92.15772 199.781 22.9448 47.83962 876.9056 5748.105 124.2146 159.3833 54.19414 8.054635 142.4014 1027.517 99.52593 17.56098 468.5801 103.9427 556.95 50.54002 87.26875 68.708 533.811 20.09004 7.55126 17.72358 4.77375 322.3166 281.9589 70.42097 105.5672 215.9979 26.51981 58.60445 1113.928 6124.714 123.2392 167.2962 49.77945 8.209475 141.7485 1217.769 109.1773 20.20508 423.7083 117.3105 549.127 51.15189 103.1875 69.1271 555.7638 21.86358 9.46337 15.19407 5.3095 326.9968 316.0058 78.86416 121.0893 224.6254 23.97786 52.02866 1222.495 149.9656 19.02556 29.17213 802.915 Note: This Table represents the re-construction of the series of ICT specialists for the period 2004-2010 in terms of ISCO08 occupations based on the ILO official correspondence tables between ISCO-88 and ISCO-08, and on our own estimations where one-two-one correspondence between the two versions of ISCO is absent. An exact correspondence is available only for the ISCO-08 occupational group 250 ICT professionals (which maps exactly to the ISCO-88 group 213 Computing professionals). Correspondence between other ICT occupations is less straightforward. Thus, for example ISCO-08 group 35 Information and communication technicians corresponds to two (out of three) occupations from the ISCO-88 group 312 Computer associate professionals, to two (out of four) occupations from the ISCO-88 group 313 Optical and electronic equipment operators, and to one (out of nine) occupation from the ISCO-88 group 311 Physical and engineering science technicians. Source: EU LFS 41 A 9: ICT specialists, 1000s (ISCO-08 codes applied to ISCO-88 using ILO correspondence tables and own estimation) country EU-27 AT BE BG CY CZ DE DK EE ES FI FR GR HU IE IT LT LU LV MT NL PL PT RO SE SI SK UK 2004 2005 2006 2007 2008 2009 2010 2011 2012 2.0 2.0 2.5 0.9 1.4 1.8 2.0 2.9 1.3 1.4 3.1 2.1 1.0 1.9 2.6 2.0 0.9 2.7 1.3 2.0 3.7 1.0 1.4 2.2 2.2 2.4 1.0 1.4 2.0 2.3 2.9 1.1 1.6 3.1 2.4 1.0 1.9 2.4 2.0 0.7 2.5 1.5 2.4 3.8 1.4 1.5 0.7 3.8 2.0 1.8 2.8 2.2 2.1 2.5 1.1 1.5 2.2 2.2 3.1 1.4 1.9 3.2 2.5 1.0 2.1 1.6 2.2 0.8 2.4 1.5 1.9 3.5 1.6 1.5 1.0 3.9 2.4 2.1 2.9 2.3 2.1 2.7 1.1 1.7 2.4 2.4 3.2 1.7 2.2 3.2 2.2 1.1 2.1 1.3 2.2 0.8 2.5 1.4 2.2 3.7 1.7 1.6 1.1 4.0 2.2 2.3 3.0 2.3 2.2 2.5 1.1 1.8 2.7 2.3 3.4 2.0 2.3 3.6 2.2 1.2 2.2 2.0 2.2 1.2 3.3 1.4 2.5 3.7 1.7 1.4 1.2 4.1 2.3 2.0 2.9 2.4 2.4 2.7 1.2 1.5 2.7 2.4 3.4 2.2 2.3 3.6 2.5 1.3 2.2 2.3 2.2 1.3 3.5 1.6 2.2 3.7 1.8 1.5 1.1 4.3 2.3 2.1 3.0 2.4 2.3 3.1 1.3 1.5 2.9 2.4 3.5 2.5 2.4 3.5 2.4 1.4 2.2 2.4 2.1 1.3 3.8 1.7 2.4 3.9 1.8 1.6 1.0 4.4 2.4 2.1 3.0 2.7 3.0 3.5 1.8 2.0 2.9 2.6 3.7 2.9 2.6 4.2 2.2 1.2 2.3 3.7 2.3 1.6 3.3 2.1 2.8 3.9 1.8 1.5 1.2 4.7 2.8 2.5 3.8 2.8 2.9 3.7 1.7 2.1 2.9 3.0 4.1 3.2 2.5 4.7 2.1 1.4 2.7 3.8 2.4 1.7 4.0 1.7 3.1 3.9 2.0 1.7 1.3 4.8 2.6 2.2 4.2 3.5 2.0 1.4 2.8 Source: EU LFS 42 A 10: Distribution of ICT specialists among sector groups, 2012, % Agriculture, Forestry, Fishing Mining and Electricity, Water, Waste Manufacturing Construction Trade, Transport, Tourism Business services Other services EU27 0.00 0.05 0.41 0.08 0.22 1.65 0.36 AT BE BG CY CZ DE DK EE ES FI FR GR HU IE IT LT LU LV MT NL PL PT RO SE SI SK 0.00 0.00 0.00 0.00 0.00 0.00 0.00 0.00 0.00 0.00 0.00 0.00 0.00 0.00 0.00 0.06 0.05 0.05 0.01 0.02 0.08 0.04 0.01 0.01 0.06 0.03 0.03 0.04 0.06 0.02 0.01 0.02 0.05 0.08 0.05 0.05 0.01 0.05 0.03 0.03 0.03 0.49 0.47 0.17 0.04 0.5 0.72 0.43 0.33 0.24 0.78 0.25 0.09 0.39 0.41 0.48 0.18 0.2 0.09 0.17 0.22 0.31 0.16 0.27 0.37 0.42 0.27 0.08 0.09 0.01 0.09 0.05 0.06 0.04 0.12 0.13 0.21 0.03 0.03 0.03 0.05 0.05 0.11 0.06 0.02 0.04 0.04 0.06 0.06 0.07 0.18 0.01 0.04 0.47 0.36 0.2 0.31 0.15 0.28 0.36 0.26 0.13 0.32 0.19 0.2 0.17 0.14 0.15 0.18 0.4 0.14 0.23 0.23 0.16 0.23 0.16 0.41 0.19 0.17 1.46 2.2 0.97 1.37 1.77 1.58 2.61 1.95 1.58 2.84 1.48 0.7 1.56 0.61 1.47 0.98 2.25 1.17 2.22 1.66 1.15 0.92 0.64 3.11 1.54 1.51 0.4 0.52 0.29 0.3 0.4 0.32 0.59 0.56 0.36 0.51 0.14 0.31 0.46 0.16 0.25 0.24 1.01 0.24 0.32 0.47 0.3 0.32 0.13 0.69 0.39 0.22 0.06 0.41 0.16 0.23 2.59 0.68 UK 0.01 0.00 0.02 0.00 0.00 0.00 0.00 0.00 0.00 0.00 0.00 0.00 Source: EU LFS 43 A 11: ICT specialists in 2012, 1000s EU27 Agriculture, Forestry, Fishing Mining and Electricity, Water Supply (Waste management) Manufacturing Construction Trade, H&R, Transport, Tourism Business services Other services No answer total 4.525 99.168 896.665 164.995 total BE BG CY CZ DE DK EE ES FI FR GR HU 0.061 0.142 0 0 0.000 1.082 0 0 0.178 0 0.625 0 0.119 2.31 2.266 1.608 0.042 0.999 30.295 0.978 0.078 2.022 1.56 8.722 1.313 1.538 20.378 3.142 21.17 4.217 4.98 0.359 0.159 0.34 24.528 2.557 290.112 24.759 11.431 0.943 2.068 0.751 40.832 23.06 19.332 5.296 63.572 6.896 3.349 0.95 15.21 1.041 113 9.716 1.645 22.933 7.829 49.124 7.498 6.717 480.375 19.467 16.218 5.754 1.194 7.280 3,639.789 61.246 99.633 28.425 5.321 86.874 631.855 70.053 12.194 273.084 70.433 383.07 26.464 60.639 12.61 36.378 11.579 17.924 792.096 16.636 23.651 8.655 1.153 19.509 126.666 15.823 3.469 61.599 0.232 0.251 0.74 47.101 6,124.713 123.239 167.296 49.779 8.209 141.749 1,217.77 109.177 20.205 423.708 117.311 549.127 51.152 103.188 IE Agriculture, Forestry, Fishing Mining and Electricity, Water Supply (Waste management) Manufacturing Construction Trade, H&R, Transport, Tourism Business services Other services No answer AT IT LT LU LV MT NL PL PT RO SE SI SK UK 0.136 0.105 0 0.194 0 0.270 0.254 0.097 0.276 0.171 0 0.046 0.634 0.168 0.04 0.418 0.144 5.301 7.584 0.492 4.358 1.559 0.293 0.621 17.567 2.293 1.359 0.483 0.133 0.821 0.159 0.299 0.075 23.071 4.190 48.213 8.825 7.195 2.99 24.629 6.234 17.185 8.288 3.846 0.113 6.24 0.843 121.265 45.782 4.425 34.986 2.303 0.953 1.206 0.398 23.709 42.935 335.893 12.546 5.351 10.271 3.841 181.210 5.768 58.025 3.089 2.393 2.124 0.553 48.922 25.61 10.712 14.789 19.275 1.781 3.861 67.993 178.81 46.709 42.417 14.961 59.109 11.694 144.846 32.092 1.21 14.211 3.582 0.152 35.202 5.216 0 763.857 201.316 4.081 316.006 78.864 121.089 224.625 23.978 52.029 1,222.50 0.135 1.316 5.576 13.525 110.478 1.023 10.67 0.11 40.324 69.127 555.764 21.864 9.463 15.194 5.31 Source: EU LFS 45 326.997 A 12: ICT specialists in 2012, 1000s EU27 Agriculture, Forestry, Fishing Mining and Electricity, Water Supply (Waste management) AT 0.1 0.0 BE 0.1 BG CY 0.0 0.0 CZ 0.0 DE 0.1 DK 0.0 EE ES 0.0 0.0 FI FR 0.0 GR 0.1 0.0 HU 0.1 1.6 1.9 1.4 3.2 0.5 0.7 2.5 0.9 0.4 0.5 1.3 1.6 2.6 1.2 14.6 16.5 12.7 10.0 1.9 17.3 23.8 10.5 10.2 9.6 16.5 11.6 6.5 12.3 Construction 2.7 2.5 2.5 0.7 4.1 1.8 2.0 0.9 3.7 5.4 4.5 1.3 1.9 0.8 Trade, H&R, Transport, Tourism 7.8 15.8 9.7 11.6 14.5 5.1 9.3 8.9 8.1 5.4 6.7 8.9 14.7 5.4 Business services 59.4 49.7 59.6 57.1 64.8 61.3 51.9 64.2 60.4 64.5 60.0 69.8 51.7 49.2 Other services 12.9 13.5 14.1 17.4 14.0 13.8 10.4 14.5 17.2 14.5 10.7 6.6 22.6 14.5 0.8 0.0 0.0 0.0 0.0 0.0 0.0 0.2 0.0 0.0 0.2 0.1 0.0 0.0 Manufacturing No answer IE IT LT LU LV MT NL PL PT RO SE SI SK UK Agriculture, Forestry, Fishing 0.2 0.0 0.5 0.0 1.3 0.0 0.1 0.1 0.1 0.2 0.1 0.0 0.1 0.1 Mining and Electricity, Water Supply (Waste management) 1.9 1.0 0.8 0.4 2.8 2.7 1.6 2.4 0.6 3.6 0.7 1.2 1.2 1.4 Manufacturing 19.6 19.9 10.5 5.1 5.4 5.6 7.1 15.3 9.1 20.3 7.7 16.0 12.0 9.9 Construction 1.5 1.9 6.2 1.4 1.0 1.4 1.3 2.8 3.8 5.1 3.7 0.5 1.6 3.7 Trade, H&R, Transport, Tourism 6.4 6.3 10.5 10.1 7.9 7.5 7.3 8.1 13.6 12.2 8.6 7.4 7.4 5.6 62.1 60.4 57.4 56.5 67.6 72.3 55.4 56.6 53.8 48.8 64.5 59.3 67.7 62.5 Other services 8.3 10.4 14.1 25.3 14.0 10.4 15.0 14.8 19.0 9.7 14.3 14.9 10.0 16.5 No answer 0.0 0.0 0.0 1.2 0.0 0.0 12.3 0.0 0.0 0.0 0.5 0.6 0.0 0.3 Business services Source: EU LFS 46 A 13: ILO thematic view for ICT occupations (based on ISCO-08) (a) Professional and associate professional occupations 25 Information and communications technology professionals 251 Software and multimedia developers and analysts 2511 Systems analysts 2512 Software developers 2513 Web and multimedia developers 2514 Application programmers 2519 Software and multimedia developers and analysts not elsewhere classified 252 Database specialists and systems administrators 2521 Database designers and administrators 2522 Systems administrators 2523 Computer network professionals 2529 Database and network professionals not elsewhere classified 35 Information and communications technicians 351 ICT operations and user support technicians 3511 ICT operations technicians 3512 ICT user support technicians 3513 Computer network and systems technicians 3514 Web technicians 352 Communications technicians 3521 Broadcasting and audio-visual technicians 3522 Telecommunications engineering technicians (b) Other unit groups that primarily involve the production of ICT goods and services 133 ICT Service Managers 2152 Electronic Engineers 2153 Telecommunication Engineers 2166 Graphic and Multimedia Designers 2356 Information Technology Trainers 2434 ICT Sales Professionals 7422 ICT Installers and Servicers Source: ILO (2012) 47 A 14: The OECD ICT sector definition (a) 2002 definition (based on NACE Rev.1.1) ICT Manufacturing 3000 Manufacture of office, accounting and computing machinery 3130 Manufacture of insulated wire and cable 3210 Manufacture of electronic valves and tubes and other electronic components 3220 Manufacture of television and radio transmitters and apparatus for line telephony and line telegraphy 3230 Manufacture of television and radio receivers, sound or video recording or reproducing apparatus, and associated goods 3312 Manufacture of instruments and appliances for measuring, checking, testing, navigating and other purposes, except industrial process control equipment – 3313 Manufacture of industrial process control equipment ICT Services 5151 Wholesale of computers, computer peripheral equipment and software 5152 Wholesale of electronic and telecommunications parts and equipment 6420 Telecommunications 7123 Renting of office machinery and equipment (including computers) 72 Computer and related activities (b) 2006-07 definition (based on NACE Rev.2) ICT manufacturing – 2610 Manufacture of electronic components and boards – 2620 Manufacture of computers and peripheral equipment – 2630 Manufacture of communication equipment – 2640 Manufacture of consumer electronics – 2680 Manufacture of magnetic and optical media ICT trade – 4651 Wholesale of computers, computer peripheral equipment and software – 4652 Wholesale of electronic and telecommunications equipment and parts ICT services – 5820 Software publishing – 6110 Wired telecommunications activities – 6120 Wireless telecommunications activities – 6130 Satellite telecommunications activities – 6190 Other telecommunications activities – 6201 Computer programming activities – 6202 Computer consultancy and computer facilities management activities – 6209 Other information technology and computer service activities – 6311 Data processing, hosting and related activities – 6312 Web portals – 9511 Repair of computers and peripheral equipment – 9512 Repair of communication equipment Source: OECD (2011) 48 European Commission EUR 26121 – Joint Research Centre – Institute for Prospective Technological Studies Title: ICT-induced Technological Progress and Employment: a Happy Marriage or a Dangerous Liaison? A Literature Review Author: Anna Sabadash Luxembourg: Publications Office of the European Union 2013 – 58 pp. - 21.0 x 29.7 cm EUR – Scientific and Technical Research series – ISSN 1831-9424 (online) ISBN 978-92-79-32720-9 (pdf) doi:10.2791/2141 Abstract This study examines the evolution of the number of ICT-skilled workers employed in industry sectors in the EU28 over the period 2000-2012. Data are taken from the Eurostat Labour Force Statistics. It introduces a novel definition of ICT specialists that combines occupations and skills taxonomies. For the period prior to the introduction of the Standard Classification of Occupations (ISCO-08) it starts from the OECD definition but includes a wider range of ICT occupations. From 2011 onwards it adopts the thematic view for ICT occupations proposed by the ILO (2012). It confirms that employment of ICT specialists in the EU27 has been resilient to the economic downturn and uncertainty in global labour markets, and was able to maintain a growth path fo 4.3% per year over the period 2000-2012, more than 7 times higher than average growth of total employment over the same period. Though ICT employment evolved cyclically it never turned negative. This rapid growth in ICT employment confirms the increasing importance of ICT technologies in the global economy. LF-NA-26121-EN-N z As the Commission’s in-house science service, the Joint Research Centre’s mission is to provide EU policies with independent, evidence-based scientific and technical support throughout the whole policy cycle. Working in close cooperation with policy Directorates-General, the JRC addresses key societal challenges while stimulating innovation through developing new standards, methods and tools, and sharing and transferring its know-how to the Member States and international community. Key policy areas include: environment and climate change; energy and transport; agriculture and food security; health and consumer protection; information society and digital agenda; safety and security including nuclear; all supported through a cross-cutting and multi-disciplinary approach.


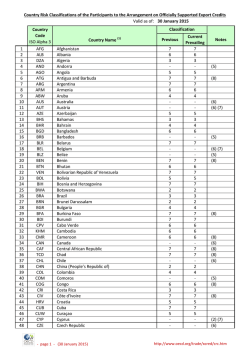
© Copyright 2026