
Form 10-Q - Johnson Controls Inc.
UNITED STATES
SECURITIES AND EXCHANGE COMMISSION
Washington, D.C. 20549
Form 10-Q
(Mark One)
QUARTERLY REPORT PURSUANT TO SECTION 13 OR 15(d) OF THE SECURITIES
EXCHANGE ACT OF 1934
For the quarterly period ended December 31, 2014
OR
TRANSITION REPORT PURSUANT TO SECTION 13 OR 15(d) OF THE SECURITIES
EXCHANGE ACT OF 1934
For the transition period from
Commission File Number: 1-5097
to
JOHNSON CONTROLS, INC.
(Exact name of registrant as specified in its charter)
Wisconsin
39-0380010
(State or Other Jurisdiction of
(I.R.S. Employer
Incorporation or Organization)
Identification No.)
5757 North Green Bay Avenue
Milwaukee, Wisconsin
53209
(Address of principal executive offices)
(Zip Code)
(414) 524-1200
(Registrant’s telephone number, including area code)
Not Applicable
(Former name, former address and former fiscal year, if changed since last report)
Indicate by check mark whether the registrant (1) has filed all reports required to be filed by Section 13 or 15(d) of the Securities Exchange Act of 1934 during
the preceding 12 months (or for such shorter period that the registrant was required to file such reports), and (2) has been subject to such filing requirements for
the past 90 days. Yes
No
Indicate by check mark whether the registrant has submitted electronically and posted on its corporate Web site, if any, every Interactive Data File required to be
submitted and posted pursuant to Rule 405 of Regulation S-T during the preceding 12 months (or for such shorter period that the registrant was required to
submit and post such files). Yes
No
Indicate by check mark whether the registrant is a large accelerated filer, an accelerated filer, a non-accelerated filer, or a smaller reporting company. See the
definitions of "large accelerated filer," "accelerated filer" and "smaller reporting company" in Rule 12b-2 of the Exchange Act.
Large accelerated filer
Accelerated filer
Non-accelerated filer
Smaller reporting company
(Do not check if a smaller reporting company)
Indicate by check mark whether the registrant is a shell company (as defined in Rule 12b-2 of the Exchange Act). Yes
No
Indicate the number of shares outstanding of each of the issuer’s classes of common stock, as of the latest practicable date.
Class
Shares Outstanding at December 31, 2014
Common Stock: $1.00 par value per share
657,293,891
1
JOHNSON CONTROLS, INC.
FORM 10-Q
Report Index
Page
Part I. Financial Information
Item 1. Financial Statements (unaudited)
Consolidated Statements of Financial Position at
December 31, 2014, September 30, 2014 and December 31, 2013
3
Consolidated Statements of Income for the
Three Month Periods Ended December 31, 2014 and 2013
4
Consolidated Statements of Comprehensive Income (Loss) for the
Three Month Periods Ended December 31, 2014 and 2013
5
Consolidated Statements of Cash Flows for the
Three Month Periods Ended December 31, 2014 and 2013
6
Notes to Consolidated Financial Statements
7
Report of Independent Registered Public Accounting Firm
31
Item 2. Management’s Discussion and Analysis of Financial Condition
and Results of Operations
32
Item 3. Quantitative and Qualitative Disclosures About Market Risk
43
Item 4. Controls and Procedures
43
Part II. Other Information
Item 1. Legal Proceedings
44
Item 1A. Risk Factors
44
Item 2. Unregistered Sales of Equity Securities and Use of Proceeds
44
Item 6. Exhibits
45
Signatures
46
2
PART I. FINANCIAL INFORMATION
ITEM 1. FINANCIAL STATEMENTS
Johnson Controls, Inc.
Consolidated Statements of Financial Position
(in millions, except par value; unaudited)
December 31,
2014
September 30,
2014
December 31,
2013
Assets
Cash and cash equivalents
Accounts receivable - net
Inventories
Assets held for sale
Other current assets
Current assets
$
Property, plant and equipment - net
Goodwill
Other intangible assets - net
Investments in partially-owned affiliates
Noncurrent assets held for sale
Other noncurrent assets
Total assets
$
168
5,360
2,439
2,112
2,302
12,381
6,114
7,010
1,600
1,117
684
2,801
31,707
$
$
409
5,871
2,477
2,157
2,193
13,107
6,314
7,127
1,639
1,018
630
2,969
32,804
$
$
245
6,743
2,452
777
2,509
12,726
6,665
6,717
1,070
1,043
—
2,611
30,832
Liabilities and Equity
Short-term debt
Current portion of long-term debt
Accounts payable
Accrued compensation and benefits
Liabilities held for sale
Other current liabilities
Current liabilities
$
Long-term debt
Pension and postretirement benefits
Other noncurrent liabilities
Long-term liabilities
1,075
139
4,584
864
1,706
3,019
11,387
$
183
140
5,270
1,124
1,801
3,176
11,694
$
986
818
5,592
1,017
321
3,069
11,803
6,322
833
1,870
9,025
6,357
865
2,132
9,354
4,866
736
1,466
7,068
209
194
169
711
2,809
10,291
(2,387)
(601)
10,823
263
11,086
31,707 $
707
2,669
9,956
(1,784)
(237)
11,311
251
11,562
32,804 $
Commitments and contingencies (Note 18)
Redeemable noncontrolling interests
Common stock, $1.00 par value
Capital in excess of par value
Retained earnings
Treasury stock, at cost
Accumulated other comprehensive income (loss)
Shareholders’ equity attributable to Johnson Controls, Inc.
Noncontrolling interests
Total equity
Total liabilities and equity
$
The accompanying notes are an integral part of the financial statements.
3
703
2,431
9,649
(1,652)
400
11,531
261
11,792
30,832
Johnson Controls, Inc.
Consolidated Statements of Income
(in millions, except per share data; unaudited)
Three Months Ended
December 31,
2014
2013
Net sales
Products and systems*
Services*
$
Cost of sales
Products and systems*
Services*
Gross profit
Selling, general and administrative expenses
Net financing charges
Equity income
8,723
1,943
10,666
$
8,605
1,969
10,574
7,406
1,580
8,986
7,377
1,621
8,998
1,680
1,576
(1,034)
(71)
102
(1,038)
(55)
112
Income from continuing operations before income taxes
677
595
Income tax provision
131
111
Income from continuing operations
546
484
—
18
546
502
39
33
Income from discontinued operations, net of tax (Note 4)
Net income
Income from continuing operations attributable to noncontrolling interests
Net income attributable to Johnson Controls, Inc.
Amounts attributable to Johnson Controls, Inc. common shareholders:
Income from continuing operations
Income from discontinued operations
Net income
Basic earnings per share attributable to Johnson Controls, Inc.
Continuing operations
Discontinued operations
Net income
507
$
469
$
507
—
507
$
451
18
469
0.77
—
0.77
$
0.76
—
0.76
$
$
$
$
Diluted earnings per share attributable to Johnson Controls, Inc.
Continuing operations
Discontinued operations
Net income
*
$
$
$
$
$
$
0.67
0.03
0.70
0.66
0.03
0.69
Products and systems consist of Automotive Experience and Power Solutions products and systems and Building Efficiency
installed systems. Services are Building Efficiency technical services and Global Workplace Solutions.
The accompanying notes are an integral part of the financial statements.
4
Johnson Controls, Inc.
Consolidated Statements of Comprehensive Income (Loss)
(in millions; unaudited)
Three Months Ended
December 31,
2014
Net income
$
2013
546
$
502
Other comprehensive income (loss), net of tax:
Foreign currency translation adjustments
(351)
(14)
(10)
(1)
Realized and unrealized losses on marketable common stock
—
(2)
Pension and postretirement plans
(3)
(1)
(364)
(18)
182
484
39
33
Realized and unrealized losses on derivatives
Other comprehensive loss
Total comprehensive income
Comprehensive income attributable to noncontrolling interests
Comprehensive income attributable to Johnson Controls, Inc.
$
The accompanying notes are an integral part of the financial statements.
5
143
$
451
Johnson Controls, Inc.
Consolidated Statements of Cash Flows
(in millions; unaudited)
Three Months Ended
December 31,
2014
2013
Operating Activities
Net income attributable to Johnson Controls, Inc.
Income attributable to noncontrolling interests
Net income
Adjustments to reconcile net income to cash used by operating activities:
Depreciation and amortization
Pension and postretirement benefit expense (income)
Pension and postretirement contributions
Equity in earnings of partially-owned affiliates, net of dividends received
Deferred income taxes
Fair value adjustment of equity investment
Equity-based compensation
Other
Changes in assets and liabilities, excluding acquisitions and divestitures:
Receivables
Inventories
Other assets
Restructuring reserves
Accounts payable and accrued liabilities
Accrued income taxes
Cash used by operating activities
$
507
39
546
$
469
33
502
224
(14)
(24)
(92)
96
—
21
(5)
244
9
(25)
(74)
14
(19)
18
(8)
410
(20)
(129)
(77)
(702)
(394)
(160)
531
(95)
(41)
(62)
(929)
(346)
(281)
Investing Activities
Capital expenditures
Sale of property, plant and equipment
Acquisition of businesses, net of cash acquired
Business divestitures
Changes in long-term investments
Other
Cash used by investing activities
(262)
14
(13)
—
2
5
(254)
(345)
21
(128)
13
3
5
(431)
Financing Activities
Increase in short-term debt - net
Increase in long-term debt
Repayment of long-term debt
Stock repurchases
Payment of cash dividends
Proceeds from the exercise of stock options
Other
Cash provided (used) by financing activities
Effect of exchange rate changes on cash and cash equivalents
Cash held for sale
Decrease in cash and cash equivalents
Cash and cash equivalents at beginning of period
Cash and cash equivalents at end of period
898
—
(9)
(600)
(146)
105
(19)
229
(57)
1
(241)
409
168 $
$
The accompanying notes are an integral part of the financial statements.
6
867
302
(6)
(1,199)
(130)
84
4
(78)
(19)
(1)
(810)
1,055
245
Johnson Controls, Inc.
Notes to Consolidated Financial Statements
December 31, 2014
(unaudited)
1.
Financial Statements
In the opinion of management, the accompanying unaudited consolidated financial statements contain all adjustments (which
include normal recurring adjustments) necessary to present fairly the financial position, results of operations and cash flows
for the periods presented. Certain information and footnote disclosures normally included in financial statements prepared in
accordance with accounting principles generally accepted in the United States of America (U.S. GAAP) have been omitted
pursuant to the rules and regulations of the United States Securities and Exchange Commission (SEC). These consolidated
financial statements should be read in conjunction with the audited financial statements and notes thereto included in the
Johnson Controls, Inc. (the "Company") Annual Report on Form 10-K for the year ended September 30, 2014. The results of
operations for the three month period ended December 31, 2014 are not necessarily indicative of results for the Company’s
2015 fiscal year because of seasonal and other factors.
The consolidated financial statements include the accounts of Johnson Controls, Inc. and its domestic and non-U.S. subsidiaries
that are consolidated in conformity with U.S. GAAP. All significant intercompany transactions have been eliminated.
Investments in partially-owned affiliates are accounted for by the equity method when the Company’s interest exceeds 20%
and the Company does not have a controlling interest.
Under certain criteria as provided for in Financial Accounting Standards Board (FASB) Accounting Standards Codification
(ASC) 810, "Consolidation," the Company may consolidate a partially-owned affiliate. To determine whether to consolidate
a partially-owned affiliate, the Company first determines if the entity is a variable interest entity (VIE). An entity is considered
to be a VIE if it has one of the following characteristics: 1) the entity is thinly capitalized; 2) residual equity holders do not
control the entity; 3) equity holders are shielded from economic losses or do not participate fully in the entity’s residual
economics; or 4) the entity was established with non-substantive voting. If the entity meets one of these characteristics, the
Company then determines if it is the primary beneficiary of the VIE. The party with the power to direct activities of the VIE
that most significantly impact the VIE’s economic performance and the potential to absorb benefits or losses that could be
significant to the VIE is considered the primary beneficiary and consolidates the VIE. If the entity is not considered a VIE,
then the Company applies the voting interest model to determine whether or not the Company shall consolidate the partiallyowned affiliate.
Consolidated VIEs
Based upon the criteria set forth in ASC 810, the Company has determined that it was the primary beneficiary in three VIEs
for the reporting periods ended December 31, 2014, September 30, 2014 and December 31, 2013, as the Company absorbs
significant economics of the entities and has the power to direct the activities that are considered most significant to the entities.
Two of the VIEs manufacture products in North America for the automotive industry. The Company funds the entities’ short
term liquidity needs through revolving credit facilities and has the power to direct the activities that are considered most
significant to the entities through its key customer supply relationships.
In fiscal 2012, a pre-existing VIE accounted for under the equity method was reorganized into three separate investments as
a result of the counterparty exercising its option to put its interest to the Company. The Company acquired additional interests
in two of the reorganized group entities. The reorganized group entities are considered to be VIEs as the other owner party
has been provided decision making rights but does not have equity at risk. The Company is considered the primary beneficiary
of one of the entities due to the Company’s power pertaining to decisions over significant activities of the entity. As such, this
VIE has been consolidated within the Company’s consolidated statements of financial position. The impact of consolidation
of the entity on the Company’s consolidated statements of income for the three month periods ended December 31, 2014 and
2013 was not material. The VIE is named as a co-obligor under a third party debt agreement of $166 million, maturing in
fiscal 2020, under which it could become subject to paying more than its allocated share of the third party debt in the event
of bankruptcy of one or more of the other co-obligors. The other co-obligors, all related parties in which the Company is an
equity investor, consist of the remaining group entities involved in the reorganization. As part of the overall reorganization
transaction, the Company has also provided financial support to the group entities in the form of loans totaling $57 million,
which are subordinate to the third party debt agreement. The Company is a significant customer of certain co-obligors, resulting
in a remote possibility of loss. Additionally, the Company is subject to a floor guaranty expiring in fiscal 2022; in the event
that the other owner party no longer owns any part of the group entities due to sale or transfer, the Company has guaranteed
7
Johnson Controls, Inc.
Notes to Consolidated Financial Statements
December 31, 2014
(unaudited)
that the proceeds received from the sale or transfer will not be less than $25 million. The Company has partnered with the
group entities to design and manufacture battery components for the Power Solutions business.
The carrying amounts and classification of assets (none of which are restricted) and liabilities included in the Company’s
consolidated statements of financial position for the consolidated VIEs are as follows (in millions):
December 31,
2014
Current assets
$
Noncurrent assets
Total assets
Current liabilities
$
218
136
December 31,
2013
$
138
212
140
$
320
$
356
$
352
$
155
$
189
$
171
Noncurrent liabilities
Total liabilities
184
September 30,
2014
36
$
191
37
$
226
39
$
210
The Company did not have a significant variable interest in any other consolidated VIEs for the presented reporting periods.
Nonconsolidated VIEs
As mentioned previously within the "Consolidated VIEs" section above, in fisca1 2012, a pre-existing VIE was reorganized
into three separate investments as a result of the counterparty exercising its option to put its interest to the Company. The
reorganized group entities are considered to be VIEs as the other owner party has been provided decision making rights but
does not have equity at risk. The Company is not considered to be the primary beneficiary of two of the entities as the Company
cannot make key operating decisions considered to be most significant to the VIEs. Therefore, the entities are accounted for
under the equity method of accounting as the Company’s interest exceeds 20% and the Company does not have a controlling
interest. The Company’s maximum exposure to loss includes the partially-owned affiliate investment balance of $60 million,
$59 million and $57 million at December 31, 2014, September 30, 2014 and December 31, 2013, respectively, as well as the
subordinated loan from the Company, third party debt agreement and floor guaranty mentioned previously within the
"Consolidated VIEs" section above. Current liabilities due to the VIEs are not material and represent normal course of business
trade payables for all presented periods.
The Company did not have a significant variable interest in any other unconsolidated VIEs for the presented reporting periods.
Restricted Cash
At December 31, 2014, September 30, 2014 and December 31, 2013, the Company held restricted cash of approximately $8
million, $4 million and $24 million, respectively, within cash and cash equivalents. These amounts were collected from
customers for payment of maintenance costs under contract, and withdrawals are restricted for this purpose.
Retrospective Changes
Certain amounts for the three months ended December 31, 2013 have been revised to conform to the current year’s presentation.
At March 31, 2014, the Company determined that its Automotive Experience Electronics segment met the criteria to be
classified as a discontinued operation, which required retrospective application to financial information for all periods
presented. Refer to Note 4, "Discontinued Operations," of the notes to consolidated financial statements for further information
regarding the Company's discontinued operations.
2.
New Accounting Standards
In May 2014, the FASB issued Accounting Standards Update (ASU) No. 2014-09, "Revenue from Contracts with Customers
(Topic 606)." ASU No. 2014-09 clarifies the principles for recognizing revenue when an entity either enters into a contract
8
Johnson Controls, Inc.
Notes to Consolidated Financial Statements
December 31, 2014
(unaudited)
with customers to transfer goods or services or enters into a contract for the transfer of non-financial assets. ASU No. 2014-09
will be effective retrospectively for the Company for the quarter ending December 31, 2017, with early adoption not permitted.
The Company is currently assessing the impact adoption of this guidance will have on its consolidated financial statements.
In April 2014, the FASB issued ASU No. 2014-08, "Presentation of Financial Statements (Topic 205) and Property, Plant and
Equipment (Topic 360): Reporting Discontinued Operations and Disclosures of Disposals of Components of an Entity." ASU
No. 2014-08 limits discontinued operations reporting to situations where the disposal represents a strategic shift that has (or
will have) a major effect on an entity's operations and financial results, and requires expanded disclosures for discontinued
operations. ASU No. 2014-08 will be effective prospectively for the Company for disposals that occur during or after the
quarter ending December 31, 2015, with early adoption permitted in certain instances. The significance of this guidance for
the Company is dependent on any future dispositions or disposals.
In July 2013, the FASB issued ASU No. 2013-11, "Income Taxes (Topic 740): Presentation of an Unrecognized Tax Benefit
When a Net Operating Loss Carryforward, a Similar Tax Loss, or a Tax Credit Carryforward Exists." ASU No. 2013-11
clarifies that companies should present an unrecognized tax benefit as a reduction to a deferred tax asset for a net operating
loss carryforward, a similar tax loss or a tax credit carryforward. ASU No. 2013-11 was effective for the Company for the
quarter ending December 31, 2014. The adoption of this guidance did not have a significant impact on the Company's
consolidated financial statements.
3.
Acquisitions and Divestitures
In the first quarter of fiscal 2015, the Company completed two acquisitions for a combined purchase price, net of cash acquired,
of $38 million, $9 million of which was paid in the three months ended December 31, 2014. The acquisitions in the aggregate
were not material to the Company’s consolidated financial statements. In connection with the acquisitions, the Company
recorded goodwill of $9 million.
In the first quarter of fiscal 2015, the Company adjusted the purchase price allocation of the fiscal 2014 acquisition of Air
Distribution Technologies Inc. (ADT). The adjustment was made as a result of a true-up to the purchase price in the amount
of $4 million, all of which was paid in the three months ended December 31, 2014. Also, in connection with this acquisition,
the Company recorded additional goodwill of $5 million in fiscal 2015 related to the purchase price allocations. The purchase
price allocations may be subsequently adjusted to reflect final valuation studies.
In January 2015, the Company signed a definitive agreement to create a joint venture with Hitachi to expand its Building
Efficiency product offerings. The formation of the joint venture is expected to close in the fourth quarter of fiscal 2015, pending
regulatory approvals.
In January 2015, the Company signed an agreement to sell its interests in the Brookfield Johnson Controls joint ventures in
Australia and Canada to Brookfield Asset Management. Estimated sales proceeds are $200 million and the transaction is
expected to close in the second quarter of fiscal 2015, pending regulatory approvals.
In the first quarter of fiscal 2014, the Company completed two acquisitions for a combined purchase price, net of cash acquired,
of $128 million, all of which was paid in the three months ended December 31, 2013. The acquisitions in the aggregate were
not material to the Company's consolidated financial statements. In connection with the acquisitions, the Company recorded
goodwill of $102 million. As a result of one of the acquisitions, which increased the Company's ownership from a noncontrolling
to controlling interest, the Company recorded a non-cash gain of $19 million in equity income for the Power Solutions business
to adjust the Company's existing equity investment in the partially-owned affiliate to fair value.
In the first quarter of fiscal 2014, the Company completed one divestiture for a sales price of $13 million, all of which was
received as of December 31, 2013. The divestiture was not material to the Company’s consolidated financial statements. In
connection with the divestiture, the Company recorded a gain, net of transaction costs, of $9 million in the Automotive
Experience Interiors segment. There was no change in goodwill as a result of this transaction.
In the first quarter of fiscal 2014, the Company adjusted the purchase price allocation of certain fiscal 2013 acquisitions and
recorded additional goodwill of $2 million.
9
Johnson Controls, Inc.
Notes to Consolidated Financial Statements
December 31, 2014
(unaudited)
4.
Discontinued Operations
In the fourth quarter of fiscal 2013, the Company completed its divestiture of its Automotive Experience Electronics'
HomeLink® product line to Gentex Corporation. In the second quarter of fiscal 2014, the Company announced that it had
reached a definitive agreement to sell the remainder of the Automotive Experience Electronics business to Visteon Corporation,
subject to regulatory and other approvals. The sale closed on July 1, 2014. At March 31, 2014, the Company determined that
the Automotive Experience Electronics segment met the criteria to be classified as a discontinued operation, which required
retrospective application to financial information for all periods presented. The Company did not allocate any general corporate
overhead to discontinued operations. The assets and liabilities of the Automotive Experience Electronics segment were reflected
as held for sale in the consolidated statements of financial position at December 31, 2013.
There were no amounts classified as discontinued operations for the three month period ended December 31, 2014. The
following table summarizes the results of the Automotive Experience Electronics business, reclassified as discontinued
operations for the three month period ended December 31, 2013 (in millions):
Three Months Ended
December 31,
2013
Net sales
$
334
Income from discontinued operations before income taxes
36
Provision for income taxes on discontinued operations
15
Income from discontinued operations attributable to noncontrolling interests, net of
tax
Income from discontinued operations, net of tax
3
$
18
For the three months ended December 31, 2013, the effective tax rate was greater than the U.S. federal statutory rate of 35%
primarily due to unbenefited foreign losses.
Assets and Liabilities Held for Sale
The Company has determined that certain of its businesses met the criteria to be classified as held for sale. The Automotive
Experience Electronics segment and the headliner and sun visor product lines were classified as held for sale beginning
September 30, 2013. The headliner and sun visor product lines and the Automotive Experience Electronics segment were sold
during the third and fourth quarters of fiscal 2014, respectively.
10
Johnson Controls, Inc.
Notes to Consolidated Financial Statements
December 31, 2014
(unaudited)
The following table summarizes the carrying value of the Electronics and headliner and sun visor assets and liabilities held
for sale (in millions):
December 31,
2013
Cash and cash equivalents
$
5
Accounts receivable - net
173
Inventories
134
Other current assets
62
Property, plant and equipment - net
167
Goodwill
74
Other intangible assets - net
60
Investments in partially-owned affiliates
31
Other noncurrent assets
71
Assets held for sale
$
777
Short-term debt
$
7
Accounts payable
227
Accrued compensation and benefits
32
Other current liabilities
41
Pension and postretirement benefits
11
Other noncurrent liabilities
3
Liabilities held for sale
$
321
The headliner and sun visor product lines classified as held for sale were immaterial to the Company individually and in the
aggregate, and did not constitute a distinguishable business in order to be classified as a discontinued operation.
In May 2014, the Company announced the signing of an agreement to form a global automotive interiors joint venture with
Yanfeng Automotive Trim Systems. The formation of the joint venture is expected to close in the fourth quarter of fiscal 2015,
pending regulatory approvals. As a result, a majority of the Automotive Experience Interiors business met the criteria to be
classified as held for sale. Additionally, in September 2014, the Company announced its intention to divest its Global Workplace
Solutions business and has determined that the business meets the criteria to be classified as held for sale.
11
Johnson Controls, Inc.
Notes to Consolidated Financial Statements
December 31, 2014
(unaudited)
The following table summarizes the carrying value of the Interiors and Global Workplace Solutions asset and liabilities held
for sale (in millions):
December 31, 2014
September 30, 2014
Global
Workplace
Solutions
Global
Workplace
Solutions
Interiors
Cash and cash equivalents
$
—
$
19
Total
$
Interiors
19
$
—
$
20
Total
$
20
Accounts receivable - net
509
756
1,265
596
723
1,319
Inventories
214
6
220
209
9
218
Other current assets
Property, plant and equipment net
177
57
234
174
57
231
555
38
593
496
34
530
21
245
266
12
253
265
Goodwill
Other intangible assets - net
Investments in partially-owned
affiliates
4
34
38
4
35
39
71
—
71
83
—
83
Other noncurrent assets
33
57
90
35
47
82
Assets held for sale
$
Short-term debt
$
Accounts payable
Accrued compensation and
benefits
Other current liabilities
Liabilities held for sale
$
1,584
$
—
$
1,212
$
6
$
2,796
$
6
$
1,609
$
—
$
1,178
$
3
$
2,787
3
555
614
1,169
655
591
1,246
16
102
118
24
128
152
160
253
413
154
246
400
731
$
975
$
1,706
$
833
$
968
$
1,801
These divestitures could result in a gain or loss on sale to the extent the ultimate selling price differs from the carrying value
of the net assets recorded for each business. The Interiors business classified as held for sale does not meet the criteria to be
classified as a discontinued operation at December 31, 2014 primarily due to the Company's anticipated continuing involvement
in these operations following a divestiture. The Global Workplace Solutions business classified as held for sale does not meet
the criteria to be classified as a discontinued operation at December 31, 2014 primarily due to the uncertainty regarding the
Company's potential continuing involvement in these operations following a divestiture and the status of transaction
negotiations.
5.
Percentage-of-Completion Contracts
The Building Efficiency business records certain long-term contracts under the percentage-of-completion method of
accounting. Under this method, sales and gross profit are recognized as work is performed based on the relationship between
actual costs incurred and total estimated costs at completion. The Company records costs and earnings in excess of billings
on uncompleted contracts primarily within accounts receivable - net and billings in excess of costs and earnings on uncompleted
contracts primarily within other current liabilities in the consolidated statements of financial position. Costs and earnings in
excess of billings related to these contracts were $498 million, $507 million and $486 million at December 31,
2014, September 30, 2014 and December 31, 2013, respectively. Billings in excess of costs and earnings related to these
contracts were $339 million, $363 million and $302 million at December 31, 2014, September 30, 2014 and December 31,
2013, respectively.
12
Johnson Controls, Inc.
Notes to Consolidated Financial Statements
December 31, 2014
(unaudited)
6.
Inventories
Inventories consisted of the following (in millions):
December 31,
2014
Raw materials and supplies
$
1,096
Work-in-process
$
1,129
382
Finished goods
$
2,439
December 31,
2013
$
1,112
398
961
Inventories
7.
September 30,
2014
402
950
$
2,477
938
$
2,452
Goodwill and Other Intangible Assets
The changes in the carrying amount of goodwill in each of the Company’s reportable segments for the nine month period
ended September 30, 2014 and the three month period ended December 31, 2014 were as follows (in millions):
Building Efficiency
North America Systems and
Service
December 31,
2013
Business
Acquisitions
Business
Divestitures
$
$
$
Global Workplace Solutions
Asia
Other
Automotive Experience
Seating
Interiors
Power Solutions
Total
$
1,228
256
387
1,004
2,678
—
1,164
6,717
$
—
—
34
837
—
—
4
875
$
Impairments
Currency
Translation
and Other
September 30,
2014
— $
(253)
—
—
— $
—
—
(47)
(1) $
(3)
(7)
(6)
1,227
—
414
1,788
—
(12)
—
(265) $
—
—
—
(47) $
(122)
12
(26)
(153) $
2,556
—
1,142
7,127
September 30,
2014
Business
Acquisitions
Business
Divestitures
Impairments
$
$
$
$
Currency
Translation
and Other
December 31,
2014
Building Efficiency
North America Systems and
Service
Asia
Other
1,227
—
—
—
$
(1) $
1,226
414
—
—
—
(10)
404
1,788
5
—
—
(15)
1,778
2,556
—
—
—
(74)
2,482
Automotive Experience
Seating
Interiors
Power Solutions
Total
$
—
9
(9)
—
—
1,142
—
—
—
(22)
(9) $
—
7,127
$
14
13
$
$
(122) $
—
1,120
7,010
Johnson Controls, Inc.
Notes to Consolidated Financial Statements
December 31, 2014
(unaudited)
At December 31, 2013, accumulated goodwill impairment charges include $430 million related to the Automotive Experience
Interiors segment. The nine months ended September 30, 2014 Building Efficiency Global Workplace Solutions business
divestiture amount includes $253 million of goodwill transferred to assets held for sale on the consolidated statement of
financial position. The nine months ended September 30, 2014 Automotive Experience Interiors business divestiture amount
includes $12 million of goodwill transferred to noncurrent assets held for sale on the consolidated statement of financial
position. The three months ended December 31, 2014 Automotive Experience Interiors business divestiture amount includes
$9 million of goodwill transferred to noncurrent assets held for sale on the consolidated statement of financial position. Refer
to Note 4, "Discontinued Operations," of the notes to consolidated financial statements for further information regarding the
Company's assets and liabilities held for sale.
During the nine months ended September 30, 2014, as a result of recent operating results, restructuring actions and expected
future profitability, the Company's forecasted cash flow estimates used in the goodwill assessment were negatively impacted
as of September 30, 2014 for the Building Efficiency Other - Latin America reporting unit. As a result, the Company concluded
that the carrying value of the Building Efficiency Other - Latin America reporting unit exceeded its fair value as of September
30, 2014. The Company recorded a goodwill impairment charge of $47 million in the fourth quarter of fiscal 2014, which
was determined by comparing the carrying value of the reporting unit's goodwill with the implied fair value of goodwill for
the reporting unit. The Building Efficiency Other - Latin America reporting unit had no remaining goodwill at September 30,
2014.
The Company's impairment testing in the fourth quarter of fiscal 2014 indicated that the estimated fair value of the Building
Efficiency Other - Middle East reporting unit exceeded its corresponding carrying amount including goodwill by approximately
9%. Accordingly, the Company has not recognized any impairment of goodwill associated with this reporting unit, which as
of December 31, 2014 had a goodwill balance of $85 million. The Company continuously monitors for events and circumstances
that could negatively impact the key assumptions in determining fair value, including long-term revenue growth projections,
profitability, discount rates, recent market valuations from transactions by comparable companies, volatility in the Company's
market capitalization, and general industry, market and macro-economic conditions. It is possible that future changes in such
circumstances, or in the variables associated with the judgments, assumptions and estimates used in assessing the fair value
of the reporting unit, would require the Company to record a non-cash impairment charge.
The assumptions included in the impairment test required judgment, and changes to the inputs could impact the results of the
calculation. Other than management's internal projections of future cash flows, the primary assumptions used in the impairment
test was the weighted-average cost of capital and long-term growth rates. Although the Company's cash flow forecasts are
based on assumptions that are considered reasonable by management and consistent with the plans and estimates management
is using to operate the underlying businesses, there are significant judgments in determining the expected future cash flows.
The Company’s other intangible assets, primarily from business acquisitions valued based on independent appraisals, consisted
of (in millions):
December 31, 2014
Gross
Carrying
Amount
Accumulated
Amortization
$
$
September 30, 2014
Net
Gross
Carrying
Amount
Accumulated
Amortization
$
$
December 31, 2013
Net
Gross
Carrying
Amount
Accumulated
Amortization
$
$
Net
Amortized intangible assets
Patented technology
Customer relationships
Miscellaneous
Total amortized intangible assets
85
(57) $
28
86
(56) $
30
91
(52) $
39
1,000
(172)
828
1,017
(161)
856
609
(149)
460
312
(113)
199
312
(106)
206
353
(99)
254
1,397
(342)
1,055
1,415
(323)
1,092
1,053
(300)
753
—
317
Unamortized intangible assets
Trademarks/trade names
Total intangible assets
545
$ 1,942
—
$
545
547
(342) $ 1,600
$ 1,962
—
$
547
317
(323) $ 1,639
$ 1,370
$
(300) $ 1,070
Amortization of other intangible assets for the three month periods ended December 31, 2014 and 2013 was $24 million and
$20 million, respectively. Excluding the impact of any future acquisitions, the Company anticipates amortization for fiscal
14
Johnson Controls, Inc.
Notes to Consolidated Financial Statements
December 31, 2014
(unaudited)
2016, 2017, 2018, 2019 and 2020 will be approximately $89 million, $86 million, $83 million, $76 million and $69 million
per year, respectively.
8.
Product Warranties
The Company offers warranties to its customers depending upon the specific product and terms of the customer purchase
agreement. A typical warranty program requires that the Company replace defective products within a specified time period
from the date of sale. The Company records an estimate for future warranty-related costs based on actual historical return
rates and other known factors. Based on analysis of return rates and other factors, the Company’s warranty provisions are
adjusted as necessary. The Company monitors its warranty activity and adjusts its reserve estimates when it is probable that
future warranty costs will be different than those estimates.
The Company’s product warranty liability is recorded in the consolidated statements of financial position in other current
liabilities if the warranty is less than one year and in other noncurrent liabilities if the warranty extends longer than one year.
The changes in the carrying amount of the Company’s total product warranty liability, including extended warranties for which
deferred revenue is recorded, for the three months ended December 31, 2014 and 2013 were as follows (in millions):
Three Months Ended
December 31,
2014
Balance at beginning of period
$
319
Accruals for warranties issued during the period
Accruals related to pre-existing warranties (including changes in estimates)
Settlements made (in cash or in kind) during the period
Currency translation
Balance at end of period
9.
2013
$
$
256
67
70
1
1
(69)
(53)
(3)
—
315
$
274
Significant Restructuring and Impairment Costs
To better align its resources with its growth strategies and reduce the cost structure of its global operations to address the
softness in certain underlying markets, the Company committed to significant restructuring plans in fiscal 2014, 2013 and
2012 and recorded $324 million, $957 million and $287 million, respectively, of restructuring and impairment costs in the
consolidated statements of income. The restructuring actions related to cost reduction initiatives in the Company’s Automotive
Experience, Building Efficiency and Power Solutions businesses and included workforce reductions, plant closures, and asset
and goodwill impairments. The restructuring actions are expected to be substantially complete by the end of fiscal 2015.
Additionally, the Company recorded $53 million, $28 million and $10 million of restructuring and impairment costs within
discontinued operations related to the Automotive Experience Electronics business in fiscal 2014, 2013 and 2012, respectively.
The following table summarizes the changes in the Company’s restructuring reserve, included within other current liabilities
in the consolidated statements of financial position (in millions):
Employee
Severance and
Termination
Benefits
Balance at September 30, 2014
$
Utilized—cash
Utilized—noncash
Balance at December 31, 2014
$
415
Currency
Translation
Other
$
5
$
(14) $
Total
406
(68)
(1)
—
(69)
—
—
(11)
(11)
(25) $
326
347
$
4
15
$
Johnson Controls, Inc.
Notes to Consolidated Financial Statements
December 31, 2014
(unaudited)
The Company's restructuring plans include workforce reductions of approximately 20,600 employees (11,000 for the
Automotive Experience business, 8,500 for the Building Efficiency business and 1,100 for the Power Solutions business).
Restructuring charges associated with employee severance and termination benefits are paid over the severance period granted
to each employee or on a lump sum basis in accordance with individual severance agreements. As of December 31, 2014,
approximately 14,800 of the employees have been separated from the Company pursuant to the restructuring plans. In addition,
the restructuring plans include twenty-eight plant closures (nineteen for Automotive Experience, seven for Building Efficiency
and two for Power Solutions). As of December 31, 2014, sixteen of the twenty-eight plants have been closed.
Company management closely monitors its overall cost structure and continually analyzes each of its businesses for
opportunities to consolidate current operations, improve operating efficiencies and locate facilities in low cost countries in
close proximity to customers. This ongoing analysis includes a review of its manufacturing, engineering and purchasing
operations, as well as the overall global footprint for all its businesses. Because of the importance of new vehicle sales by
major automotive manufacturers to operations, the Company is affected by the general business conditions in this industry.
Future adverse developments in the automotive industry could impact the Company’s liquidity position, lead to additional
impairment charges and/or require additional restructuring of its operations.
10. Income Taxes
In calculating the provision for income taxes, the Company uses an estimate of the annual effective tax rate based upon the
facts and circumstances known at each interim period. On a quarterly basis, the actual effective tax rate is adjusted, as
appropriate, based upon changed facts and circumstances, if any, as compared to those forecasted at the beginning of the fiscal
year and each interim period thereafter. For the three months ended December 31, 2014 and 2013, the Company's effective
tax rate for continuing operations was 19%. The effective rate was lower than the U.S. federal statutory rate of 35% primarily
due to global tax planning and foreign tax rate differentials.
Valuation Allowance
The Company reviews the realizability of its deferred tax assets on a quarterly basis, or whenever events or changes in
circumstances indicate that a review is required. In determining the requirement for a valuation allowance, the historical and
projected financial results of the legal entity or consolidated group recording the net deferred tax asset are considered, along
with any other positive or negative evidence. Since future financial results may differ from previous estimates, periodic
adjustments to the Company’s valuation allowances may be necessary.
In the first quarter of fiscal 2014, the Company determined that it was more likely than not that a deferred tax asset associated
with a capital loss in Mexico would not be utilized. Therefore, the Company recorded a $21 million valuation allowance as
income tax expense.
Uncertain Tax Positions
At September 30, 2014, the Company had gross tax effected unrecognized tax benefits of $1,655 million, of which $1,505
million, if recognized, would impact the effective tax rate. Total net accrued interest at September 30, 2014 was approximately
$106 million (net of tax benefit). The net change in interest and penalties during the three months ended December 31, 2014
and 2013 was not material. The Company recognizes interest and penalties related to unrecognized tax benefits as a component
of income tax expense.
In the first quarter of fiscal 2015, the Company settled tax audits in multiple jurisdictions. The benefit of those settlements
was substantially offset by a net tax provision recorded in the quarter where it was more likely than not that the losses would
not be realized.
16
Johnson Controls, Inc.
Notes to Consolidated Financial Statements
December 31, 2014
(unaudited)
In the U.S., fiscal years 2010 through 2012 are currently under exam by the Internal Revenue Service (IRS) and 2007 through
2009 are currently under IRS appeals. Additionally, the Company is currently under exam in the following major foreign
jurisdictions:
Tax Jurisdiction
Tax Years Covered
Belgium
2012
Brazil
2004 - 2008, 2011 - 2012
Canada
2007 - 2012
France
2002 - 2013
Germany
2001 - 2012
Italy
2005 - 2009, 2011
Korea
2008 - 2012
Mexico
2003 - 2004, 2007 - 2013
Poland
2012 - 2013
Slovakia
2010 - 2013
United Kingdom
2011 - 2012
It is reasonably possible that certain tax examinations, appellate proceedings and/or tax litigation will conclude within the
next twelve months, the impact of which could be up to a $50 million benefit to tax expense.
Impacts of Tax Legislation
The "look-through rule," under subpart F of the U.S. Internal Revenue Code, expired for the Company on September 30,
2014. The "look-through rule" had provided an exception to the U.S. taxation of certain income generated by foreign
subsidiaries. The rule was extended in December 2014 retroactive to the beginning of the Company's 2015 fiscal year.
During the first quarter of fiscal 2015, other tax legislation was adopted in various jurisdictions. These law changes did not
have a material impact on the Company's consolidated financial statements.
As a result of changes to Mexican tax law in the first quarter of fiscal 2014, the Company recorded a benefit to income tax
expense of $25 million.
17
Johnson Controls, Inc.
Notes to Consolidated Financial Statements
December 31, 2014
(unaudited)
11. Pension and Postretirement Plans
The components of the Company’s net periodic benefit costs from continuing operations associated with its defined benefit
pension and postretirement plans are shown in the tables below in accordance with ASC 715, "Compensation – Retirement
Benefits" (in millions):
Pension Benefits
U.S. Plans
Three Months Ended
December 31,
2014
Service cost
$
Expected return on plan assets
Curtailment gain
Net periodic benefit cost (credit)
2013
8
Interest cost
$
Non-U.S. Plans
Three Months Ended
December 31,
$
2014
18
$
2013
9
$
10
30
34
16
18
(45)
(51)
(19)
(19)
—
—
(13)
—
(7) $
1
$
(7) $
9
Postretirement Benefits
Three Months Ended
December 31,
2014
Service cost
$
Interest cost
2013
1
$
1
2
3
Expected return on plan assets
(3)
(3)
Amortization of prior service credit
—
(2)
Net periodic benefit credit
$
—
$
(1)
The curtailment gain in the three months ended December 31, 2014 was the result of a lost contract in the Building Efficiency
Global Workplace Solutions segment.
12. Debt and Financing Arrangements
In November 2014 and December 2014, a $35 million and a $100 million committed revolving credit facility, respectively,
expired. The Company entered into a new $35 million committed revolving credit facility scheduled to expire in November
2015 and a new $100 million committed revolving credit facility scheduled to expire in December 2015. As of December 31,
2014, there were no draws on either facility. In December 2014, the Company also terminated a $50 million committed
revolving credit facility initially scheduled to mature in September 2015.
In December 2014, the Company entered into a nine-month, $500 million, floating rate term loan scheduled to mature in
September 2015. Proceeds from the term loan were used for general corporate purposes.
In December 2014, the Company entered into a nine-month, $100 million, floating rate term loan scheduled to mature in
September 2015. Proceeds from the term loan were used for general corporate purposes.
In December 2013, the Company entered into a five-year, 220 million euro, floating rate credit facility scheduled to mature
in fiscal 2019. The Company drew on the full credit facility during the quarter ended December 31, 2013. Proceeds from the
facility were used for general corporate purposes.
In December 2013, the Company entered into a nine-month, $500 million, floating rate term loan that matured in September
2014. Proceeds from the term loan were used for general corporate purposes.
18
Johnson Controls, Inc.
Notes to Consolidated Financial Statements
December 31, 2014
(unaudited)
Net Financing Charges
The Company's net financing charges line item in the consolidated statements of income for the three month periods ended
December 31, 2014 and 2013 contained the following components (in millions):
Three Months Ended
December 31,
2014
Interest expense, net of capitalized interest costs
$
2013
71
Banking fees and bond cost amortization
$
57
6
4
Interest income
(3)
(3)
Net foreign exchange results for financing activities
(3)
(3)
Net financing charges
$
71
$
55
13. Earnings Per Share
The Company presents both basic and diluted earnings per share (EPS) amounts. Basic EPS is calculated by dividing net
income attributable to Johnson Controls, Inc. by the weighted average number of common shares outstanding during the
reporting period. Diluted EPS is calculated by dividing net income attributable to Johnson Controls, Inc. by the weighted
average number of common shares and common equivalent shares outstanding during the reporting period that are calculated
using the treasury stock method for stock options and unvested restricted stock. The treasury stock method assumes that the
Company uses the proceeds from the exercise of stock option awards to repurchase common stock at the average market price
during the period. The assumed proceeds under the treasury stock method include the purchase price that the grantee will pay
in the future, compensation cost for future service that the Company has not yet recognized and any windfall tax benefits that
would be credited to capital in excess of par value when the award generates a tax deduction. If there would be a shortfall
resulting in a charge to capital in excess of par value, such an amount would be a reduction of the proceeds. For unvested
restricted stock, assumed proceeds under the treasury stock method would include unamortized compensation cost and windfall
tax benefits or shortfalls.
The following table reconciles the numerators and denominators used to calculate basic and diluted earnings per share (in
millions):
Three Months Ended
December 31,
2014
2013
Income Available to Common Shareholders
Income from continuing operations
$
Income from discontinued operations
507
$
—
Basic and diluted income available to common shareholders
$
507
451
18
$
469
Weighted Average Shares Outstanding
Basic weighted average shares outstanding
661.4
674.1
6.6
8.1
668.0
682.2
0.2
0.2
Effect of dilutive securities:
Stock options and unvested restricted stock
Diluted weighted average shares outstanding
Antidilutive Securities
Options to purchase common shares
19
Johnson Controls, Inc.
Notes to Consolidated Financial Statements
December 31, 2014
(unaudited)
During the three months ended December 31, 2014, the Company declared a dividend of $0.26 per common share, which
was paid in the month subsequent to the end of this fiscal quarter. The Company declared a dividend of $0.22 per common
share in the three months ended December 31, 2013, which was paid in the month subsequent to the end of the fiscal quarter.
14. Equity and Noncontrolling Interests
Other comprehensive income includes activity relating to discontinued operations. The following schedules present changes
in consolidated equity attributable to Johnson Controls, Inc. and noncontrolling interests (in millions, net of tax):
Three Months Ended December 31, 2014
Beginning balance, September 30
Equity
Attributable to
Johnson
Controls, Inc.
Equity
Attributable to
Noncontrolling
Interests
$
$
11,311
251
Three Months Ended December 31, 2013
Total Equity
Equity
Attributable to
Johnson
Controls, Inc.
Equity
Attributable to
Noncontrolling
Interests
Total Equity
$
$
$
$
11,562
12,314
260
12,574
Total comprehensive income:
Net income
Foreign currency translation
adjustments
507
20
527
469
22
491
(351)
—
(351)
(14)
—
(14)
Realized and unrealized losses on
derivatives
(10)
—
(10)
(1)
—
(1)
Realized and unrealized losses on
marketable common stock
—
—
—
(2)
—
(2)
Pension and postretirement plans
(3)
—
(3)
(1)
—
(1)
Other comprehensive loss
(364)
—
(364)
(18)
—
(18)
143
20
163
451
22
473
(172)
—
(172)
(147)
—
(147)
—
(21)
Comprehensive income
Other changes in equity:
Cash dividends—common stock
Dividends attributable to noncontrolling
interests
Repurchases of common stock
Other, including options exercised
Ending balance, December 31
$
—
(8)
(600)
—
(600)
141
—
141
10,823
$
263
(8)
$
11,086
(1,199)
112
$
11,531
(21)
—
(1,199)
—
$
261
112
$
11,792
In November 2013, the Company's Board of Directors authorized a $3 billion increase in the Company's share repurchase
program, which brought the total authorized amount under the repurchase program to $3.65 billion. The share repurchase
program does not have an expiration date and may be amended or terminated by the Board of Directors at any time without
prior notice. For the three month periods ended December 31, 2014 and 2013, the Company repurchased approximately $600
million and $1.2 billion of its common shares, respectively.
The Company consolidates certain subsidiaries in which the noncontrolling interest party has within its control the right to
require the Company to redeem all or a portion of its interest in the subsidiary. The redeemable noncontrolling interests are
reported at their estimated redemption value. Any adjustment to the redemption value impacts retained earnings but does not
impact net income. Redeemable noncontrolling interests which are redeemable only upon future events, the occurrence of
which is not currently probable, are recorded at carrying value.
20
Johnson Controls, Inc.
Notes to Consolidated Financial Statements
December 31, 2014
(unaudited)
The following schedules present changes in the redeemable noncontrolling interests (in millions):
Three Months Ended
December 31,
2014
2013
Beginning balance, September 30
Net income
Dividends
Ending balance, December 31
$
194 $
19
(4)
157
14
(2)
$
209
169
$
The following schedules present changes in accumulated other comprehensive income (AOCI) attributable to Johnson
Controls, Inc. (in millions, net of tax):
Three Months Ended
December 31,
2014
Foreign currency translation adjustments
Balance at beginning of period
Aggregate adjustment for the period (net of tax effect of $2 and $6)
Balance at end of period
2013
(248) $
(351)
(599)
392
(14)
Realized and unrealized gains (losses) on derivatives
Balance at beginning of period
Current period changes in fair value (net of tax effect of $(5) and $0)
Reclassification to income (net of tax effect of $0) *
Balance at end of period
4
(9)
(1)
(6)
7
—
(1)
Realized and unrealized gains (losses) on marketable common stock
Balance at beginning of period
Current period changes in fair value (net of tax effect of $0)
Reclassification to income (net of tax effect of $0) **
Balance at end of period
—
—
—
—
7
(1)
(1)
7
(3)
12
(1)
4
11
(601) $
400
$
Pension and postretirement plans
Balance at beginning of period
Reclassification to income (net of tax effect of $(1)) ***
Balance at end of period
Accumulated other comprehensive income (loss), end of period
$
378
6
5
* Refer to Note 15, "Derivative Instruments and Hedging Activities," of the notes to consolidated financial statements for
disclosure of the line items on the consolidated statements of income affected by reclassifications from AOCI into income
related to derivatives.
** Refer to Note 16, "Fair Value Measurements," of the notes to consolidated financial statements for disclosure of the line
item on the consolidated statements of income affected by reclassifications from AOCI into income related to marketable
common stock.
21
Johnson Controls, Inc.
Notes to Consolidated Financial Statements
December 31, 2014
(unaudited)
*** Refer to Note 11, "Pension and Postretirement Plans," of the notes to consolidated financial statements for disclosure of
the components of the Company's net periodic benefit costs associated with its defined benefit pension and postretirement
plans. For the three months ended December 31, 2014, the amounts reclassified from AOCI into income for pension and
postretirement plans were primarily recorded in selling, general and administrative expenses on the consolidated statement
of income. For the three months ended December 31, 2013, the amounts reclassified from AOCI into income for pension and
postretirement plans were primarily recorded in cost of sales on the consolidated statement of income.
15. Derivative Instruments and Hedging Activities
The Company selectively uses derivative instruments to reduce market risk associated with changes in foreign currency,
commodities, stock-based compensation liabilities and interest rates. Under Company policy, the use of derivatives is restricted
to those intended for hedging purposes; the use of any derivative instrument for speculative purposes is strictly prohibited. A
description of each type of derivative utilized by the Company to manage risk is included in the following paragraphs. In
addition, refer to Note 16, "Fair Value Measurements," of the notes to consolidated financial statements for information related
to the fair value measurements and valuation methods utilized by the Company for each derivative type.
The Company has global operations and participates in the foreign exchange markets to minimize its risk of loss from
fluctuations in foreign currency exchange rates. The Company primarily uses foreign currency exchange contracts to hedge
certain of its foreign exchange rate exposures. The Company hedges 70% to 90% of the nominal amount of each of its known
foreign exchange transactional exposures.
The Company has entered into cross-currency interest rate swaps to selectively hedge portions of its net investment in Japan.
The currency effects of the cross-currency interest rate swaps are reflected in the accumulated other comprehensive income
(AOCI) account within shareholders’ equity attributable to Johnson Controls, Inc. where they offset gains and losses recorded
on the Company’s net investment in Japan. At December 31, 2014, September 30, 2014 and December 31, 2013 the Company
had four cross-currency interest rate swaps outstanding totaling 20 billion yen.
The Company uses commodity contracts in the financial derivatives market in cases where commodity price risk cannot be
naturally offset or hedged through supply base fixed price contracts. Commodity risks are systematically managed pursuant
to policy guidelines. As cash flow hedges, the effective portion of the hedge gains or losses due to changes in fair value are
initially recorded as a component of AOCI and are subsequently reclassified into earnings when the hedged transactions,
typically sales or costs related to sales, occur and affect earnings. Any ineffective portion of the hedge is reflected in the
consolidated statements of income. The maturities of the commodity contracts coincide with the expected purchase of the
commodities. The Company had the following outstanding commodity hedge contracts that hedge forecasted purchases:
Commodity
Units
Copper
Pounds
Lead
Aluminum
Tin
Metric Tons
Metric Tons
Metric Tons
Volume Outstanding as of
December 31, 2014
September 30, 2014
December 31, 2013
11,070,000
9,536,000
12,070,000
10,125
890
1,485
5,200
—
2,070
7,500
1,693
1,504
The Company selectively uses equity swaps to reduce market risk associated with certain of its stock-based compensation
plans, such as its deferred compensation plans. These equity compensation liabilities increase as the Company’s stock price
increases and decrease as the Company’s stock price decreases. In contrast, the value of the swap agreement moves in the
opposite direction of these liabilities, allowing the Company to fix a portion of the liabilities at a stated amount. As of
December 31, 2014, September 30, 2014 and December 31, 2013, the Company had hedged approximately 4.1 million, 4.4
million and 4.6 million shares of its common stock, respectively.
The Company selectively uses interest rate swaps to reduce market risk associated with changes in interest rates for its fixedrate bonds. As fair value hedges, the interest rate swaps and related debt balances are valued under a market approach using
publicized swap curves. Changes in the fair value of the swap and hedged portion of the debt are recorded in the consolidated
22
Johnson Controls, Inc.
Notes to Consolidated Financial Statements
December 31, 2014
(unaudited)
statements of income. In the second quarter of fiscal 2011, the Company entered into five fixed to floating interest rate swaps
totaling $450 million to hedge the coupon of its 1.75% notes which matured on March 1, 2014. In the fourth quarter of fiscal
2013, the Company entered into one fixed to floating interest rate swap totaling approximately $125 million to hedge the
coupon of its 7.7% notes maturing March 1, 2015 and four fixed to floating interest rate swaps totaling $800 million to hedge
the coupon of its 5.5% notes maturing January 15, 2016. In the third quarter of fiscal 2014, the Company entered into four
fixed to floating interest rate swaps totaling $400 million to hedge the coupon of its 2.6% notes maturing December 1, 2016,
three fixed to floating interest rate swaps totaling $300 million to hedge the coupon of its 1.4% notes maturing November 2,
2017 and one fixed to floating interest rate swap totaling $150 million to hedge the coupon of its 7.125% coupon maturing
July 15, 2017. There were thirteen interest rate swaps outstanding as of December 31, 2014 and September 30, 2014, and ten
interest rate swaps outstanding as of December 31, 2013.
In September 2005, the Company entered into three forward treasury lock agreements to reduce the market risk associated
with changes in interest rates associated with the Company’s anticipated fixed-rate note issuance to finance the acquisition
of York International (cash flow hedge). The three forward treasury lock agreements, which had a combined notional amount
of $1.3 billion, fixed a portion of the future interest cost for 5-year, 10-year and 30-year notes. The fair value of each treasury
lock agreement, or the difference between the treasury lock reference rate and the fixed rate at time of note issuance, is
amortized to interest expense over the life of the respective note issuance. In January 2006, in connection with the Company’s
debt refinancing, the three forward treasury lock agreements were terminated.
The following table presents the location and fair values of derivative instruments and hedging activities included in the
Company’s consolidated statements of financial position (in millions):
Derivatives and Hedging Activities Designated as
Hedging Instruments under ASC 815
Derivatives and Hedging Activities Not Designated
as Hedging Instruments under ASC 815
December 31,
2014
September 30,
2014
December 31,
2013
December 31,
2014
September 30,
2014
December 31,
2013
$
$
$
$
$
Other current assets
Foreign currency exchange derivatives $
38
Commodity derivatives
—
21
—
21
5
28
—
13
—
14
—
Interest rate swaps
—
—
1
—
—
—
Cross-currency interest rate swaps
25
15
19
—
—
—
Other noncurrent assets
Interest rate swaps
Equity swap
Total assets
2
2
4
—
—
—
—
—
—
196
192
236
$
65
$
38
$
50
$
224
$
205
$
250
Foreign currency exchange derivatives $
49
$
22
$
24
$
24
$
11
$
12
Other current liabilities
Commodity derivatives
7
3
1
—
—
—
125
125
451
—
—
—
1,651
1,649
928
—
—
—
Current portion of long-term debt
Fixed rate debt swapped to floating
Long-term debt
Fixed rate debt swapped to floating
Other noncurrent liabilities
Interest rate swaps
Total liabilities
1
$
1,833
3
$
1,802
—
$
1,404
—
$
24
—
$
11
—
$
12
The Company enters into International Swaps and Derivatives Associations (ISDA) master netting agreements with
counterparties that permit the net settlement of amounts owed under the derivative contracts. The master netting agreements
generally provide for net settlement of all outstanding contracts with a counterparty in the case of an event of default or a
termination event. The Company has not elected to offset the fair value positions of the derivative contracts recorded in the
consolidated statements of financial position. Collateral is generally not required of the Company or the counterparties under
the master netting agreements. As of December 31, 2014, September 30, 2014 and December 31, 2013, no cash collateral was
received or pledged under the master netting agreements.
23
Johnson Controls, Inc.
Notes to Consolidated Financial Statements
December 31, 2014
(unaudited)
The gross and net amounts of derivative assets and liabilities were as follows (in millions):
Fair Value of Assets
Fair Value of Liabilities
September 30,
2014
December 31,
2013
December 31,
2014
September 30,
2014
December 31,
2013
$
$
$
$
$
$
Gross amount recognized
December 31,
2014
289
Gross amount eligible for offsetting
243
(21)
Net amount
$
268
300
(11)
$
232
1,857
(9)
$
291
1,813
(21)
$
1,836
1,416
(11)
$
1,802
(9)
$
1,407
The following tables present the location and amount of the effective portion of gains and losses gross of tax on derivative
instruments and related hedge items reclassified from AOCI into the Company’s consolidated statements of income for the
three months ended December 31, 2014 and 2013 and amounts recorded in AOCI net of tax in the consolidated statements of
financial position (in millions):
Amount of Gain (Loss) Reclassified from AOCI into Income
Derivatives in ASC 815 Cash Flow
Hedging Relationships
Foreign currency exchange derivatives
Cost of sales
Commodity derivatives
Cost of sales
2013
1
$
2
—
$
1
(1)
$
1
Amount of Gain (Loss) Recognized in AOCI on Derivative
Derivatives in ASC 815 Cash Flow
Hedging Relationships
December 31, 2014
$
Commodity derivatives
Forward treasury locks
Total
2014
$
Total
Foreign currency exchange derivatives
Three Months Ended December 31,
Location of Gain (Loss) Reclassified from
AOCI into Income
$
September 30, 2014
December 31, 2013
(7) $
—
(5)
(2)
6
6
(6) $
4
$
(4)
3
7
$
6
Amount of Gain (Loss) Recognized in Income on Derivative
Derivatives in ASC 815 Fair Value
Hedging Relationships
Three Months Ended December 31,
Location of Gain (Loss) Recognized in
Income on Derivative
Interest rate swaps
Net financing charges
Fixed rate debt swapped to floating
Net financing charges
2014
$
2013
2
$
—
(2)
Total
$
—
—
$
—
Amount of Gain (Loss) Recognized in Income on Derivative
Derivatives Not Designated as Hedging
Instruments under ASC 815
Three Months Ended December 31,
Location of Gain (Loss) Recognized in
Income on Derivative
Foreign currency exchange derivatives
Cost of sales
Foreign currency exchange derivatives
Net financing charges
Equity swap
Selling, general and administrative
2014
$
2013
(2) $
(2)
Total
3
19
$
15
(1)
44
$
46
The amount of gains recognized in CTA within AOCI on the effective portion of outstanding net investment hedges was $15
million, $9 million, and $11 million at December 31, 2014, September 30, 2014 and December 31, 2013, respectively. For
the three months ended December 31, 2014 and 2013, no gains or losses were reclassified from CTA into income for the
Company’s outstanding net investment hedges, and no gains or losses were recognized in income for the ineffective portion
of cash flow hedges.
24
Johnson Controls, Inc.
Notes to Consolidated Financial Statements
December 31, 2014
(unaudited)
16. Fair Value Measurements
ASC 820, "Fair Value Measurement," defines fair value as the price that would be received to sell an asset or paid to transfer
a liability in an orderly transaction between market participants at the measurement date. ASC 820 also establishes a threelevel fair value hierarchy that prioritizes information used in developing assumptions when pricing an asset or liability as
follows:
Level 1: Observable inputs such as quoted prices in active markets;
Level 2: Inputs, other than quoted prices in active markets, that are observable either directly or indirectly; and
Level 3: Unobservable inputs where there is little or no market data, which requires the reporting entity to develop its
own assumptions.
ASC 820 requires the use of observable market data, when available, in making fair value measurements. When inputs used
to measure fair value fall within different levels of the hierarchy, the level within which the fair value measurement is categorized
is based on the lowest level input that is significant to the fair value measurement.
Recurring Fair Value Measurements
The following tables present the Company’s fair value hierarchy for those assets and liabilities measured at fair value as of
December 31, 2014, September 30, 2014 and December 31, 2013 (in millions):
Fair Value Measurements Using:
Significant
Quoted Prices
Other
in Active
Observable
Total as of
Markets
Inputs
December 31, 2014
(Level 1)
(Level 2)
Other current assets
Foreign currency exchange derivatives
Cross-currency interest rate swap
Other noncurrent assets
Interest rate swaps
Investments in marketable common stock
Equity swap
Total assets
Other current liabilities
Foreign currency exchange derivatives
Commodity derivatives
Current portion of long-term debt
Fixed rate debt swapped to floating
Long-term debt
Fixed rate debt swapped to floating
Other noncurrent liabilities
Interest rate swaps
Total liabilities
$
66
25
2
4
196
293
$
$
73
7
$
25
$
$
$
—
—
—
4
196
200
—
—
$
$
$
66
25
2
—
—
93
73
7
Significant
Unobservable
Inputs
(Level 3)
$
$
$
—
—
—
—
—
—
—
—
125
—
125
—
1,651
—
1,651
—
1
1,857
—
—
1
1,857
—
—
$
$
$
Johnson Controls, Inc.
Notes to Consolidated Financial Statements
December 31, 2014
(unaudited)
Fair Value Measurements Using:
Significant
Quoted Prices
Other
in Active
Observable
Total as of
Markets
Inputs
September 30, 2014
(Level 1)
(Level 2)
Other current assets
Foreign currency exchange derivatives
Cross-currency interest rate swaps
Other noncurrent assets
Interest rate swaps
Investments in marketable common stock
Equity swap
Total assets
Other current liabilities
Foreign currency exchange derivatives
Commodity derivatives
Current portion of long-term debt
Fixed rate debt swapped to floating
Long-term debt
Fixed rate debt swapped to floating
Other noncurrent liabilities
Interest rate swaps
Total liabilities
$
34
15
2
4
192
247
$
$
33
3
$
$
—
—
—
4
192
196
—
—
$
$
$
34
15
2
—
—
51
33
3
$
1,649
—
1,649
—
36
1
$
$
$
$
451
928
1,416
$
26
—
—
—
4
25
236
325
$
$
—
—
—
—
125
35
5
1
19
$
$
—
—
—
—
—
$
3
1,813
Fair Value Measurements Using:
Significant
Quoted Prices
Other
in Active
Observable
Total as of
Markets
Inputs
December 31, 2013
(Level 1)
(Level 2)
Other current assets
Foreign currency exchange derivatives
Commodity derivatives
Interest rate swaps
Cross-currency interest rate swap
Other noncurrent assets
Interest rate swaps
Investments in marketable common stock
Equity swap
Total assets
Other current liabilities
Foreign currency exchange derivatives
Commodity derivatives
Current portion of long-term debt
Fixed rate debt swapped to floating
Long-term debt
Fixed rate debt swapped to floating
Total liabilities
$
125
3
1,813
$
$
Significant
Unobservable
Inputs
(Level 3)
—
—
—
—
—
25
236
261
—
—
$
$
$
—
$
—
—
35
5
1
19
4
—
—
64
36
1
$
Significant
Unobservable
Inputs
(Level 3)
$
$
$
451
$
928
1,416
—
—
—
—
—
—
—
—
—
—
—
—
—
$
—
—
Johnson Controls, Inc.
Notes to Consolidated Financial Statements
December 31, 2014
(unaudited)
Valuation Methods
Foreign currency exchange derivatives – The Company selectively hedges anticipated transactions that are subject to foreign
exchange rate risk primarily using foreign currency exchange hedge contracts. The foreign currency exchange derivatives are
valued under a market approach using publicized spot and forward prices. As cash flow hedges under ASC 815, "Derivatives
and Hedging," the effective portion of the hedge gains or losses due to changes in fair value are initially recorded as a component
of accumulated other comprehensive income and are subsequently reclassified into earnings when the hedged transactions
occur and affect earnings. Any ineffective portion of the hedge is reflected in the consolidated statements of income. These
contracts were highly effective in hedging the variability in future cash flows attributable to changes in currency exchange
rates at December 31, 2014, September 30, 2014 and December 31, 2013. The fair value of foreign currency exchange
derivatives not designated as hedging instruments under ASC 815 are recorded in the consolidated statements of income.
Commodity derivatives – The Company selectively hedges anticipated transactions that are subject to commodity price risk,
primarily using commodity hedge contracts, to minimize overall price risk associated with the Company’s purchases of lead,
copper, tin and aluminum. The commodity derivatives are valued under a market approach using publicized prices, where
available, or dealer quotes. As cash flow hedges, the effective portion of the hedge gains or losses due to changes in fair value
are initially recorded as a component of accumulated other comprehensive income and are subsequently reclassified into
earnings when the hedged transactions, typically sales or cost related to sales, occur and affect earnings. Any ineffective
portion of the hedge is reflected in the consolidated statements of income. These contracts were highly effective in hedging
the variability in future cash flows attributable to changes in commodity prices at December 31, 2014, September 30, 2014
and December 31, 2013.
Interest rate swaps and related debt – The Company selectively uses interest rate swaps to reduce market risk associated with
changes in interest rates for its fixed-rate bonds. As fair value hedges, the interest rate swaps and related debt balances are
valued under a market approach using publicized swap curves. Changes in the fair value of the swap and hedged portion of
the debt are recorded in the consolidated statements of income. In the second quarter of fiscal 2011, the Company entered
into five fixed to floating interest rate swaps totaling $450 million to hedge the coupon of its 1.75% notes which matured on
March 2014. In the fourth quarter of fiscal 2013, the Company entered into one fixed to floating interest rate swap totaling
approximately $125 million to hedge the coupon of its 7.7% notes maturing March 2015 and four fixed to floating interest
rate swaps totaling $800 million to hedge the coupon of its 5.5% notes maturing January 2016. In the third quarter of fiscal
2014, the Company entered into four fixed to floating interest rate swaps totaling $400 million to hedge the coupon of its
2.6% notes maturing December 2016, three fixed to floating interest rate swaps totaling $300 million to hedge the coupon of
its 1.4% notes maturing November 2017 and one fixed to floating interest rate swap totaling $150 million to hedge the coupon
of its 7.125% coupon maturing July 2017. There were thirteen interest rate swaps outstanding as of December 31, 2014 and
September 30, 2014, and ten interest rate swaps outstanding as of December 31, 2013.
Cross-currency interest rate swaps – The Company selectively uses cross-currency interest rate swaps to hedge the foreign
currency rate risk associated with certain of its investments in Japan. The cross-currency interest rate swaps are valued using
observable market data. Changes in the market value of the swaps are reflected in the foreign currency translation adjustments
component of accumulated other comprehensive income where they offset gains and losses recorded on the Company’s net
investment in Japan. At December 31, 2014, September 30, 2014 and December 31, 2013, the Company had four crosscurrency interest rate swaps outstanding totaling 20 billion yen.
Investments in marketable common stock – The Company invests in certain marketable common stock, which is valued under
a market approach using publicized share prices. There were no unrealized gains recorded in accumulated other comprehensive
income on these investments as of December 31, 2014 and September 30, 2014. As of December 31, 2013, the Company
recorded unrealized gains of $5 million in accumulated other comprehensive income. There were no unrealized losses recorded
in accumulated other comprehensive income on these investments as of December 31, 2014, September 30, 2014 and
December 31, 2013. During the quarter ended December 31, 2013, the Company sold certain marketable common stock for
approximately $3 million. As a result, the Company recorded a $1 million realized gain within selling, general and
administrative expenses in the Automotive Experience Seating segment.
Equity swaps – The Company selectively uses equity swaps to reduce market risk associated with certain of its stock-based
compensation plans, such as its deferred compensation plans. The equity swaps are valued under a market approach as the
27
Johnson Controls, Inc.
Notes to Consolidated Financial Statements
December 31, 2014
(unaudited)
fair value of the swaps is equal to the Company’s stock price at the reporting period date. Changes in fair value on the equity
swaps are reflected in the consolidated statements of income within selling, general and administrative expenses.
The fair values of cash and cash equivalents, accounts receivable, short-term debt and accounts payable approximate their
carrying values. The fair value of long-term debt, which was $6.9 billion, $6.8 billion and $6.0 billion at December 31,
2014, September 30, 2014 and December 31, 2013, respectively, was determined primarily using market quotes classified as
Level 1 inputs within the ASC 820 fair value hierarchy.
17. Segment Information
At March 31, 2014, the Company determined that its previously reported Automotive Experience Electronics segment met
the criteria to be classified as a discontinued operation, which required retrospective application to financial information for
all periods presented. Refer to Note 4, "Discontinued Operations," of the notes to consolidated financial statements for further
information regarding the Company's discontinued operations.
ASC 280, "Segment Reporting," establishes the standards for reporting information about segments in financial statements.
In applying the criteria set forth in ASC 280, the Company has determined that it has seven reportable segments for financial
reporting purposes. The Company’s seven reportable segments are presented in the context of its three primary businesses –
Building Efficiency, Automotive Experience and Power Solutions.
Building Efficiency
Building Efficiency designs, produces, markets and installs heating, ventilating and air conditioning (HVAC) and control
systems that monitor, automate and integrate critical building segment equipment and conditions including HVAC, fire-safety
and security in commercial buildings and in various industrial applications.
•
North America Systems and Service provides HVAC and controls systems, energy efficient solutions and technical
services, including inspection, scheduled maintenance, and repair and replacement of mechanical and control
systems to non-residential buildings and industrial applications in the North American marketplace.
•
Global Workplace Solutions provides on-site staff for complete real estate services, facility operation and
management to improve the comfort, productivity, energy efficiency and cost effectiveness of building systems
around the globe.
•
Asia provides HVAC and refrigeration systems and technical services to the Asian marketplace.
•
Other provides HVAC and refrigeration systems and technical services to markets in Europe, the Middle East and
Latin America. Other also designs and produces heating and air conditioning solutions for residential and light
commercial applications, and markets products to the replacement and new construction markets.
Automotive Experience
Automotive Experience designs and manufactures interior systems and products for passenger cars and light trucks, including
vans, pick-up trucks and sport utility/crossover vehicles.
•
Seating produces automotive seat metal structures and mechanisms, foam, trim, fabric and complete seat systems.
•
Interiors produces instrument panels, floor consoles and door panels.
Power Solutions
Power Solutions services both automotive original equipment manufacturers and the battery aftermarket by providing advanced
battery technology, coupled with systems engineering, marketing and service expertise.
28
Johnson Controls, Inc.
Notes to Consolidated Financial Statements
December 31, 2014
(unaudited)
Management evaluates the performance of the segments based primarily on segment income, which represents income from
continuing operations before income taxes and noncontrolling interests excluding net financing charges, significant
restructuring and impairment costs, and net mark-to-market adjustments on pension and postretirement plans. General
corporate and other overhead expenses are allocated to business segments in determining segment income. As mentioned
above, the previously reported Automotive Experience Electronics segment met the criteria to be classified as a discontinued
operation, and general corporate overhead was not allocated to discontinued operations. The Company reported discontinued
operations through retrospective application to all periods presented, resulting in general corporate allocation changes between
the segments in the prior periods. Financial information relating to the Company’s reportable segments is as follows (in
millions):
Net Sales
Three Months Ended
December 31,
2014
2013
Building Efficiency
North America Systems and Service
$
1,017
Global Workplace Solutions
Asia
Other
$
991
1,042
1,077
494
510
986
803
3,539
3,381
Seating
4,135
4,279
Interiors
1,148
1,142
5,283
5,421
1,844
1,772
Automotive Experience
Power Solutions
Total net sales
$
10,666
$
10,574
Segment Income (Loss)
Three Months Ended
December 31,
2014
2013
Building Efficiency
North America Systems and Service
$
81
$
67
Global Workplace Solutions
26
Asia
71
76
Other
9
(15)
18
187
146
Seating
208
175
Interiors
35
22
243
197
318
307
Automotive Experience
Power Solutions
Total segment income
$
Net financing charges
748
$
(71)
Income from continuing operations before income taxes
$
29
677
650
(55)
$
595
Johnson Controls, Inc.
Notes to Consolidated Financial Statements
December 31, 2014
(unaudited)
18. Commitments and Contingencies
The Company accrues for potential environmental liabilities when it is probable a liability has been incurred and the amount
of the liability is reasonably estimable. Reserves for environmental liabilities totaled $23 million, $24 million and $24 million
at December 31, 2014, September 30, 2014 and December 31, 2013, respectively. The Company reviews the status of its
environmental sites on a quarterly basis and adjusts its reserves accordingly. Such potential liabilities accrued by the Company
do not take into consideration possible recoveries of future insurance proceeds. They do, however, take into account the likely
share other parties will bear at remediation sites. It is difficult to estimate the Company’s ultimate level of liability at many
remediation sites due to the large number of other parties that may be involved, the complexity of determining the relative
liability among those parties, the uncertainty as to the nature and scope of the investigations and remediation to be conducted,
the uncertainty in the application of law and risk assessment, the various choices and costs associated with diverse technologies
that may be used in corrective actions at the sites, and the often quite lengthy periods over which eventual remediation may
occur. Nevertheless, the Company does not currently believe that any claims, penalties or costs in connection with known
environmental matters will have a material adverse effect on the Company’s financial position, results of operations or cash
flows. In addition, the Company has identified asset retirement obligations for environmental matters that are expected to be
addressed at the retirement, disposal, removal or abandonment of existing owned facilities, primarily in the Power Solutions
business. At December 31, 2014, September 30, 2014 and December 31, 2013, the Company recorded conditional asset
retirement obligations of $53 million, $52 million and $59 million, respectively.
The Company is involved in a number of product liability and various other casualty lawsuits incident to the operation of its
businesses. The Company maintains insurance coverages and records estimated costs for claims and suits of this nature. It is
management’s opinion that none of these will have a material adverse effect on the Company’s financial position, results of
operations or cash flows. Costs related to such matters were not material to the periods presented.
30
Report of Independent Registered Public Accounting Firm
To the Board of Directors and Shareholders
of Johnson Controls, Inc.
We have reviewed the accompanying consolidated statements of financial position of Johnson Controls, Inc. and its subsidiaries
as of December 31, 2014 and 2013, and the related consolidated statements of income, of comprehensive income (loss), and of
cash flows for the three-month periods ended December 31, 2014 and 2013. These interim financial statements are the responsibility
of the Company’s management.
We conducted our review in accordance with the standards of the Public Company Accounting Oversight Board (United States).
A review of interim financial information consists principally of applying analytical procedures and making inquiries of persons
responsible for financial and accounting matters. It is substantially less in scope than an audit conducted in accordance with the
standards of the Public Company Accounting Oversight Board (United States), the objective of which is the expression of an
opinion regarding the financial statements taken as a whole. Accordingly, we do not express such an opinion.
Based on our review, we are not aware of any material modifications that should be made to the accompanying consolidated interim
financial statements for them to be in conformity with accounting principles generally accepted in the United States of America.
We previously audited, in accordance with the standards of the Public Company Accounting Oversight Board (United States), the
consolidated statement of financial position as of September 30, 2014 and the related consolidated statements of income, of
shareholders’ equity, of comprehensive income (loss), and of cash flows for the year then ended (not presented herein), and in our
report dated November 19, 2014 (which included an explanatory paragraph with respect to the exclusion of Air Distribution
Technologies, Inc. in the assessment of internal controls over financial reporting), we expressed an unqualified opinion on those
consolidated financial statements. In our opinion, the information set forth in the accompanying consolidated statement of financial
position as of September 30, 2014, is fairly stated in all material respects in relation to the consolidated statement of financial
position from which it has been derived.
/s/ PricewaterhouseCoopers LLP
PricewaterhouseCoopers LLP
Milwaukee, Wisconsin
January 30, 2015
PricewaterhouseCoopers LLP, 100 East Wisconsin Avenue, Milwaukee, WI 53202
T: (414)212- 1600, F: (414) 212- 1880, www.pwc.com/us
31
ITEM 2. MANAGEMENT’S DISCUSSION AND ANALYSIS OF FINANCIAL CONDITION AND RESULTS OF
OPERATIONS
Cautionary Statements for Forward-Looking Information
Unless otherwise indicated, references to “Johnson Controls," the "Company," "we," "our" and "us" in this Quarterly Report on
Form 10-Q refer to Johnson Controls, Inc. and its consolidated subsidiaries.
The Company has made statements in this document that are forward-looking and, therefore, are subject to risks and uncertainties.
All statements in this document other than statements of historical fact are statements that are, or could be, deemed "forwardlooking statements" within the meaning of the Private Securities Litigation Reform Act of 1995. In this document, statements
regarding future financial position, sales, costs, earnings, cash flows, other measures of results of operations, capital expenditures
or debt levels and plans, objectives, outlook, targets, guidance or goals are forward-looking statements. Words such as "may,"
"will," "expect," "intend," "estimate," "anticipate," "believe," "should," "forecast," "project" or "plan" or terms of similar meaning
are also generally intended to identify forward-looking statements. Johnson Controls cautions that these statements are subject to
numerous important risks, uncertainties, assumptions and other factors, some of which are beyond Johnson Controls' control, that
could cause Johnson Controls' actual results to differ materially from those expressed or implied by such forward-looking
statements. These factors include required regulatory approvals that are material conditions for proposed transactions to close, the
strength of the U.S. or other economies, automotive vehicle production levels, mix and schedules, energy and commodity prices,
availability of raw materials and component products, currency exchange rates, and cancellation of or changes to commercial
contracts, as well as other factors discussed in Item 1A of Part I of Johnson Controls' most recent Annual Report on Form 10-K
for the year ended September 30, 2014. Shareholders, potential investors and others should consider these factors in evaluating
the forward-looking statements and should not place undue reliance on such statements. The forward-looking statements included
in this document are only made as of the date of this document, and Johnson Controls assumes no obligation, and disclaims any
obligation, to update forward-looking statements to reflect events or circumstances occurring after the date of this document.
Overview
Johnson Controls is a global diversified technology and industrial leader serving customers in more than 150 countries. The
Company creates quality products, services and solutions to optimize energy and operational efficiencies of buildings; lead-acid
automotive batteries and advanced batteries for hybrid and electric vehicles; and seating and interior systems for automobiles.
Johnson Controls was originally incorporated in the state of Wisconsin in 1885 as Johnson Electric Service Company to manufacture,
install and service automatic temperature regulation systems for buildings. The Company was renamed to Johnson Controls, Inc.
in 1974. In 1978, the Company acquired Globe-Union, Inc., a Wisconsin-based manufacturer of automotive batteries for both the
replacement and original equipment markets. The Company entered the automotive seating industry in 1985 with the acquisition
of Michigan-based Hoover Universal, Inc. In 2005, the Company acquired York International, a global supplier of heating,
ventilating, air-conditioning and refrigeration equipment and services. In 2014, the Company acquired Air Distribution
Technologies, Inc. (ADT), one of the largest independent providers of air distribution and ventilation products in North America.
The Building Efficiency business is a global market leader in designing, producing, marketing and installing integrated heating,
ventilating and air conditioning (HVAC) systems, building management systems, controls, security and mechanical equipment.
In addition, the Building Efficiency business provides technical services, energy management consulting and operations of entire
real estate portfolios for the non-residential buildings market. The Company also provides residential air conditioning and heating
systems and industrial refrigeration products.
The Automotive Experience business is one of the world’s largest automotive suppliers, providing innovative seating and interior
systems through our design and engineering expertise. The Company’s technologies extend into virtually every area of the interior
including seating, door systems, floor consoles, instrument panels and cockpits. Customers include most of the world’s major
automakers.
The Power Solutions business is a leading global supplier of lead-acid automotive batteries for virtually every type of passenger
car, light truck and utility vehicle. The Company serves both automotive original equipment manufacturers (OEMs) and the general
vehicle battery aftermarket. The Company also supplies advanced battery technologies to power Start-Stop, hybrid and electric
vehicles.
32
The following information should be read in conjunction with the September 30, 2014 consolidated financial statements and notes
thereto, along with management’s discussion and analysis of financial condition and results of operations included in our Annual
Report on Form 10-K for the year ended September 30, 2014. References in the following discussion and analysis to "Three
Months" refer to the three months ended December 31, 2014 compared to the three months ended December 31, 2013.
Certain amounts for the three months ended December 31, 2013 have been revised to conform to the current year’s presentation.
At March 31, 2014, the Company determined that its Automotive Experience Electronics segment met the criteria to be classified
as a discontinued operation, which required retrospective application to financial information for all periods presented. Refer to
Note 4, "Discontinued Operations," of the notes to consolidated financial statements for further information regarding the
Company's discontinued operations.
Outlook
On January 22, 2015, the Company announced that it expects fiscal 2015 second quarter earnings, excluding transaction and
integration related costs, to be $0.74 - $0.76 per diluted share. The Company also reaffirmed its full fiscal 2015 guidance of $3.55
- $3.70 per diluted share, excluding transaction and integration related costs.
In May 2014, the Company announced the signing of an agreement to form a global automotive interiors joint venture with Yanfeng
Automotive Trim Systems. The formation of the joint venture is expected to close in the fourth quarter of fiscal 2015, pending
regulatory approvals.
In January 2015, the Company signed a definitive agreement to create a joint venture with Hitachi to expand its Building Efficiency
product offerings. The formation of the joint venture is expected to close in the fourth quarter of fiscal 2015, pending regulatory
approvals.
In January 2015, the Company signed an agreement to sell its interests in the Brookfield Johnson Controls joint ventures in Australia
and Canada to Brookfield Asset Management. Estimated sales proceeds are $200 million and the transaction is expected to close
in the second quarter of fiscal 2015, pending regulatory approvals.
Liquidity and Capital Resources
The Company believes its capital resources and liquidity position at December 31, 2014 are adequate to meet projected needs.
The Company believes requirements for working capital, capital expenditures, dividends, share repurchases, minimum pension
contributions, debt maturities and any potential acquisitions during the remainder of fiscal 2015 will be funded from operations,
supplemented by short- and long-term borrowings, if required. The Company currently manages its short-term debt position in
the U.S. and euro commercial paper markets and bank loan markets. The Company continues to adjust its commercial paper
maturities and issuance levels given market reactions to industry events and changes in the Company’s credit rating. In the event
the Company is unable to issue commercial paper, it would have the ability to draw on its $2.5 billion revolving credit facility,
which matures in August 2018. There were no draws on the revolving credit facility as of December 31, 2014. As such, the Company
believes it has sufficient financial resources to fund operations and meet its obligations for the foreseeable future.
The Company’s debt financial covenants require a minimum consolidated shareholders’ equity attributable to Johnson Controls,
Inc. of at least $3.5 billion at all times and allow a maximum aggregated amount of 10% of consolidated shareholders’ equity
attributable to Johnson Controls, Inc. for liens and pledges. For purposes of calculating the Company’s covenants, consolidated
shareholders’ equity attributable to Johnson Controls, Inc. is calculated without giving effect to (i) the application of Accounting
Standards Codification (ASC) 715-60, "Defined Benefit Plans - Other Postretirement," or (ii) the cumulative foreign currency
translation adjustment. As of December 31, 2014, consolidated shareholders’ equity attributable to Johnson Controls, Inc. as defined
in the Company’s debt financial covenants was $11.4 billion and there was a maximum of $267 million of liens outstanding. The
Company expects to remain in compliance with all covenants and other requirements set forth in its credit agreements and indentures
for the foreseeable future. None of the Company’s debt agreements limit access to stated borrowing levels or require accelerated
repayment in the event of a decrease in the Company’s credit rating.
The key financial assumptions used in calculating the Company’s pension liability are determined annually, or whenever plan
assets and liabilities are re-measured as required under accounting principles generally accepted in the U.S., including the expected
rate of return on its plan assets. In fiscal 2015, the Company believes the long-term rate of return will approximate 7.50%, 4.40%
and 5.75% for U.S. pension, non-U.S. pension and postretirement plans, respectively. During the first three months of fiscal 2015,
the Company made approximately $24 million in total pension contributions. In total, the Company expects to contribute
33
approximately $64 million in cash to its defined benefit pension plans in fiscal 2015. The Company does not expect to make any
significant contributions to its postretirement plans in fiscal 2015.
Net Sales
Three Months Ended
December 31,
(in millions)
2014
Net sales
$
2013
10,666
$
Change
10,574
1%
The increase in consolidated net sales for the three months ended December 31, 2014 was due to higher sales in the Building
Efficiency business ($281 million), Power Solutions business ($142 million) and Automotive Experience business ($102 million),
partially offset by the unfavorable impact of foreign currency translation ($433 million). Excluding the unfavorable impact of
foreign currency translation, consolidated net sales increased 5% as compared to the prior year. The favorable impacts of higher
Automotive Experience volumes globally, incremental sales related to the prior year acquisition of ADT in the Building Efficiency
business and higher global battery shipments were partially offset by lower volumes related to prior year business divestitures in
Automotive Experience Interiors. Refer to the segment analysis below within Item 2 for a discussion of net sales by segment.
Cost of Sales / Gross Profit
Three Months Ended
December 31,
(in millions)
2014
Cost of sales
$
2013
8,986
Gross profit
$
1,680
% of sales
15.8%
Change
8,998
0%
1,576
7%
14.9%
Cost of sales decreased slightly as compared to the three month period ended December 31, 2013, while gross profit as a percentage
of sales increased by 90 basis points. Gross profit in the Automotive Experience business was favorably impacted by higher
volumes globally, favorable commercial settlements and lower purchasing costs, partially offset by higher operating costs. Gross
profit in the Building Efficiency business was favorably impacted by favorable margin rates and incremental operating income
related to the ADT acquisition. Gross profit in the Power Solutions business was favorably impacted by higher volumes and lower
operating costs, partially offset by unfavorable product mix including lead acquisition costs. Foreign currency translation had a
favorable impact on cost of sales of approximately $393 million. Refer to the segment analysis below within Item 2 for a discussion
of segment income by segment.
Selling, General and Administrative Expenses
Three Months Ended
December 31,
(in millions)
2014
Selling, general and administrative expenses
% of sales
$
2013
1,034
9.7%
$
Change
1,038
0%
9.8%
Selling, general and administrative expenses (SG&A) decreased slightly as compared to the three month period ended December
31, 2013, while SG&A as a percentage of sales decreased 10 basis points over the same period. The Building Efficiency business
SG&A decreased primarily due to a pension curtailment gain resulting from a lost Global Workplace Solutions contract and lower
employee related costs, partially offset by transaction and integration costs. The Power Solutions business SG&A decreased
primarily due to cost reduction initiatives. The Automotive Experience business SG&A increased primarily due to a prior year
gain on divestiture in the Automotive Experience Interiors segment and transaction costs. Foreign currency translation had a
favorable impact on SG&A of $25 million. Refer to the segment analysis below within Item 2 for a discussion of segment income
by segment.
34
Net Financing Charges
Three Months Ended
December 31,
(in millions)
2014
Net financing charges
$
2013
71
$
Change
55
29%
Net financing charges were higher for the three month period ended December 31, 2014 primarily due to higher average borrowing
levels.
Equity Income
Three Months Ended
December 31,
(in millions)
2014
Equity income
$
2013
102
$
Change
112
-9%
The decrease in equity income for the three months ended December 31, 2014 was primarily due to a prior year gain on acquisition
of a partially-owned affiliate in the Power Solutions business ($19 million), and lower income at certain Power Solutions and
Building Efficiency partially-owned affiliates, partially offset by higher income at certain Automotive Experience partially-owned
affiliates. Refer to the segment analysis below within Item 2 for a discussion of segment income by segment.
Income Tax Provision
Three Months Ended
December 31,
(in millions)
2014
Income tax provision
$
Effective tax rate
2013
131
19%
$
Change
111
18%
19%
In calculating the provision for income taxes, the Company uses an estimate of the annual effective tax rate based upon the facts
and circumstances known at each interim period. On a quarterly basis, the annual effective tax rate is adjusted, as appropriate,
based upon changed facts and circumstances, if any, as compared to those forecasted at the beginning of the fiscal year and each
interim period thereafter.
For the three months ended December 31, 2014 and 2013, the Company's effective tax rate was 19%. The effective rate was lower
than the U.S. federal statutory rate of 35% primarily due to global tax planning and foreign tax rate differentials.
In the first quarter of fiscal 2015, the Company settled tax audits in multiple jurisdictions. The benefit of those settlements was
substantially offset by a net tax provision recorded in the quarter where it was more likely than not that the losses would not be
realized.
In the first quarter of fiscal 2014, the Company determined that it was more likely than not that a deferred tax asset associated
with a capital loss in Mexico would not be utilized. Therefore, the Company recorded a $21 million valuation allowance as income
tax expense.
As a result of changes to Mexican tax law in the first quarter of fiscal 2014, the Company recorded a benefit to income tax expense
of $25 million.
35
Income From Discontinued Operations, Net of Tax
Three Months Ended
December 31,
(in millions)
2014
Income from discontinued operations, net of tax
2013
$
—
$
Change
18
*
* Measure not meaningful
Refer to Note 4, "Discontinued Operations," of the notes to consolidated financial statements for further information regarding
the Company's discontinued operations.
Income from Continuing Operations Attributable to Noncontrolling Interests
Three Months Ended
December 31,
(in millions)
2014
Income from continuing operations attributable to noncontrolling
interests
$
2013
39
$
Change
33
18%
The increase in income from continuing operations attributable to noncontrolling interests for the three months ended December
31, 2014 was primarily due to higher income at certain Power Solutions partially-owned affiliates.
Net Income Attributable to Johnson Controls, Inc.
Three Months Ended
December 31,
(in millions)
2014
Net income attributable to Johnson Controls, Inc.
$
2013
507
$
Change
469
8%
The increase in net income attributable to Johnson Controls, Inc. for the three months ended December 31, 2014 was primarily
due to higher gross profit, partially offset by an increase in net financing charges, a decrease in equity income, an increase in the
income tax provision and unfavorable impact of foreign currency translation. Diluted earnings per share attributable to Johnson
Controls, Inc. for the three months ended December 31, 2014 was $0.76 compared to $0.69 for the three months ended December 31,
2013.
36
Segment Analysis
Management evaluates the performance of its business units based primarily on segment income, which is defined as income from
continuing operations before income taxes and noncontrolling interests excluding net financing charges, significant restructuring
and impairment costs, and net mark-to-market adjustments on pension and postretirement plans.
Building Efficiency
Net Sales
Three Months Ended
December 31,
(in millions)
North America Systems and Service
2014
$
Global Workplace Solutions
Asia
Other
2013
1,017
$
Change
991
2014
3% $
2013
81
$
Change
67
21%
1,042
1,077
-3%
26
18
44%
494
510
-3%
71
76
-7%
803
23%
986
$
Segment Income (Loss)
Three Months Ended
December 31,
3,539
$
3,381
5% $
9
187
(15)
$
146
*
28%
* Measure not meaningful
Net Sales:
•
The increase in North America Systems and Service was due to higher volumes of equipment, controls systems and service
($33 million), partially offset by the unfavorable impact of foreign currency translation ($7 million).
•
The decrease in Global Workplace Solutions was due to the unfavorable impact of foreign currency translation ($57 million),
partially offset by an increase in services to new and existing customers ($22 million).
•
The decrease in Asia was due to the unfavorable impact of foreign currency translation ($19 million), partially offset by
higher volumes of controls systems and service ($3 million).
•
The increase in Other was due to incremental sales related to the ADT acquisition ($223 million), and higher volumes in
Europe ($15 million) and unitary products ($9 million), partially offset by the unfavorable impact of foreign currency
translation ($40 million) and lower volumes in Latin America ($24 million).
Segment Income:
•
The increase in North America Systems and Service was due to higher volumes ($9 million), net unfavorable prior year
contract related charges ($9 million), and lower selling, general and administrative expenses ($4 million), partially offset
by unfavorable margin rates ($4 million), current year transaction and integration costs ($3 million), and the unfavorable
impact of foreign currency translation ($1 million).
•
The increase in Global Workplace Solutions was due to a current year pension curtailment gain ($13 million), favorable
margin rates ($3 million) and higher volumes ($2 million), partially offset by current year transaction and integration costs
($7 million), and the unfavorable impact of foreign currency translation ($3 million).
•
The decrease in Asia was due to higher selling, general and administrative expenses ($8 million), the unfavorable impact
of foreign currency translation ($3 million), and current year transaction and integration costs ($1 million), partially offset
by favorable margin rates ($6 million) and higher volumes ($1 million).
•
The increase in Other was due to incremental operating income related to a business acquisition ($17 million), lower selling,
general and administrative expenses ($8 million), and favorable margin rates ($7 million), partially offset by lower equity
income ($3 million), current year transaction and integration costs ($3 million), and the unfavorable impact of foreign
currency translation ($2 million).
37
Automotive Experience
Net Sales
Three Months Ended
December 31,
(in millions)
Seating
2014
$
Interiors
4,135
2013
$
1,148
$
5,283
Segment Income
Three Months Ended
December 31,
Change
4,279
-3% $
1,142
$
2014
208
1%
5,421
2013
$
35
-3% $
243
$
Change
175
19%
22
59%
197
23%
Net Sales:
•
The decrease in Seating was due to the unfavorable impact of foreign currency translation ($202 million), partially offset
by higher volumes ($31 million), and favorable pricing and commercial settlements ($27 million).
•
The increase in Interiors was due to higher volumes ($182 million) and incremental sales related to a business acquisition
($9 million), partially offset by lower volumes related to a business divestiture ($93 million), unfavorable sales mix ($54
million) and the unfavorable impact of foreign currency translation ($38 million).
Segment Income:
•
The increase in Seating was due to net favorable pricing and commercial settlements ($18 million), higher equity income
($15 million), lower purchasing costs ($9 million), lower engineering expenses ($7 million), higher volumes ($4 million)
and the favorable impact of foreign currency translation ($1 million), partially offset by higher operating costs ($21 million).
•
The increase in Interiors was due to higher volumes ($30 million), lower operating costs ($14 million), lower purchasing
costs ($3 million), higher equity income ($2 million) and the favorable impact of foreign currency translation ($1 million),
partially offset by unfavorable mix ($20 million), a prior year gain on a business divestiture ($9 million), current year
transaction costs ($6 million), and net unfavorable pricing and commercial settlements ($2 million).
Power Solutions
Three Months Ended
December 31,
(in millions)
2014
Net sales
$
Segment income
2013
1,844
318
$
Change
1,772
4%
307
4%
•
Net sales increased due to higher sales volumes ($86 million), favorable pricing and product mix ($47 million), and the
impact of higher lead costs on pricing ($9 million), partially offset by the unfavorable impact of foreign currency translation
($70 million).
•
Segment income increased due to higher volumes ($29 million), lower operating costs ($11 million), and lower selling,
general and administrative expenses ($7 million), partially offset by a prior year gain on acquisition of a partially-owned
affiliate ($19 million), the unfavorable impact of foreign currency translation ($8 million), unfavorable product mix including
lead acquisition costs ($5 million) and lower equity income ($4 million).
Backlog
Building Efficiency’s backlog relates to its control systems and service activity. At December 31, 2014, the unearned backlog was
$4.6 billion, or a 7% decrease compared to December 31, 2013. The Other, North America Systems and Service, and Asia segment
backlogs decreased compared to prior year levels.
38
Financial Condition
Working Capital
(in millions)
Current assets
December 31,
2014
$
Current liabilities
September 30,
2014
12,381
$
(11,387)
1,413
(168)
Add: Short-term debt
Add: Current portion of long-term debt
Less: Assets held for sale
Add: Liabilities held for sale
13,107
December 31,
2013
$
(11,694)
994
Less: Cash
Change
Change
12,726
(11,803)
-30%
923
(409)
(245)
1,075
183
986
139
140
818
(2,112)
(2,157)
(777)
1,706
1,801
321
8%
Working capital (as defined)
$
1,634
$
971
68% $
2,026
-19%
Accounts receivable
$
5,360
$
5,871
-9% $
6,743
-21%
Inventories
2,439
2,477
-2%
2,452
-1%
Accounts payable
4,584
5,270
-13%
5,592
-18%
•
The Company defines working capital as current assets less current liabilities, excluding cash, short-term debt, the current
portion of long-term debt, and the current portion of assets and liabilities held for sale. Management believes that this measure
of working capital, which excludes financing-related items, provides a more useful measurement of the Company’s operating
performance.
•
The increase in working capital at December 31, 2014 as compared to September 30, 2014 was primarily due to a decrease
in accounts payable due to timing of supplier payments, lower accrued compensation and benefits primarily due to timing of
incentive compensation payments and lower accrued income taxes due to timing of tax payments, partially offset by lower
accounts receivable due to timing of customer receipts. Compared to December 31, 2013, excluding the impact of amounts
classified as held for sale, the decrease was primarily due to lower accounts receivable due to timing of customer receipts and
an increase in accounts payable primarily due to timing of supplier payments, partially offset by higher inventory to support
higher sales levels.
•
The Company’s days sales in accounts receivable at December 31, 2014 were 58, higher than 54 at the comparable periods
ended September 30, 2014 and December 31, 2013. There have been no significant adverse changes in the level of overdue
receivables or changes in revenue recognition methods.
•
The Company’s inventory turns for the three months ended December 31, 2014 were lower than the comparable period ended
September 30, 2014 primarily due to higher inventory production. Inventory turns were lower than December 31, 2013
primarily due to higher inventory production to meet higher sales levels.
•
Days in accounts payable at December 31, 2014 were 70 days, lower than 74 and higher than 68 at the comparable periods
ended September 30, 2014 and December 31, 2013, respectively.
39
Cash Flows
Three Months Ended
December 31,
(in millions)
2014
Cash used by operating activities
$
Cash used by investing activities
Cash provided (used) by financing activities
Capital expenditures
2013
(160) $
(281)
(254)
(431)
229
(78)
(262)
(345)
•
The decrease in cash used by operating activities for the three months ended December 31, 2014 was primarily due to favorable
changes in accounts payable and accrued liabilities, inventories and income tax payments, partially offset by unfavorable
changes in accounts receivable and other assets.
•
The decrease in cash used by investing activities for the three months ended December 31, 2014 was primarily due to cash
paid for business acquisitions in the prior year and lower capital expenditures in the current year.
•
The increase in cash provided by financing activities for the three months ended December 31, 2014 was primarily due to
higher stock repurchases in the prior year, partially offset by the prior year increase in long-term debt.
•
The decrease in capital expenditures for the three months ended December 31, 2014 primary relates to prior year capacity
increases and vertical integration efforts in the Power Solutions business.
Deferred Taxes
The Company reviews the realizability of its deferred tax assets on a quarterly basis, or whenever events or changes in circumstances
indicate that a review is required. In determining the requirement for a valuation allowance, the historical and projected financial
results of the legal entity or consolidated group recording the net deferred tax asset are considered, along with any other positive
or negative evidence. Since future financial results may differ from previous estimates, periodic adjustments to the Company’s
valuation allowances may be necessary.
The Company has certain subsidiaries, mainly located in Brazil, France, Germany and Spain, which have generated operating and/
or capital losses and, in certain circumstances, have limited loss carryforward periods. In accordance with ASC 740, "Income
Taxes," the Company is required to record a valuation allowance when it is more likely than not the Company will not utilize
deductible amounts or net operating losses for each legal entity or consolidated group based on the tax rules in the applicable
jurisdiction, evaluating both positive and negative historical evidences as well as expected future events and tax planning strategies.
In the first quarter of fiscal 2014, the Company determined that it was more likely than not that a deferred tax asset associated
with a capital loss in Mexico would not be utilized. Therefore, the Company recorded a $21 million valuation allowance as income
tax expense.
40
Capitalization
(in millions)
Short-term debt
December 31,
2014
$
Current portion of long-term debt
September 30,
2014
1,075
$
December 31,
2013
Change
183
$
Change
986
139
140
Long-term debt
6,322
6,357
Total debt
7,536
6,680
13%
6,670
13%
10,823
11,311
-4%
11,531
-6%
18,201
1%
Shareholders’ equity attributable to Johnson
Controls, Inc.
Total capitalization
Total debt as a % of total capitalization
$
18,359
$
41%
17,991
37%
818
4,866
2% $
37%
•
The Company believes the percentage of total debt to total capitalization is useful to understanding the Company’s financial
condition as it provides a review of the extent to which the Company relies on external debt financing for its funding and is
a measure of risk to its shareholders.
•
At December 31, 2014, the Company had committed bilateral euro denominated revolving credit facilities totaling 237 million
euro. Additionally, at December 31, 2014, the Company had committed bilateral U.S. dollar denominated revolving credit
facilities totaling $135 million. As of December 31, 2014, facilities in the amount of 237 million euro are scheduled to expire
in fiscal 2015 and facilities in the amount of $135 million are scheduled to expire in fiscal 2016. There were no draws on any
of the revolving facilities as of December 31, 2014.
•
In December 2014, the Company entered into a nine-month, $500 million, floating rate term loan scheduled to mature in
September 2015. Proceeds from the term loan were used for general corporate purposes.
•
In December 2014, the Company entered into a nine-month, $100 million, floating rate term loan scheduled to mature in
September 2015. Proceeds from the term loan were used for general corporate purposes.
•
In June 2014, the Company issued $300 million aggregate principal amount of 1.4% senior unsecured fixed rate notes due in
fiscal 2018, $500 million aggregate principal amount of 3.625% senior unsecured fixed rate notes due in fiscal 2024, $450
million aggregate principal amount of 4.625% senior unsecured fixed rate notes due in fiscal 2044 and $450 million aggregate
principal amount of 4.95% senior unsecured fixed rate notes due in fiscal 2064. Aggregate net proceeds of $1.7 billion from
the issuances were used to finance the acquisition of ADT and for other general corporate purposes.
•
In March 2014, the Company entered into a nine-month, $150 million, floating rate term loan scheduled to mature in December
2014. Proceeds from the term loan were used for general corporate purposes. The loan was repaid during the quarter ended
June 30, 2014.
•
In March 2014, the Company retired $450 million in principal amount, plus accrued interest, of its 1.75% fixed rate notes that
matured in March 2014.
•
In February 2014, the Company retired $350 million in principal amount, plus accrued interest, of its floating rate notes that
matured in February 2014.
•
In January 2014, the Company entered into a one-year, $150 million, floating rate term loan scheduled to mature in January
2015. Proceeds from the term loan were used for general corporate purposes. The loan was repaid in the quarter ended
September 30, 2014.
•
In December 2013, the Company entered into a five-year, 220 million euro, floating rate credit facility scheduled to mature
in fiscal 2019. The Company drew on the full credit facility during the quarter ended December 31, 2013. Proceeds from the
facility were used for general corporate purposes.
41
•
In December 2013, the Company entered into a nine-month, $500 million, floating rate term loan scheduled to mature in
September 2014. Proceeds from the term loan were used for general corporate purposes. The loan was repaid in the quarter
ending September 30, 2014.
•
The Company also selectively makes use of short-term credit lines. The Company estimates that, as of December 31, 2014,
it could borrow up to $1.0 billion based on average borrowing levels during the quarter on committed credit lines.
•
The Company believes its capital resources and liquidity position at December 31, 2014 are adequate to meet projected needs.
The Company believes requirements for working capital, capital expenditures, dividends, stock repurchases, minimum pension
contributions, debt maturities and any potential acquisitions in the remainder of fiscal 2015 will continue to be funded from
operations, supplemented by short- and long-term borrowings, if required. The Company currently manages its short-term
debt position in the U.S. and euro commercial paper markets and bank loan markets. In the event the Company is unable to
issue commercial paper, it would have the ability to draw on its $2.5 billion revolving credit facility, which matures in August
2018. There were no draws on the revolving credit facility as of December 31, 2014. As such, the Company believes it has
sufficient financial resources to fund operations and meet its obligations for the foreseeable future.
•
The Company earns a significant amount of its operating income outside the U.S., which is deemed to be permanently reinvested
in foreign jurisdictions. The Company currently does not intend nor foresee a need to repatriate these funds. The Company’s
intent is for such earnings to be reinvested by the subsidiaries or to be repatriated only when it would be tax effective through
the utilization of foreign tax credits. The Company expects existing domestic cash and liquidity to continue to be sufficient
to fund the Company’s domestic operating activities and cash commitments for investing and financing activities for at least
the next twelve months and thereafter for the foreseeable future. In addition, the Company expects existing foreign cash, cash
equivalents, short-term investments and cash flows from operations to continue to be sufficient to fund the Company’s foreign
operating activities and cash commitments for investing activities, such as material capital expenditures, for at least the next
twelve months and thereafter for the foreseeable future. Should the Company require more capital in the U.S. than is generated
by operations domestically, the Company could elect to raise capital in the U.S. through debt or equity issuances. This alternative
could result in increased interest expense or other dilution of the Company’s earnings. The Company has borrowed funds
domestically and continues to have the ability to borrow funds domestically at reasonable interest rates.
•
The Company’s debt financial covenants require a minimum consolidated shareholders’ equity attributable to Johnson Controls,
Inc. of at least $3.5 billion at all times and allow a maximum aggregated amount of 10% of consolidated shareholders’ equity
attributable to Johnson Controls, Inc. for liens and pledges. For purposes of calculating the Company’s covenants, consolidated
shareholders’ equity attributable to Johnson Controls, Inc. is calculated without giving effect to (i) the application of ASC
715-60, "Defined Benefit Plans - Other Postretirement," or (ii) the cumulative foreign currency translation adjustment. As of
December 31, 2014, consolidated shareholders’ equity attributable to Johnson Controls, Inc. as defined per the Company’s
debt financial covenants was $11.4 billion and there was a maximum of $267 million of liens outstanding. The Company
expects to remain in compliance with all covenants and other requirements set forth in its credit agreements and indentures
for the foreseeable future. None of the Company’s debt agreements limit access to stated borrowing levels or require accelerated
repayment in the event of a decrease in the Company’s credit rating.
New Accounting Standards
In May 2014, the FASB issued Accounting Standards Update (ASU) No. 2014-09, "Revenue from Contracts with Customers
(Topic 606)." ASU No. 2014-09 clarifies the principles for recognizing revenue when an entity either enters into a contract with
customers to transfer goods or services or enters into a contract for the transfer of non-financial assets. ASU No. 2014-09 will be
effective retrospectively for the Company for the quarter ending December 31, 2017, with early adoption not permitted. The
Company is currently assessing the impact adoption of this guidance will have on its consolidated financial statements.
In April 2014, the FASB issued ASU No. 2014-08, "Presentation of Financial Statements (Topic 205) and Property, Plant and
Equipment (Topic 360): Reporting Discontinued Operations and Disclosures of Disposals of Components of an Entity." ASU No.
2014-08 limits discontinued operations reporting to situations where the disposal represents a strategic shift that has (or will have)
a major effect on an entity's operations and financial results, and requires expanded disclosures for discontinued operations. ASU
No. 2014-08 will be effective prospectively for the Company for disposals that occur during or after the quarter ending December
31, 2015, with early adoption permitted in certain instances. The significance of this guidance for the Company is dependent on
any future dispositions or disposals.
42
In July 2013, the FASB issued ASU No. 2013-11, "Income Taxes (Topic 740): Presentation of an Unrecognized Tax Benefit When
a Net Operating Loss Carryforward, a Similar Tax Loss, or a Tax Credit Carryforward Exists." ASU No. 2013-11 clarifies that
companies should present an unrecognized tax benefit as a reduction to a deferred tax asset for a net operating loss carryforward,
a similar tax loss or a tax credit carryforward. ASU No. 2013-11 was effective for the Company for the quarter ending December
31, 2014. The adoption of this guidance did not have a significant impact on the Company's consolidated financial statements.
Other Financial Information
The interim financial information included in this Quarterly Report on Form 10-Q has not been audited by PricewaterhouseCoopers
LLP (PwC). PwC has, however, applied limited review procedures in accordance with professional standards for reviews of interim
financial information. Accordingly, you should restrict your reliance on their reports on such information. PwC is not subject to
the liability provisions of Section 11 of the Securities Act of 1933 for its reports on the interim financial information because such
reports do not constitute "reports" or "parts" of the registration statements prepared or certified by PwC within the meaning of
Sections 7 and 11 of the Securities Act of 1933.
ITEM 3. QUANTITATIVE AND QUALITATIVE DISCLOSURES ABOUT MARKET RISK
As of December 31, 2014, the Company had not experienced any adverse changes in market risk exposures that materially affected
the quantitative and qualitative disclosures presented in the Company's Annual Report on Form 10-K for the year ended September
30, 2014.
ITEM 4. CONTROLS AND PROCEDURES
Evaluation of Disclosure Controls and Procedures
Under the supervision and with the participation of our management, including our principal executive officer and principal
financial officer, we conducted an evaluation of our disclosure controls and procedures, as such term is defined under Rule 13a-15
(e) promulgated under the Securities Exchange Act of 1934, as amended (Exchange Act). Based upon their evaluation of these
disclosure controls and procedures, the principal executive officer and principal financial officer concluded that the disclosure
controls and procedures were effective as of December 31, 2014 to ensure that information required to be disclosed by the Company
in the reports it files or submits under the Exchange Act is recorded, processed, summarized and reported, within the time period
specified in the SEC’s rules and forms, and to ensure that information required to be disclosed by the Company in the reports it
files or submits under the Exchange Act is accumulated and communicated to the Company’s management, including its principal
executive and principal financial officers, as appropriate, to allow timely decisions regarding disclosure.
Changes in Internal Control Over Financial Reporting
There have been no significant changes in the Company’s internal control over financial reporting during the three months ended
December 31, 2014 that have materially affected, or are reasonably likely to materially affect, the Company’s internal control over
financial reporting.
The Company is undertaking the implementation of new enterprise resource planning (ERP) systems, which will occur over a
period of several years. As the phased roll-out of the new ERP systems occurs, the Company may experience changes in internal
control over financial reporting. No significant changes were made to the Company’s current internal control over financial reporting
as a result of the implementation of the new ERP systems during the three months ended December 31, 2014.
43
PART II. OTHER INFORMATION
ITEM 1. LEGAL PROCEEDINGS
As noted in Item 1 to the Company’s Annual Report on Form 10-K for the year ended September 30, 2014, liabilities potentially
arise globally under various environmental laws and worker safety laws for activities that are not in compliance with such laws
and for the cleanup of sites where Company-related substances have been released into the environment.
Currently, the Company is responding to allegations that it is responsible for performing environmental remediation, or for the
repayment of costs spent by governmental entities or others performing remediation, at approximately 40 sites in the United States.
Many of these sites are landfills used by the Company in the past for the disposal of waste materials; others are secondary lead
smelters and lead recycling sites where the Company returned lead-containing materials for recycling; a few involve the cleanup
of Company manufacturing facilities; and the remaining fall into miscellaneous categories. The Company may face similar claims
of liability at additional sites in the future. Where potential liabilities are alleged, the Company pursues a course of action intended
to mitigate them.
The Company accrues for potential environmental liabilities in a manner consistent with accounting principles generally accepted
in the United States; that is, when it is probable a liability has been incurred and the amount of the liability is reasonably estimable.
Reserves for environmental liabilities totaled $23 million, $24 million and $24 million at December 31, 2014, September 30, 2014
and December 31, 2013, respectively. The Company reviews the status of its environmental sites on a quarterly basis and adjusts
its reserves accordingly. Such potential liabilities accrued by the Company do not take into consideration possible recoveries of
future insurance proceeds. They do, however, take into account the likely share other parties will bear at remediation sites. It is
difficult to estimate the Company’s ultimate level of liability at many remediation sites due to the large number of other parties
that may be involved, the complexity of determining the relative liability among those parties, the uncertainty as to the nature and
scope of the investigations and remediation to be conducted, the uncertainty in the application of law and risk assessment, the
various choices and costs associated with diverse technologies that may be used in corrective actions at the sites, and the often
quite lengthy periods over which eventual remediation may occur. Nevertheless, the Company does not currently believe that any
claims, penalties or costs in connection with known environmental matters will have a material adverse effect on the Company’s
financial position, results of operations or cash flows. In addition, the Company has identified asset retirement obligations for
environmental matters that are expected to be addressed at the retirement, disposal, removal or abandonment of existing owned
facilities, primarily in the Power Solutions business. At December 31, 2014, September 30, 2014 and December 31, 2013, the
Company recorded conditional asset retirement obligations of $53 million, $52 million and $59 million, respectively.
In June 2013, the Company self-reported to the Securities and Exchange Commission (SEC) and the Department of Justice (DOJ)
alleged Foreign Corrupt Practices Act (FCPA) violations related to its Building Efficiency marine business in China dating back
to 2007. These allegations were isolated to the Company’s marine business in China which had annual sales ranging from $20
million to $50 million during this period. The Company, under the oversight of its Audit Committee and Board of Directors,
proactively initiated an investigation into this matter with the assistance of external legal counsel and external forensic accountants.
In connection with this investigation, the Company has made and continues to evaluate certain enhancements to its FCPA compliance
program. The Company continues to fully cooperate with the SEC and the DOJ; however, at this time, the Company is unable to
predict the ultimate resolution of this matter with these agencies.
The Company is involved in a number of product liability and various other casualty lawsuits incident to the operation of its
businesses. The Company maintains insurance coverages and records estimated costs for claims and suits of this nature. It is
management’s opinion that none of these will have a material adverse effect on the Company’s financial position, results of
operations or cash flows. Costs related to such matters were not material to the periods presented.
ITEM 1A. RISK FACTORS
There have been no material changes to the disclosure regarding risk factors presented in Item 1A to the Company’s Annual Report
on Form 10-K for the year ended September 30, 2014.
ITEM 2. UNREGISTERED SALES OF EQUITY SECURITIES AND USE OF PROCEEDS
In November 2012, the Company’s Board of Directors authorized a stock repurchase program to acquire up to $500 million of the
Company’s outstanding common stock, which supersedes any prior programs. In September 2013, the Company’s Board of
Directors authorized up to an additional $500 million in stock repurchases of the Company’s outstanding common stock, and in
November 2013, the Company's Board of Directors authorized an additional $3.0 billion under the stock repurchase program, both
incremental to prior authorizations. Stock repurchases under the stock repurchase program may be made through open market,
44
privately negotiated, or structured transactions or otherwise at times and in such amounts as Company management deems
appropriate. The stock repurchase program does not have an expiration date and may be amended or terminated by the Board of
Directors at any time without prior notice. The Company spent approximately $1,249 million on repurchases under the stock
repurchase program in fiscal 2014. As of December 31, 2014, the Company has spent approximately $600 million on repurchases
under the stock repurchase program in fiscal 2015.
The Company entered into an Equity Swap Agreement, dated March 13, 2009, with Citibank, N.A. (Citibank). The Company
selectively uses equity swaps to reduce market risk associated with its stock-based compensation plans, such as its deferred
compensation plans. These equity compensation liabilities increase as the Company’s stock price increases and decrease as the
Company’s stock price decreases. In contrast, the value of the Equity Swap Agreement moves in the opposite direction of these
liabilities, allowing the Company to fix a portion of the liabilities at a stated amount.
In connection with the Equity Swap Agreement, Citibank may purchase unlimited shares of the Company’s stock in the market
or in privately negotiated transactions. The Company disclaims that Citibank is an "affiliated purchaser" of the Company as such
term is defined in Rule 10b-18(a)(3) under the Securities Exchange Act or that Citibank is purchasing any shares for the Company.
The Equity Swap Agreement has no stated expiration date. The net effect of the change in fair value of the Equity Swap Agreement
and the change in equity compensation liabilities was not material to the Company’s earnings for the three months ended
December 31, 2014.
The following table presents information regarding the repurchase of the Company’s common stock by the Company as part of
the publicly announced program and purchases of the Company’s common stock by Citibank in connection with the Equity Swap
Agreement during the three months ended December 31, 2014.
Period
10/1/14 - 10/31/14
Purchases by Company
11/1/14 - 11/30/14
Purchases by Company
12/1/14 - 12/31/14
Purchases by Company
10/1/14 - 10/31/14
Purchases by Citibank
11/1/14 - 11/30/14
Purchases by Citibank
12/1/14 - 12/31/14
Purchases by Citibank (1)
(1)
Total Number of
Shares Purchased
Total Number of
Shares Purchased as
Part of the Publicly
Announced Program
Average Price
Paid per Share
Approximate Dollar
Value of Shares that
May Yet be
Purchased under the
Programs
—
$
—
—
$
2,400,629,831
11,138,432
$
49.14
11,138,432
$
1,853,246,449
1,050,396
$
50.09
1,050,396
$
1,800,629,872
—
—
—
NA
—
—
—
NA
—
—
—
NA
In December 2014, Citibank reduced its holding of the Company's stock by 300,000 shares in connection with the
Equity Swap Agreement.
ITEM 6. EXHIBITS
Reference is made to the separate exhibit index contained on page 47 filed herewith.
45
SIGNATURES
Pursuant to the requirements of the Securities Exchange Act of 1934, the registrant has duly caused this report to be signed on
its behalf by the undersigned thereunto duly authorized.
JOHNSON CONTROLS, INC.
Date: January 30, 2015
By: /s/ Brian J. Stief
Brian J. Stief
Executive Vice President and
Chief Financial Officer
46
JOHNSON CONTROLS, INC.
Form 10-Q
INDEX TO EXHIBITS
Exhibit No.
Description
15
Letter of PricewaterhouseCoopers LLP, Independent Registered Public Accounting Firm, dated January
30, 2015, relating to Financial Information.
31.1
Certification by the Chief Executive Officer pursuant to Section 302 of the Sarbanes-Oxley Act of 2002.
31.2
Certification by the Chief Financial Officer pursuant to Section 302 of the Sarbanes-Oxley Act of 2002.
32
Certification of Periodic Financial Report by the Chief Executive Officer and Chief Financial Officer
pursuant to Section 906 of the Sarbanes-Oxley Act of 2002.
101
The following materials from Johnson Controls, Inc.’s Quarterly Report on Form 10-Q for the quarter
ended December 31, 2014, formatted in XBRL (Extensible Business Reporting Language): (i) the
Consolidated Statements of Financial Position, (ii) the Consolidated Statements of Income, (iii) the
Consolidated Statements of Comprehensive Income (Loss), (iv) the Consolidated Statements of Cash
Flows, and (v) Notes to Consolidated Financial Statements.
47
Exhibit 15
January 30, 2015
Securities and Exchange Commission
100 F Street, N.E.
Washington, DC 20549
Re: Johnson Controls, Inc. Registration Statement Nos. 333-200406 and 333-179613 on Form S-3 and 33-30309,
33-31271, 33-58094, 333-10707, 333-41564, 333-141578, 333-173326 and 333-188430 on Form S-8.
Commissioners:
We are aware that our report dated January 30, 2015 on our review of interim financial information of Johnson Controls,
Inc. (the "Company") as of and for the three-month periods ended December 31, 2014 and 2013 and included in the
Company's quarterly report on Form 10-Q for the quarter ended December 31, 2014 is incorporated by reference in
the above referenced Registration Statements.
Very truly yours,
/s/ PricewaterhouseCoopers LLP
PricewaterhouseCoopers LLP
Milwaukee, Wisconsin
Exhibit 31.1
CERTIFICATIONS
I, Alex A. Molinaroli, of Johnson Controls, Inc., certify that:
1.
I have reviewed this quarterly report on Form 10-Q of Johnson Controls, Inc.;
2.
Based on my knowledge, this report does not contain any untrue statement of a material fact or omit to state a material fact
necessary to make the statements made, in light of the circumstances under which such statements were made, not
misleading with respect to the period covered by this report;
3.
Based on my knowledge, the financial statements, and other financial information included in this report, fairly present in
all material respects the financial condition, results of operations and cash flows of the registrant as of, and for, the periods
presented in this report;
4.
The registrant’s other certifying officer and I are responsible for establishing and maintaining disclosure controls and
procedures (as defined in Exchange Act Rules 13a-15(e) and 15d-15(e)) and internal control over financial reporting (as
defined in Exchange Act Rules 13a-15(f) and 15d-15(f)) for the registrant and have:
5.
a.
Designed such disclosure controls and procedures, or caused such disclosure controls and procedures to be designed
under our supervision, to ensure that material information relating to the registrant, including its consolidated
subsidiaries, is made known to us by others within those entities, particularly during the period in which this report is
being prepared;
b.
Designed such internal control over financial reporting, or caused such internal control over financial reporting to be
designed under our supervision, to provide reasonable assurance regarding the reliability of financial reporting and the
preparation of financial statements for external purposes in accordance with generally accepted accounting principles;
c.
Evaluated the effectiveness of the registrant’s disclosure controls and procedures and presented in this report our
conclusions about the effectiveness of the disclosure controls and procedures, as of the end of the period covered by
this report based on such evaluation; and
d.
Disclosed in this report any change in the registrant’s internal control over financial reporting that occurred during the
registrant’s most recent fiscal quarter (the registrant’s fourth fiscal quarter in the case of an annual report) that has
materially affected, or is reasonably likely to materially affect, the registrant’s internal control over financial reporting;
and
The registrant’s other certifying officer and I have disclosed, based on our most recent evaluation of internal control over
financial reporting, to the registrant’s auditors and the audit committee of registrant’s board of directors (or persons
performing the equivalent functions):
a.
All significant deficiencies and material weaknesses in the design or operation of internal control over financial
reporting which are reasonably likely to adversely affect the registrant’s ability to record, process, summarize and
report financial information; and
b.
Any fraud, whether or not material, that involves management or other employees who have a significant role in the
registrant’s internal control over financial reporting.
Date: January 30, 2015
/s/ Alex A. Molinaroli
Alex A. Molinaroli
Chairman and Chief Executive Officer
Exhibit 31.2
CERTIFICATIONS
I, Brian J. Stief, of Johnson Controls, Inc., certify that:
1.
I have reviewed this quarterly report on Form 10-Q of Johnson Controls, Inc.;
2.
Based on my knowledge, this report does not contain any untrue statement of a material fact or omit to state a material fact
necessary to make the statements made, in light of the circumstances under which such statements were made, not
misleading with respect to the period covered by this report;
3.
Based on my knowledge, the financial statements, and other financial information included in this report, fairly present in
all material respects the financial condition, results of operations and cash flows of the registrant as of, and for, the periods
presented in this report;
4.
The registrant’s other certifying officer and I are responsible for establishing and maintaining disclosure controls and
procedures (as defined in Exchange Act Rules 13a-15(e) and 15d-15(e)) and internal control over financial reporting (as
defined in Exchange Act Rules 13a-15(f) and 15d-15(f)) for the registrant and have:
5.
a.
Designed such disclosure controls and procedures, or caused such disclosure controls and procedures to be designed
under our supervision, to ensure that material information relating to the registrant, including its consolidated
subsidiaries, is made known to us by others within those entities, particularly during the period in which this report is
being prepared;
b.
Designed such internal control over financial reporting, or caused such internal control over financial reporting to be
designed under our supervision, to provide reasonable assurance regarding the reliability of financial reporting and the
preparation of financial statements for external purposes in accordance with generally accepted accounting principles;
c.
Evaluated the effectiveness of the registrant’s disclosure controls and procedures and presented in this report our
conclusions about the effectiveness of the disclosure controls and procedures, as of the end of the period covered by
this report based on such evaluation; and
d.
Disclosed in this report any change in the registrant’s internal control over financial reporting that occurred during the
registrant’s most recent fiscal quarter (the registrant’s fourth fiscal quarter in the case of an annual report) that has
materially affected, or is reasonably likely to materially affect, the registrant’s internal control over financial reporting;
and
The registrant’s other certifying officer and I have disclosed, based on our most recent evaluation of internal control over
financial reporting, to the registrant’s auditors and the audit committee of registrant’s board of directors (or persons
performing the equivalent functions):
a.
All significant deficiencies and material weaknesses in the design or operation of internal control over financial
reporting which are reasonably likely to adversely affect the registrant’s ability to record, process, summarize and
report financial information; and
b.
Any fraud, whether or not material, that involves management or other employees who have a significant role in the
registrant’s internal control over financial reporting.
Date: January 30, 2015
/s/ Brian J. Stief
Brian J. Stief
Executive Vice President and
Chief Financial Officer
Exhibit 32
CERTIFICATION OF PERIODIC FINANCIAL REPORTS
We, Alex A. Molinaroli and Brian J. Stief, of Johnson Controls, Inc., certify, pursuant to Section 906 of the Sarbanes-Oxley Act
of 2002, that:
1.
the Quarterly Report on Form 10-Q for the quarter ended December 31, 2014 (Periodic Report) to which this statement is
an exhibit fully complies with the requirements of Section 13(a) or 15(d) of the Securities Exchange Act of 1934 (15
U.S.C. 78m or 78o(d)) and
2.
information contained in the Periodic Report fairly presents, in all material respects, the financial condition and results of
operations of Johnson Controls, Inc.
Date: January 30, 2015
/s/ Alex A. Molinaroli
Alex A. Molinaroli
Chairman and Chief Executive Officer
/s/ Brian J. Stief
Brian J. Stief
Executive Vice President and
Chief Financial Officer

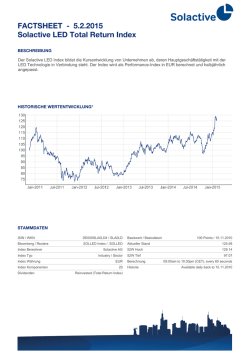
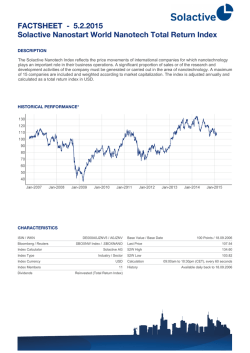
© Copyright 2026