
Unemployment and the Real Wage Gap: A Reappraisal of
Unemployment and the Real Wage Gap:
A Reappraisal of the German Experience
By
Oliver Landmann and Jiirgen Jerger
C o n t e n t s : I. Introduction. - II. The Real Wage Gap: Concept and Measurement. - III. A Model of Capital Accumulation, Employment and the Wage Gap. IV. Explaining the Falling Wage Share. - V. Explaining the Slowdown of Capital Formation. - VI. Concluding Remarks. - Data Appendix.
I. Introduction
he persistence o f high unemployment i n E u r o p e continues to
be a major concern o f theoretical and empirical macroeconomics [Dreze and Bean, 1990 b], In particular, the challenge is to
explain why both reasonable demand growth and various favourable
supply-side developments failed to bring d o w n unemployment decisively i n the 1980s. W h e n unemployment rates first shot up and refused to return to earlier l o w levels i n the 1970s, a consensus on the
causes o f the problem formed more easily. Adverse supply shocks and
explosive wage growth were the essential elements o f the mainstream
explanation, w h i c h heavily relied o n two key concepts: the NAIRU, a
measure o f the unemployment rate consistent w i t h non-accelerating
inflation, and the real wage gap, a measure o f the amount by w h i c h
real wages supposedly exceed their equilibrium level. The collision
between the soaring wage aspirations o f workers and the diminished
potential for real income growth pushed up both o f these measures
[Bruno and Sachs, 1985].
In the 1980s, it became increasingly difficult to explain still higher
unemployment rates along the same lines. A t first, the blame for the
worsening employment picture c o u l d be put o n the severe demand
contraction o f 1 9 8 0 - 8 2 , which added a layer o f Keynesian unemployment to the inherited level o f classical unemployment [Bruno, 1986].
Remark: We acknowledge valuable comments on earlier drafts of this paper from
participants at the M a y 1991 I E A conference "Open Economy Macroeconomics" in
Vienna and at research seminars at the Universities of Hamburg and Munich. In
particular, we thank S. Felder, F. X . H o f and E . Rysavy for pointing out an error in the
specification of a preliminary version of our model.
However, as high unemployment persisted beyond 1982 i n the face of
recovering demand growth, the Keynesian explanation clearly lost
appeal. B u t so d i d the classical unemployment hypothesis as real
wages grew moderately at rates well below productivity growth year
after year.
The coincidence o f rising unemployment with what appears to be
wage moderation prompts us to take another l o o k at the concept
o f the real wage gap. Earlier authors such as Schultze [1987] have
pointed out that changes i n the profit maximizing m i x o f factor inputs
cast doubt o n the validity o f conventional measures o f the real wage
gap as an indicator o f an excessive real wage level and hence o f labour
market disequilibrium. In this paper, we take the argument one step
further by offering a fully specified dynamic m o d e l which endogenizes
the choice o f factor inputs by firms and thus makes transparent how
different shocks affect output, employment, investment, wages and
factor shares i n different ways. The model pays particular attention to
the role that capital accumulation has to play i n an explanation o f
labour market developments, thus taking up a theme emphasized by
Fitoussi and Phelps [1988] i n their account o f the E u r o p e a n unemployment c o n u n d r u m .
T h e empirical sections o f our paper l o o k at the experience o f G e r many, confronting the predictions o f the m o d e l with the most salient
features o f macroeconomic performance since 1970. The key relationships o f the model are estimated w i t h G e r m a n data for the period
1 9 6 1 - 9 1 . T h e m a i n indicators that w i l l concern us i n the subsequent
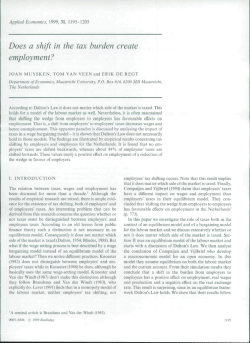
analysis are compiled i n Table 1 and Figure 1. T h e figure charts the
evolution o f our o w n measure o f the real wage gap (as estimated below) along with the unemployment rate. Evidently, the two variables
m o v e d i n opposite directions for the most part o f the 1980s. T h e table
summarizes some other distinct trends: the slowdown i n the average
growth o f labour productivity and real wages, the s l o w d o w n i n the
pace o f capital accumulation as reflected both i n the growth rate o f the
capital stock and i n the investment ratio, and the m a r k e d rise o f the
real interest rate after 1980.
We n o w proceed as follows: I n Section II, we discuss some conceptual issues relating to the real wage gap and present our o w n estimate.
1
1
The strong demand-led boom that the West German economy experienced in
1990-91 due to the unification generated a (temporary?) pick-up of real wage growth,
employment growth and investment. However, the 1980-91 averages of these variables
do not differ very much from their 1980-89 averages, in particular as they are compared with their pre-1980 values.
Figure 1 - The Wage Gap (left scale) and the Unemployment
(right scale) in Germany,
1961-1991
1.10-,
R
0.96-1
, , , , , , ,
, , , , , , , , ! , ,—, , ,
1961
1964 1967 1970 1973 1976 1979 1982
P
Unemployment rate*
G N P per hour worked
Real wages per h o u r
Capital stock
Net investment
aggregate economy
private sector
Real interest rate
b
b
b
c
0
d
* Average level in per cent. National Product (NNP). average level in per cent.
b
d
9
, ,—, , , , , _
1985 1988 1991
Table 1 - Selected Economic Indicators for Germany,
Variable
Rate
1961-91
1961-1973
1974-1979
1980-1991
0.8
5.1
5.2
5.6
3.5
3.6
2.9
3.6
6.6
2.0
1.6
2.8
21.4
16.6
2.8
13.5
9.5
3.2
10.2
7.8
4.6
c
Per cent change per annum. - A s per cent of Net
Nominal interest rate minus G N P inflation rate;
Source: See data appendix.
O u r model is introduced i n Section III. Section I V empirically investigates the implications o f the model for the time path o f the labour
share a n d the real wage gap. Section V is concerned with the slowd o w n o f capital formation. Section V I concludes.
II. The Real Wage Gap: Concept and Measurement
The concept o f the real wage gap is intended to indicate the
amount by w h i c h the prevailing real wage exceeds the level consistent
w i t h full employment. The standard procedure to construct such an
indicator is to choose a base period i n which the economy was near
full employment and for w h i c h the real wage gap is set equal to a
benchmark value. N e x t , the hypothetical rate o f real wage growth that
w o u l d have been feasible at continuous full employment is estimated
a n d compared w i t h the rate actually observed [see e.g. Sachs, 1983;
B r u n o and Sachs, 1985]. The "feasible" growth rate o f real wages obviously depends o n the pace o f an economy's productivity advance.
However, it has soon been realized that the actual growth rate o f
labour productivity is a p o o r p r o x y for the feasible growth rate o f real
wages i f unemployment is not constant. The reason is that labour
productivity endogenously responds to real wage changes as firms
move along their labour demand schedules. Depending o n the elasticity o f labour demand, any excess real wage growth w i l l appear at least
in part to " p a y for itself".
T h e point can be seen by considering a C E S representation of the
p r o d u c t i o n process which relates output Y to the capital stock K,
labour input N and time t:
Y-
F(X,N,t) =
A[b{N exp(Ar)}'*
t
lle
+ (l-b){K txp(tit)}-°]- -
(1)
t
The parameters X a n d \i denote labour augmenting a n d capital augmenting technical progress, respectively. F o r reasons that w i l l become
clear below, the specification of technical progress is sufficiently general to leave open the possibility of non-neutral progress. W i t h c o m petitive firms, the real wage W must equal the marginal product of
labour:
W= bA~~ exp(-gAt)(
Y/N) « .
(2)
2
3
e
1
+
Solving for the l o g of the average product o f labour (and denoting logs
by lower-case letters), we get
y - n = a 4- a(w-h)
0
2
+ It.
(3)
The wage gap literature typically assumes Hicks-neutrality [see e.g. Schultze, 1987].
This corresponds to the special case A—y. in our formulation.
Allowing for monopolistic deviations from the benchmark case of perfect competition would add a constant term (related to the price elasticity of demand). Since none
of our results depends on variations in the degree of monopoly power, we ignore this
factor throughout.
3
This equation relates labour productivity to the real wage and to
labour-augmenting technical progress ( a is a constant; a is the elasticity of substitution, defined by (1
M o r e precisely, labour productivity grows at the trend rate X as l o n g as the real wage grows at
the same rate. If real wage growth deviates from this trend rate,
productivity growth deviates i n the same direction depending o n the
elasticity of substitution. I n the limiting case of the C o b b - D o u g l a s
production function (o-=l), productivity moves one-to-one with the
real wage so that any real wage growth appears "justified" ex post by
the resulting productivity increase. The trend deviation of the real
wage, w — Xt, is what G o r d o n [1988, p. 287] has called the "adjusted
wage gap". B y relating the real wage to trend productivity rather than
actual productivity, this measure is presumed free of any bias stemming from endogenous productivity changes. We can rewrite (3) so as
to make plain h o w the adjusted wage gap is related to the unadjusted
wage gap, where the latter is simply (an index of) the wage share i n
national income:
0
4
w + n- y = - a
0
+ (l-a)(w-Xt).
(4)
In order to calculate the adjusted wage gap, we estimate (3) and (4)
using quarterly data from the period 1961:1 to 1991:4. The equations
are estimated i n level form and the time series involved are tested for
the property of cointegration. This test indicates whether the long-run
"equilibrium" relationship between output, employment and the real
wage, which is implied by the optimizing behaviour of firms, is supported by the data.
Cointegration is only defined for variables of the same order of
integration. Therefore, it is necessary to determine the order of integration of the time series before cointegration diagnostics are used for the
regressions. We employ the methods suggested by Sargan and B h a r gava [1983], Phillips [1987], Phillips and P e r r o n [1988] and Stock and
Watson [1988]. The first one is based o n the D u r b i n - W a t s o n statistic
( S B D W ) , the second is a modification of the augmented D i c k e y - F u l l e r
[1979,1981] test and includes a constant, a time trend and 4 lags of the
differenced variable ( D F / P P ( 4 ) ) . F i n a l l y , the Stock-Watson test also
5
4
This observation has been put forward as a principal objection against productivityrelated wage guidelines; see Hellwig and Neumann [1987].
See Engle and Granger [1987] for an exposition of the methodology. The presence of
cointegration also justifies more confidence in the quality of estimates involving nonstationary variables than traditional econometric theory would imply [Stock, 1987].
5
Table 2 - Integration
SBDW
Variable
(W>N)/Y
w+n—y
w
k-n
y-n
Diagnostics
DF/PP(4)
StWa
level
Alevel
level
Alevel
level
Alevel
0.183
0.185
0.002
0.002
0.002
2.407***
2.409***
1.914***
2.436***
2.451***
»2.475
-2.493
-1.122
-0.136
-1.116
-14.077***
-14.125***
-12.960***
-17.306***
-15.952***
-7.509
-7.531
-1.102
-0.665
-1.301
-175.87***
-149.06***
-141.33***
-158.69***
-155.39***
*** The null is rejected at the significance level < 1 per cent. For the data see the
Appendix.
includes the intercept a n d a trend, thus the g}-test (in the symbols of
Stock a n d W a t s o n [1988]) is used (StWa).
T h e procedures test the n u l l " r a n d o m w a l k " (with drift and trend)
against the alternative hypothesis of a stationary process. T h e results
for levels and first differences are presented i n Table 2 . It is evident
that a l l time series to be used are integrated of the order one.
F o r the purpose of estimation, (3) and (4) are written as follows:
6
y - n = a + a w + a t + a t + C0>-y*)
(3')
w + n - y = b + bw + b t + b x + C ( y - y * ) .
(4')
0
x
0
2
i
3
2
3
W i t h y * denoting the l o g of potential real G N P , (y—y*) captures the
cyclical sensitivity of productivity and the wage share. B o t h regressions have been r u n with a n d without this cyclical adjustment (columns 2 and 1 i n Table 3, respectively). Technical progress is assumed
to be exogenous and is captured by trend terms i n the usual manner.
t denotes a time trend for the whole sample, whereas T is set equal to
zero from 1961:1 through 1973:4 and increases by one unit per quarter
thereafter. Thus, the equations allow for a break i n the rate of trend
productivity growth after 1973. The rates are denoted by X (1961 —
1973) and X (1974-1991), respectively.
7
x
2
6
Besides the wage, the wage share and the average product of labour which appear in
logs in (3) and (4), Table 2 also displays the integration diagnostics for some variables
which will be used below.
Potential output was calculated from our database (see Appendix) along the lines
proposed by the Sachverstandigenrat [1992, p. 259].
7
Table 3 - Estimates of (3') and
(4')
(3')
(40
Dependen t variable
w + n— y
y-n
(1)
-0.014
0.438
0.013
0.007
- 0.016
0.370
0.013
0.007
0.273
c
2
R
DW
DF
ADF(4)
(1)
(2)
0.998
0.737***
-5.253***
-3.231**
(2)
-0.020
0.305
0.012
0.006
0.998
0.860
- 0.023
0.181
0.012
0.006
0.501
0.650
0.510***
-4.193***
-3.356**
0.832
0.677
Note: <r, k anid k are reported as implied by the estimated coefficients of w 1 and
T. - t-statistics are not reported, because they do not converge to a limiting distribution in a setti ng with non-stationary variables [cf. Phillips, 1986]. - ***,*•; The
variables are c ointegrated at the 1 and 5 per cent level, respectively. - For the data
see the Appen dix.
2
x
9
The estimated coefficients translate i n t o the technical parameters
of (3) according to
<x = a
0
a = a
Q
i
X = a /(l-a )
x
2
k
x
2
=(a
2
+ a )/(l
3
-a )
x
and of (4) according to
x
0
= -b
0
a = l~b
x
X = -b /b
x
2
x
X = -{b
2
2
+
b )/b .
3
x
The cointegration diagnosis is based o n the D u r b i n - W a t s o n coefficient ( S B D W ) , the (simple) D i c k e y - F u l l e r test ( D F ) and the augmented
D i c k e y - F u l l e r test ( A D F ( 4 ) ) .
8
T h e results are summarized i n Table 3.
N o t i n g that the parameters are reasonably stable across specifications, we can d r a w the following conclusions from these estimates:
8
Our application of the cointegration technique is somewhat peculiar in that the
equations include deterministic trend terms. The trend term, suggested by theory to
capture the effects of technical progress, is, of course, non-stochastic, and thus falls
outside the concept of integratedness. Nevertheless, cointegration can still be interpreted as indicating the stationarity of the residual error and thus serves us as a means
of regression diagnostics. The property of cointegration in this case is defined between
the deterministic-trend-corrected L H S and the remaining R H S variables.
(a) In line with most previous work, we find an elasticity of substitution well below u n i t y . B y implication, the adjusted wage gap generally moves i n the same direction as the plain wage share.
(b) The cyclical p r o x y enters the equations with the expected sign,
reflecting the pro-cyclical behaviour of productivity and the corresponding counter-cyclical behaviour of the wage share.
(c) The significant difference between k and X reflects the wellk n o w n s l o w d o w n of trend productivity growth i n the mid-1970s. E x perimentation with another d u m m y for the 1980-91 period was unsuccessful (confirming a similar result obtained by G o r d o n [1988]).
T h i s suggests that the noticeable s l o w d o w n of actual productivity
growth i n the 1980s as compared with the 1970s should not be interpreted as another structural break, but as an endogenous response to
some force which simultaneously depressed real wage growth. A s we
w i l l argue below, this force was the s l o w d o w n of capital deepening.
(d) The cointegration diagnostics indicate the presence of cointegration for both e q u a t i o n s and thus justify some confidence i n the
existence of a long-term relation l i n k i n g output, employment and the
real wage. In this sense, the data do not refute the n o t i o n that firms
operate o n their neoclassical labour-demand schedules i n the long run.
To calculate the adjusted wage gap index, we subtract the estimated trend productivity term [X t + (k — k^x] from the (log of the)
actual real wage w. The series plotted i n the top panel of Figure 1 is
based o n an annual growth rate of trend productivity amounting to
4.8 per cent from 1961 to 1973 and 2.4 per cent from 1974 to 1991, as
implied by the regression results for equation (4') i n Table 3. Evidently,
the wage gap rose substantially i n the years after 1969, reflecting the
abrupt acceleration of real wage growth (the "wage explosion") in that
period. F r o m 1977 to 1991, i n contrast, the real wage level increased
at only about half the rate of trend productivity growth, thus driving
d o w n the wage gap index well below unity (the 1961 benchmark).
9
x
2
10
11
x
9
2
Our estimated a is particularly close to McCallum's [1985, p. 446]. Entorf et al. [1990]
estimate a value of 0.3 using the same technology specification with annual data from
1970-1986 for the private sector in Germany.
According to our derivation of (3), and contrary to Gordon's [1988, p. 286] presumption, X does not pick up changes in the capital-labour ratio.
Cointegration tests apply only to regressions without (y—y*). The cyclical proxy is
stationary by construction, so cointegration in the equations which include this term is
ill-defined.
1 0
1 1
III. A Model of Capital Accumulation, Employment
and the Wage G a p
1 2
O u r next task is to develop a theoretical framework which allows
us to explain variations i n the level of the real wage gap and to relate
them to changes i n other macroeconomic variables. I n particular, we
wish to show h o w a sustained rise i n unemployment can be associated
either with an increasing real wage gap (as i n the 1970s) or with a
decreasing real wage gap (the experience of the 1980s). O u r model
abstracts from monetary and other demand-side disturbances that
shape the cyclical behaviour of the economy. The focus is entirely o n
the longer-term interaction of unemployment, the wage gap, wage
setting behaviour and capital formation. T o simplify the exposition,
the theoretical analysis i n this section also assumes away autonomous
productivity change due to technical progress. I n terms of the notation
introduced i n the last section, this amounts to k — /j = 0 so that the
adjusted real wage gap index can be identified with the real wage itself.
Another i m p l i c a t i o n of this simplifying assumption is that the capital
stock and the capital-labour ratio are stationary i n e q u i l i b r i u m .
F i r m s are assumed to face a n exogenous real w o r l d interest rate and
to operate o n competitive product m a r k e t s .
They choose their
labour input as well as their real investment spending over time so as
to maximize the present value of cash flows V :
13
14
0
V ^][F(K N )^W N -c(4> )K ]txp(^Rt)dt
0
n
t
t
t
t
t
(5)
o
subject to
K = dK /dt
t
t
=
K (<P -S),
t
t
(6)
where
K: C a p i t a l stock
W: Real wage
$ = I/K
R: Real interest rate
N:
c:
I:
<5:
L a b o u r input
Installation cost of capital goods
Real investment spending (gross)
P r o p o r t i o n a l rate of depreciation.
A dot over a variable denotes its derivative with respect to time.
F is assumed to be a well-behaved constant returns to scale produc1 2
The model of this section is very similar in spirit to the one in Burda [1988J.
Alternatively, changes in these variables should be interpreted as changes relative to
the respective trend paths.
Nothing of substance would change i f we allowed for some price-setting power on
the part of firms.
1 3
1 4
tion function. F o l l o w i n g standard investment theory [e.g. Blanchard
and Fischer, 1989, p. 58], we assume a convex cost function for the
installation of capital goods, i.e. c' > 0, c" > 0. T h e behavioural implications of this optimization problem can be derived i n the usual way by
setting up the current value H a m i l t o n i a n H and establishing the firstorder c o n d i t i o n s :
15
H = F ( K , N) -WNdH/dN
c($)K
+ qK{<P-S)
= F {K,N)-W=0
(7)
(8)
2
dH/dl = - c'($) + g - 0
(9)
QH/dK = F (K, N) - c(#) + q($-S)
= Rq-q,
X
(10)
where
q: Costate variable (shadow price of capital)
F : P a r t i a l derivative of F with respect to the i-th argument.
t
The optimality c o n d i t i o n (8) corresponds to equation (2) above. It
implicitly shows l a b o u r demand as a function of the capital stock and
the real wage. Equations (6), (9) and (10) together determine the dynamics of capital accumulation along the lines of Tobin's q theory of
investment. Instead of the usual (<2,K)-format, we choose here a ( $ , K ) representation to make the time path of investment more readily
visible. Substituting equation (9) and its time derivative into equation
(10) , we get
<P - 1 [&(R + 6-#)
+ c(#) - F {K N)].
(11)
c
We cannot analyze the dynamics of the system formed by (6) and
(11) without taking into account the interdependence of capital format i o n and the labour market. T h e marginal productivity of capital F
depends o n labour input JV ( F > 0 ) . E m p l o y m e n t , i n turn, is determined o n the l a b o u r market where the labour demand of firms as
implied by (8) depends o n the size of the capital stock. T o complete the
description of the l a b o u r market, we assume wage-setting to be governed by an equation of the following form:
X
9
t
1 2
W=MN/N*,z)
9
*»* >Q
2
where
N * : L a b o u r force (exogenous)
z:
Vector of exogenous variables relevant to wage-setting.
Hereafter, time subscripts will be dropped where dispensable.
(12)
We do not provide microeconomic foundations for this relationship, but we note that it is consistent with a number of labour market
models such as m o n o p o l y u n i o n models, bargaining models, efficiency
wage models or insider-outsider models (see also the discussion i n
Lindbeck [1992]). Besides the unemployment rate, these models suggest various other variables that may affect wage-setting. O b v i o u s
examples are total factor productivity, unemployment benefits, the
terms of trade, taxes and u n i o n militancy. Such variables are captured
by the exogenous vector z.
Equations (8) and (12) together determine the equilibrium levels of
employment and the real wage. Solving for N and W we get
N = g(K N* z)
g
W=h(K,N* z)
h h >0 h <0.
9
9
9
g > 0, g < 0
u
l9
2
3
(13)
3
9
(14)
2
This is a n equilibrium i n the sense that the real wage outcome
intended by wage-setters according to (12) is consistent with the demand price of labour derived from (8). Since the wage bargain is cast
in n o m i n a l terms, actual outcomes may differ from the equilibrium
solution due to expectational errors and n o m i n a l rigidities [Blanchard,
1990]. A n y such disequilibrium sets i n m o t i o n an accelerating wageprice spiral which can go o n as l o n g as authorities are prepared to
provide the necessary monetary accommodation. A s soon as n o m i n a l
demand growth is adjusted, however, so as to end the wage-price
spiral, output and employment are eventually forced back to their
equilibrium levels [ L a y a r d and Bean, 1989]. Since the present paper is
not concerned w i t h these transitory monetary disequilibria, any subsequent reference to employment i n this section is to e q u i l i b r i u m employment as determined by (13). The corresponding unemployment
rate (N*-g)/N*
is what L i n d b e c k [1992] has termed the Q E R U
("quasi-equilibrium rate of unemployment") or what i n a Phillipscurve context w o u l d be referred to as the N A I R U .
After substituting (13) into (11), which gives
# = i [cr(R + 6-#)
c
+ c(#) - F {K g(K N* z)}]
t
9
9
9
9
(11')
We can proceed to the analysis of the j o i n t dynamics of capital accumulation and employment. Figure 2 displays the relevant phase diagram. T h e K = 0 locus depicts the equilibrium condition for the capital
stock derived from the state equation (6). It is vertical at #=<5. The
* = 0 locus is the condition for the investment-capital ratio to remain
Figure 2 - The Laws of Motion for Investment and the Capital Stock
stable. T o determine its slope, we set <P = 0 i n (11') and totally differentiate with respect to K a n d 4>. W i t h the normalization JV* = 1, the
equations (8), (12) and (13) i m p l y g =F /(xl/
— F ) so that the slope
is given by
1
2l
1
22
dK
(15)
d$
W i t h constant returns to scale, the denominator of (15) is negative
as l o n g as \l/ > 0 . The numerator is positive i f the real interest rate is
positive (which we assume) and i f the system is close enough to its
equilibrium point where <£ = <5. Thus, the # = 0 locus is depicted as
d o w n w a r d s l o p i n g . T h e direction of the arrows of m o t i o n can be
derived from (6) and (11') i n the usual way. The overall equilibrium of
the system is obviously a saddlepoint. S P is the unique stable path
leading to this equilibrium. The transversality condition
x
16
l i m q Qxp(-Rt)
t
= 0
(16)
ensures that the system always converges to its equilibrium along this
stable path.
1. A D o m e s t i c W a g e S h o c k
We are n o w i n a position to analyze the dynamic consequences of
exogenous shocks. T h e wage explosion of the early 1970s can be
1 6
In the limiting case of ^ =0, i.e. complete real wage rigidity, the # = 0 locus is vertical and no equilibrium exists. In Figure 2, the ^ = 0 locus is drawn as a straight line and
thus must be interpreted as a linear approximation of (15) around the steady state.
Figure 3- A Sequence of a Wage Shock and an Interest Rate Shock:
The Response of Investment, the Capital Stock, the Real Wage
and Employment
represented, i n terms of our model, as an abrupt increase i n z. Inspecting ( 1 1 ' ) - and taking account of F g < 0 - we can see that this shock
displaces the $ = 0 locus downward. I n panel a) of Figure 3, point A
represents the initial equilibrium position of the system. The d o w n ward shift of the $ = 0 locus (which is not depicted) is assumed to give
rise to a new long-run equilibrium at point C with a lower capital
stock. Since the capital stock is predetermined at each point of time,
the new equilibrium cannot be reached immediately. Rather, the i m pact effect of the shock is to reduce investment sharply so as to place
the system o n the stable path S P j (point B). O v e r time, the capital
stock gradually adjusts d o w n w a r d while investment recovers so far as
to reestablish the initial level of $ at the new equilibrium point C .
T o make clear what is going o n behind the scenes of this adjustment process, we have attached two further panels to Figure 3. Panel
c) depicts the interaction of labour demand and wage-setting behaviour as described by (8) and (12). A g a i n , point A is the initial equilibx2
3
rium. A s the push for higher wages sets i n , the wage-setting schedule
shifts up from W S to W S . G i v e n the inherited capital stock K , the
real wage rises to W . E m p l o y m e n t must fall to N if the wage-price
spiral resulting from the wage shock is to be contained. This is not the
end of the adjustment process, however. Since the marginal productivity of l a b o u r depends o n the size of the capital stock, the labour
demand curve gradually shifts to the left as the disinvestment process
is taking its course. A s a consequence, employment is further depressed to N while at the same time the initial real wage gain is completely eroded. It may appear paradoxical that the long-run effect of
the drive for higher real wages is to leave the real wage level unaffected.
But that is what the constant returns to scale technology and the
endogenous capital stock imply. A s B l a n c h a r d [1990, pp. 7 5 - 7 6 ] has
put it, the long-run labour demand curve is horizontal [see also Bean,
1989].
The implied co-movement of the capital stock and employment
- and hence the capital-labour ratio - is illustrated i n panel b). After
an initial rise i n the capital-labour ratio due to the loss of employment
between points A a n d B , a mutually reinforcing contraction of capital
and labour input leads to a new equilibrium at point C where the original intensity is again supported by the original factor price r a t i o .
T h e model tells a story which is roughly i n line with the facts
presented i n the introduction. The pattern of simultaneously rising
unemployment and real wages depicted by the transition from point A
to point B i n panel c) of Figure 3 mirrors the G e r m a n experience and, for that matter, the experience of many other E u r o p e a n countries
- i n the first half of the 1970s when the N A I R U by most accounts rose
from a r o u n d 1 per cent to a r o u n d 4 per cent [see e.g. F r a n z , 1987], This
was the period that revived the interest i n the n o t i o n of classical unemployment and led to the construction of wage gap indices. O f
course, the exact t i m i n g of actual output and employment developments was strongly influenced by the monetary disturbances which
supervened o n the real forces analyzed above. Whereas the increased
wage pressure dates back to the late 1960s, it was at first deflected into
rising inflation rates by a highly accommodating stance of n o m i n a l
demand management. Therefore, the plunge of investment was delayed a n d actual unemployment d i d not catch up with the rising
0
X
x
0
t
2
17
1 7
Note again that the model portrays a stationary economy. A l l the results carry over
to a growing economy, however, if the variables are reinterpreted as trend-adjusted (see
Section IV for such a reinterpretation).
N A I R U until 1974/75 when the monetary accommodation of inflation
was discontinued.
The wage gap began to decline i n the second half of the 1970s.
However, employment growth still fell short of its pre-recession rate
and unemployment remained stubbornly high. Investment remained
depressed. The failure of a falling wage gap to bring d o w n unemployment is not surprising i n view of the properties of the transition path
from point B to point C i n Figure 3. There is no simple and stable
relationship between real wage and unemployment once the endogenous adjustment of the capital stock is taken into account.
2.
A F o r e i g n Interest Rate
Shock
To portray the situation of the early 1980s as a case of a pure real
interest rate shock is clearly an oversimplification. In particular, the
rise i n w o r l d interest rates coincided with the second o i l price shock
and with a sharp appreciation of the U . S . dollar. G e r m a n y , along with
most other E u r o p e a n countries, thus experienced a deterioration of its
terms of trade w h i c h by itself contributed to inflationary pressure and
to a further increase i n the N A I R U . However, because this disturbance
was not as pronounced as the wage shock of the early 1970s, and also
because it was subsequently reversed, we neglect it i n the following
analysis and instead focus o n the consequences of the more sustained
increase i n the real rate of interest.
We turn again to Figure 3 and consider an initial e q u i l i b r i u m
depicted by point C i n each of the three panels (thus assuming, for the
sake of simplicity, that a l l variables, including the capital stock, have
completed their adjustment to the previous shock). A rise i n the real
interest rate lowers the e q u i l i b r i u m capital stock. I n the (#, K) phase
diagram, the * = 0 locus thus shifts d o w n once more as can be verified
from equation (11'). T h e long-run equilibrium position of the system
moves further d o w n along the K—0 locus to point E i n panel a) of
Figure 3. T h i s e q u i l i b r i u m can only be reached along the new stable
path S P . Investment must fall o n impact so as to place the system o n
this path at point D . T h e capital stock thus gradually adjusts d o w n ward to its new o p t i m a l level K .
A s far as capital formation is concerned, the real interest rate shock
evidently generates the same type of dynamic response as the wage
shock. The labour market response, i n contrast, is different. Since the
interest rate does not directly enter the wage-setting equation or the
labour demand equation i n this model, neither the natural employ2
2
merit rate nor the wage rate are affected o n impact. A s the capital stock
adjusts over time, however, labour demand falls. T h i s is represented by
the displacement of the N schedule from N{ to N\ i n panel c) of
Figure 3. A s a result, the real wage and employment continue to decrease together along the wage-setting curve W S from point D ( = C)
to point E . P a n e l b) again illustrates the co-movement of the capital
stock, employment and output. W h i l e both factor inputs fall i n the
course of the adjustment process, the capital-labour ratio must also
decline i n response to the increased cost of capital and the falling real
wage. Therefore, the new equilibrium point E is located o n a lower ray
from the origin than the previous equilibrium C i n panel b).
The theoretical analysis of the interest rate increase again yields
predictions that appear to be broadly i n line with the facts. T h e i n vestment weakness predicted by the model is one of the most salient
features of Germany's macroeconomic performance d u r i n g the 1980s.
Throughout the decade, the net investment ratio never recovered from
the trough of the 1981/82 recession to anywhere near the already depressed level of the 1970s. O f course, the capital-labour ratio d i d not
literally fall as it does i n our stationary-model economy. B u t its rate
of growth fell to a post-war l o w w h i c h was widely seen as a major
cause of the continued s l o w d o w n of labour productivity growth. Discussing the consequences of this investment slowdown, the O E C D
[1988, p. 53] aptly diagnosed a "vicious circle" of sluggish capacity
growth and j o b creation i n which "weak economic growth eventually
began feeding u p o n itself". T h e mutually depressing effects of falling
output and employment o n investment and of inadequate capital
formation o n the demand for labour are indeed at the very core of the
contractionary adjustment process portrayed i n Figure 3.
D u e to our n o r m a l i z a t i o n of the total labour force ( N * = 1), the fall
i n N is to be interpreted as a fall i n the employment rate, not necessarily i n the absolute volume of employment. A s a matter of fact,
employment growth picked up somewhat after 1983, but not enough
to keep up with the expanding supply of l a b o u r . T h e coincidence of
a sharply falling wage gap and a n increasing unemployment rate
which has done so m u c h to discredit the classical-unemployment
hypothesis and the traditional wage-gap analysis i n the 1980s is a
d
l 5
18
1 8
The effects of the rise in the labour force are ignored in this paper; see, however, the
discussion in Landmann and Jerger [1993].
straightforward property of the transition from point D to point E i n
panel c) of Figure 3. A g a i n , the time path of actual unemployment
differed from the gradual upward-creep which the model predicts for
the N A I R U . T h e actual unemployment rate shot up i n 1 9 8 1 - 8 3 under
the influence of a stern anti-inflationary monetary policy and was kept
high for a n extended period of disinflation during which most estimates of the N A I R U were gradually revised upwards [Franz, 1987].
While this behaviour of the N A I R U may give the appearance of
hysteresis, it is also consistent with the disinvestment mechanism described above. O f course, the actual empirical importance of this
mechanism cannot be established by a rough comparison of an abstract model with the stylized facts. In the next section, we therefore
take a first step towards a more formal empirical underpinning of our
story.
IV. Explaining the Falling Wage Share
The above analysis suggests that the concept of the (adjusted or
unadjusted) real wage gap is of little use i n spotting a real wage
problem o n the labour market. In fact, the very n o t i o n of an "excessive
real wage level" is ill-defined i n view of the endogenous determination
of the real wage. M a n y writers have emphasized that the C E S technology (for <7^1) actually predicts such changes i n distributional shares
as a consequence of changes i n the factor-price ratio and the capitallabour ratio even if full employment is permanently maintained [e.g.
M c C a l l u m , 1985; K r u g m a n , 1987; Schultze, 1987]. A s G o r d o n [1988,
p. 285] has put it: " W i t h an elasticity of substitution between labour
and capital below unity, the n o r m a l process of capital accumulation
would be expected gradually to raise labour's share and measured
wage gap indexes." But as a matter of fact, the capital-labour ratio
continued to rise throughout the past decade i n the face of a substantial decline of the adjusted wage gap. Since the endogenous adjustment
of the capital stock plays a central part i n our model of wage and
unemployment dynamics, we n o w take up the question whether the
observed time path of the wage gap and the labour share can be explained by the changing pattern of capital accumulation and employment growth as our theoretical analysis implies.
A g o o d starting point for the empirical analysis is the quadratic
approximation of the C E S function (1), first proposed by K m e n t a
[1967]. W i t h a specification of technical progress as i n (1), this logarith-
mic a p p r o x i m a t i o n is
y
=
a
+ [bX + (1
t + bn + (1
-b)k
2
-± b(l-b)[k-n-(X-ii)t] .
(1')
e
Here again, y, k and n denote the log, respectively, of real output,
the capital stock and employment. T h e parameters have the same
meaning as i n (1) above.
If labour receives its marginal product, the labour share is equal to
the partial elasticity of output w i t h respect to labour:
^ = W-N/Y
on
= b + Qb(l-b)[k
- n - (X-fi)t].
(17)
T w o points emerge from (17). First, an increase i n the capitallabour ratio raises the labour share at any given time if the elasticity
of substitution is below unity ( o g > 0 ) as our estimates i n Section II
suggest it is. Second, the time path of the labour share is not uniquely
determined by the capital-labour ratio, but also depends o n the pace
and the nature of technical progress. O n l y i n the special case of H i c k s neutral progress (X=/*) w o u l d an ongoing process of capital deepening
inevitably result i n the ever-increasing labour share expected by
G o r d o n . Since the recent fall of the labour share was accompanied by
continued capital deepening, Hicks-neutrality does not seem to be a
particularly attractive assumption. Therefore, the estimation of (17)
should allow for a time trend. Initial testing indicated that a break i n
the trend term as i n (3') and (4') is not significant. A linear time trend
is sufficient. T h e regression was r u n both with and without a cyclical
adjustment term £(y —y*). The results are given i n Table 4.
T h e cointegration satistics d o not contradict the j o i n t hypothesis,
embodied i n (17), that firms operate both o n a C E S production function a n d o n the derived labour demand curve i n the l o n g r u n . The
capital-labour ratio enters with the expected positive sign whereas the
coefficient of the time trend is negative, thus reconciling the nonincreasing labour share with the ongoing process of capital deepening.
T h e R H S of (17) essentially features the capital-labour ratio, adjusted
1 9
1 9
2
Admittedly, the relatively low R indicates scope for improving the specification
with regard to the short-run dynamics. However, our interest here is limited to the
long-run validity of the first-order condition (17) for which the cointegration diagnosis
testifies in the positive.
Table 4 - Estimates
of (17)
Dependent variable: W-N/Y
Constant
Coeff(k-n)
(1)
(2)
0.603
0.181
0.011
0.605
0.174
0.011
-0.098
c
2
ft
DW
DF
ADF(4)
0.536
0.360*
-3.300*
-3.167**
0.550
0.338
Note: *, **; The variables a re cointegrated at the 10 and 5 per cent level, respectively. For the data see the Appendix.
for a time trend [k — n—(A—//) t]. I n analogy to the adjusted wage gap,
we refer to this variable as the adjusted capital intensity ( A D J C I ) . The
upper panel of Figure 4 plots A D J C I against the observed wage share
(WS). I n contrast to the unadjusted capital-labour ratio, which kept
growing i n absolute terms throughout the three decades under review,
A D J C I fell substantially i n response to the l o w level of investment i n
the 1975-1988 period. Thereby, it closely paralleled the declining
wage share (WS) and the declining real wage gap (not shown i n F i g ure 4, but depicted i n Figure 1). T h i s correlation is what the theoretical
model i n Section III predicts - if we bear i n m i n d that A D J C I is the
empirical counterpart of K/N i n Figure 3 b.
O n e might object that it is improper to rely o n an exogenous time
trend to square an increasing capital-labour ratio with a falling wage
share. However, A D J C I is closely related to the concept of capital per
"effective" worker, routinely used i n expositions of the Solow growth
model with labour-augmenting technical progress. A s the Solow
model demonstrates, labour-augmenting technical progress causes a
trend increase i n the capital-labour ratio even i n the absence of any
extraneous wage pressure that might arise from labour market imperfections. O u r specification differs from the scenario of the textbook
model because Solow assumed / / = 0 and thus obtained a steady state
with a constant capital-output ratio whereas Germany's capital-output ratio steadily crept upward with a pace of 1.06 per cent p.a. from
1961 to 1991. T h i s is why our estimates i m p l y a higher trend growth
rate for the capital-labour ratio than for labour productivity (i.e. a
higher value for A — \i i n (17) than for A i n (3)).
W h i l e the co-movement of the wage share and the capital-labour
ratio fits our story well, it does not shed light o n the role of relative
factor prices i n causing the observed relation. We address this issue by
noting that the first-order condition which defines the o p t i m a l capital
stock of firms can be derived from the production function (1) i n
analogy to equation (3) as follows:
y ~ * = To + <r(uc — iu) + lit,
(18)
where uc is the l o g of the user cost of capital.
Subtracting (18) from (3), we can relate the capital-labour ratio to
the factor-price ratio:
k —n = a — y
0
0
+ <T(W — UC) +
(1 — a){X — ^)t
(19)
or, equivalently:
k — n — {X — ii)t = a — y + <T[W — uc — (A —fi)t].
0
0
(19')
The L H S of (19') is the adjusted capital-intensity A D J C I as explained above. The term i n brackets o n the R H S is the factor-price
ratio, adjusted i n the same way. Equations (18), (19) and (19') represent
steady-state relationships and do not take into account the extended
adjustment process which we have modelled above. Therefore, we do
not estimate these relationships. However, i n order to reach a first pass
judgment o n the importance of relative factor prices, we have calculated the adjusted factor-price ratio [w—uc—(X — fi)t], using the trend
adjustment term (A —fi)t as reported i n Table 4. The resulting series,
termed A D J R F C , is plotted against the adjusted capital intensity
( A D J C I ) i n the lower panel of Figure 4. A s expected, the chart does not
suggest an excitingly close fit of the two series, but it demonstrates that
the factor-price ratio, once it is adjusted for its secular trend growth,
exhibits a noticeable d o w n w a r d tendency accompanying the extended
decline of A D J C I . B o t h of the shocks, which we have discussed above
show up i n the A D J R F C series: A r o u n d 1970, the ratio shot up as the
wage explosion coincided with an accommodating stance of monetary
policy, which kept the interest rate low. In contrast, the subsequent fall
of A D J R F C was particularly steep i n the 1978-81 period when the
economy was hit by the interest rate shock.
V. Explaining the Slowdown of Capital Formation
T h e theoretical and empirical results derived above emphasized
the disinvestment process which was induced by the wage shock of the
early 1970s as well as by the real interest rate shock a decade later. In
this section, we take a closer l o o k at the causes of the s l o w d o w n of
capital formation. A c c o r d i n g to (18), the equilibrium capital stock
should be related to the level of output and the user cost of capital. We
take into account the gradual adjustment of the capital stock by
allowing for a lagged response of investment to changes i n output
growth and user costs. A s s u m i n g Koyck-distributed lags and following a standard approach pioneered by Bischoff [1971], we derive the
following equation for the change i n the capital s t o c k :
2 0
Ak = 0.070 + 0.059 Ay - 0.014 uc + 0.885 Afc _
(2.459) (2.744)
(-2.411)
(18.053)
t
t
t
f
(20)
x
R H O = 0.262
(1.029)
Estimation method: O L S with correction for first-order serial correlation
(Hildreth-Lu search procedure, cf. e.g. Maddala [1977, pp. 277 ff.]).
Sample 1963-1991
R : 0.961
SEE: 0.002 LM(4): 5.847
(t-statistics in parentheses; LM(4) refers to the Lagrange Multiplier Test for
serial correlation.)
2
Since a l l variables i n (20) were found to be 1(0), the standard tests
for significance are appropriate. U n l i k e some other studies of investment, we find a significant role for the user cost v a r i a b l e . I n an
attempt to identify the proximate causes of the slowing pace of capital
formation, we perform two ex post simulations with (20), b o t h for the
period 1974-1991. First, we calculate a baseline path for the change
21
2 0
Note that the user cost variable appears in level form rather than as a first difference.
This specification results i f the lag structures of the response to changes in output and
of the response to changes in the user cost are allowed to differ [Bischoff, 1971]. For
other recent applications of BischofPs approach, see Clark [1979] and Corker etal.
[1989].
Because of data limitations, (20) was estimated with annual data for the capital stock
of the aggregate economy. O f course, one could argue that only private-sector investment should be made dependent on output growth and the capital costs. O n the other
hand, the slump of output growth and the rise in the real interest rate importantly contributed to the perception, in the early 1980s, that the time path of Germany's public
debt was unsustainable. This perception ultimately triggered the sharp cuts in public
investment spending that became effective after 1982.
2 1
in the capital stock, assuming output growth and the user cost of capital to have remained constant at their average values of 1961-1973.
In Figure 5, this baseline solution is labeled S I M 1 . The fact that S I M 1
slopes moderately downwards indicates that the pace of capital formation up to 1973 was not sustainable even under the prevailing conditions of that period. Presumably, some s l o w d o w n of investment was
inevitable after a postwar transition period i n which the capital-output
ratio h a d to be restored to its equilibrium level.
T h e second simulated path of Afc, labeled S I M 2 i n Figure 5, is
based o n the same output growth as S I M 1 , but o n actual values of uc.
N o t surprisingly, S I M 2 does not depart substantially from S I M 1 until
the r u n up o f real interest rates around 1980. Whereas the shortfall of
S I M 2 as against S I M 1 indicates the direct contribution of the rise i n
capital costs to the change i n investment, the discrepancy between the
fitted A/c and S I M 2 must be attributed to the slowdown of output
g r o w t h . O u t p u t growth appears quantitatively to be the more i m portant factor for investment than the user cost of capital, which is i n
22
2 2
In 1991, the difference between the baseline solution SIM1 and SIM2 accounts for
44.5 per cent of the difference between SIM1 and the fitted values for Ak.
line with an overwhelming body of evidence i n the literature. It should
be kept i n m i n d , however, that output growth is not entirely an autonomous determinant of capital formation. Quite to the contrary, the
model of Section III precisely predicts that a real interest rate shock
may exert its contractionary effect o n the capital stock largely v i a an
induced contraction of aggregate output. T u r n i n g once more to F i g ure 3 (panel b) above, we recall that the assumed real interest rate
shock lowers the capital stock from K to K . A statistical decomposition as outlined i n this section w o u l d attribute most of the change i n
the capital stock to the change i n output - which falls from Y to Y$
and thus warrants a lower capital stock, given the initial capitallabour ratio. The change i n the user cost of capital, though it is the
ultimate source of the entire disinvestment process, w o u l d not be
credited but for the m i n o r movement to the new equilibrium capitallabour ratio along the Y isoquant. Thus, a statistical decomposition
based o n an equation such as (20) can at best provide a lower bound
for the fraction of the investment s l o w d o w n that is i n fact caused by
the sustained rise i n the real interest rate.
x
2
2
3
VI. Concluding Remarks
U n e m p l o y m e n t i n G e r m a n y , as elsewhere i n Europe, has increased
dramatically between the early 1970s and the late 1980s. In the 1970s,
the mainstream view blamed excessive wage pressure. T h i s view made
heavy use of the real wage gap measures which indicated that real
wages were running ahead of (trend) productivity. I n the 1980s, when
unemployment rose still higher while the real wage gap declined
rapidly, the mainstream view was that excessive wage pressure could
no longer be blamed [see G o r d o n , 1988; Paque, 1990]. O u r analysis i n
this paper has led us to two b r o a d conclusions: First, the real wage
gap, as usually measured, is of little use as a n indicator of excessive
wage pressure. Second, whereas the mainstream view of the 1970s
nevertheless seems to be correct, the mainstream view of the 1980s is
more dubious.
The basic argument underlying our first conclusion is very simple:
Since the real wage is an endogenous variable of the macroeconomic
system, j o i n t l y determined by wage-setting and labour demand behaviour, it cannot be expected to be related to employment i n any
stable way. Depending o n whether exogenous shocks affect the labour
market through the wage-setting schedule or through the labour dem a n d schedule, the real wage and the unemployment rate w i l l move
together or i n opposite directions. O u r explanation of why they moved
in opposite directions after the mid-1970s points to the role of the
slowing capital formation.
The n o t i o n that E u r o p e a n unemployment may be related to insufficient investment is not uncontroversial. It is dismissed out of hand by
G o r d o n [1988, p. 278] who cited the 87.6 per cent increase i n Europe's
capital-labour ratio from 1972 to 1986 as evidence of the contrary (for
Germany, the figure is 78.6 per cent). However, once the capitallabour ratio is adjusted for its trend, which w o u l d n o r m a l l y be expected to be increasing i n a growing economy, we find a rather steep
decline after 1975 (Figure 4 a, above). If the elasticity of substitution
between capital and labour lies below unity, as most estimates including our o w n imply, any reduction of the (trend-adjusted) capitallabour ratio must lower the wage share i n national income and the
(adjusted) real wage gap, which is what actually happened.
The pace of capital accumulation also plays a significant role i n the
theoretical framework underlying the " E u r o p e a n Unemployment
Project" described i n Dreze and Bean [1990a]. I n fact, the G e r m a n
contribution to the project [Entorf et al., 1990] presents empirical
results which give strong support to the notion that a lack of productive capacity limited employment growth i n G e r m a n y . T o be sure,
whereas their approach emphasizes rationing phenomena stemming
from demand and capacity constraints, we ignore such disequilibrium
mechanisms and instead adopt an equilibrium perspective i n which
the capital stock enters as a determinant of labour market equilibrium.
Whenever the wage-setting process exhibits real wage resistance, as
equation (12) of our model assumes, a d o w n w a r d shift of the labour
demand schedule due to a fall i n the (trend-adjusted) capital-labour
ratio inevitably translates into rising unemployment.
Since we d i d not estimate a wage-setting equation, we cannot say
how m u c h additional unemployment is i n fact explained by this mechanism. W h a t we can say, however, is this: The disappearance of the
G e r m a n real wage gap, though widely interpreted as evidence of
"wage moderation", is perfectly consistent with the view that the persistent high unemployment of the 1980s results from a failure of the
wage-setting process to adjust to a continued slowdown of feasible real
wage growth.
A referee raised the question whether the strong investment performance of West G e r m a n y i n 1990/91 and the concomitant moderate
rise i n our real wage gap measure might indicate a turnaround i n the
trend of the preceding decade. A t the time of writing, it is too early to
tell - a l l the more so as the 1990/91 unification b o o m was followed by
a deep recession. However, the events surrounding the G e r m a n unification demonstrate the force of our argument i n another, sad way.
T h e integration of a seriously undercapitalized economy meant an abrupt fall i n the capital-labour ratio for the Federal R e p u b l i c of G e r many as a whole. B u t wage-setters, striving for a quick elimination of
the East-West wage differential showed very little willingness to take
this fact into account. Thereby, they caused a new and presumably
persistent unemployment p r o b l e m affecting eastern G e r m a n y , i n particular.
Data Appendix
A l l data are taken from Vierteljahrliche Volkswirtschaftliche
Gesamtrechnung des Deutschen Instituts fur Wirtschaftsforschung
(DIW),
Berlin, except
- the n o m i n a l interest rate, w h i c h is the "Umlaufrendite festverzinslicher Wertpapiere" (Monatsberichte
der Deutschen
Bundesbank,
various issues),
- the capital stock, w h i c h is due to L i i d e k e [Liideke et a l . , 1989, p. 11].
- the user cost o f capital, w h i c h were calculated according to Jerger
[1993, pp. 197f.] using input series k i n d l y provided by Liideke.
The capital stock is broadly defined, encompassing capital goods
purchased by both the private and the public sector. A c c o r d i n g l y , the
user cost o f capital is calculated so as to cover the broad aggregate o f
gross fixed investment, t a k i n g into account the different real prices
and depreciation rates o f different investment categories.
In the measures o f >>—n and k—n (estimates o f (3') and (17)) y
refers to (the log of) gross national product and n to hours worked,
respectively.
T h e wage share (tVN/Y) (estimates o f (4') and (17)) is adjusted for
changes i n the share o f self employment (base period 1960:1) i n the
usual manner. See, for example, Sachverstandigenrat [1992, p. 261].
O u t p u t at n o r m a l capacity utilization, Y* has been calculated
according to Sachverstandigenrat [1992, p. 259].
The seasonal adjustment has been done w i t h E Z - X 1 1 , Version 2.00
o f Doan Associates, Evanston, I L ( U S A ) , which is a version o f Census
X - l 1 o f the US Bureau of Census.
9
References
Bean, Charles, "Capital Shortages and Persistent Unemployment". Economic Policy,
Vol. 8, 1989, pp. 12-53.
Bischoff, Charles, "The Effect of Alternative Lag Distributions". In: G . Fromm (Ed.),
Tax Incentives and Capital Spending. Washington, D . C . , 1971, pp. 61-125.
Blanchard, Olivier, "Unemployment: Getting the Questions Right - and Some of the
Answers". In: J. Dreze, C h . Bean (Eds.), Europe's Unemployment Problem. Cambridge, Mass., 1990, pp. 66-89.
-Stanley Fischer, Lectures on Macroeconomics. Cambridge, Mass., 1989.
Bruno, Michael, "Aggregate Supply and Demand Factors in O E C D Unemployment:
A n Update". Economica, Vol. 53, Supplement, 1986, pp. 35-52.
Jeffrey Sachs, The Economics of Worldwide Stagflation. Cambridge, Mass., 1985.
Burda, Michael, "Is There a Capital Shortage in Europe?". Weltmrtschaftliches Archiv,
Vol. 124, 1988, pp. 38-57.
Clark, Peter, "Investment in the 1970s: Theory, Performance, and Prediction". Brookings Papers on Economic Activity, Vol. 1, 1979, pp. 73-113.
Corker, Robert, Owen Evans, Lloyd Kenward, "Tax Policy and Business Investment
in the United States: Evidence from the 1980s". IMF Staff Papers, Vol. 36, 1989,
pp. 31-62.
iMckey, David, Wayne Fuller, "Distribution of the Estimators for Autoregressive Time
Series With a Unit Root". Journal of the American Statistical Association, Vol. 74,
1979, pp. 427-431.
"The Likelihood Ratio Statistic for Autoregressive Time Series With a Unit
Root". Econometrica, Vol.49, 1981, pp. 1057-1072.
Dreze, Jacques, Charles Bean (Eds.) [1990a], Europe's Unemployment Problem, Cambridge, Mass., 1990.
- - [1990b], "Europe's Unemployment Problem: Introduction and Synthesis". In: J.
Dreze and C h . Bean (Eds.), Europe's Unemployment Problem. Cambridge, Mass.,
1990, pp. 1-65.
Engle, Robert, Clive Granger, "Co-Integration and Error Correction: Representation,
Estimation, and Testing". Econometrica, Vol. 55, 1987, pp. 251-276.
Entorf, Horst, Wolfgang Franz, Heinz Konig, Werner Smolny, "The Development of
German Employment and Unemployment: Estimation and Simulation of a Small
Macro Model". In: J. Dreze, C h . Bean (Eds.), Europe's Unemployment Problem.
Cambridge, Mass., 1990, pp. 239-287.
Fitoussi, Jean-Paul, Edmund Phelps, The Slump in Europe. Oxford, 1988.
Franz, Wolfgang, "Hysteresis, Persistence, and the N A I R U : A n Empirical Analysis for
the Federal Republic of Germany". In: R. Layard, L . Calmfors (Eds.), The Fight
Against Unemployment. Cambridge, 1987, pp. 91-122.
Gordon, Robert, "Back to the Future: European Unemployment Today Viewed from
America in 1939". Brookings Papers on Economic Activity, Vol. 1,1988, pp. 271-304.
Hellwig, Martin, Manfred Neumann, "Economic Policy in Germany: Was There a
Turnaround?". Economic Policy, Vol. 5, 1987, pp. 105-145.
Jerger, Jurgen, Beschdftigung und Kapitalbildung. Freiburg, 1993.
Kmenta, Jan, " A n Estimation of the C E S Production Function". International Economic Review, Vol. 8, 1967, pp. 180-189.
Krugman, Paul, "Slow Growth in Europe: Conceptual Issues". In: R. Lawrence, Ch.
Schultze (Eds.), Barriers to European Growth. Washington, D.C., 1987, pp. 48-76.
Landmann, Oliver, Jurgen Jerger, "Domestic and Foreign Shocks to Employment and
Capital Accumulation in Germany". In: H . Frisch, A . Worgotter (Eds.), Open-Economy Macroeconomics. Houndmills, 1993, pp. 186-202.
Lawrence, Robert, Charles Schultze (Eds.), Barriers to European Growth. Washington,
D.C., 1987.
Layard, Richard, Charles Bean, "Why Does Unemployment Persist?". The Scandinavian Journal of Economics, Vol. 91, 1989, pp. 371 -396.
Lindbeck, Assar, "Macroeconomic Theory and the Labor Market". European Economic Review, Vol. 36, 1992, pp. 209-235.
Liideke, Dietrich, Wolfgang Hummel, Thomas Rudel, Das Freiburger Modell. Heidelberg, 1989.
Maddala, G.S., Econometrics. New York, 1977.
McCallum, John, "Wage Gaps, Factor Shares and Real Wages". The Scandinavian
Journal of Economics, Vol. 87, 1985, pp. 436-459.
OECD, Economic Surveys - Germany; 1987/88. Paris, 1988.
Paque, Karl-Heinz, Unemployment in West Germany - A Survey of Explanations and
Policy Options. Kiel Working Paper, N o . 407. Kiel, 1990.
Phillips, Peter, "Understanding Spurious Regressions in Econometrics". Journal of
Econometrics, Vol. 33, 1986, pp. 311-340.
- , "Time Series Regressions With A Unit Root". Econometrica, Vol. 55,1987, pp. 277301.
Pierre Perron, "Testing for a Unit Root in Time Series Regressions". Biometrika,
Vol. 75, 1988, pp. 335-346.
Sachs, Jeffrey, "Real Wages and Unemployment in the O E C D Countries". Brookings
Papers on Economic Activity, Vol. 1, 1983, pp. 255-289.
Sachverstandigenrat zur Begutachtung der gesamtwirtschaftlichen Entwicklung, Fur
Wachstumsorientierung - Gegen lahmenden Verteilungsstreit. Stuttgart, 1992.
Sargan, J. Denis, Alok Bhargava, "Testing Residuals from Least Squares Regressions
for Being Generated by the Gaussian Random Walk". Econometrica, Vol. 51, 1983,
pp. 153-174.
Schultze, Charles, "Real Wages, Real Wage Aspirations, and Unemployment in
Europe". In: R . Lawrence, C h . Schultze (Eds.), Barriers to European Growth. Washington, D.C., 1987, pp. 230-302.
Stock, James, "Asymptotic Properties of Least Squares Estimators of Co-Integrating
Vectors". Econometrica, Vol. 55, 1987, pp. 1035-1056.
- , Mark Watson, "Testing for Common Trends". Journal of the American Statistical
Association, Vol. 83, 1988, pp. 1097-1107.
***
A b s t r a c t : Unemployment and the Real Wage Gap: A Reappraisal of the German Experience. - The major European economies experienced a rise in unemployment
since the late 1970s. A t the same time, the real wage gap, a widely used measure of wage
pressure, declined. This paper develops an analytical framework that relates the two
phenomena. Particular emphasis is placed on the interaction of capital accumulation,
wage setting and labour demand. The model is applied to the particular case of Germany and found to be consistent with the observed behaviour of wages, investment,
output and employment.
*
Z u s a m m e n f a s s u n g : Arbeitslosigkeit und die Reallohnlucke. Eine Oberpriifung der deutschen Erfahrung. - Die wichtigsten europaischen Volkswirtschaften erlebten seit den spaten siebziger Jahren einen Anstieg der Arbeitslosigkeit. Gleichzeitig ging
die Reallohnlucke, die weithin als MaB fur den Lohndruck benutzt wird, zuriick. Die
Verfasser entwickeln einen analy tischen Rahmen, der diese beiden Phanomene zueinander in Beziehung setzt. Besonderen Wert legen sie auf das Zusammenwirken von Kapitalbildung, Lohnfestsetzung und Nachfrage nach Arbeit. Sie wenden das Modell auf
den Fall Deutschland an und zeigen, dafi es mit dem beobachteten Verlauf von Lohnen,
Investitionen, Produktion und Beschaftigung konsistent ist.


© Copyright 2026